CDF Graph Window
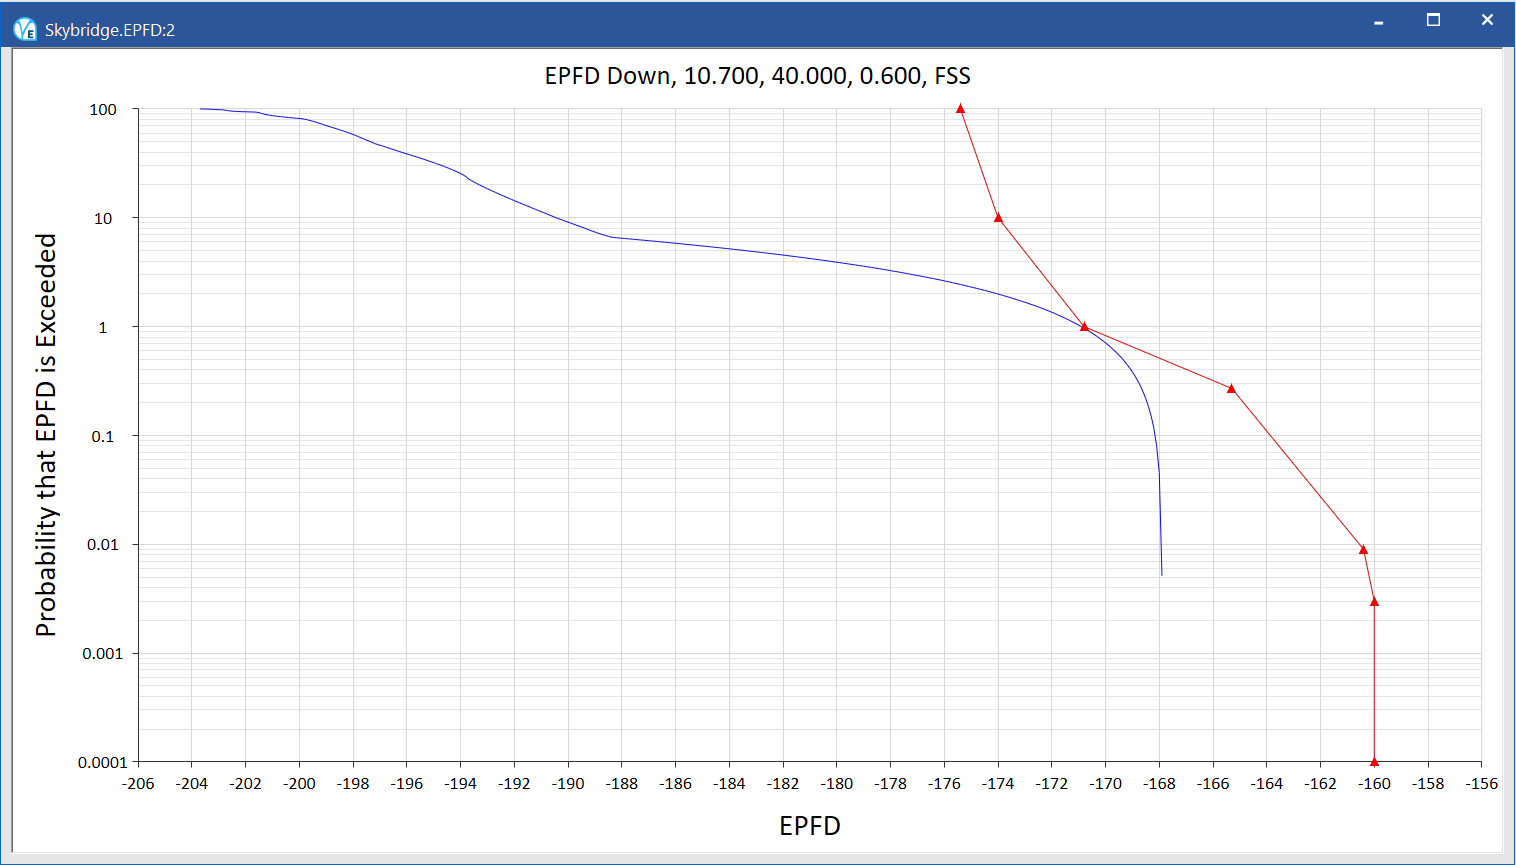
The CDF graph shows the cumulative probability distribution of EPFD for the selected run. This is shown in graphical form with the EPFD limit curve superimposed.

To Show or Hide the CDF Graph Window
Select CDF Graph from the View menu or click the CDF Graph button on the tool bar.

A system whose CDF lies to the left of the EPFD limit curve at all points, passes the test. If any part of the CDF lies to the right of the EPFD limit curve, the nonGSO system fails the test. The further the CDF is to the right of the EPFD limit curve, the larger the margin of the failure.
Accessing CDF Data
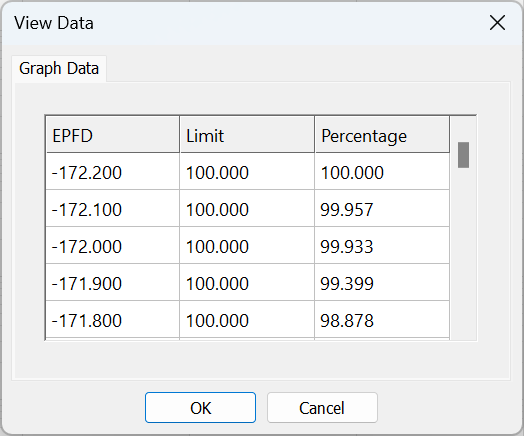
You can access the raw data for the CDF by right clicking in the CDF window, and clicking Graph Data.

The EPFD column shows the EPFD bin. The Limit column shows the point on the limit curve for the given EPFD and the Percentage column shows the point on the CDF curve for the given EPFD.
The rows in bold type represent limit points which define the limit curve as listed in the relevant articles of the RR.
Copying data to other applications
If you want to copy any data to another application, simply select the data you want, hold down the Control key on the keyboard the press the C key. This will copy the data to the clipboard so that it can be pasted into other applications.
To select all the data in a column, click on the column title. To select multiple columns, click and hold on the first column title then drag to include other columns in the selection.