Earth station coordination
This section contains the following examples:
Coordination Contours
| Action: | Export to Google Earth |
| Modules used: | IDWM |
| Terrain regions: | None |
| Frequency band: | Ku |
| Station types: | GSO Satellite, Earth Stations, Fixed Station |
| Propagation models: | Free space, ITU-R Rec.P.618, RR Appendix 7 Mode 1 |
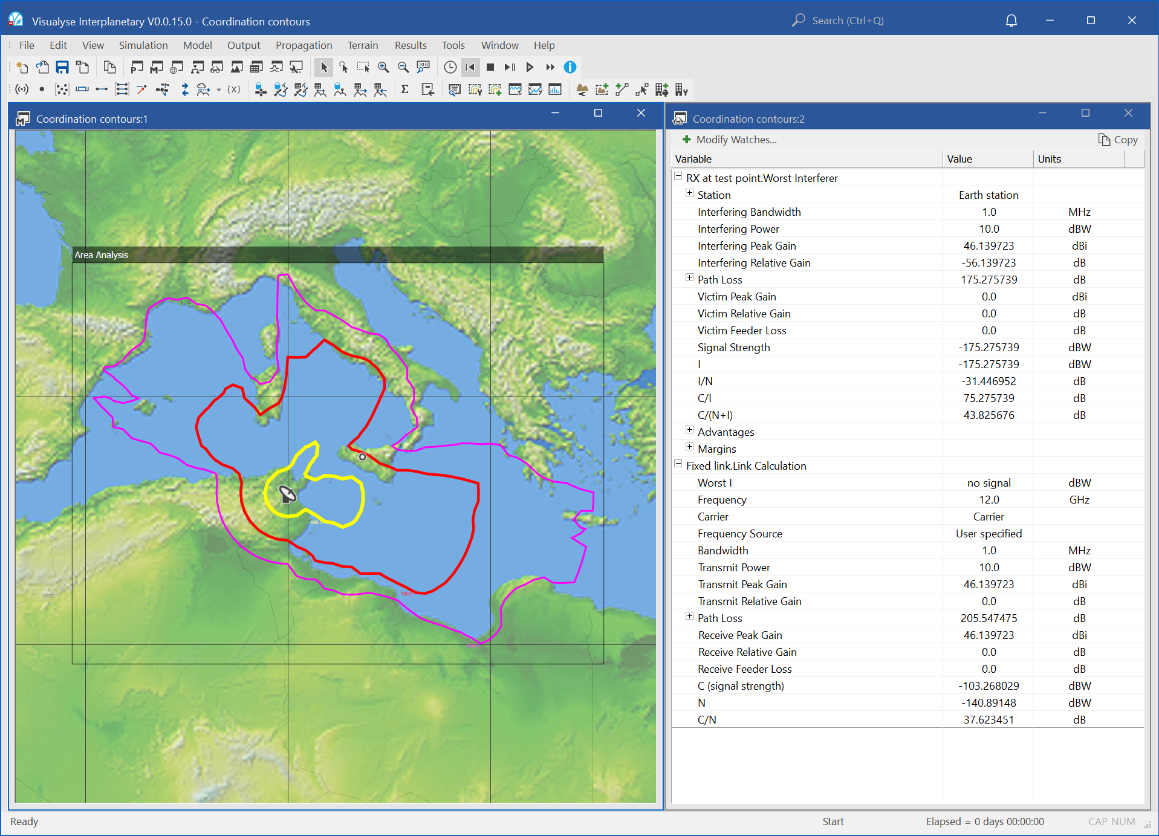
This example shows Visualyse Interplanetary calculating the coordination contour around a satellite Earth Station.
The Earth Station is in Tunisia and is communicating with a GSO satellite at 23° East with an EIRP of 56 dBW. This might require coordination with the networks of other countries, and the starting point is derivation of the coordination contour.
In this simplified example we calculate the total of the EIRP plus path loss using the propagation model in Appendix 7 of the Radio Regulations. The Mode 1 of this propagation model has been selected (propagation along great circles), configured for 0.01% of the time. The various zones the path crosses (sea, coastal, inland etc.) are extracted from the IDWM database.
Note: If you don’t have access to IDWM you might see a slightly different contour.
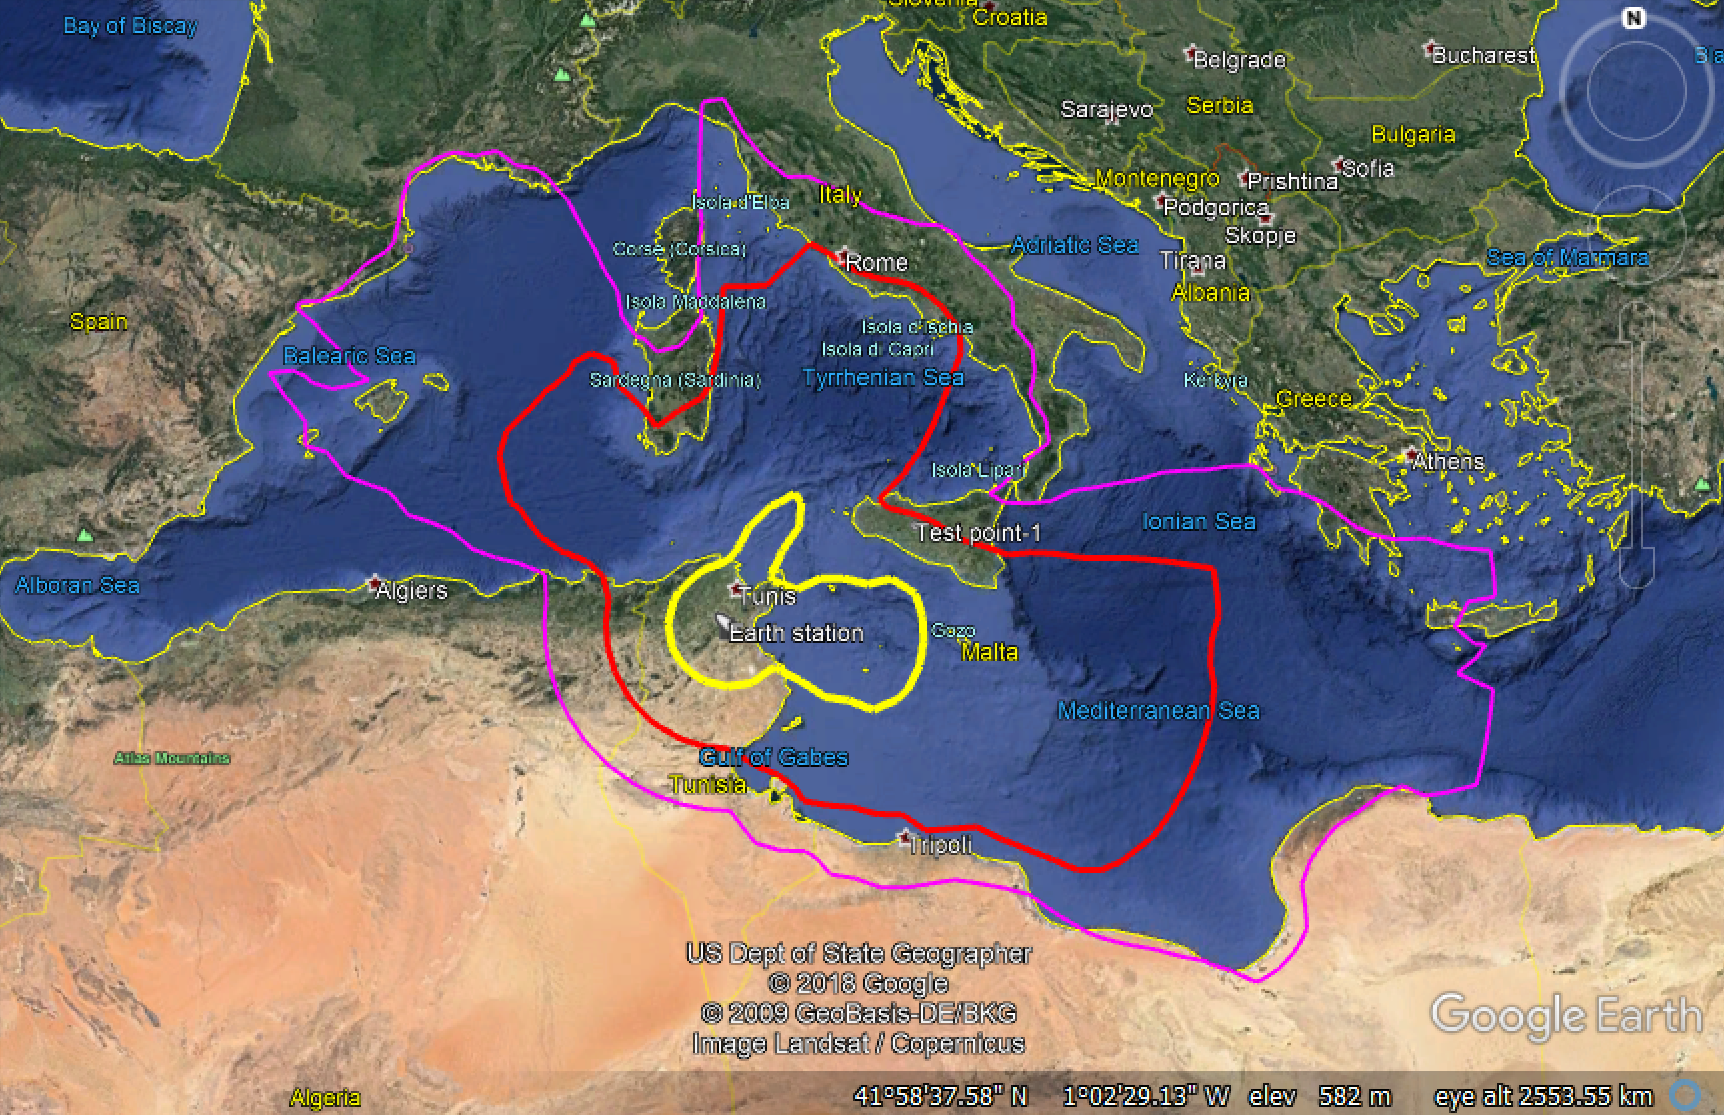
Three contours are given for the -160, -180, and -200 dBW as received at a test point with isotropic 0 dBi gain.
Two windows are open:
- Mercator view (left) showing the location of the Earth Station and a test point, and the coordination contours
- Watch window (right) showing the link budget of the interfering signal from the Earth Station to the test point and the wanted signal on the uplink to the satellite
Note these coordination contours can be exported into Google Earth1 by selecting menu option “File | Export to KMZ”. This should produce a figure something like this:
WiMAX to ES EZ
| Action: | Export to Google Earth |
| Modules used: | Terrain, IDWM |
| Terrain regions: | Sydney SRTM90 |
| Frequency band: | C |
| Station types: | GSO Satellite, Earth Stations, Fixed Station |
| Propagation models: | ITU-R Rec.P.452 |
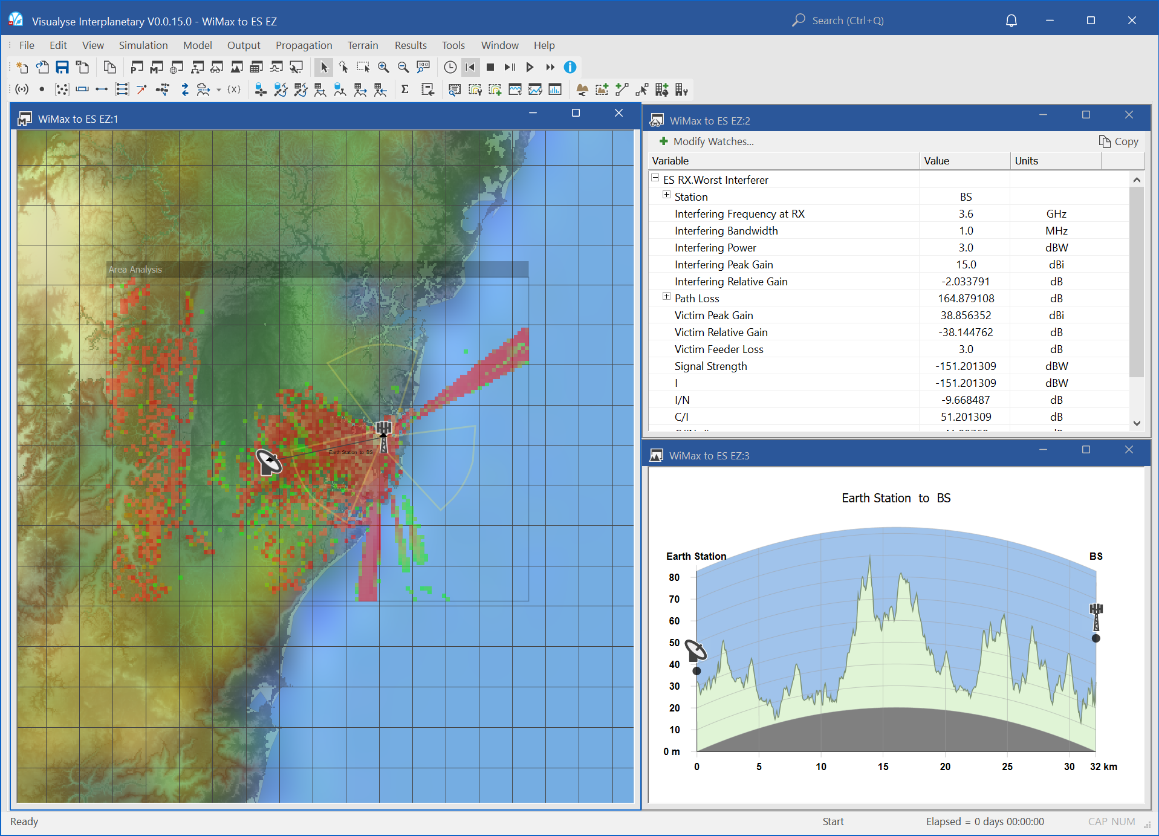
This simulation shows Visualyse Interplanetary deriving the area around a WiMAX base station where it would not be possible to deploy an Earth station receiving in C-band.
It is based upon analysis relating to Agenda Item 1.4 as discussed at the WRC in November 2007. More information about this example is given in the associated “Visualyse Interplanetary Tutorial Document”.
The WiMAX base station has been deployed near Sydney with 3 sectors and with power of 43 dBm within 10 MHz carrier. The C Earth station uses a 3m dish pointing at a satellite at 150°E. The interference is calculated taking into account the terrain using the propagation model in ITU-R Rec.P.452.
The simulation can be used in two ways:
- Static analysis: the link budget shows the contributions of the interfering link budget and hence could be used for detailed coordination between a WiMAX network and a specific Earth station
- Exclusion zone analysis: using the Area Analysis, the locations where an Earth Station would suffer interference are identified and the level of interference at that point used to select the colour to fill in that pixel.
The screen shot above shows three windows open, namely:
- Mercator view (left) showing the terrain, coastlines, sea, locations of WiMAX base station and earth station, the base station sectors, and the overlaid Area Analysis showing by colour the interference an Earth station would experience at each point.
- Watch window (top right) showing the interfering link budget from the WiMAX base station to the test location of the Earth station shown on the map
- Path Profile (bottom right) showing the characteristics of the terrain between the Earth station and the base station
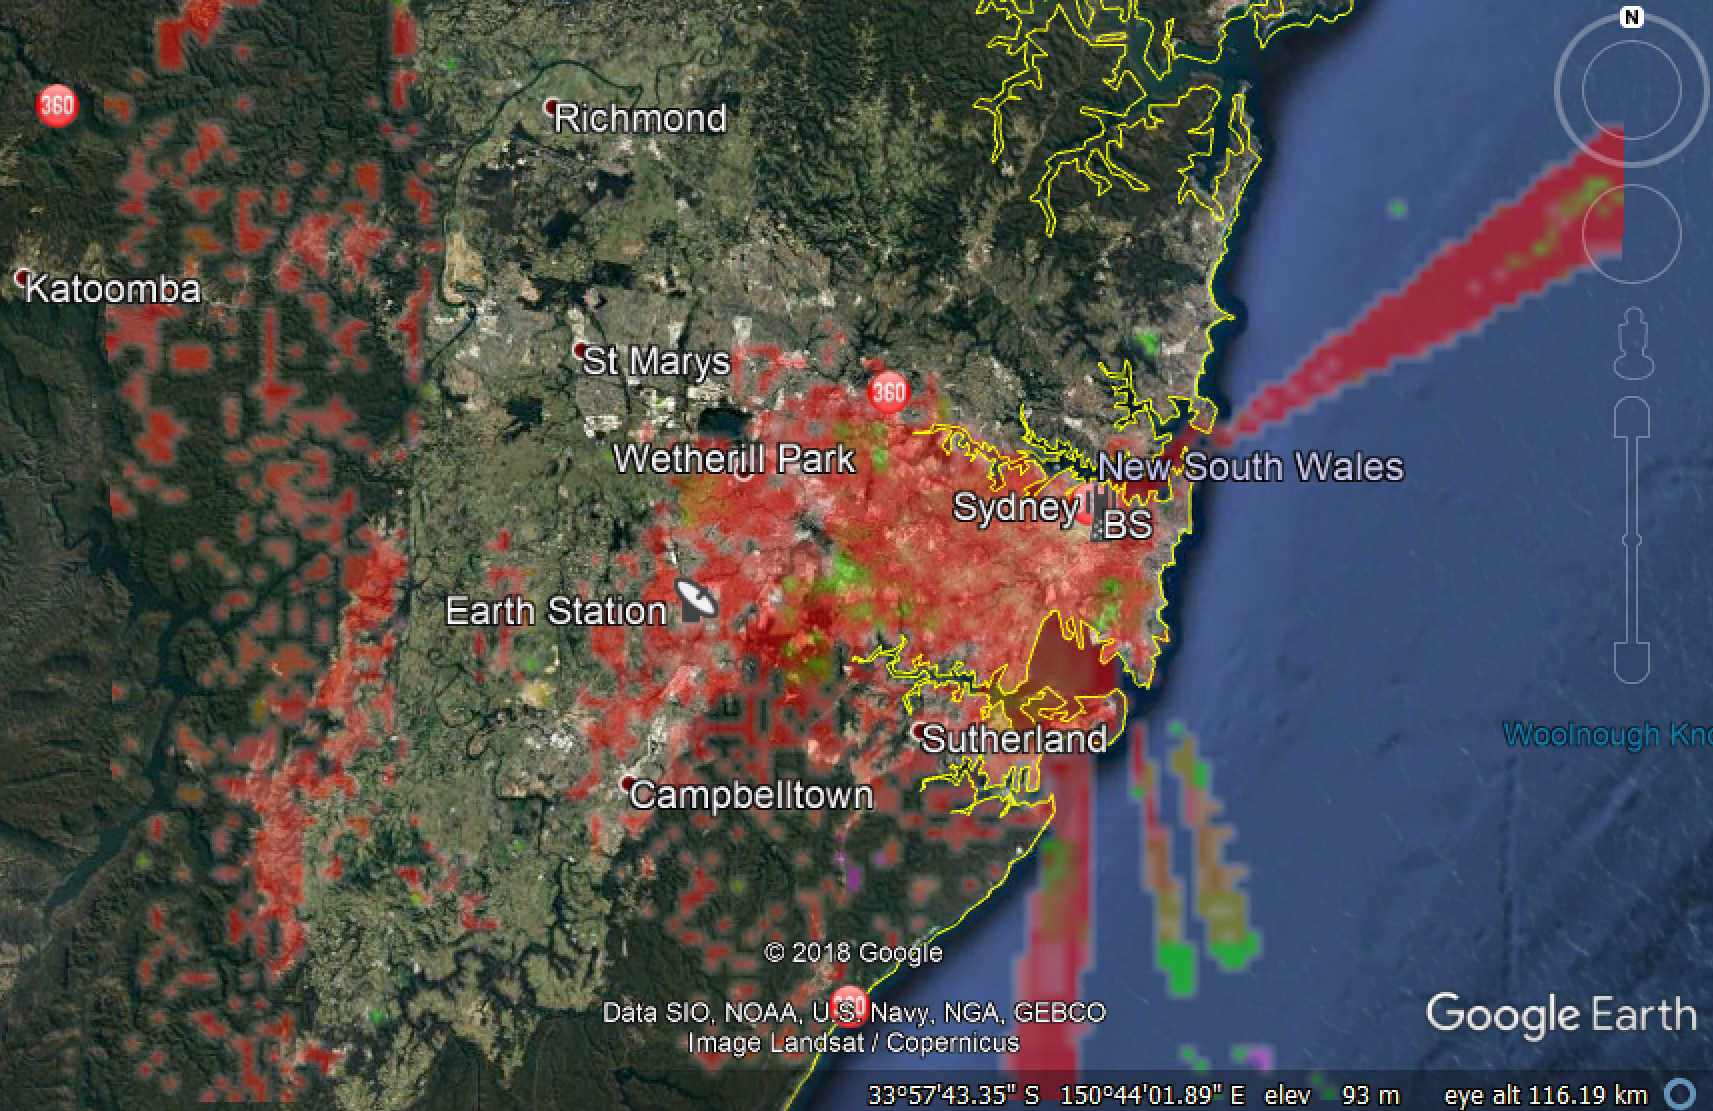
Additional geographical features can be observed by exporting the simulation including Area Analysis to Google Earth, as in the figure below.
Little LEO gateways into FS
| Action: | Run Simulation |
| Modules used: | Terrain |
| Terrain regions: | Washington Area |
| Frequency band: | L |
| Station types: | GSO Satellite, Earth Stations, Fixed Station |
| Propagation models: | Free space, ITU-R Rec.P.618, ITU-R Rec.P.452 |
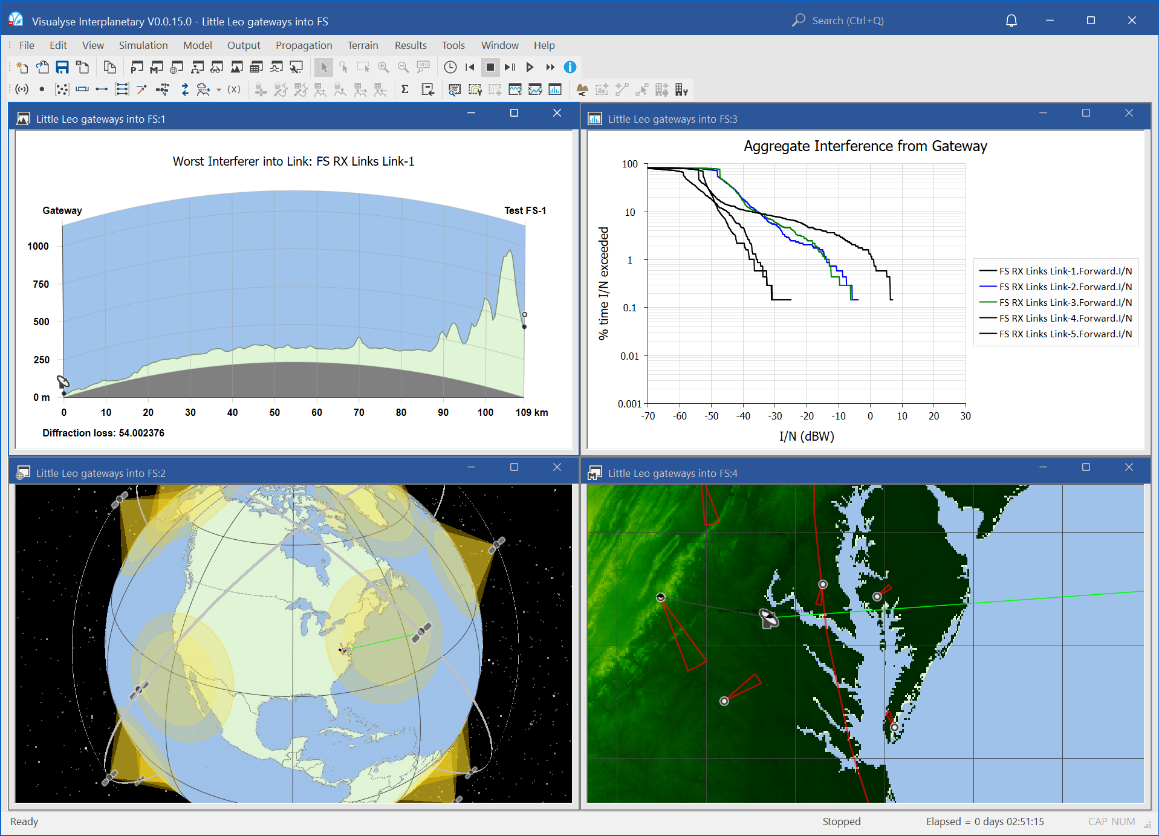
This example shows Visualyse Interplanetary supporting the coordination of the gateway for a non-Geostationary satellite network with a number of nearby point to point fixed links. These could have been entered directly, read in using the FS import tool, or via the interface to the ITU’s terrestrial IFIC.
The non-GSO network is assumed to be providing store and forward messaging services – these are known as “Little LEOs” due to the lower capacity than the voice and high-speed data of the “Big LEOs”.
In this simulation, the gateway Earth Stations are uplink in L-band, co-frequency with a number of fixed service links. Interference at each of the FS receivers will vary depending upon:
- Gain of the gateway antenna (modelled using a Bessel function – real measured data could also be used) towards the FS link
- Path length and topography between the gateway and the FS receiver using a terrain database
- Change in atmospheric conditions using the propagation model in ITU-R Rec.P.452
Hence the interference, measured as the I/N, will vary in time and it is necessary to run a simulation to work out the probability that various thresholds are met.
The screen shot above shows four windows open:
- Mercator view (top left), showing the locations of the gateway and fixed service receivers, the direction of their azimuth, colour coding of terrain heights, and overlaid map (this might not be available on all installation)
- 3D view (bottom left), showing the satellites in the non-GSO constellation, their beams, the links, space tracks, gateway and terrestrial fixed stations
- Terrain path profile (top right), showing the slice of terrain between the gateway and one of the fixed service receivers
- Statistics graph (bottom right), showing the cumulative distribution function of the I/N at each of the FS receivers.
-
At time of writing this document, Google Earth could be downloaded from: http://earth.google.com/ ↩