Additional Analysis
This section gives a flavour of the additional analysis that could be done from the files generated without going through the details step by step.
Site Specific Coordination
As well as helping to identify general problems and sharing constraints, Visualyse Interplanetary is also well suited to allowing you to investigate site specific coordination problems.
The figure below shows three useful views
- The map view – explicitly showing the sectored coverage of the WiMAX base station
- The interference link budget to the WiMAX base station
- The terrain profile along the interference path.
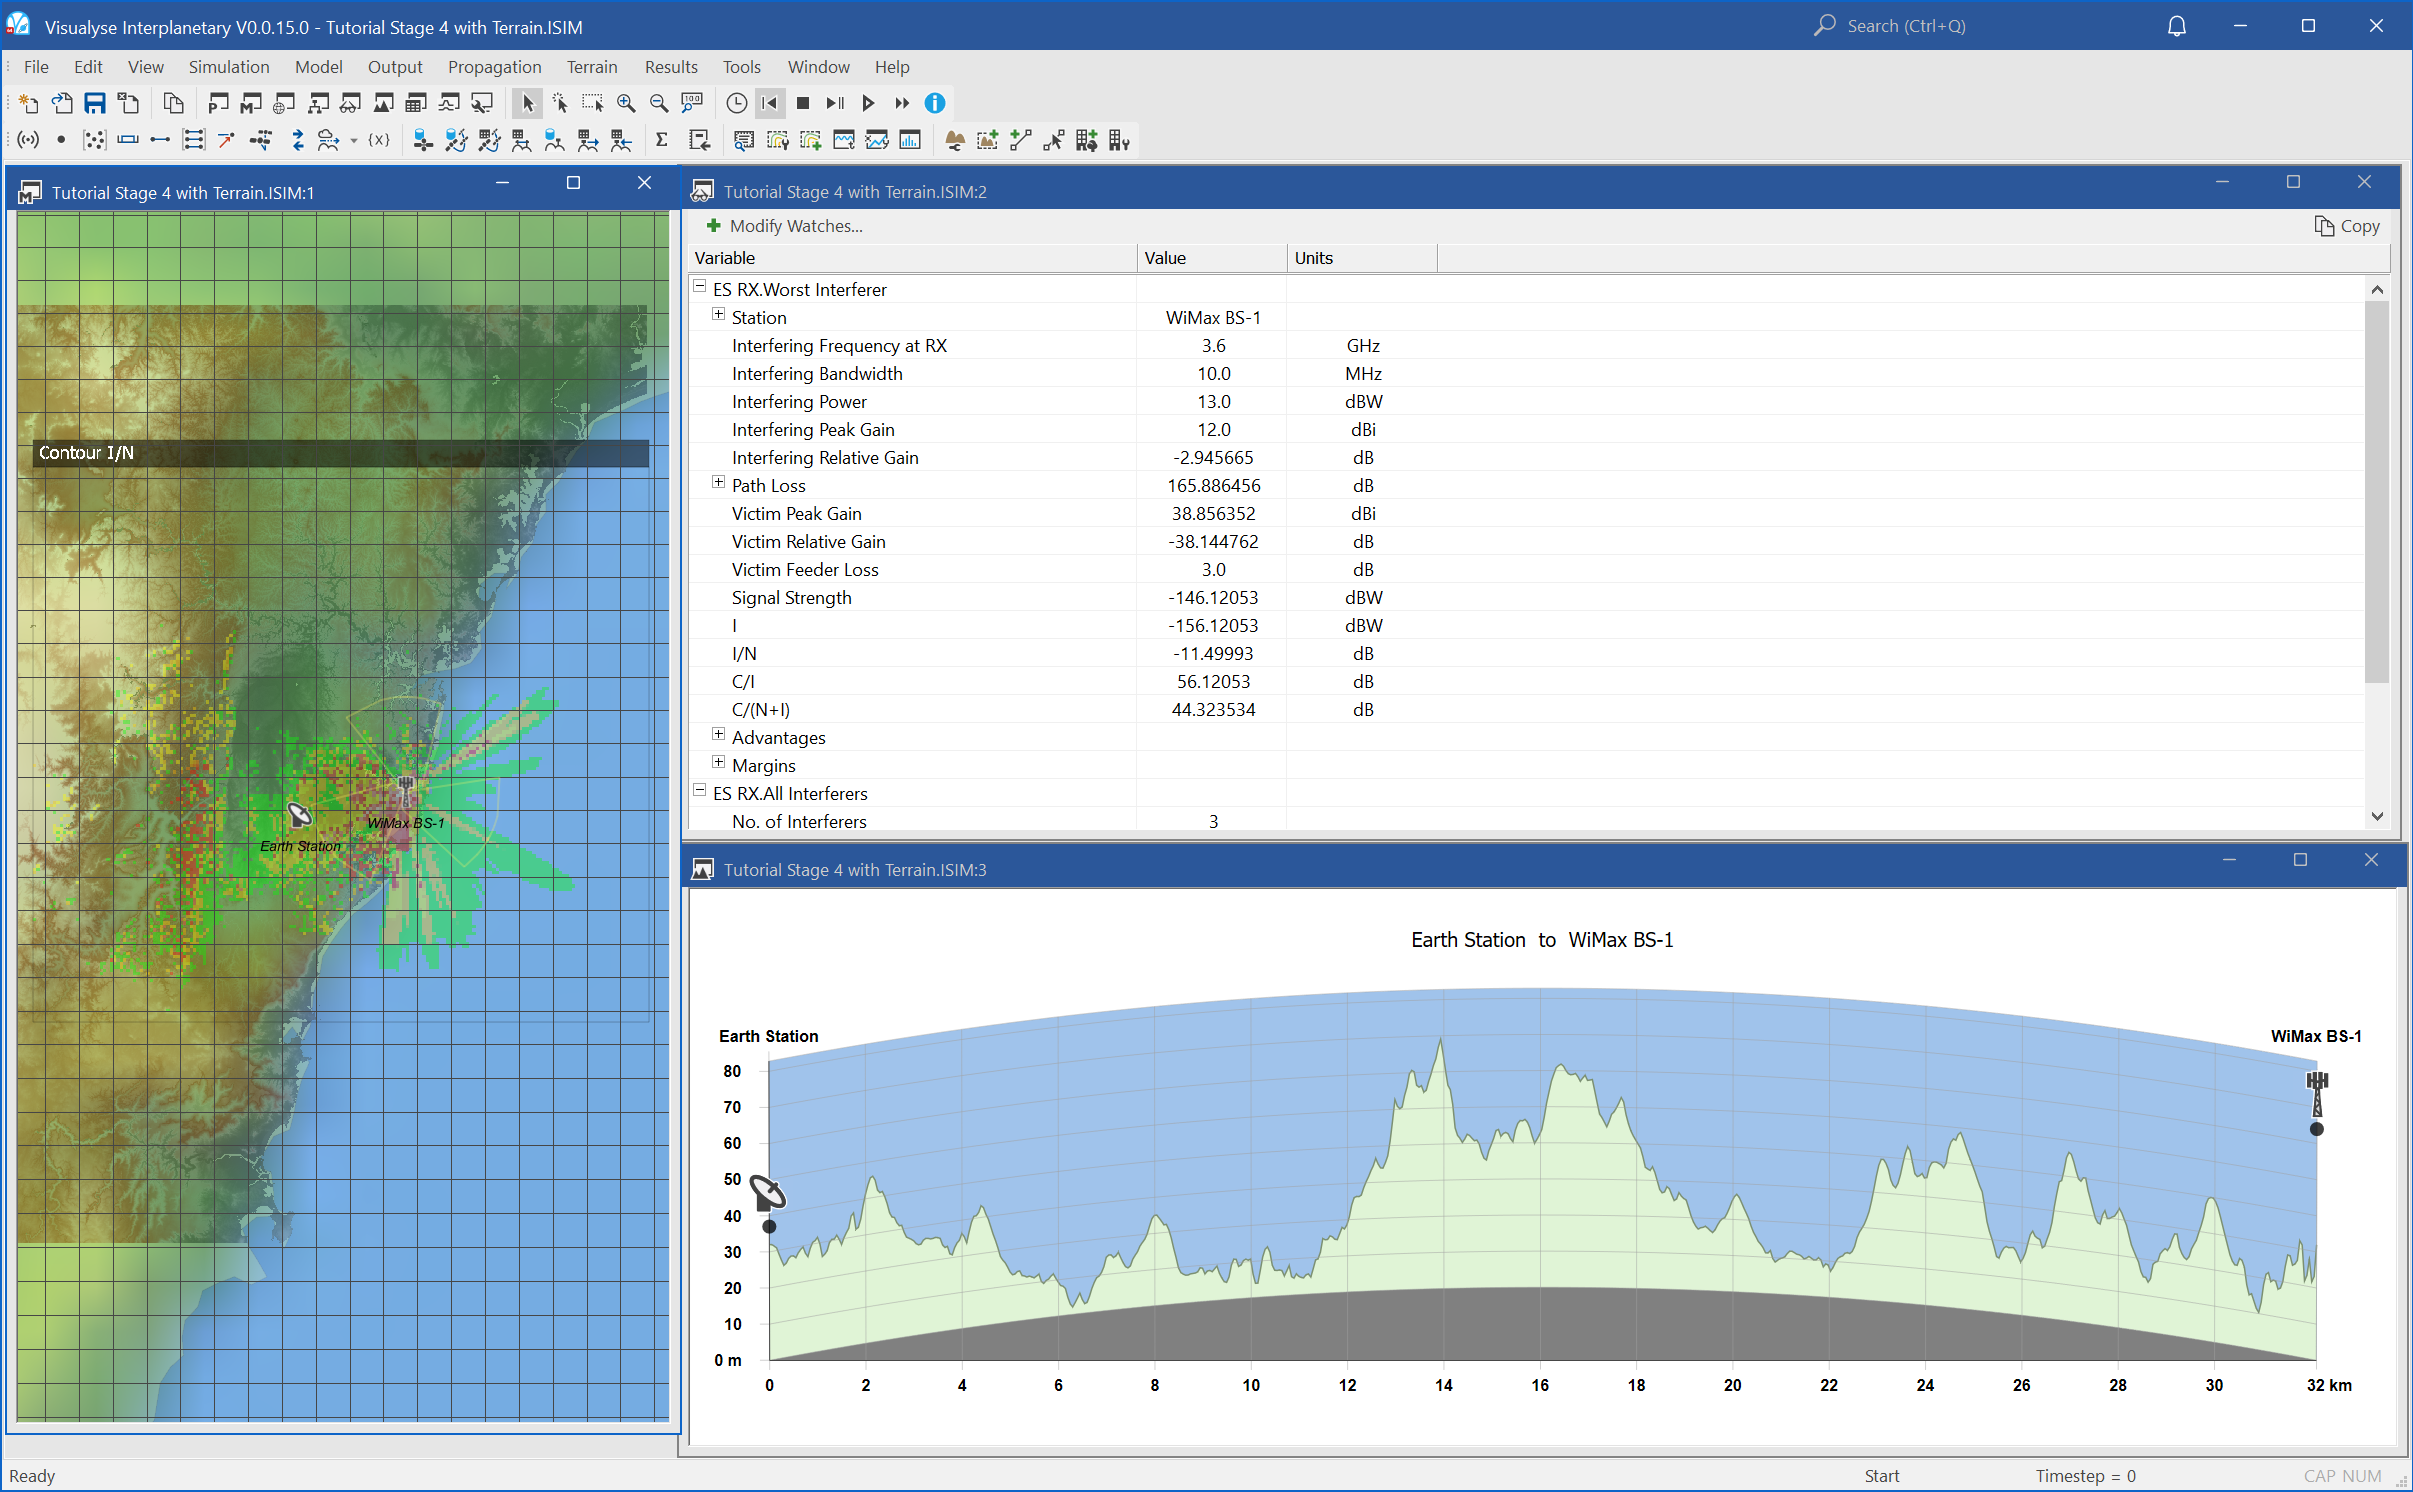
Visualyse is the ideal tool for What If? analysis – allowing you to see the impact of varying key parameters.
In this case, we could think of the following mitigation options which can be assessed easily in Visualyse.
- Move ES
- Move BS
- BS antenna downtilt
- BS antenna pointing
- BS power reduction
- ES site shielding
- Increase ES dish size
- Take account of terrain
- Reduce satellite link availability requirement or increase the permitted interference level
- Include the effect of power control by undertaking Monte Carlo analysis that convolves its effect with the variation in propagation
Question: what others could be used?
Analysis of Coverage of a WiMAX Network
In this part of the exercise we need to know three key parameters
- Density and extent of deployment of base stations
- EIRP of base stations
- Coverage requirement (in terms of received power threshold or something else)
Ref 1 gives parameters of a typical network as having 19 three-sector cells with a BS-BS distance of 2.8 km.
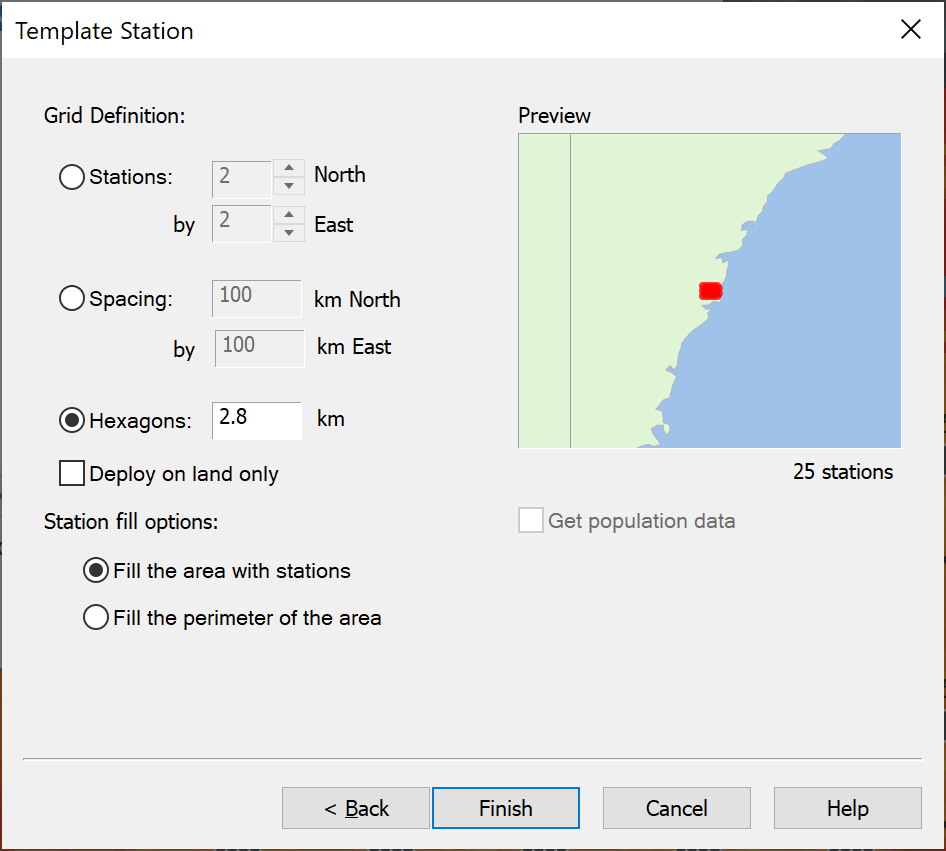
In the Visualyse Interplanetary Grid Service Area wizard you can directly input the station to station distance for a regular hexagon grid. Hence with not too much effort you can set the geographic extent of the grid such that you have 20 stations separated by exactly 2.8 km on a regular hexagonal grid.
Rename the existing WiMAX base station as “Ref WiMax BS”. Then create a Station Group using the Service Area Wizard and with this base station as the template.
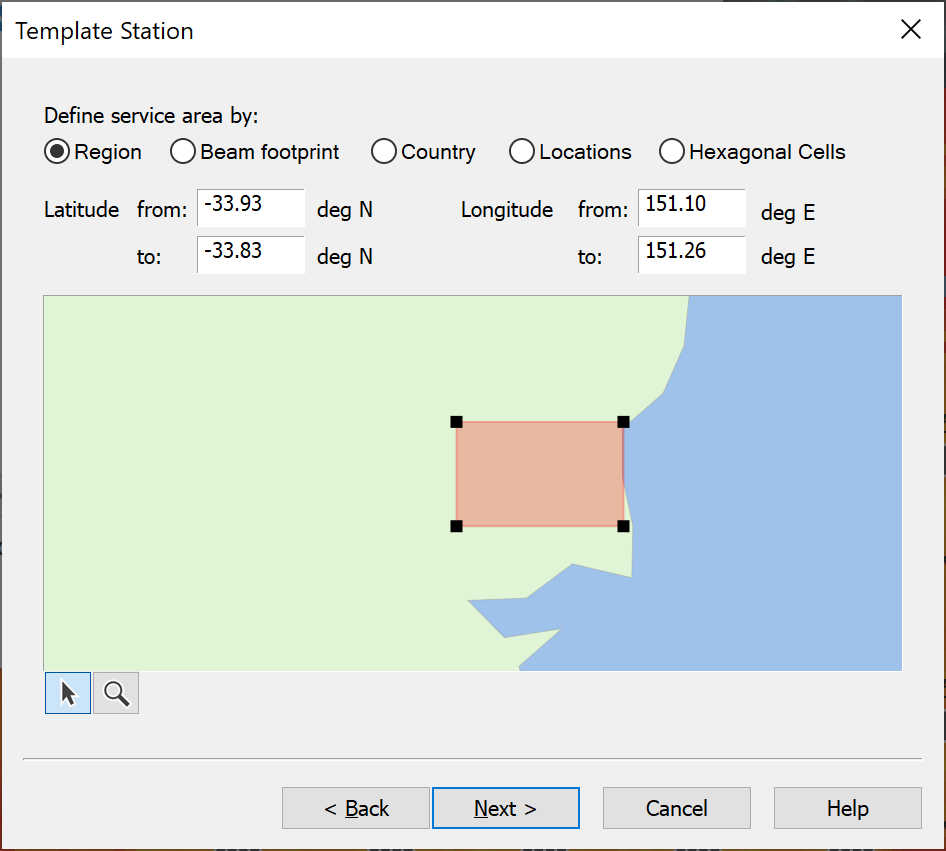
On the following page, enter the following latitude and longitude range:
| Max | Min | |
|---|---|---|
| Latitude | -33.83 | -33.93 |
| Longitude | +151.26 | +151.10 |
The Service Area Wizard stages are shown below:
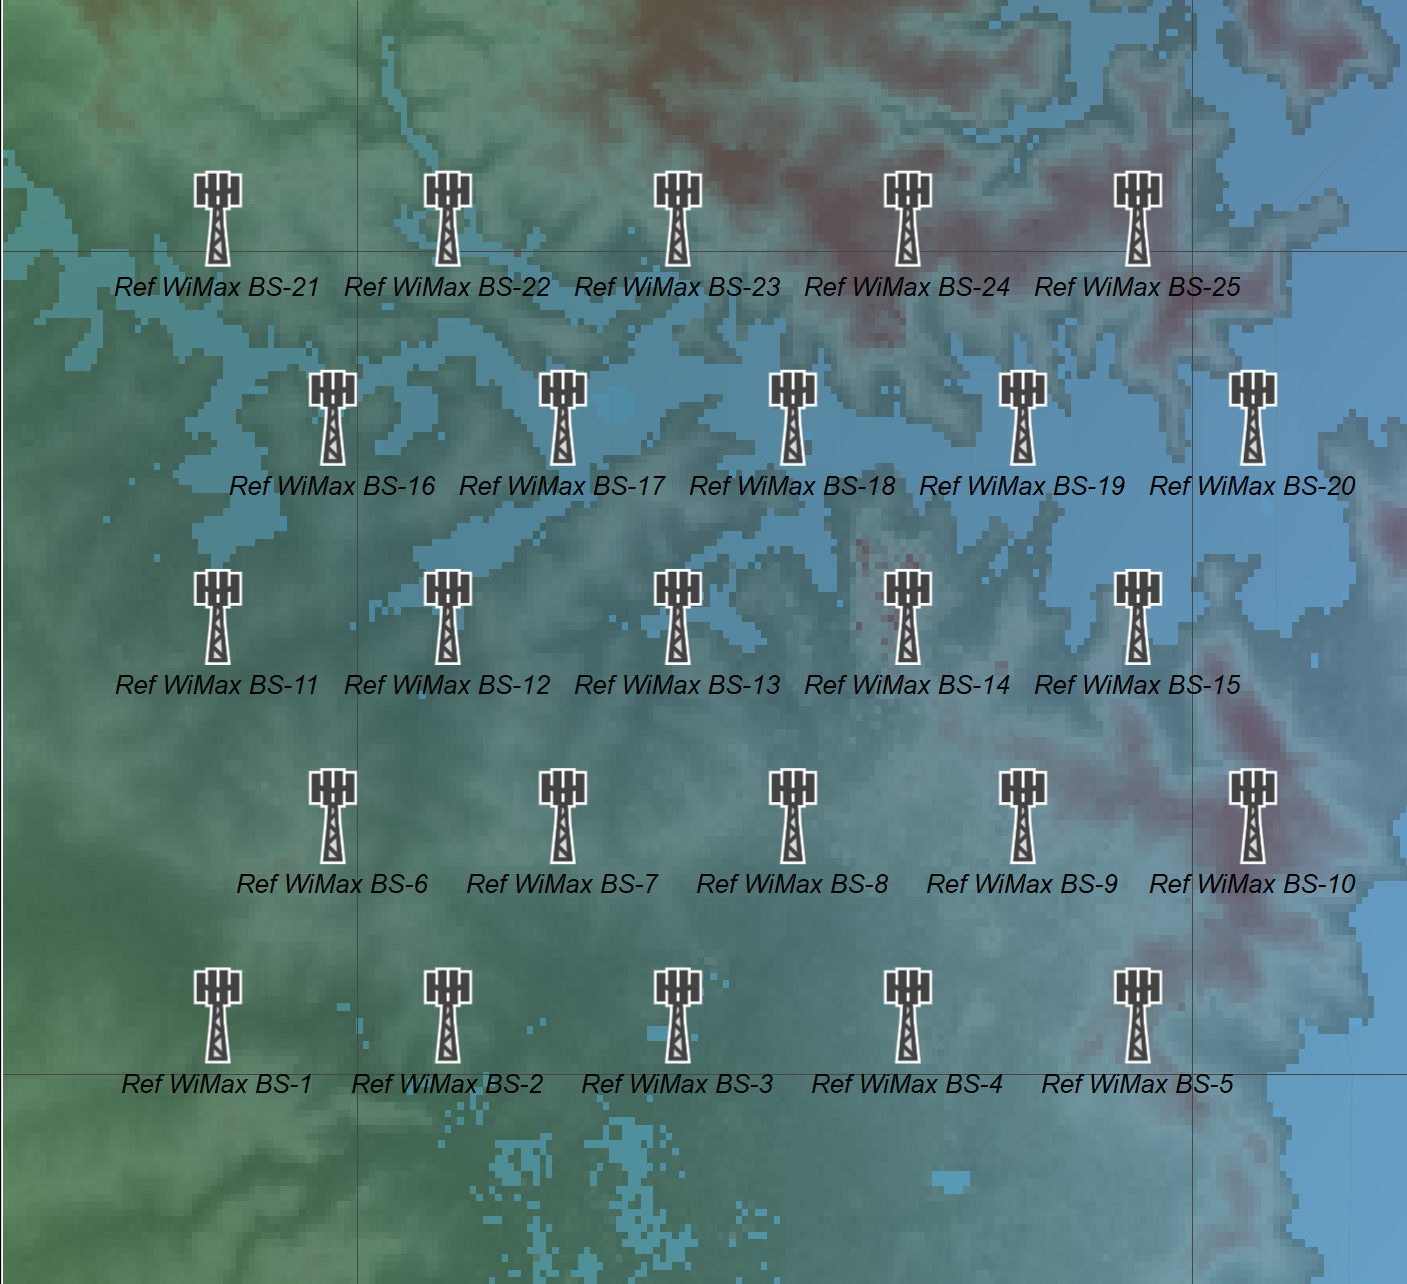
Once you have created a group of stations representing your WiMAX network, and added terrain data, you should have a window that looks something like this
The next stage is to consider whether this network will provide reasonable coverage for mobile WiMAX, and so we need to know what the network design aim is.
Section 5 of reference one gives us example link budgets, from which we can derive the required signal level or SNR. It also gives a simpler measure i.e. maximum allowable path loss to the cell edge.
A figure of -128.2 dBW is given as the requirement for downlink data rates of 5.76 Mbps and uplink rates of 115 Kbps – so let’s use this figure. In addition, we added 25 dB to model loss due to clutter and indoor – outdoor propagation.
Therefore, the necessary steps are:
- Create a mobile station as a test point at height 1.5m with isotropic antenna of 0 dB gain
- Modify the receive link to use this mobile station and the WiMAX carrier (instead of the earth station and 1 MHz carrier)
- Modify the transmit link to use the group with all the WiMAX base stations (rather than the single reference base station)
- Modify the propagation environment for terrestrial mobile systems to have an additional loss of 25 dB
- Create an area analysis covering the locations of the base stations with resolution 0.2 km and block plot colour threshold of -128.2 dBW.
Using the Area Analysis tool to plot received signal at an isotropic antenna it is possible to show the coverage that looks something like this.
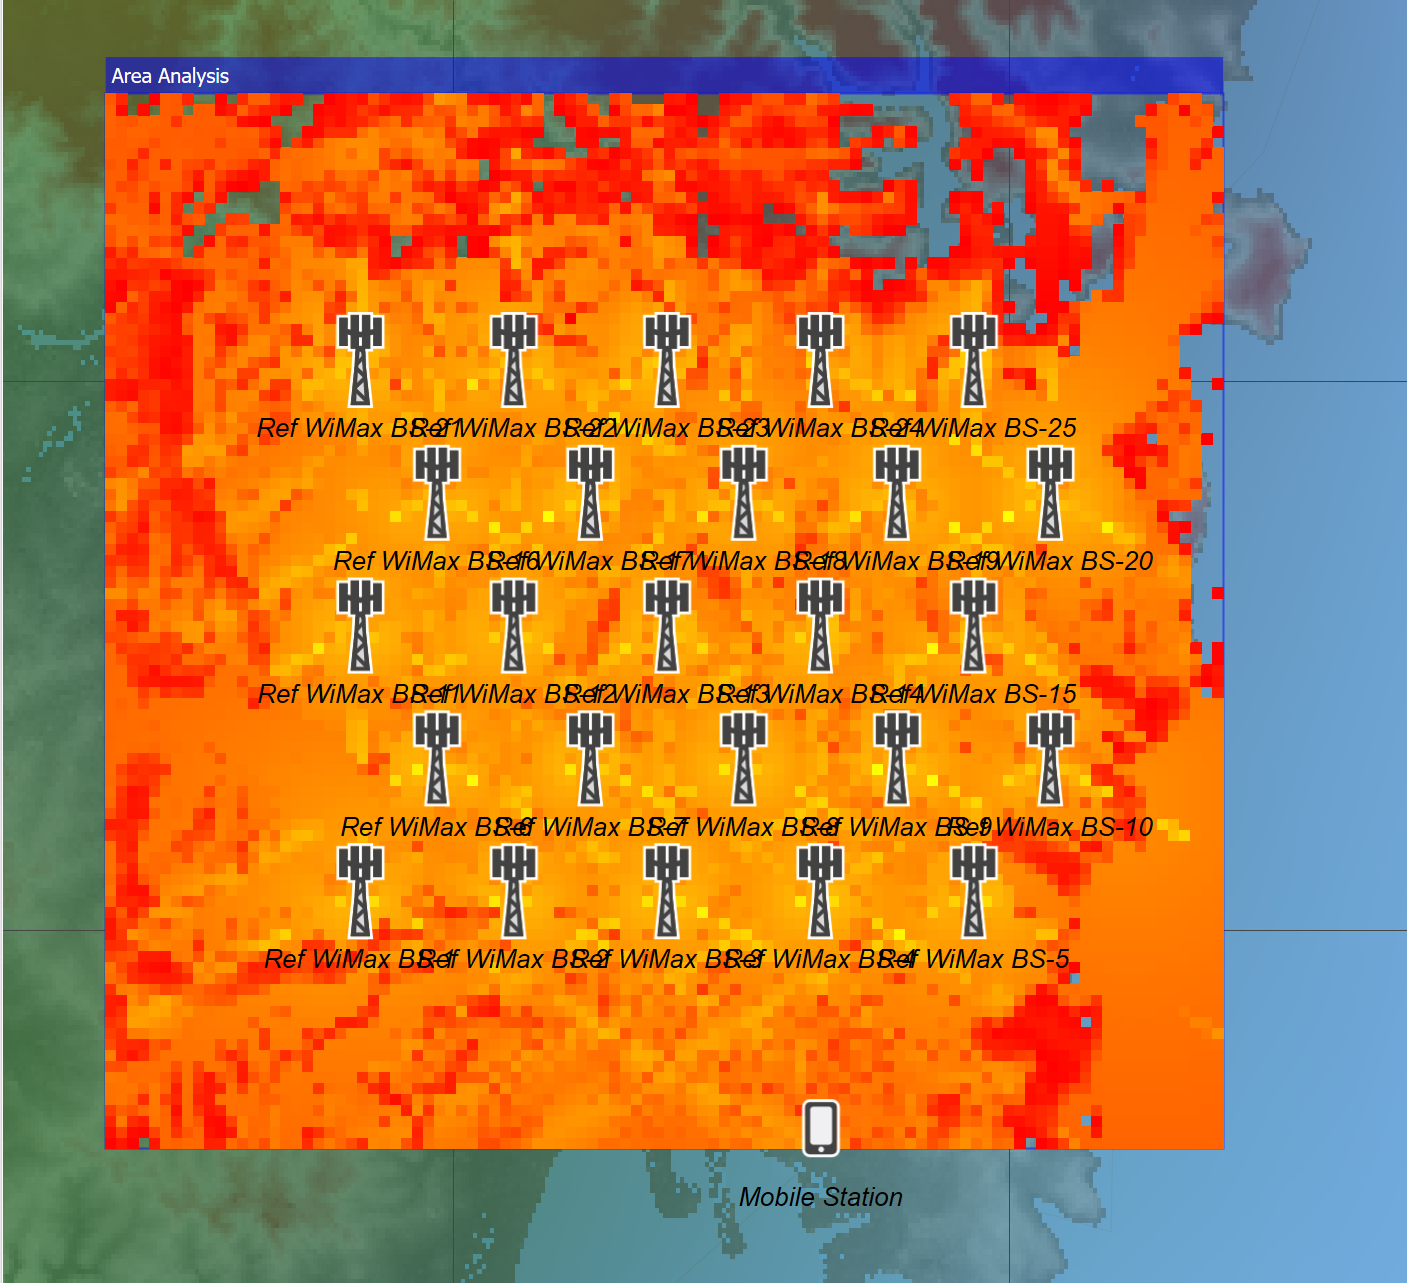
Note it is very hard to get uniform signal coverage when terrain is involved! However, in this case there is good coverage apart from a few holes. Again, this would benefit from overlay of maps if available or alternatively the coverage plot could be exported to Google Earth.
This analysis was done with 90m terrain database and constant clutter loss: more detailed analysis could use higher resolution terrain data and a land-use database.
This baseline could then be used to optimise coverage by moving the base stations.
One of the main constraints on coverage is the limited number of locations where base stations could be located – and not in Sydney Harbour! Therefore, an alternative way of defining their deployment is using the Service Area wizard with CSV file containing list of (latitudes, longitudes) for the locations to use as below:
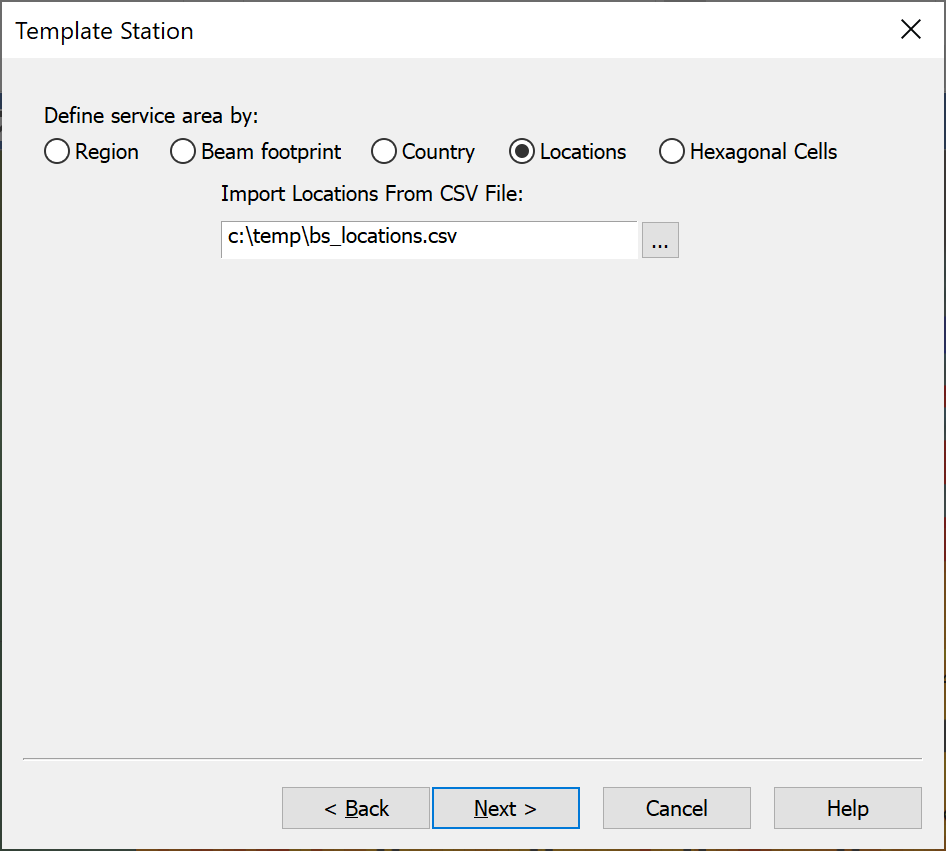
This simulation file can then be used in further analysis – for example to repeat the analysis above and identify the areas that would be excluded for use by an Earth station due to aggregate interference from the WiMAX network.