Coordination Contours
Once you have defined your earth station parameters Visualyse Coordinate allows you to analyse coordination contours.
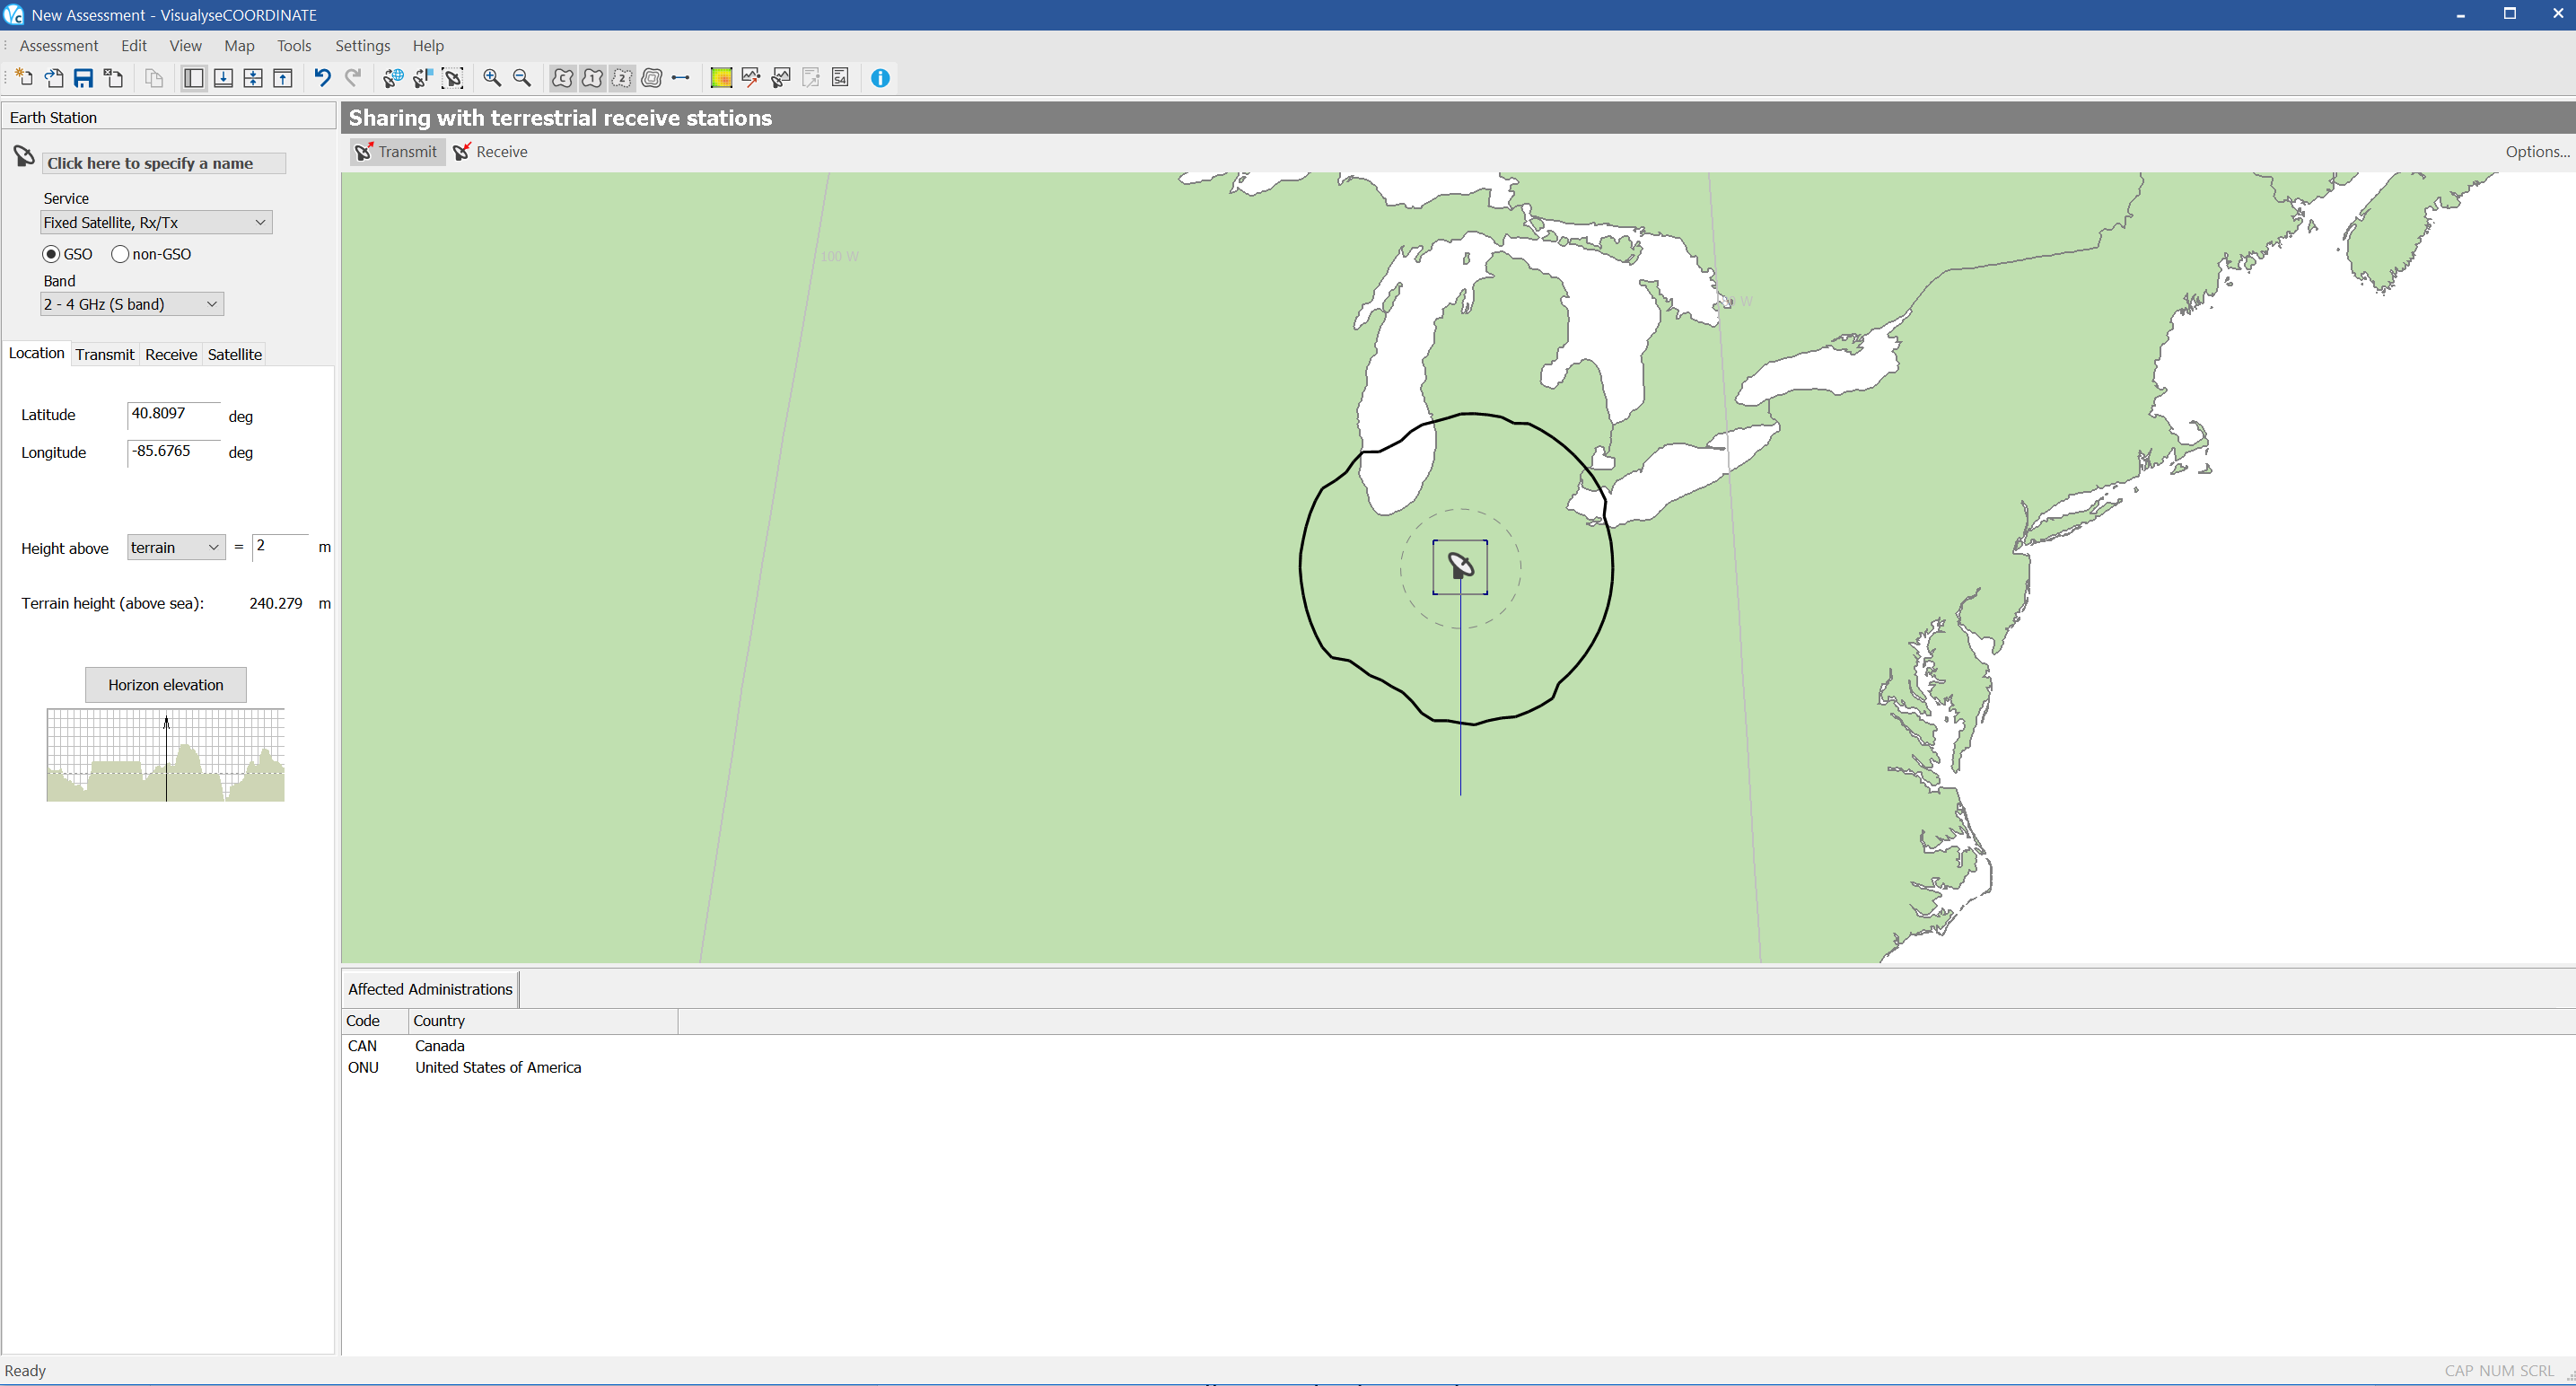
Each possible sharing scenario (Receive, Transmit, and Reverse Band) will have its own coordination contour. Mode 1 and Mode 2 contours are generated automatically as soon as a location has been defined for the earth station. Each time you refine or change the earth station data, the contours are updated.

The mode 1 contour is shown as a grey line. The mode 2 contour is shown as a dotted grey line. The actual coordination contour is the outer envelope of the mode 1 and mode 2 contours. This is shown as a thick black line.
By default all the all these contours are visible. You can hide the contours using the toolbar. Click the ![]() button to show or hide the mode 1 contour. Click the
button to show or hide the mode 1 contour. Click the ![]() button to show or hide the mode 2 contour. Click the
button to show or hide the mode 2 contour. Click the ![]() button to show or hide the coordination contour.
button to show or hide the coordination contour.
In addition to the mode 1 and mode 2 contours, you can also display auxiliary contours.
These show the contour for more favourable conditions when an improvement by 5 dB is shown (this may come from decreases in power or extra shielding leading to additional propagation loss). To show or hide the auxiliary contours click the ![]() button on the map toolbar.
button on the map toolbar.
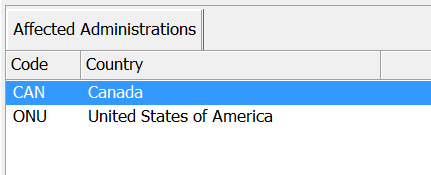
The affected administrations (countries which overlap with the contours) are highlighted in a distinct colour on the map. The administrations are also listed in text form at the bottom of the application window along with their ITU country code.
