Visualyse Coordinate User Guide

Documentation Control
| Date: | Software Version: |
|---|---|
| January 2025 | 3.2.0.0 |
Contact Information
You can contact us at:
Address Transfinite Systems Ltd, Suite 24 (5th Floor), AMP House, Dingwall Road, Croydon, CR0 2LX U.K
Phone +44 20 3904 3220
Fax +44 20 3904 3211
Email info@transfinite.com
Transfinite Systems reserves the right to change features and screen layouts without notice.
©Transfinite Systems Ltd
Software Overview
Layout
The figure below shows a view of the application, highlighting the different windows and areas of the program layout.

Note that the layout will change as you select different options and will be different at different stages of the analysis. The figure above shows the state of the application after the contours have been defined and interference analysis has been performed.
How it Works - briefly
Visualyse Coordinate automates the process of assessing the compatibility of a satellite earth station with all potential sharing services.
Throughout the guide we will refer to ‘Assessments’ as the top-level function of Visualyse Coordinate – an Assessment includes all the analysis needed for a given earth station. An Assessment is the equivalent to a document in an application like Microsoft Word.
An Assessment can be created with very few user inputs in Visualyse Coordinate because there are many parameters that are assigned sensible default values by the software.
Parameter values are edited in a region of the application that we call the ‘Sidebar’ (refer to the layout shown here).
The Sidebar includes up to four tabs that define parameters relating to Earth Station location, transmit and receive parameters and the associated satellite system. You can get started without reference to any of these tabs and then work through the parameters in any sequence, updating your data to more accurately reflect your system.
To get started
The Service (FSS, BSS etc) definition is sufficient to get started, and to plot Appendix 7 contours.
The Service allows Visualyse Coordinate to select an appropriate frequency band and create frequency assignments based on The Radio Regulations Allocation Table for the Service. An assignment for each shared band is inserted by default. The frequency assignments can be edited and added to later.
The default assumption is that the Earth Station operates to a geostationary satellite. The default location is at the same longitude as the Earth Station.
The information is enough to allow all possible sharing Scenarios to be defined.
All other parameters (frequency band, antenna performance, powers, noise parameters, station location etc.) are set to default values and Visualyse Coordinate is able to immediately plot all relevant Appendix 7 coordination contours.
Scenarios
Each Assessment is broken down into ‘Scenarios’ - for example Receive, Transmit and Reverse Band scenarios. All Scenarios are calculated and can be selected for analysis by clicking the appropriate Scenario button on the Scenario Bar above the Map View.
When you select Transmit, for example, the Map View (showing the contour) and the Analysis views all relate to coordination that treats your earth station as the potential interferer.
Earth Station Parameters
On each of the Sidebar tabs a set of Earth Station parameters are presented.
On the Location tab, you can set:
- earth station location
- earth station height
- terrain height
- horizon elevation around the earth station – derived from the terrain data or input by hand
On the Transmit and Receive tabs:
- select and define the antenna performance – based on masks or user defined equations and tables
- set transmit power / EIRP levels
- define receiver noise levels
On the Satellite tab:
- select or define a satellite system
As you add and change parameters on the four tabs, the Appendix 7 contours will update to reflect the new data.
Point to Point Interference
A powerful feature of Visualyse Coordinate is the ability to perform point to point interference calculations with all sharing assignments that fall within the coordination contours.
This assumes that you have a database of potential sharing systems in a compatible format, in the correct location for Visualyse Coordinate to access. Normally, this will have been arranged when the software was installed, and is not something that should affect the day to day operation of the tool.
The initiation of point to point analysis is a one-click operation within Visualyse Coordinate. Pressing the Interference Analysis button on the Toolbar automatically imports all assignments within the coordination contour that have any frequency overlap with your earth station.
The calculation of I/N, DT/T and I levels is carried out for all assignments and results are displayed in the Analysis Views.
At this stage, the software has used default values for Interference Thresholds based on ITU-R Rec 1086. Threshold values can be edited by selecting Sharing Assignment Thresholds from the Settings menu.
Specific Case Analysis
A list of affected assignments is shown with assignments grouped in one of three ways or as a simple ordered list (see Section 2.7.2.2 for more details).
Selecting an assignment in the list allows you to analyse the interference calculation in detail and to examine the path profile for the selected link.
The Sidebar also changes to show the parameters of the selected sharing assignment.
Site Analysis
Visualyse Coordinate provides tools to assist in the selection of your earth station site by giving a graphical representation of the interference scenario over an area.
The graphic shows interference hotspots and allows you to examine in detail the potential size of coordination effort at many locations.
Site Analysis is very simple to use and a powerful area analysis tool.
Scenario Reporting
Visualyse Coordinate includes a report generation facility. It will generate a three level report giving a list of sites that have interference excesses, detailed analysis of each excess and detailed analysis of all sharing assignments. You can select a Summary Report, Interference Report or Full Report as required. Full Reports can be extremely large documents and can take some time to generate.
APS4 III Form Generation
Once you are happy with your Assessment, Visualyse Coordinate will help in the generation of APS4 III Forms of notice for submission to the ITU. It will produce a Word file with the parameters used in the software added. You will need to complete the form by providing some additional parameters.
Using the Software
Starting the Program
The first time you start the application, you will be presented with the dialog shown below. This presents two options. You can either create a new assessment or resume work on an existing assessment.
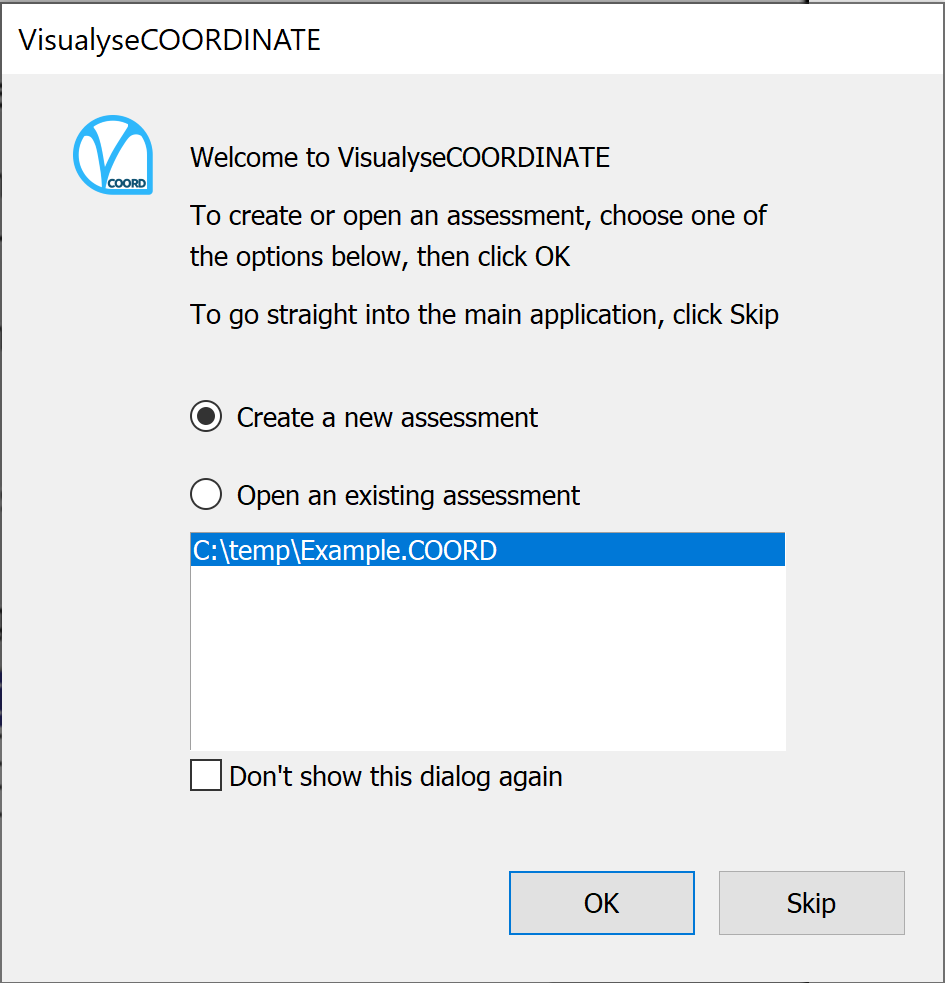
To create a completely new assessment, click Create a new Assessment, then click OK.
If you want to open an existing assessment, click Open an existing Assessment. The most recently used assessments are shown in the list box. Click on the Assessment you want to open, then click OK. Alternatively, you can double-click on the assessment in the list. This has the same effect as clicking on an assessment then pressing OK.
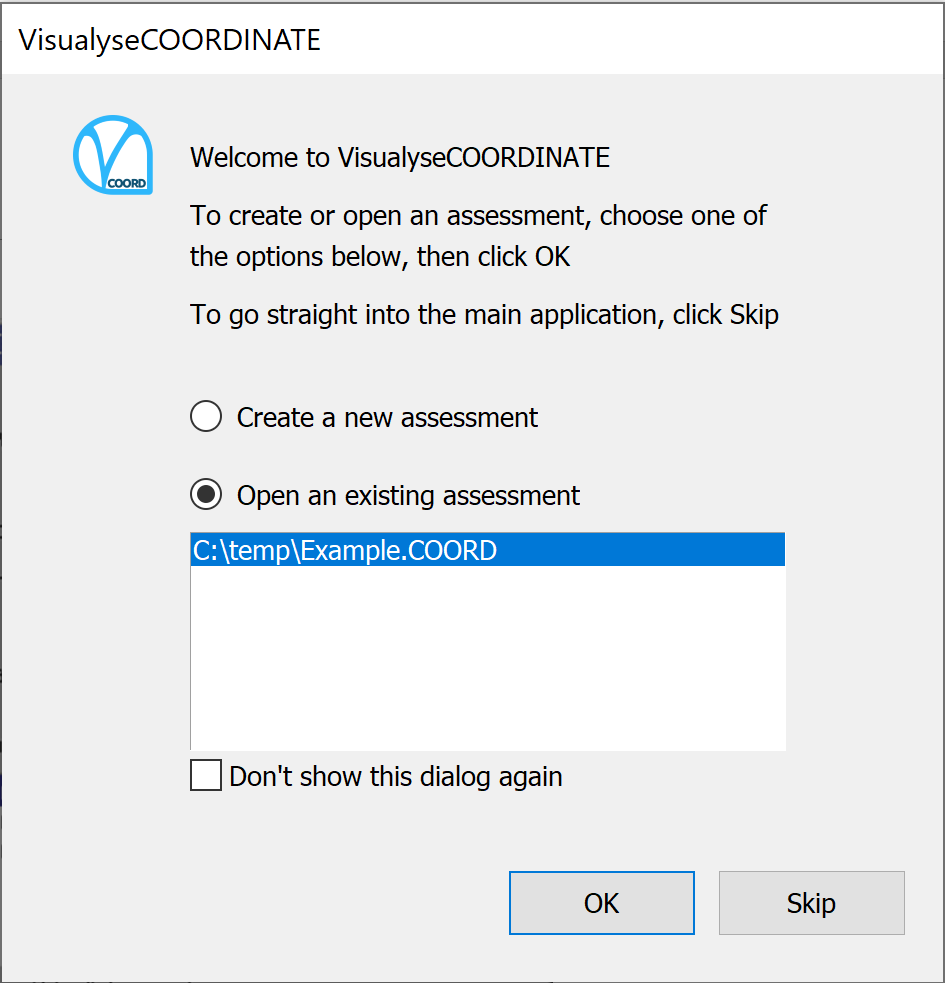
If you don’t want the dialog to appear again, check the ‘Don’t show this next time’ box before clicking OK.
If you suppress the dialog, then the program will start directly in the application window and new or existing Assessments must be created from the File menu.
Create a New Assessment
In order to analyse an earth station, you need to create an Assessment. You can create a new Assessment from the startup dialog described in the previous section. If the software is already running, you can still create a new assessment at any time.
To create a new assessment:
1. Click New from the File menu.
2. Alternatively, click  on the toolbar.
The application window changes to show the new assessment (shown below). The vertical pane on the left hand side of the application window is called the Properties Side Bar.
This shows the properties of the selected station. The properties of the selected station on the map are then displayed in the side bar.
At start-up or on creation of new Assessment, nothing has been defined and there is only one station - the earth station. Hence, the earth station properties are displayed in the Sidebar.
To get started you need to define some essential parameters of the earth station – Visualyse Coordinate can fill in the rest with default values that you can then edit.
The earth station has some fundamental properties (Service, whether GSO or non-GSO and frequency Band), and these are shown at the top of the side bar.
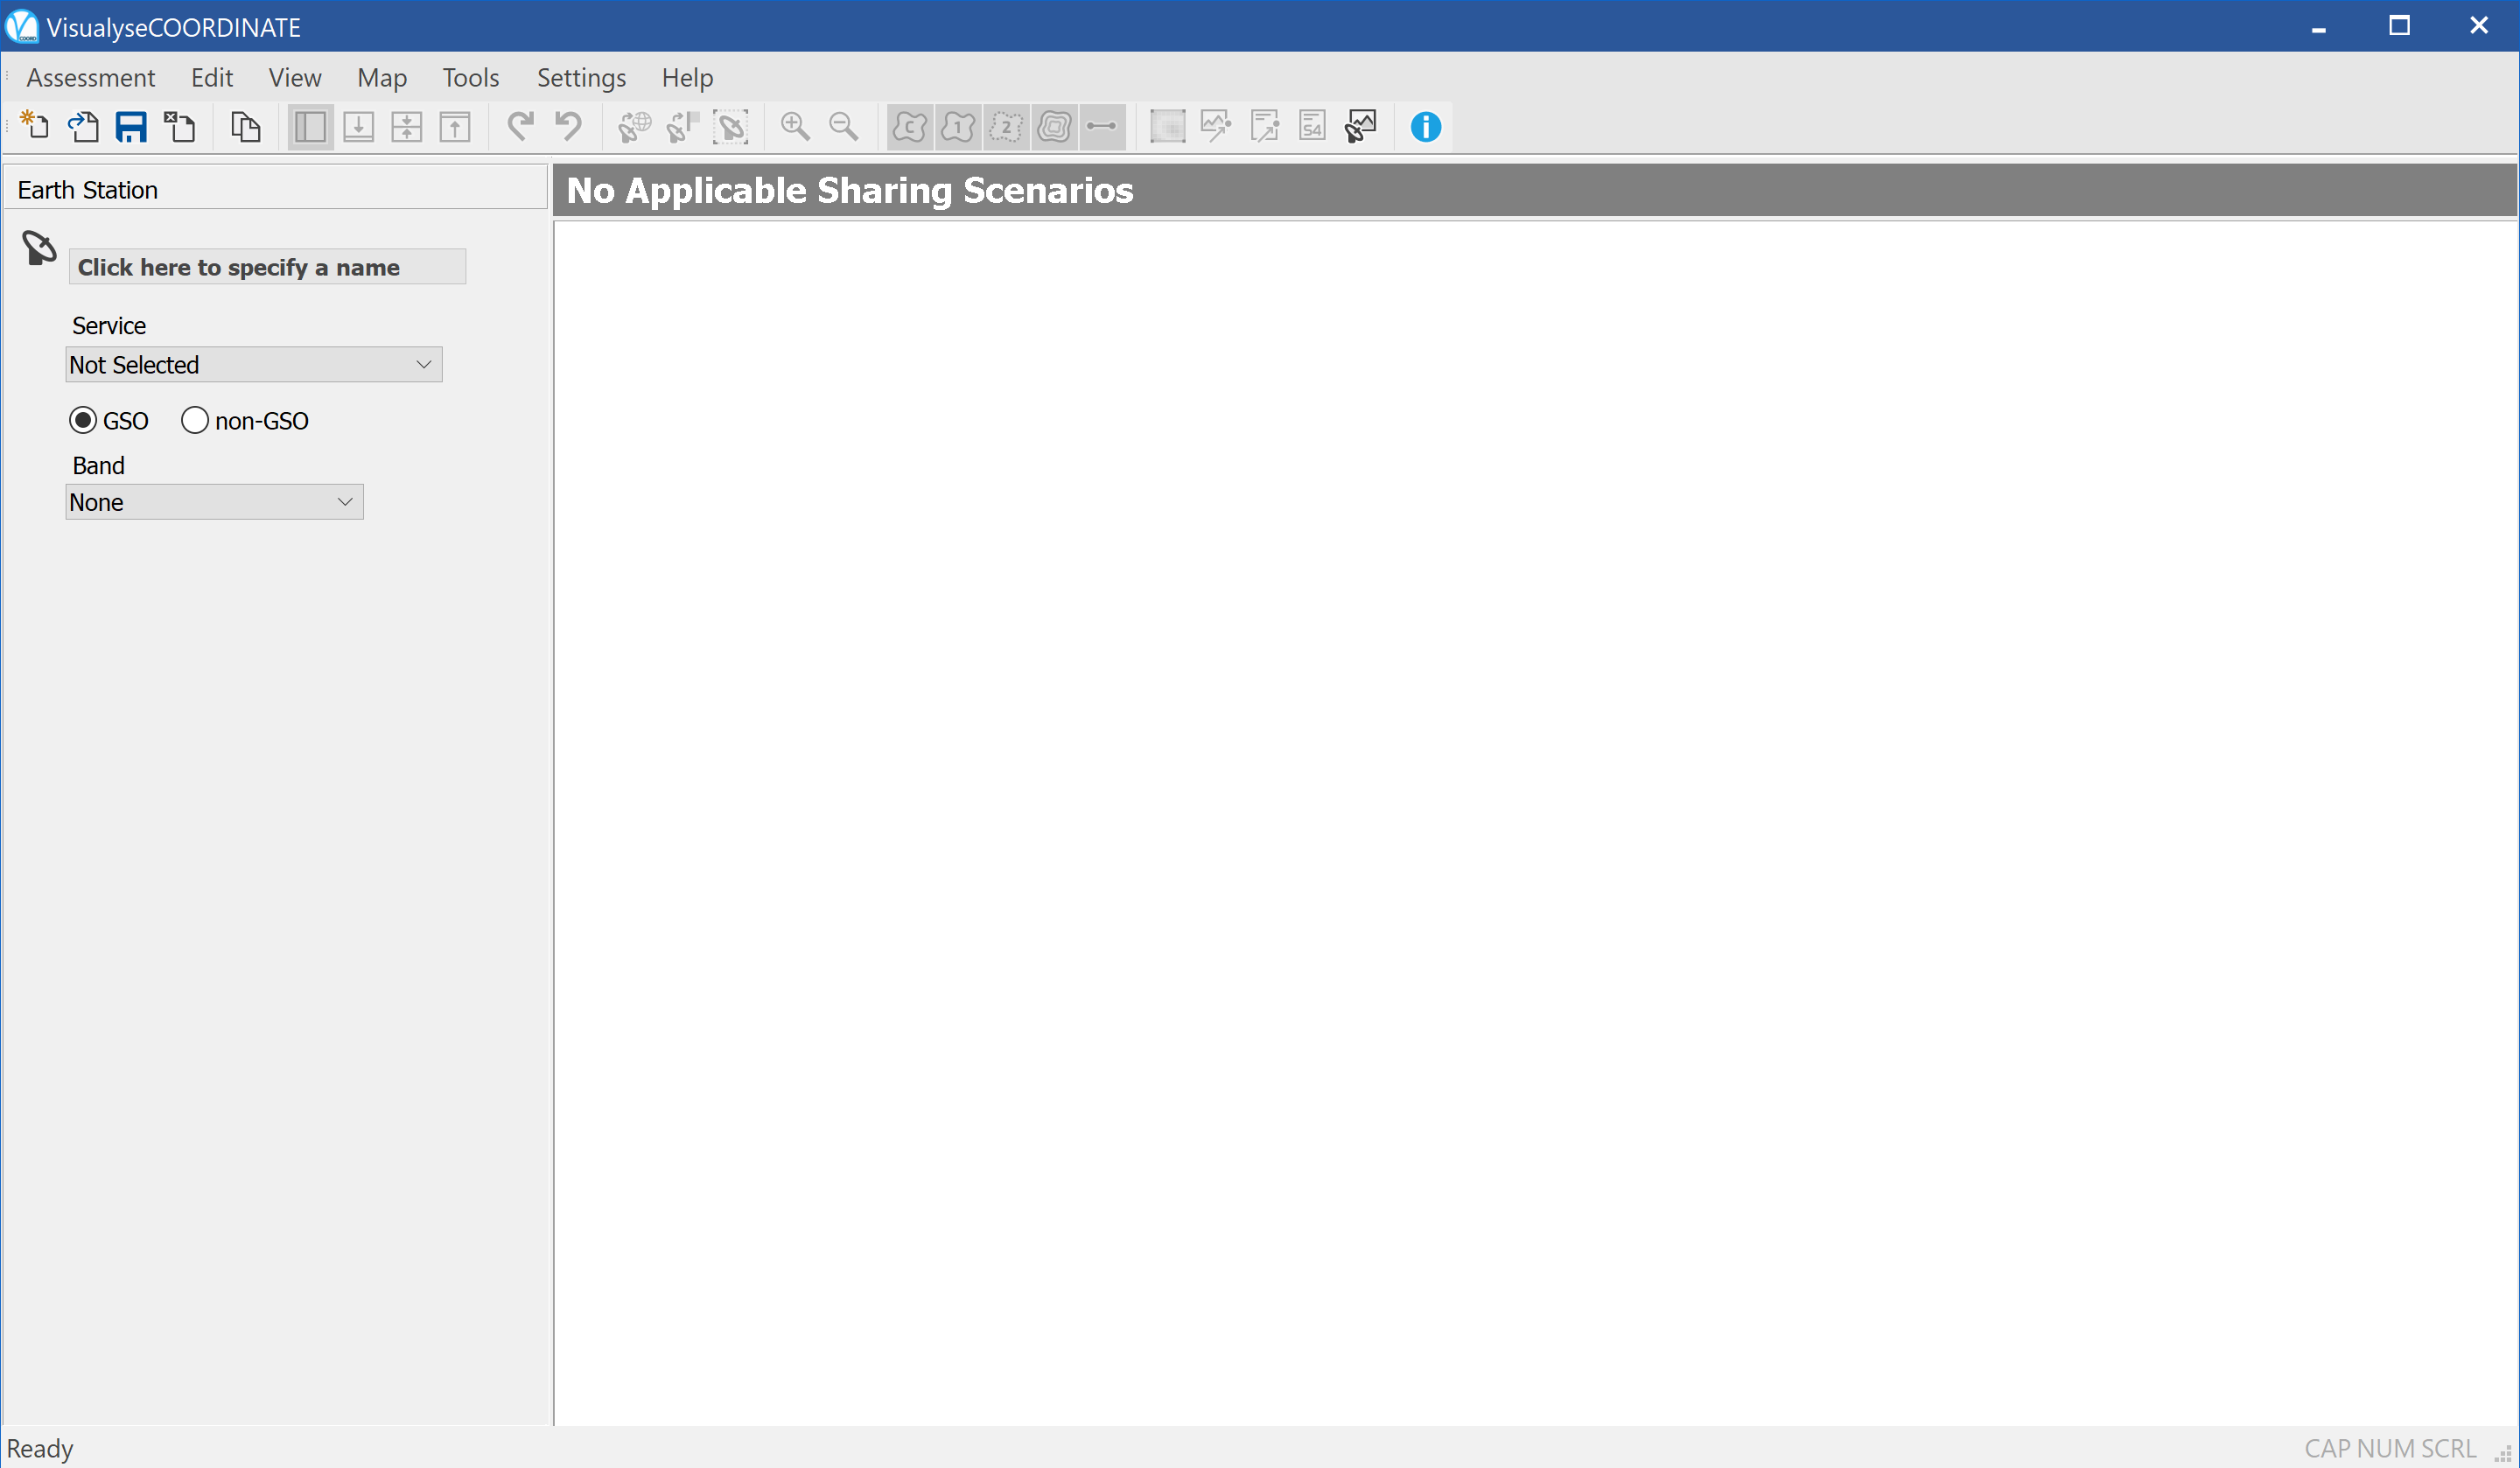
Once the earth station service is defined, other earth station properties are accessible via the tabs in the lower part of the sidebar.
The figure below shows the state of the application as soon as the service has been selected (note that the earth station location defaults to the location used in your last assessment or to 0 latitude 0 longitude if this is the first time the application has been run)
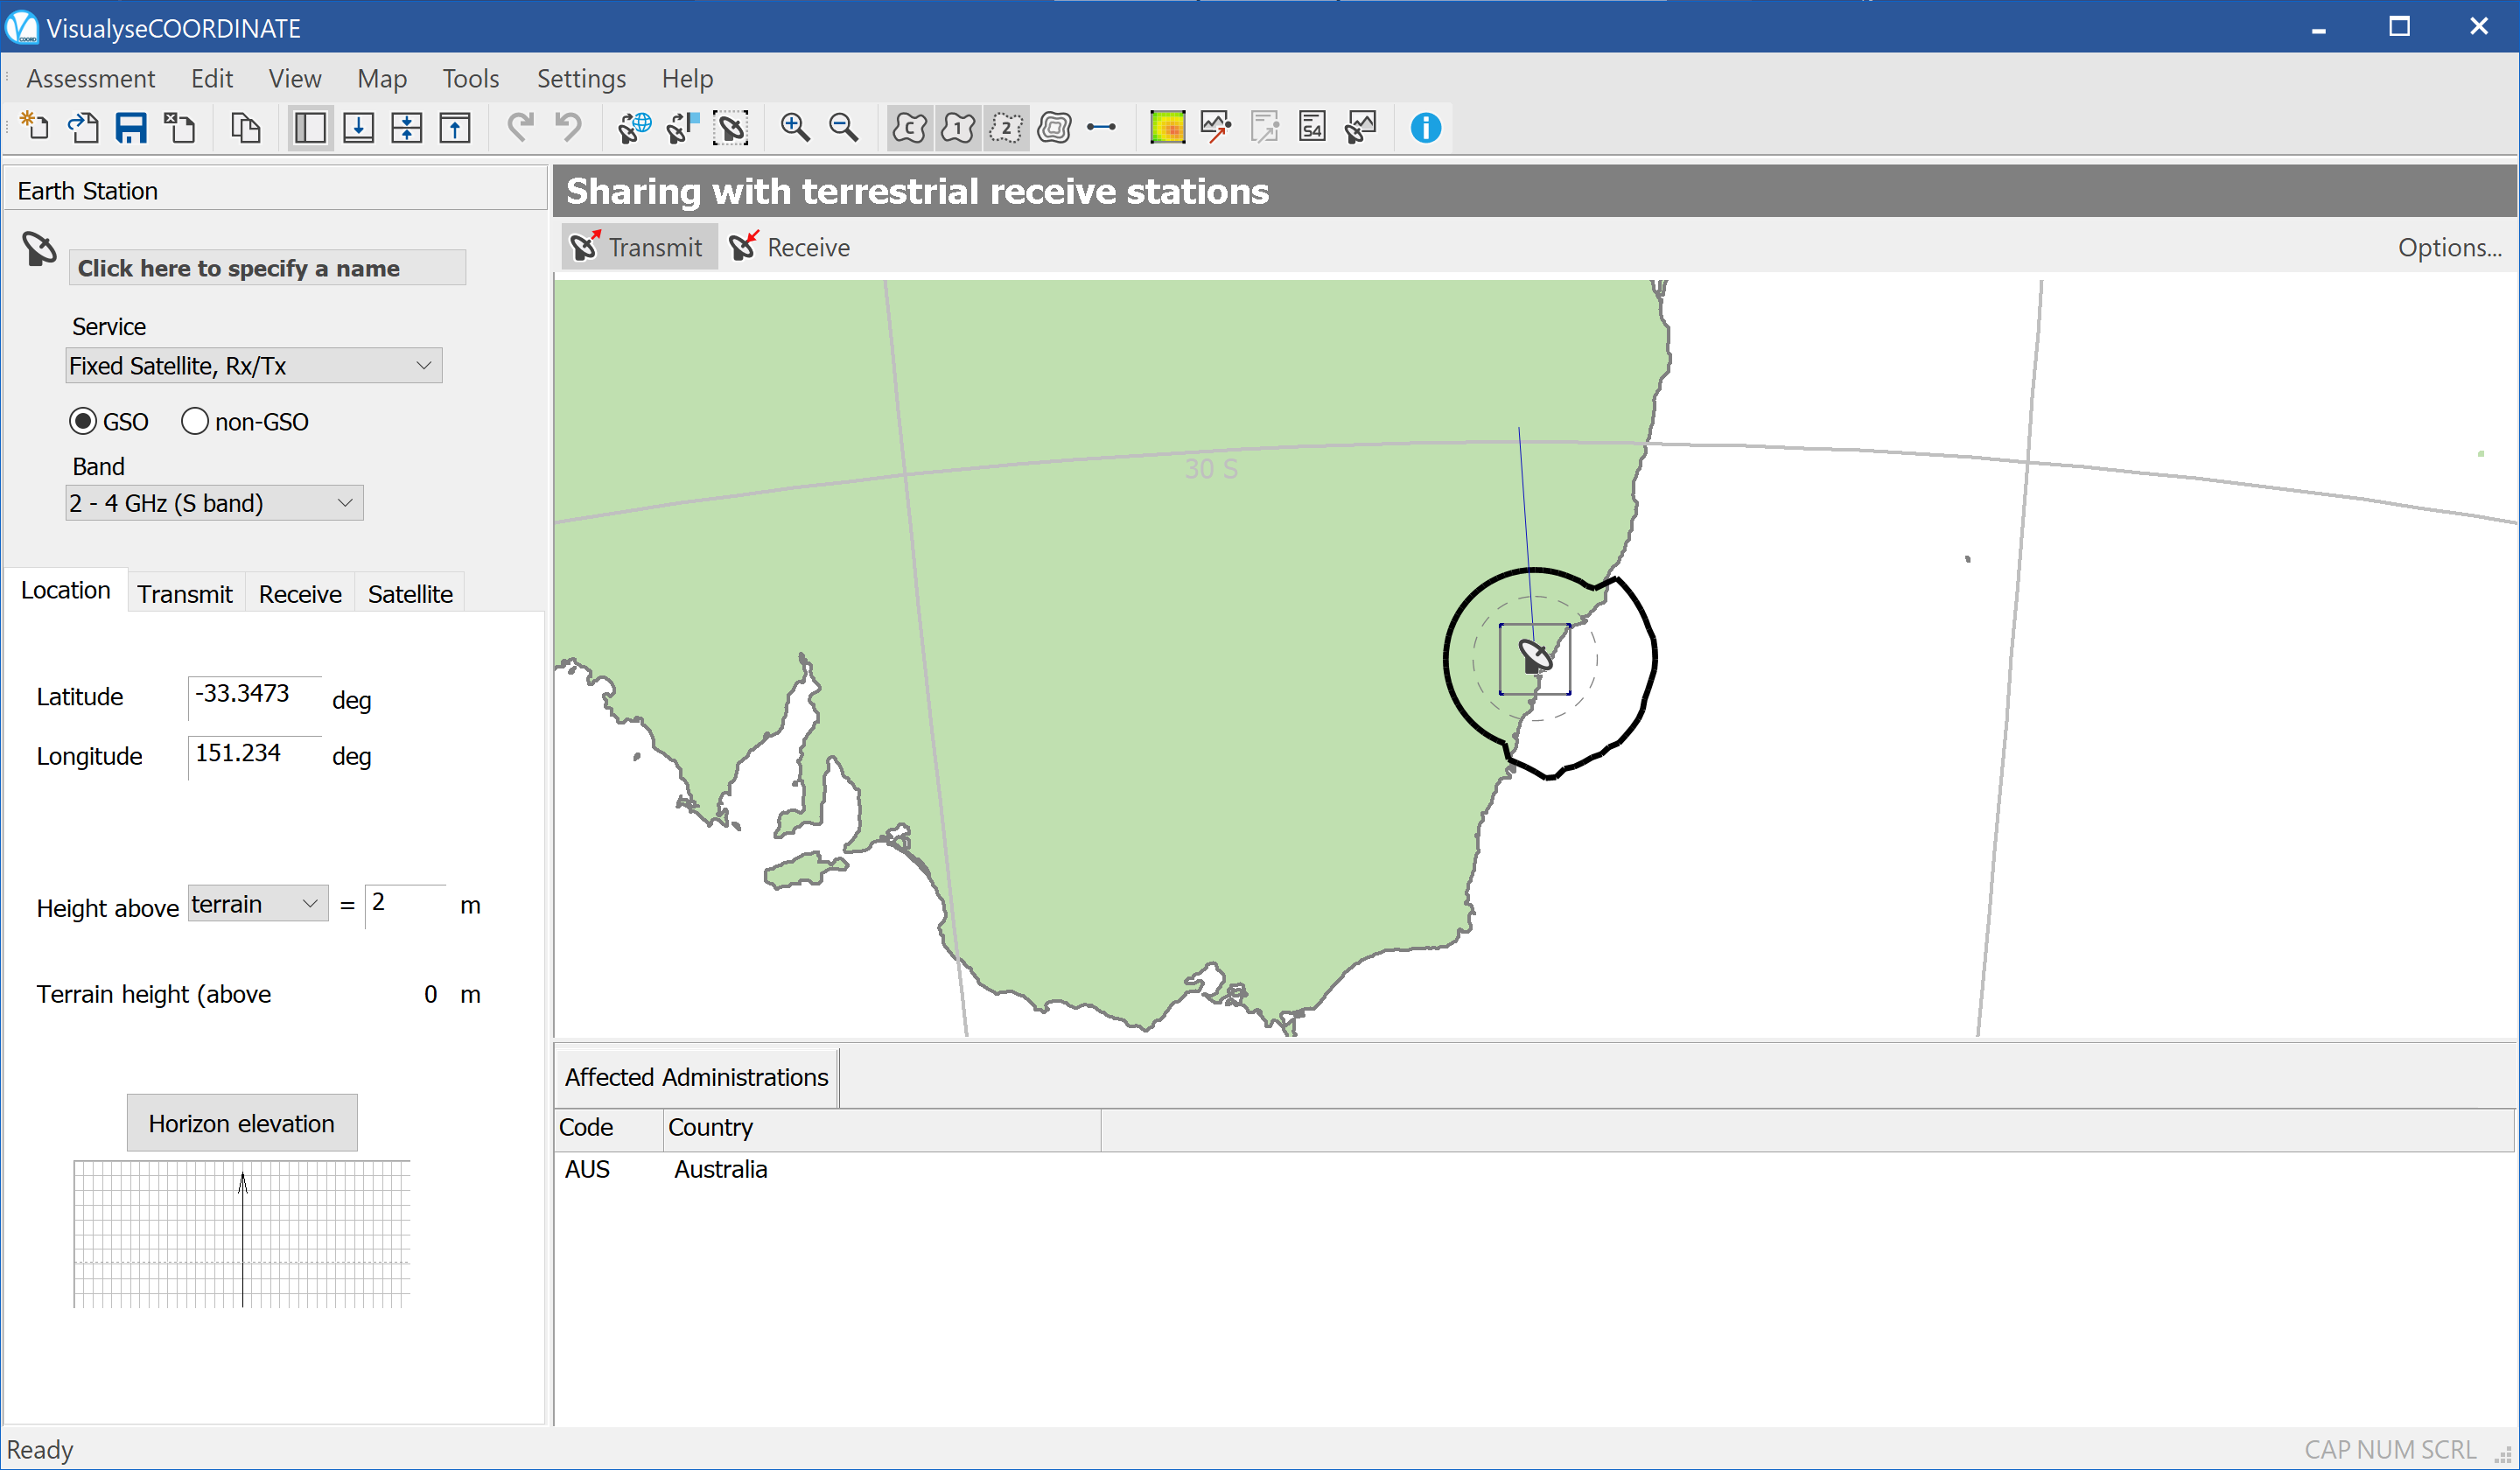
Before beginning to specify your earth station properties, you may want to set up analysis defaults and preferred settings.
Analysis Defaults
The Settings menu allows you to do the following tasks:
-
Set default data for sharing assignments
-
Set the default interference thresholds
-
Manage assignment databases
-
Manage terrain databases
-
Maintain the antenna radiation pattern database
Default Data for Sharing Assignments
Sources of data for sharing assignments vary in format and in completeness. Where a database contains all the parameters needed in Visualyse Coordinate calculation these will be used in all cases. Where some parameters are missing, the software needs to assume sensible default values, and these can be adjusted via the Settings menu.
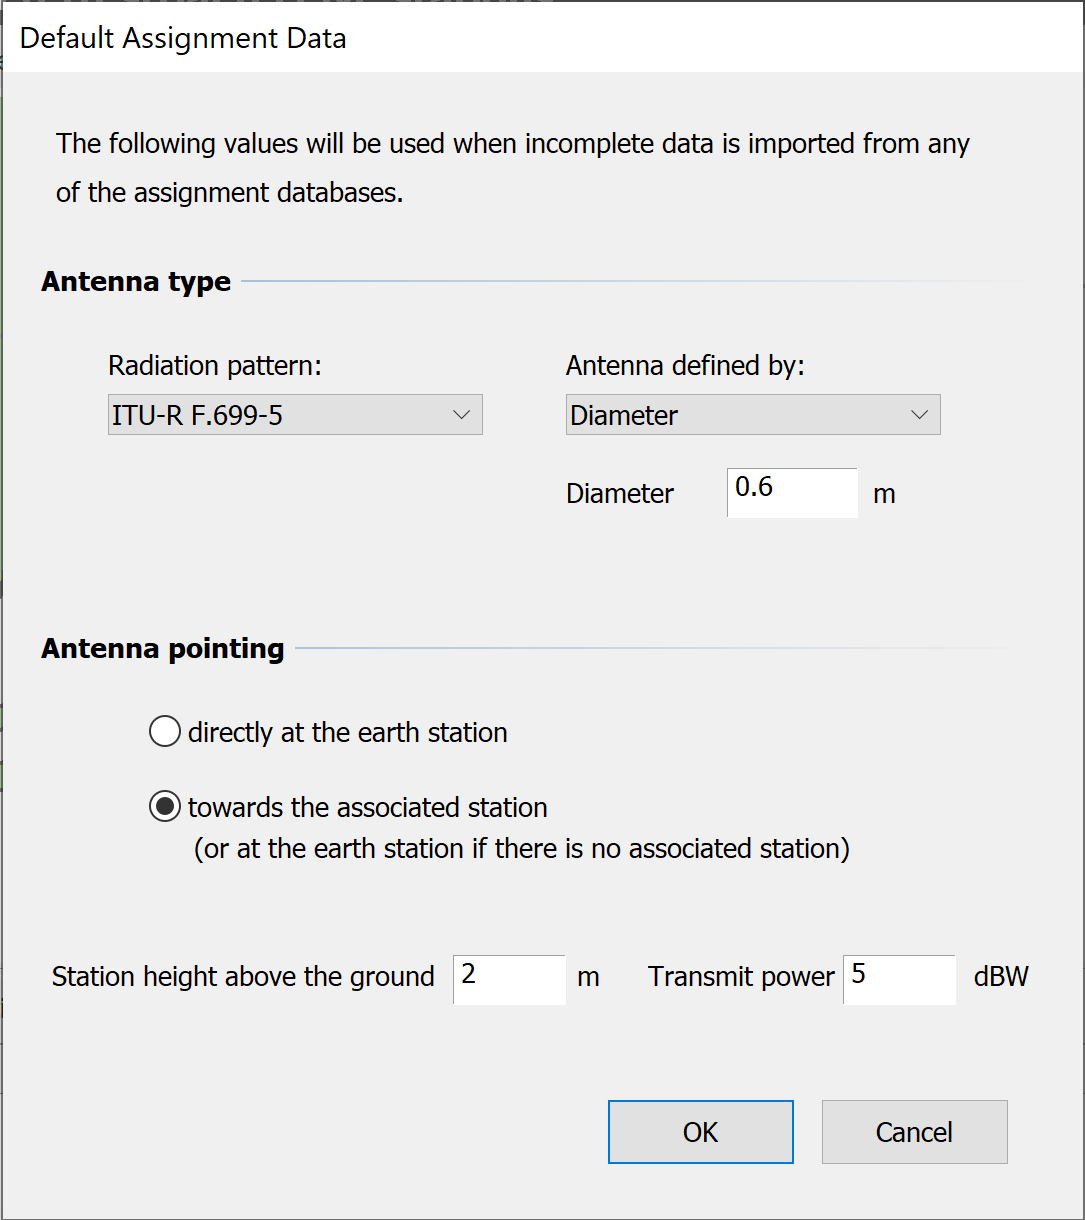
Set the Default Antenna type – select a Radiation pattern to use and default parameters (diameter, peak gain and efficiency etc).
Select the Radiation pattern from the drop down list on the left. Select the parameters to use as defaults from the drop down on the right and enter the values in the field or fields below.
Where sharing services do not have an antenna azimuth specified, you can select two options. The worst case assumption is that the sharing station points directly at the earth station. Alternatively, the database may have a second station associated with the one under consideration. In this case you can point the antenna towards the associated station.
You can also specify a default height above the terrain and default transmit power.
Default Thresholds
Interference calculations require reference levels or thresholds against which they are judged.
These thresholds can be set by selecting Sharing Assignment Thresholds from the Settings menu.
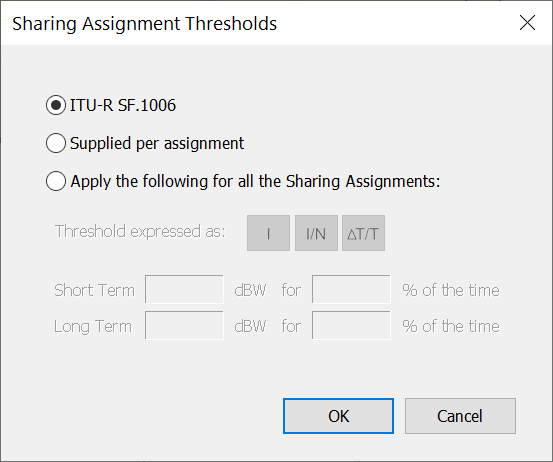
There are three options:
-
Use Recommendation ITU-R SF.1006 to calculate the thresholds
-
Use values supplied in the data base per Assignment
-
Set default values to be applied to all Assignments
Thresholds in Rec. SF. 1006 are given in terms of short and long term interference levels.
The other methods can also use I/N and ΔT/T values and associated percentages of time.
Set-up Assignment Databases
At any time you can add and remove databases of potential sharing assignments. To do this, select Assignment Databases from the Settings menu.
Before you add any data the dialog appears as below.
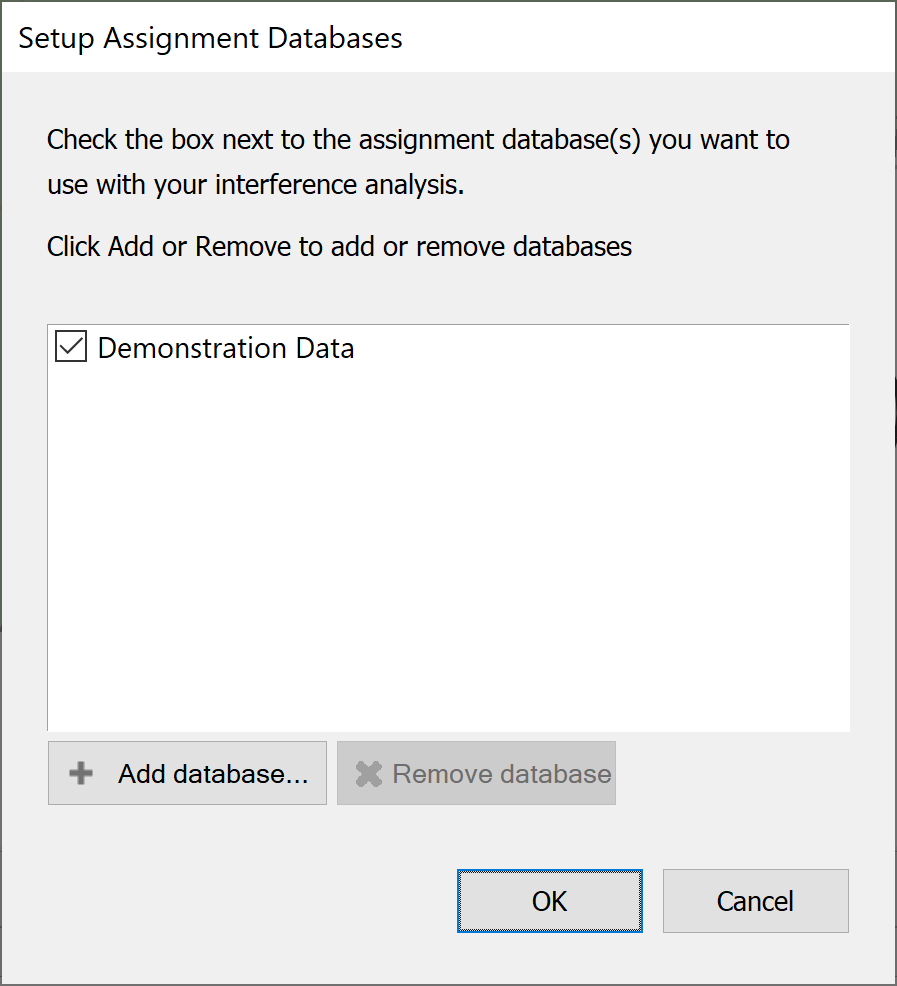
Press the ‘Add Database’ button and you will be asked to select the type of database to use. Selecting ‘Internal Visualyse Coordinate Database’ will mean that the data you use will have to be in our proprietary format.
You may have other options on your list depending on the work your systems administrator may have done or commissioned from Transfinite Systems.
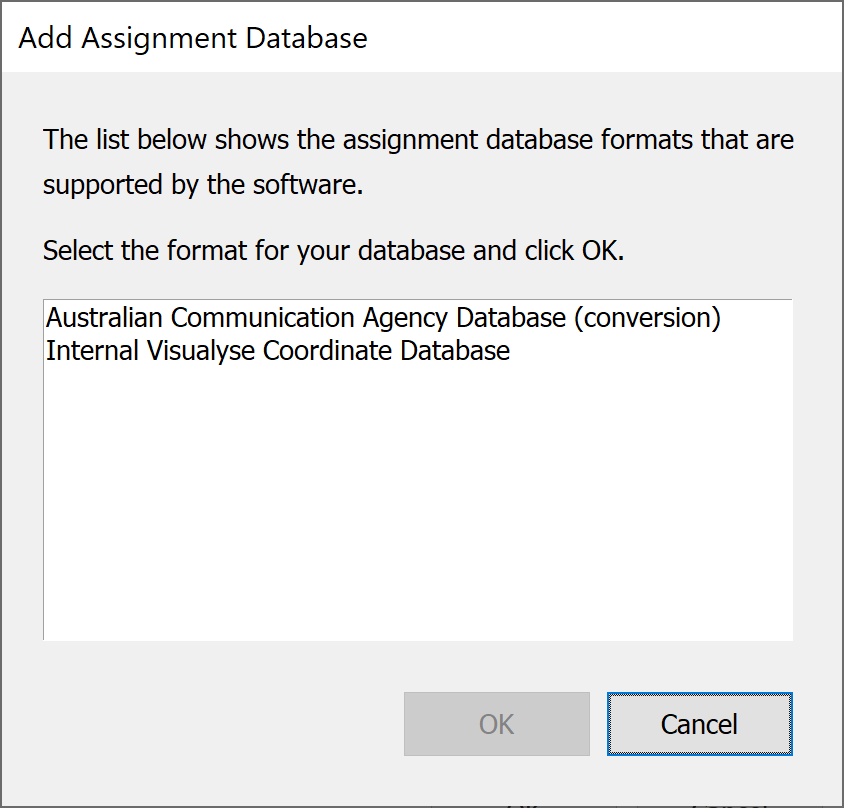
Having selected a database type, you will see the standard Windows open file dialog and you will need to locate the databases on you PC or network.
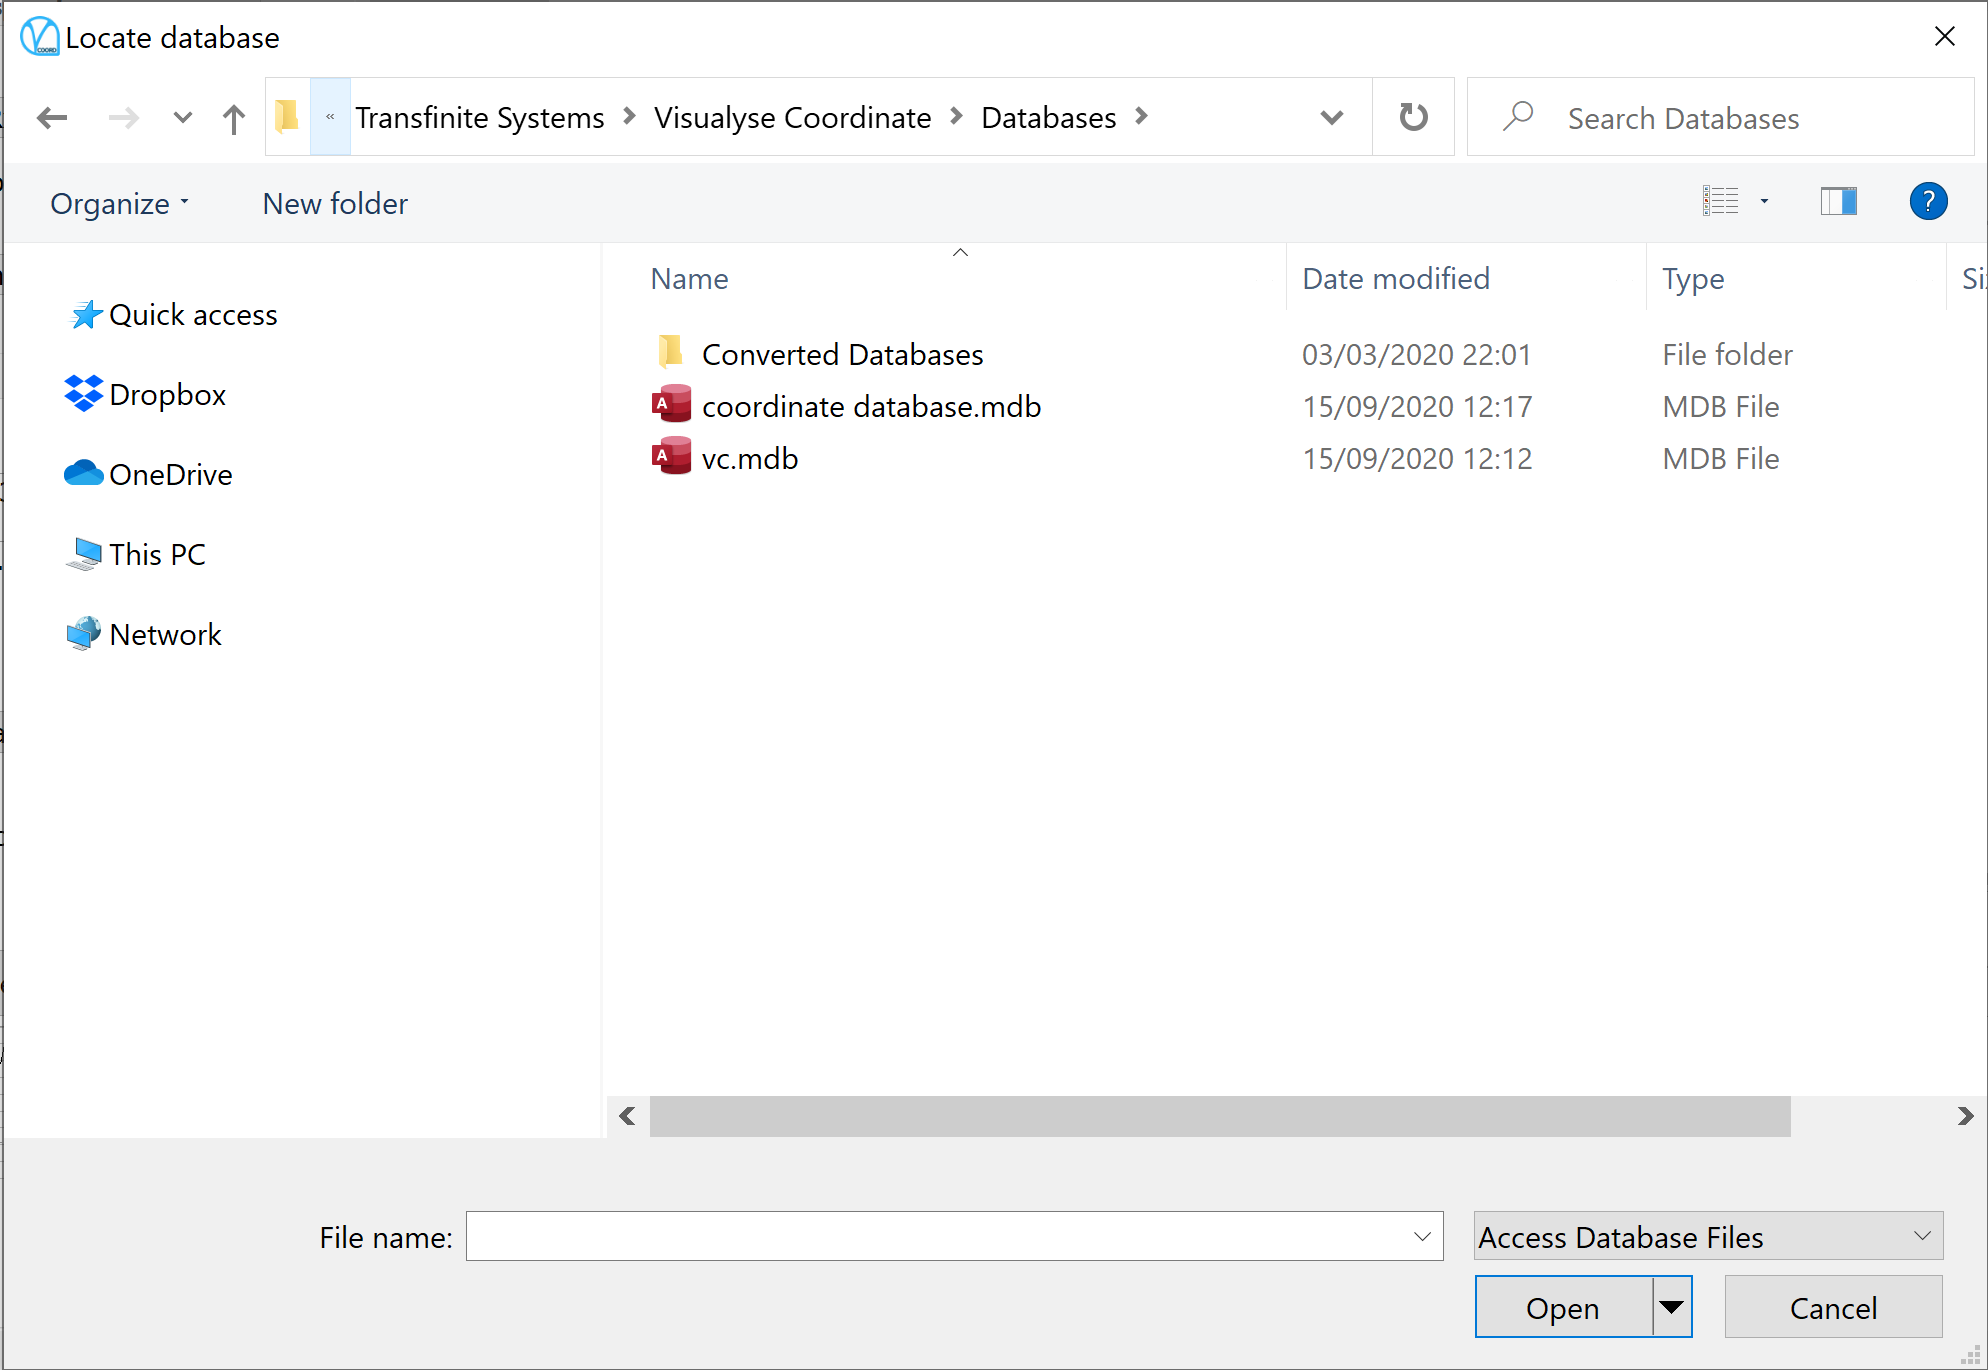
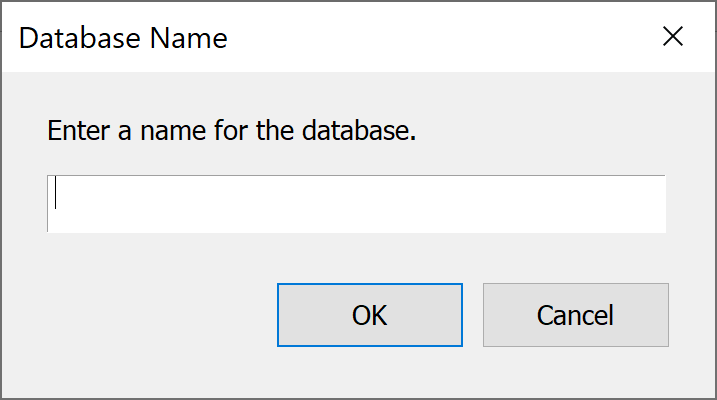
Locate the database file and select open. You will be asked to provide a name for the database. This will be used locally to identify the data.
Once some databases have been added the dialog will look like the one shown below.
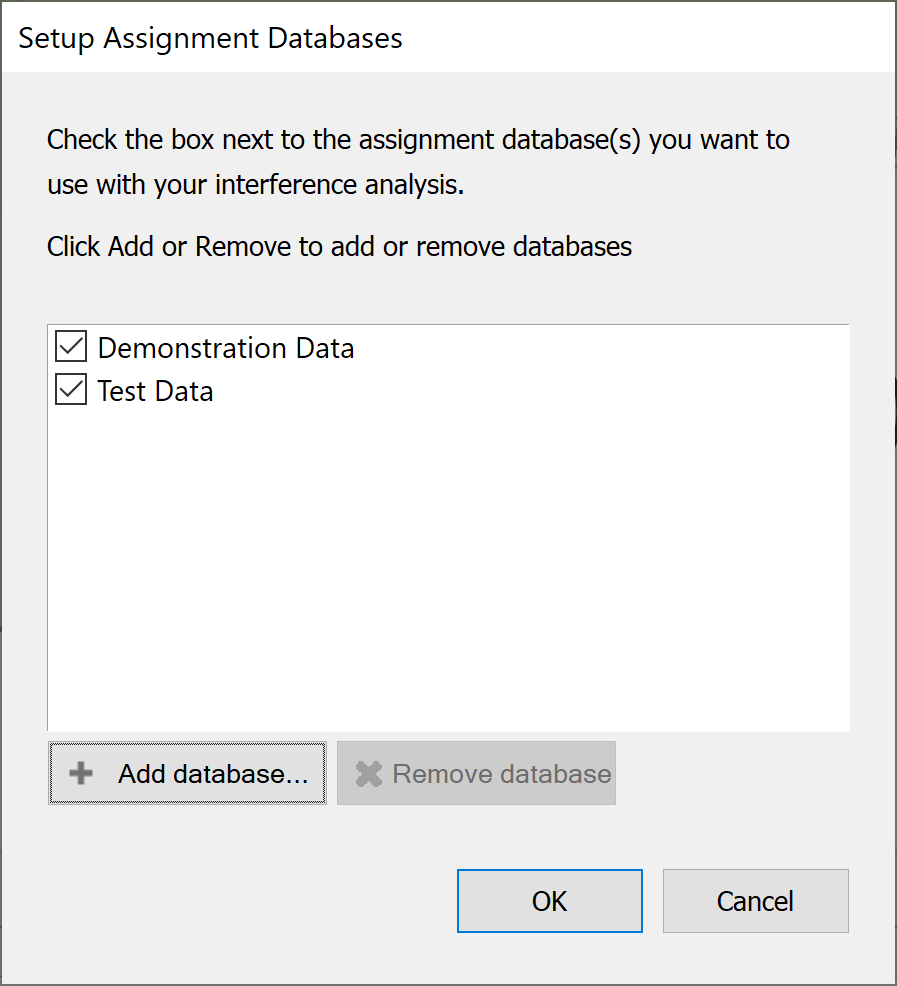
Data can be switched on and off by selecting and de-selecting the tick box to the left of the database name.
Data can be removed completely by selecting it in the list and clicking the ‘Remove database’ button.
Terrain Databases
Like the Assignment databases, terrain can be added and removed at any time. You may be able to import in several formats depending on the work done by your system administrator or work commissioned from Transfinite.
Terrain data is managed from the Settings menu. Select Terrain Databases and you will see the following dialog.
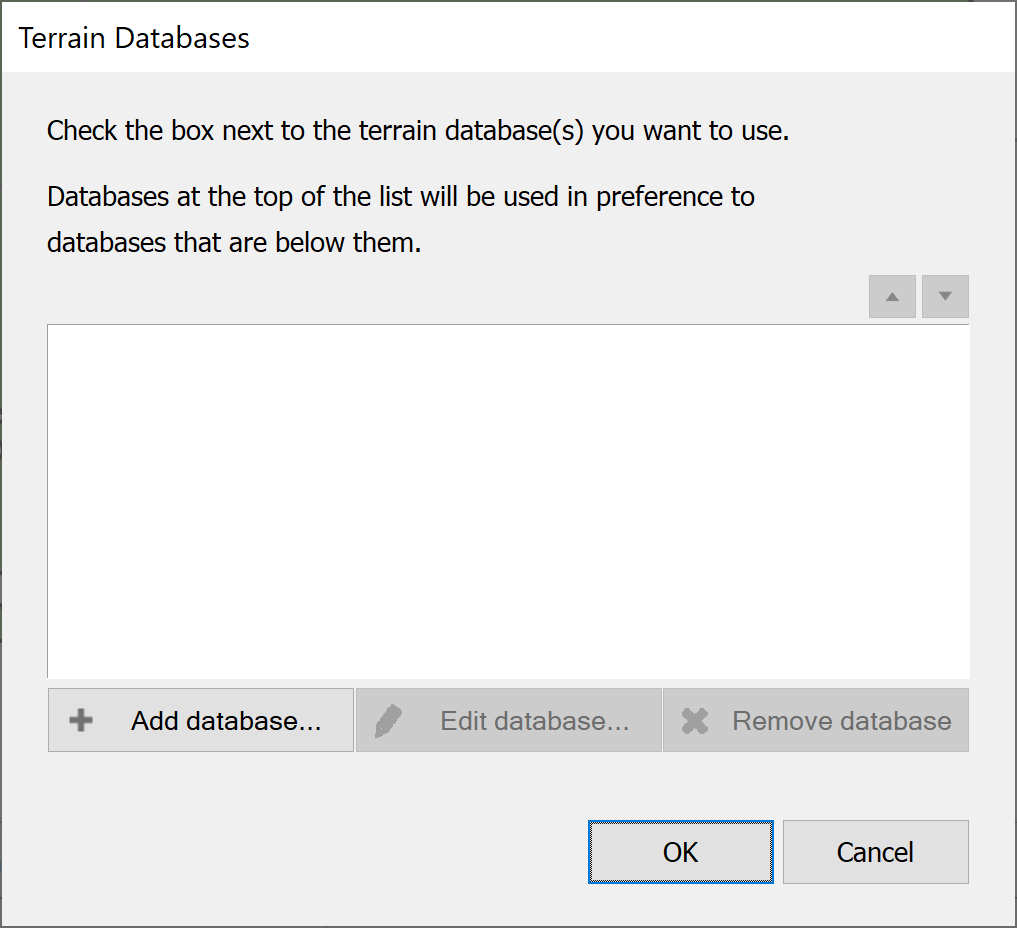
Click the Add Database button. You will be asked to select the type of data to import.
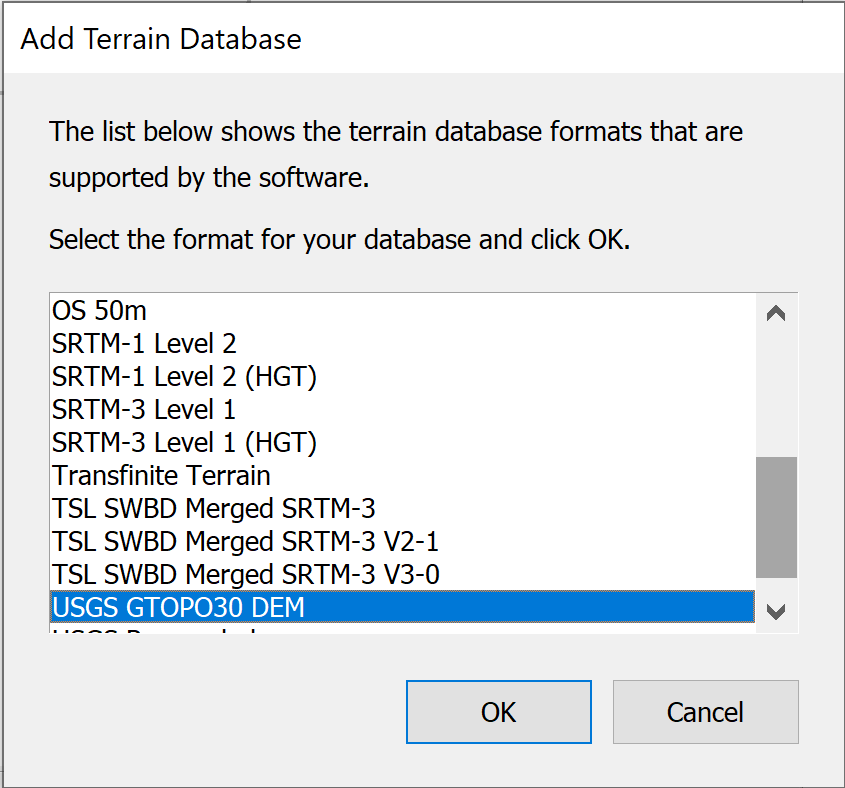
Selecting USGS DEM format will present you with the standard Windows file find dialog, and you will need to locate the data on your PC or network.
Once you have created some terrain databases, the dialog will look something like the one below.
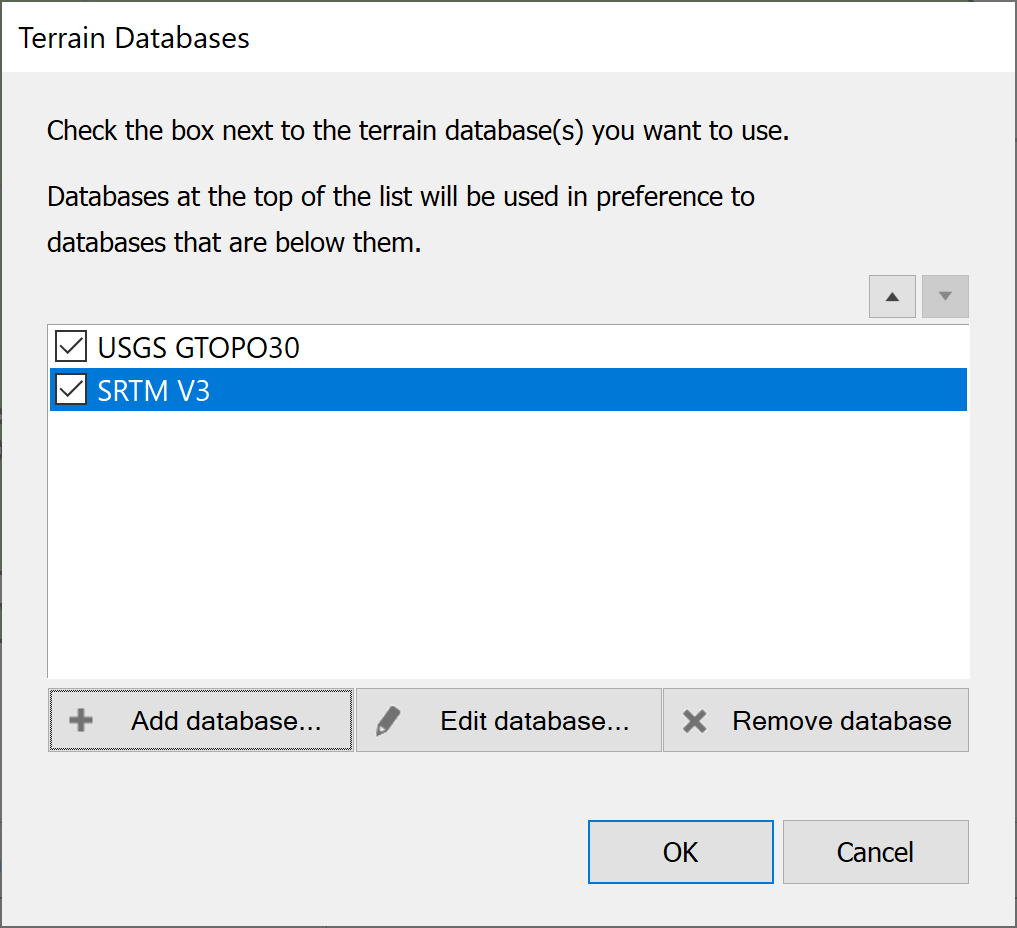
In the case shown above, two sources of data have been added. One is low resolution and one is higher resolution. Where two sources are used they might overlap in area covered. When this occurs Visualyse Coordinate preferentially uses data from the source higher up the list. The list ordering is editable using the up and down arrow buttons 
 at the top right of the dialog.
To promote a data source, select it in the list and click the up arrow. To demote, click the down arrow.
To remove a data source, select it in the list and click the ‘Remove database’ button.
Radiation Patterns
Visualyse Coordinate provides a number of radiation patterns that can be used with your earth station or when looking at interference into or from terrestrial assignments.
You can create your own radiation patterns. This process is described in more detail in Section 2.5.7 Antenna Properties.
Earth Station Key Properties
The first thing you need to do is specify the name, service, GSO / non-GSO and frequency band for your earth station. This is done using the controls at the top of the Properties side bar.
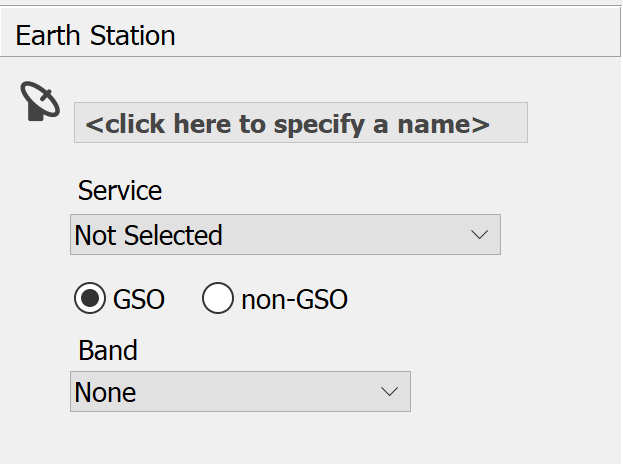
The earth station name is displayed in bold at the top of the side bar. To change the earth station name, simply click where the prompt is, type the name you require and then press the return key.
Click the Service drop-down list to select a service type. Service determines the frequency and type of earth station (fixed or mobile). It also determines whether the earth station is a transmitter, receiver or both.
The application defaults to a GSO system - you can change this by clicking non-GSO.
The Band drop down list will automatically select the lowest frequency band for the earth station, based on the selected service. Visualyse Coordinate automatically assigns your earth station with the full bandwidths of the allocations defined in the Frequency Allocation table of the Radio Regulations.
The Service provides enough information to allow Visualyse Coordinate to set up an Assessment with many default parameters
Once the Service has been defined, the application window will change to show the Map view. The Appendix 7 contour and the affected administrations for each applicable sharing scenario will be shown.
At this stage, Visualyse Coordinate has assumed a great many default parameters for your earth station. In order to model your specific earth station, you must work through these defaults replacing them with authentic values for your system.
The following subsections describe in detail how to change these defaults so that Visualyse Coordinate accurately models your earth station.
Earth Station Properties in Detail
The earth station properties can be defined using the Sidebar. You can enter the details in any order, although it is better to work from the top of the side bar downwards and then across through the tabs.
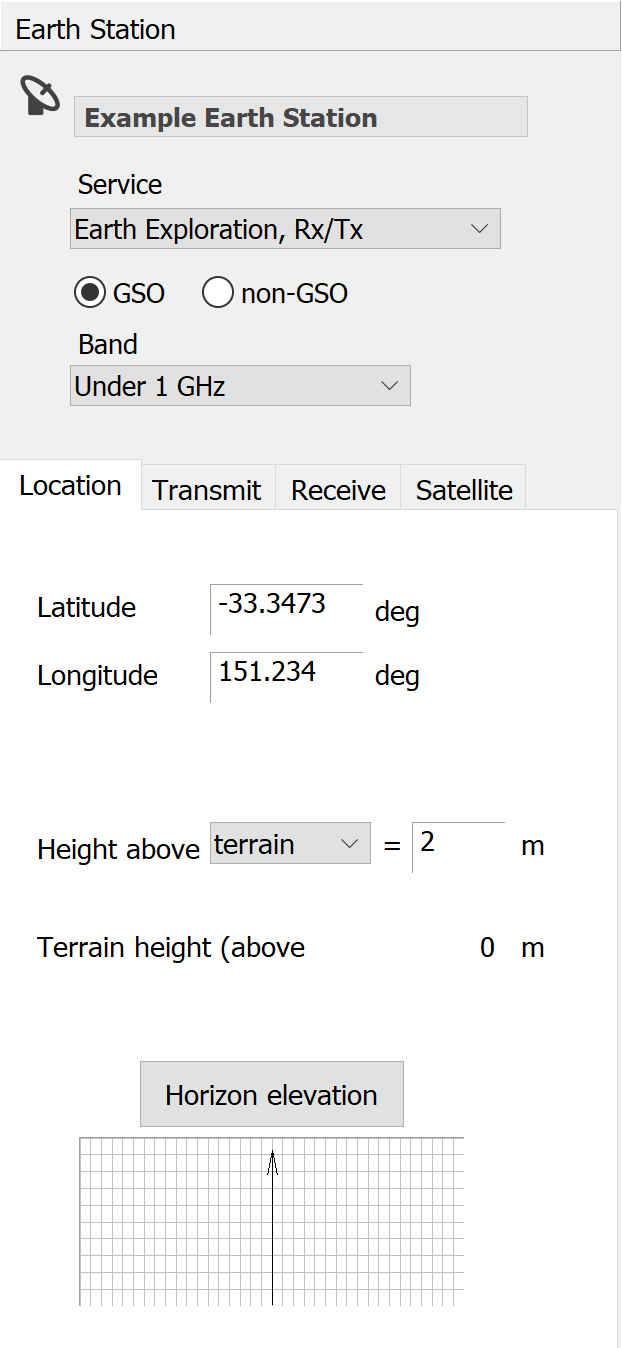
Once you have selected a Service the Sidebar should look something like the graphic shown below.
Earth Station Name
The earth station name is displayed in bold at the top of the side bar. To change the earth station name, click where the prompt is, type the name you require and then press the return key.
Service Type
Click the Service drop-down list to select a service type. Service determines the frequency bands available and type of earth station (fixed or mobile). It also determines whether the earth station acts as a transmitter, a receiver or both at the same time.
A frequency is automatically chosen from the range of allocated bands for the given service. These bands are taken from the Radio Regulations. The lowest frequency band is chosen as the default, as this will give the largest coordination contour. You can and should change this band to reflect the properties of the earth station you are coordinating.
GSO or non-GSO Satellite
Select whether this earth station will operate to a GSO or non-GSO satellite system. Details of the satellite system are entered on the Satellite Tab.
Location
The earth station will have a fixed geographical location. If you know where you want to put the earth station, you can type in the latitude, longitude and height by hand.
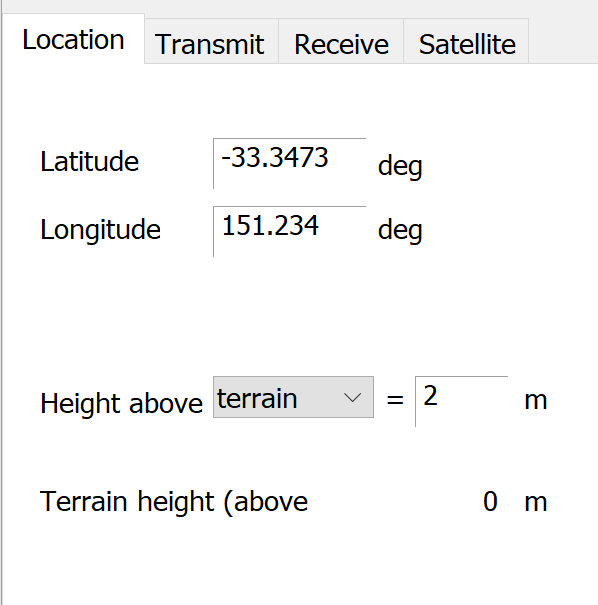
Type in the latitude and longitude in degrees: it should use the same reference geoid as the terrain data, preferably WGS84.
You can also give the earth station height – either above the local terrain or above mean sea level. The terrain height is derived from the terrain database(s) you have chosen.
The location will default to the value used in your last Assessment.
Horizon Elevation
The local horizon elevation around the site should be included in the calculation. Local shielding can have a dramatic effect on the coordination distance in a given direction.
To enter the data defining the horizon elevation profile around the earth station, click Horizon Elevation on the Location tab of the properties side bar.
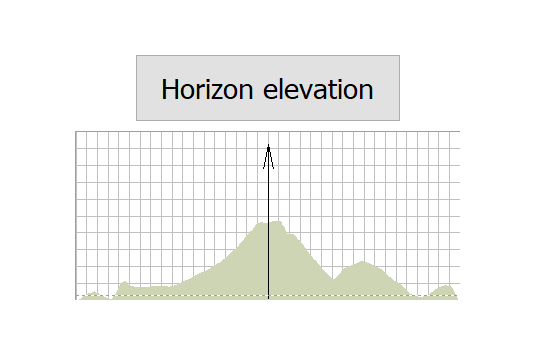
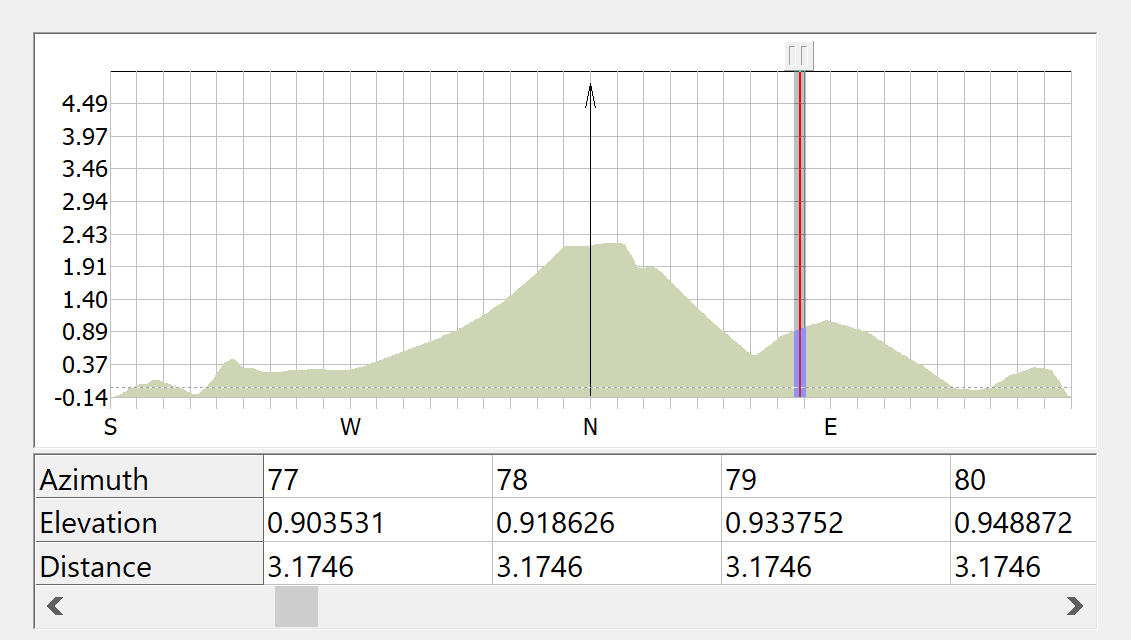
The horizon elevation dialog will be displayed. From here you can specify the elevation to the horizon for all azimuths around the earth station.
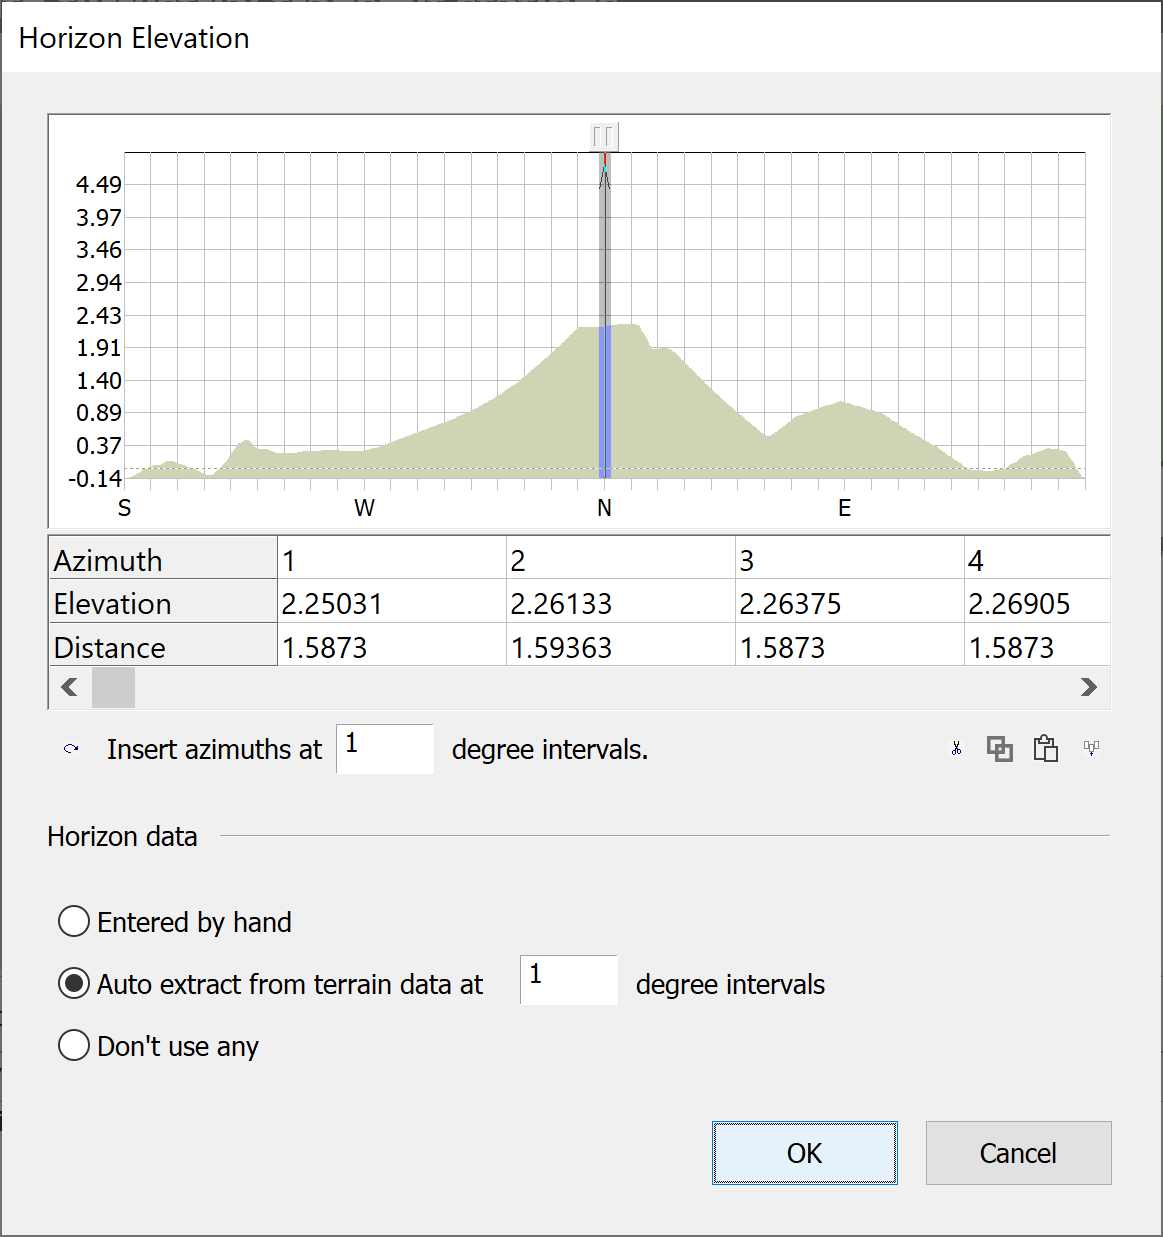
There are two ways to specify the horizon elevation. If you have measured the horizon elevation at the earth station site, then you can enter this data by hand. Choose Entered by hand in the Horizon Data section then simply type in the azimuth and elevation pairs in the table.
If you have this data in another format, you can import it into Microsoft Excel (or any other spreadsheet program). Modify the imported data it so that it is in two rows with the azimuths in the top row and the corresponding elevations and distances in the bottom rows, then copy and paste the data into the table.
If you don’t have any measured data, then the software can calculate the elevations for you using the terrain data loaded on your system. To choose this option, select Automatic from terrain data and specify the angular resolution you want to use to sample the data. The data will be calculated automatically and placed in the table.
If you don’t have any measured data and you don’t have any terrain data then you can choose not to use any horizon data. In this case the gain at the horizon will be assumed to be zero. To select this option, choose Don’t use any in the Horizon Data section.
The chart at the top of the dialog shows a plot of elevation angle against bearing. The plot is always centred on the bearing that corresponds to the earth station pointing angle. In the centre of the chart a thick grey line with an arrow at the top indicates this angle.
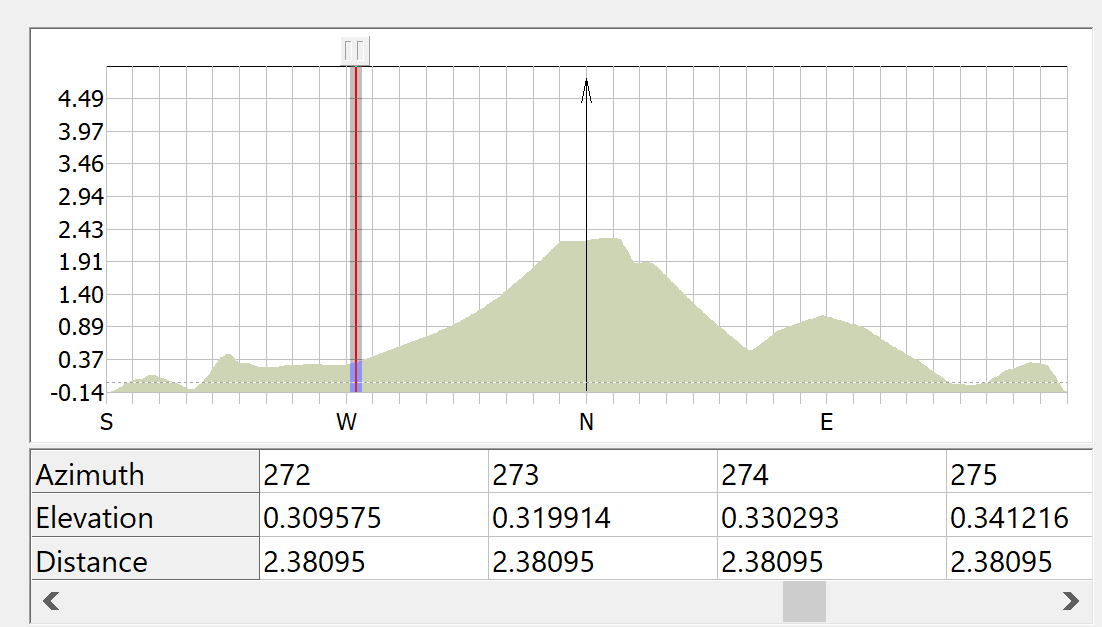
The table below the chart shows the horizon elevation data. Only a section of this data can be displayed at any one time. The leftmost part of the data visible in the table is indicated on the chart by a vertical red line. At the top of the red line is a button. You can click and drag this button to look at different sections of the data table. Alternatively, you can click the scroll bar below the table.
Transmit and Receive RF Characteristics
An earth station can provide two different types of service. It can act as a transmitter, a receiver or both at the same time. The types of service offered by the earth station are determined when you make the initial selection of Service type
For each type of service offered, a tab will appear as part of the earth station properties on the Sidebar. The tabs allow you to define the characteristics for each type of service. A Receive tab will appear if receive services have been selected and a Transmit tab will appear if transmit services have been selected.
The picture below shows the situation where both transmit and receive services have been selected. The Transmit tab is selected.
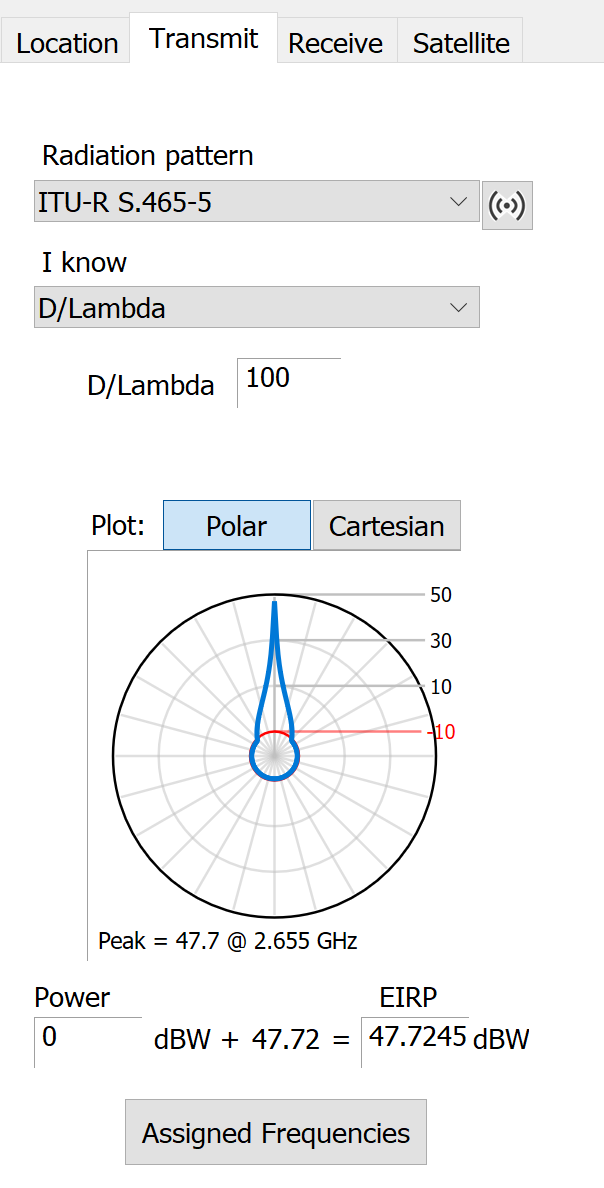
The transmit service characteristics comprise the antenna, power levels and assigned frequencies. The receive service characteristics are identical, with the exception of power levels which are obviously not applicable and the inclusion of system noise parameters needed in I/N calculations.
The following sections describe these characteristics.
Antenna Properties
The antenna performance is modelled using a radiation pattern. You can choose a radiation pattern by clicking in the Radiation pattern list.
Visualyse Coordinate provides a number of standard patterns that have been defined and approved by the ITU. These patterns define the antenna gain as a function of off-axis angle. You can select one of these from the list.
Most of the standard patterns also require D/ as an input. However, some patterns depend on other parameters for example beamwidth, efficiency or peak gain.
These parameters are all related and you can specify the antenna with at least two parameters. Some Radiation patterns assume values for a parameter –e.g. efficiency or diameter and therefore in practice you may have one or two parameters that define your pattern.
Under the ‘I know the’ list, you should select the parameter or the pair of parameters that you know and then enter the values in the fields that appear.
Custom Radiation Patterns
In addition to the standard radiation patterns, if you know the characteristics of your antenna, you can define your own. To do this click the ![]() button next to the Radiation pattern drop-down list. This will display the Antenna Radiation Patterns dialog.
button next to the Radiation pattern drop-down list. This will display the Antenna Radiation Patterns dialog.
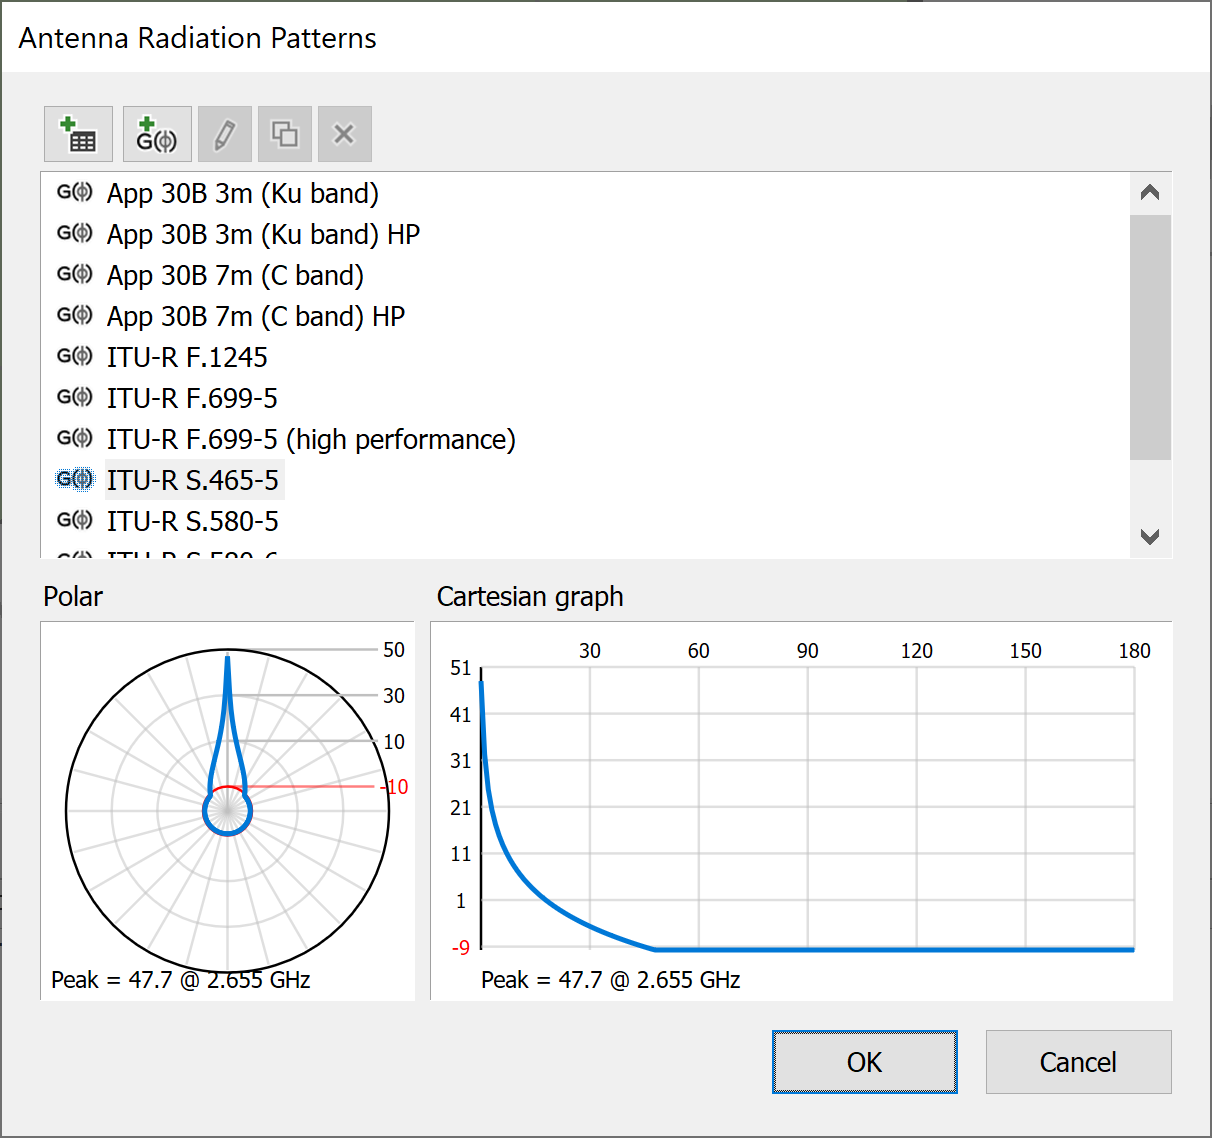
At the bottom of the dialog, there are two charts. If you click on a particular radiation pattern in the list, the charts will change to show charts for the selected pattern. Both charts show the variation in gain with off-axis angle. The left-hand chart shows a polar plot with gain measured from the centre outward and off-axis angle measured as an angle from the vertical. The right-hand chart shows a standard line graph with gain plotted on the y-axis against off-axis angle on the x-axis.
There are two types of radiation pattern:
- a mask defined by an Equation
- a mask defined by a Gain Table.
Equation Radiation Patterns
Equation patterns are defined as a mathematical function of off axis angle. These are indicated by a ![]() symbol next to the pattern name in the list. All the standard ITU patterns are equation patterns.
symbol next to the pattern name in the list. All the standard ITU patterns are equation patterns.
You can add new Equation gain patterns based on a piecewise function defining the main lobe, sidelobes and backlobe levels. To create a new equation pattern, click ![]() . A new pattern will be added to the list and the Custom Equation Pattern dialog will appear.
. A new pattern will be added to the list and the Custom Equation Pattern dialog will appear.
To define the pattern all you need to do is fill in the blanks.
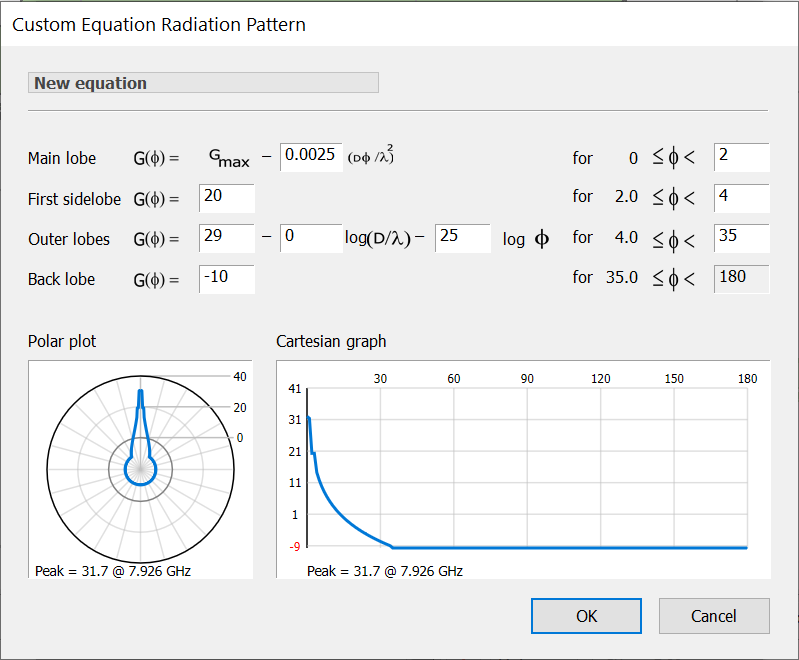
At the bottom of the dialog, two charts (polar and rectangular plots) provide a preview of what the pattern will look like. As you define the pattern, your changes will immediately be reflected in the charts.
To specify a name for the pattern, click where indicated at the top of the dialog, then type a name when the edit cursor appears, then press return.
Gain Table Patterns
Gain table patterns are defined by a set of gain, off-axis angle pairs. These are indicated by a ![]() symbol next to the pattern name in the list.
symbol next to the pattern name in the list.
To create a new gain table pattern, click ![]() . A new pattern will be added to the list and the Custom Gain Table Pattern dialog will appear.
. A new pattern will be added to the list and the Custom Gain Table Pattern dialog will appear.
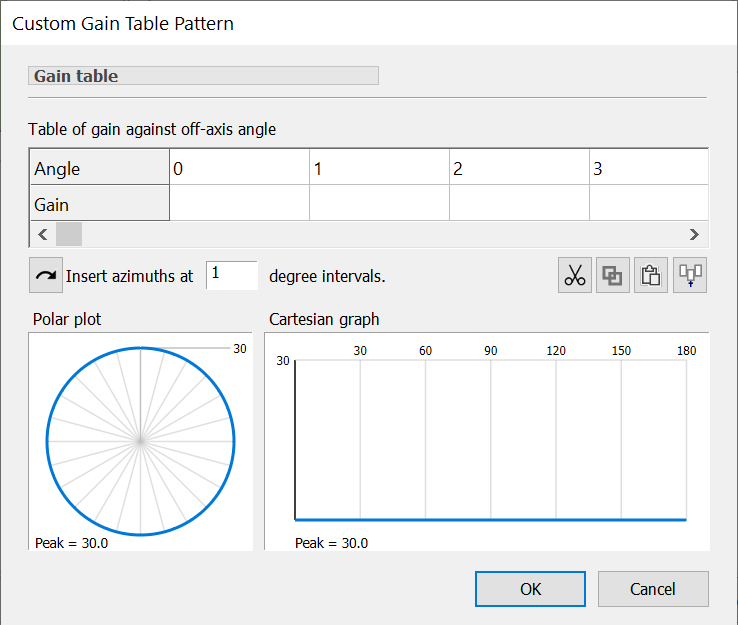
At the top of the dialog is a table. You need to fill in this table with pairs of off-axis angle () and gain. You can copy and paste data from other applications - Microsoft Excel for example. The polar and rectangular charts at the bottom show a preview of what the pattern looks like as you enter your data.
The picture below shows an example with all the parameters filled in. This particular example is for a 3.7m Andrew antenna applicable for frequencies between 107 and 12.75 GHz.
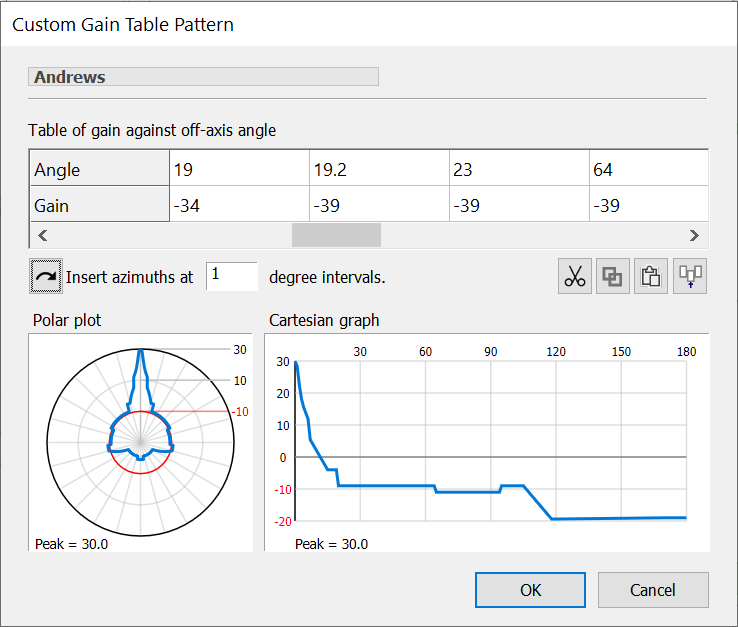
Click OK to save your changes. If you click Cancel, all changes will be lost and the new pattern will be removed from the list.
Editing Radiation Patterns
As well as creating new radiation patterns, you can duplicate, edit and delete existing ones. To edit an existing pattern, double click on it in the list. You can also click the ![]() Edit button to edit the selected pattern.
Edit button to edit the selected pattern.
To duplicate a pattern, first select the pattern you want to duplicate, then click the ![]() Duplicate button. The edit dialog for the new pattern will open immediately.
Duplicate button. The edit dialog for the new pattern will open immediately.
If you want to delete a pattern that you have created, simply select the pattern, then click the ![]() Delete button.
Delete button.
Note that you cannot edit, duplicate or delete the built in radiation patterns.
Transmit Power
For transmit services, a maximum power must be provided. You can provide this as a power level or as an EIRP. Because the two values are related by peak gain, if you enter one, the other will instantly be updated.
The power levels are specified at the bottom of the Transmit tab.
Assigned Frequencies
The assigned frequencies are the frequencies on which the earth station transmits or receives. The complete set of assigned frequencies is called the frequency plan.
By default, Visualyse Coordinate creates assignments for each allocation listed in the Radio Regulations for the selected band.
Frequency Plan Editor
To change the frequency plan, click on Assigned Frequencies for the appropriate antenna.
The Frequency Plan Editor dialog will appear.
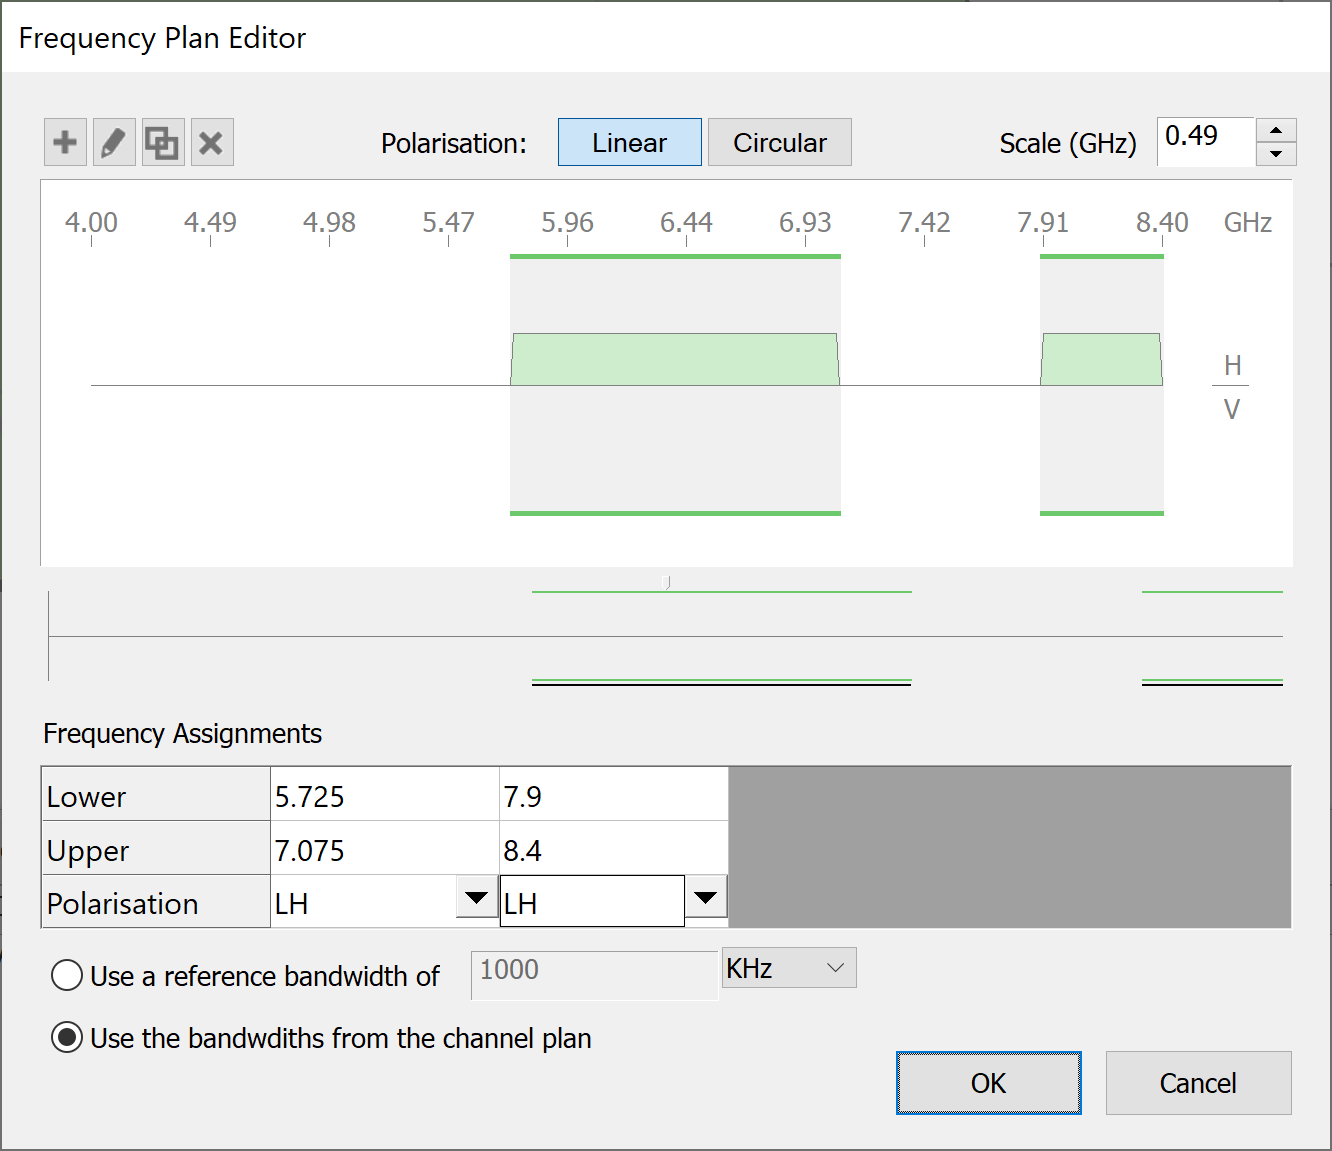
A portion of the frequency plan is shown in detail in the large box at the top of the dialog. The central horizontal line is the frequency line. The frequency increases from left to right along the line. The scale can be adjusted so that you can see more of the frequency line.
The ‘D’ shaped bars above and below the frequency line represent frequency assignments. Assignments above the line have either horizontal or left-hand circular polarisation. Assignments below the line have either vertical or right-hand circular polarisation.
Navigation of the Frequency Plan
Immediately below the frequency plan is a preview that shows the complete frequency plan for the earth station.
You can jump to a particular part of the frequency plan by clicking the small pointer next to the frequency plan preview and dragging it to the part of the plan you want to see. The frequency plan will automatically scroll as you do this.
Any assignments that have been include are shown as black lines or dots below the preview.
You will notice that the frequency pan and the preview contain shaded areas. These indicate areas of spectrum where there are allocations in the Radio Regulations for the selected service.
You can change the scale for the frequency plan by typing a value in the Scale box. The scale is the frequency spacing in GHz.
Adding Assignments
There are two ways to add assignments to the plan.
-
Draw them directly on to the plan, using the mouse
-
Type the bounding frequencies, and select a polarisation
To draw new assignments this, first click the ![]() button at the top of the frequency plan to go into draw mode. Click on the top or bottom of the frequency line depending on the type of polarisation you require. Hold down the mouse button and drag out an assignment block. Release the mouse button to complete the action.
button at the top of the frequency plan to go into draw mode. Click on the top or bottom of the frequency line depending on the type of polarisation you require. Hold down the mouse button and drag out an assignment block. Release the mouse button to complete the action.
When you have finished drawing assignments, click the ![]() button again to exit draw mode.
button again to exit draw mode.
Below the frequency plan, is the table of frequency assignments. You can type the assignments straight into this table. To add an assignment to the end of the list, click the ![]() button. The new assignment will appear in the frequency plan and in the table.
button. The new assignment will appear in the frequency plan and in the table.
To edit the assignment, simply click in the table and type new values for the lower and upper frequencies. Click in the polarisation cell and a drop down list of polarisation options appears to aid selection.
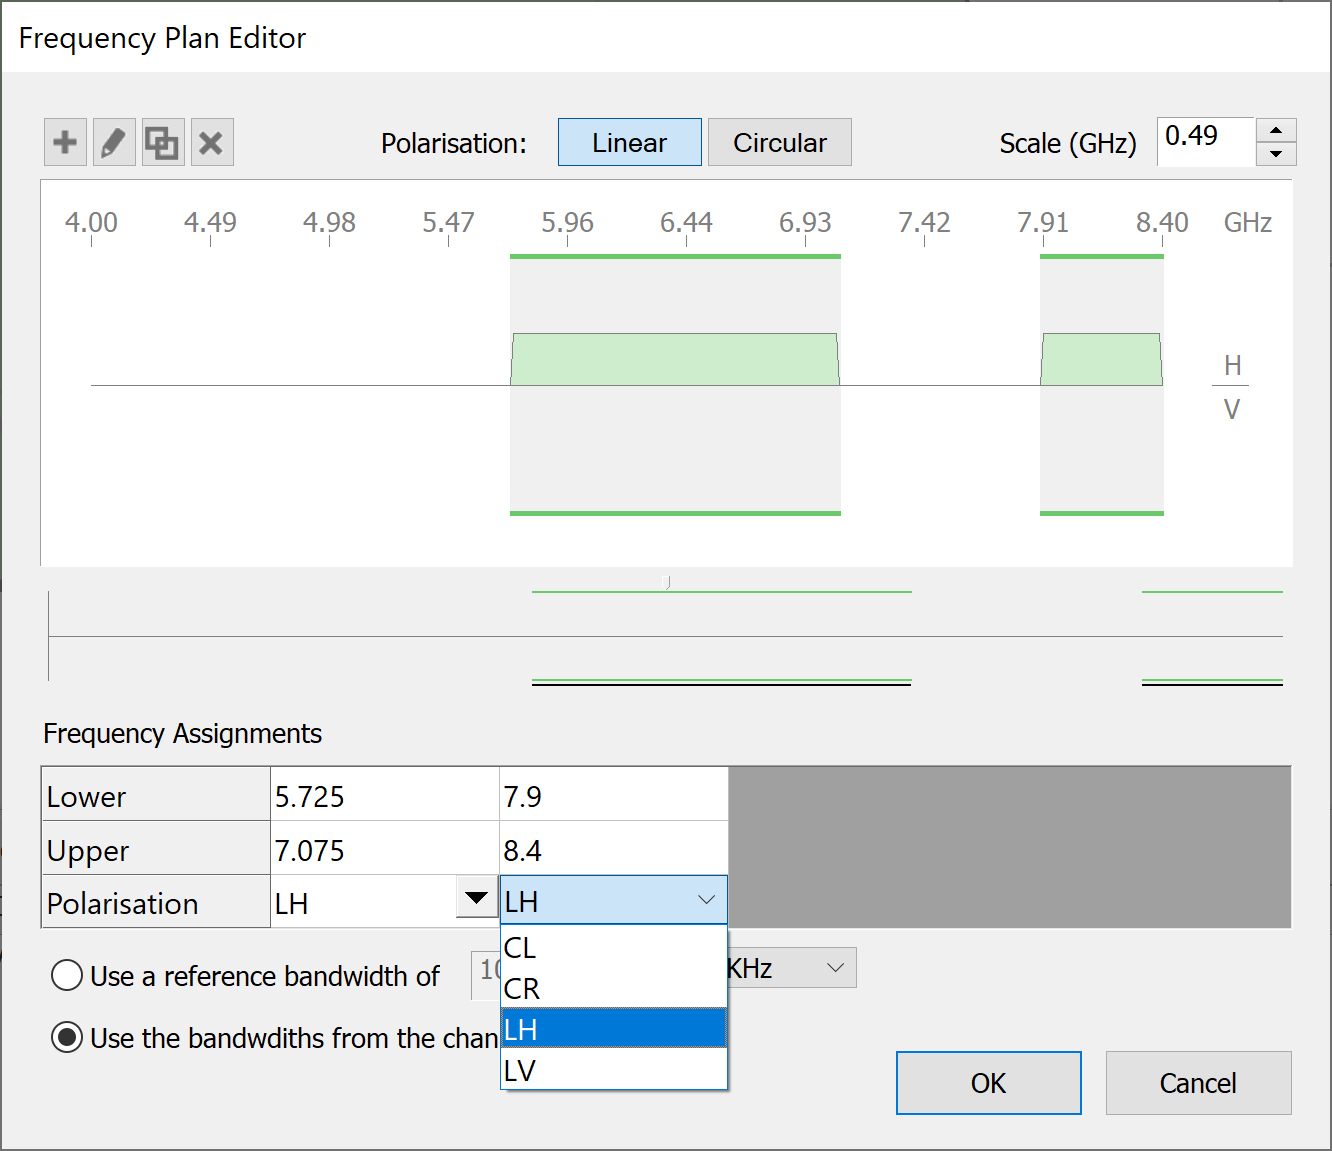
When you have finished typing in the data, the frequency plan will update to show the new assignment.
Editing Existing Assignments
You can change the properties of an existing assignment. Again, there are two ways of doing this.
-
Using the mouse to change the properties of the graphical representation of the assignment
-
Edit the textual data relating to the assignment.
The first method involves interacting directly with the assignment. Using direct interaction, you can change the size of an assignment, move an assignment up and down the frequency line and change the polarisation.
To move an assignment:
- Hover the mouse pointer over the assignment: you will see the cursor change
- Click and hold the mouse button, then drag the assignment to the desired position.
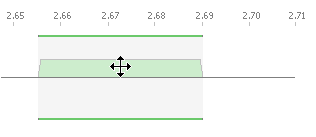
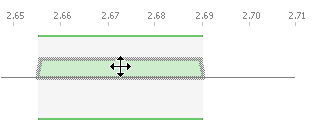
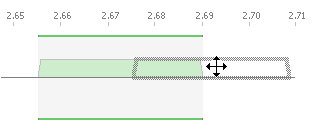
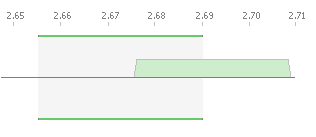
To change the size of an assignment:
- Allow the mouse pointer to hover over one end of the assignment: you will see the cursor change.
- Click and hold the mouse button, then drag it to the desired frequency.
- Release the mouse button to complete the action.
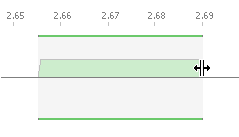
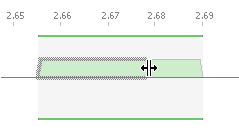
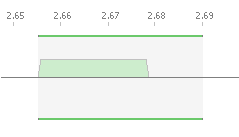
If you drag a assignment to the other side of the frequency line, it will change polarisation.
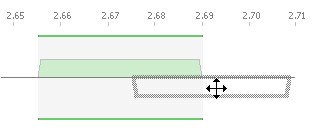
The second method of changing assignments involves editing the data in the Frequency Assignments table. You can scroll the table to locate the assignment you want to change and then simply edit the values in the table.
Deleting Assignments
Deleting an assignment is very simple. Just click on the assignment you want to delete, then click  .You can also select the assignment and then hit the Delete key. Alternatively, you can just delete the data from the table of frequency assignments.
Duplicating Assignments
Assignments can be duplicated. This allows you to create assignments that are based on other assignments. To duplicate an assignment, first click on the assignment, then click  . The new assignment will become the selected assignment in the plan. You can then edit this assignment as described above.
The table of frequency assignments also allows you to do this. Simply copy the data from one or more assignments and paste it in another part of the table (CTRL-C to copy and CTRL-V to paste).
Satellite
The earth station will point its antenna in a particular direction - determined by the space station with which it is operating.
If the space station is in geostationary orbit, the earth station will have a fixed pointing direction, usually directly at the space station. However, if the space station is in non-geostationary orbit, the earth station will usually track a particular space station.
The pointing direction affects the antenna gain used in the construction of the coordination contours.
For earth stations operating with geostationary space stations, two pointing options are available. To point the antennas at a selected satellite, or to give a satellite longitude and inclination as user inputs. The Satellite tab for GSO satellites is shown below.
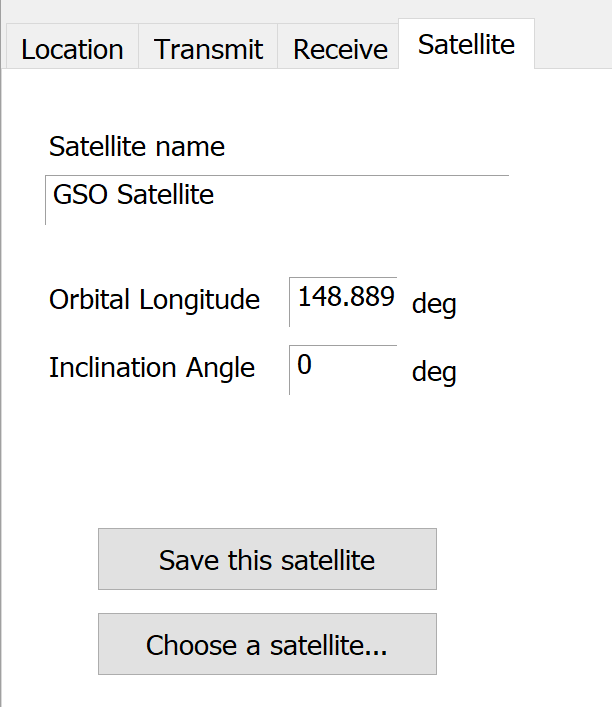
Click on the ‘Choose a satellite …’ button and you are given a list of satellites.
If you type in the Longitude and Inclination, you have the option to save this satellite to your database.
The Satellite Tab for non-GSO satellites is shown below.
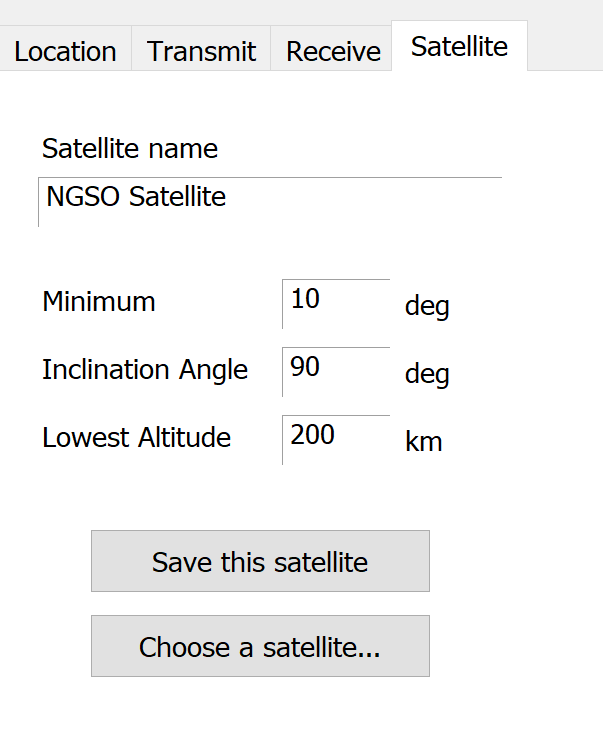
Again, if you click on the ‘Choose a satellite …’ button you are given a list of satellites.
If you type in the parameters you have the option to save the satellite to your database.
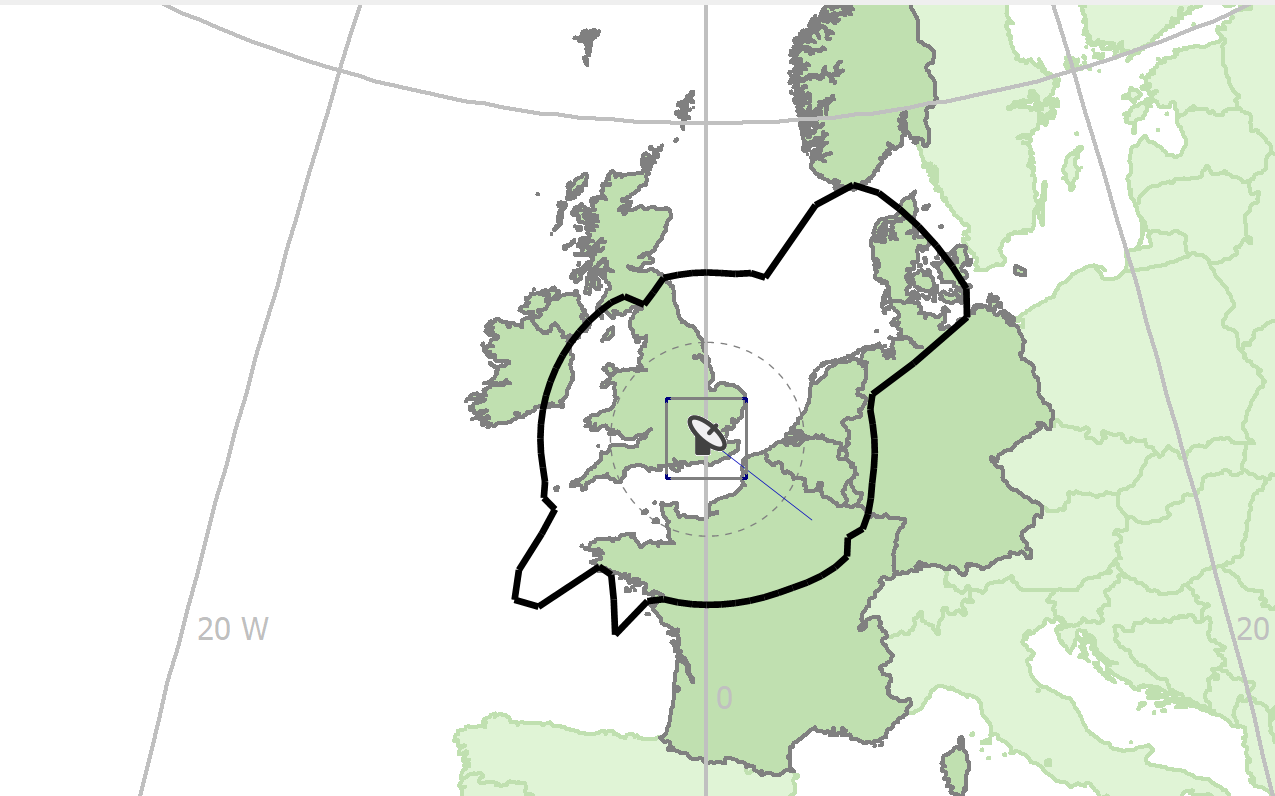
For earth stations operating with GSO satellites, the pointing direction is indicated on the map by a blue line. The line shows the azimuth along which the earth station antennas are pointed.
Coordination Contours
Once you have defined your earth station parameters Visualyse Coordinate allows you to analyse coordination contours.
Each possible sharing scenario (Receive, Transmit, and Reverse Band) will have its own coordination contour. Mode 1 and Mode 2 contours are generated automatically as soon as a location has been defined for the earth station. Each time you refine or change the earth station data, the contours are updated.
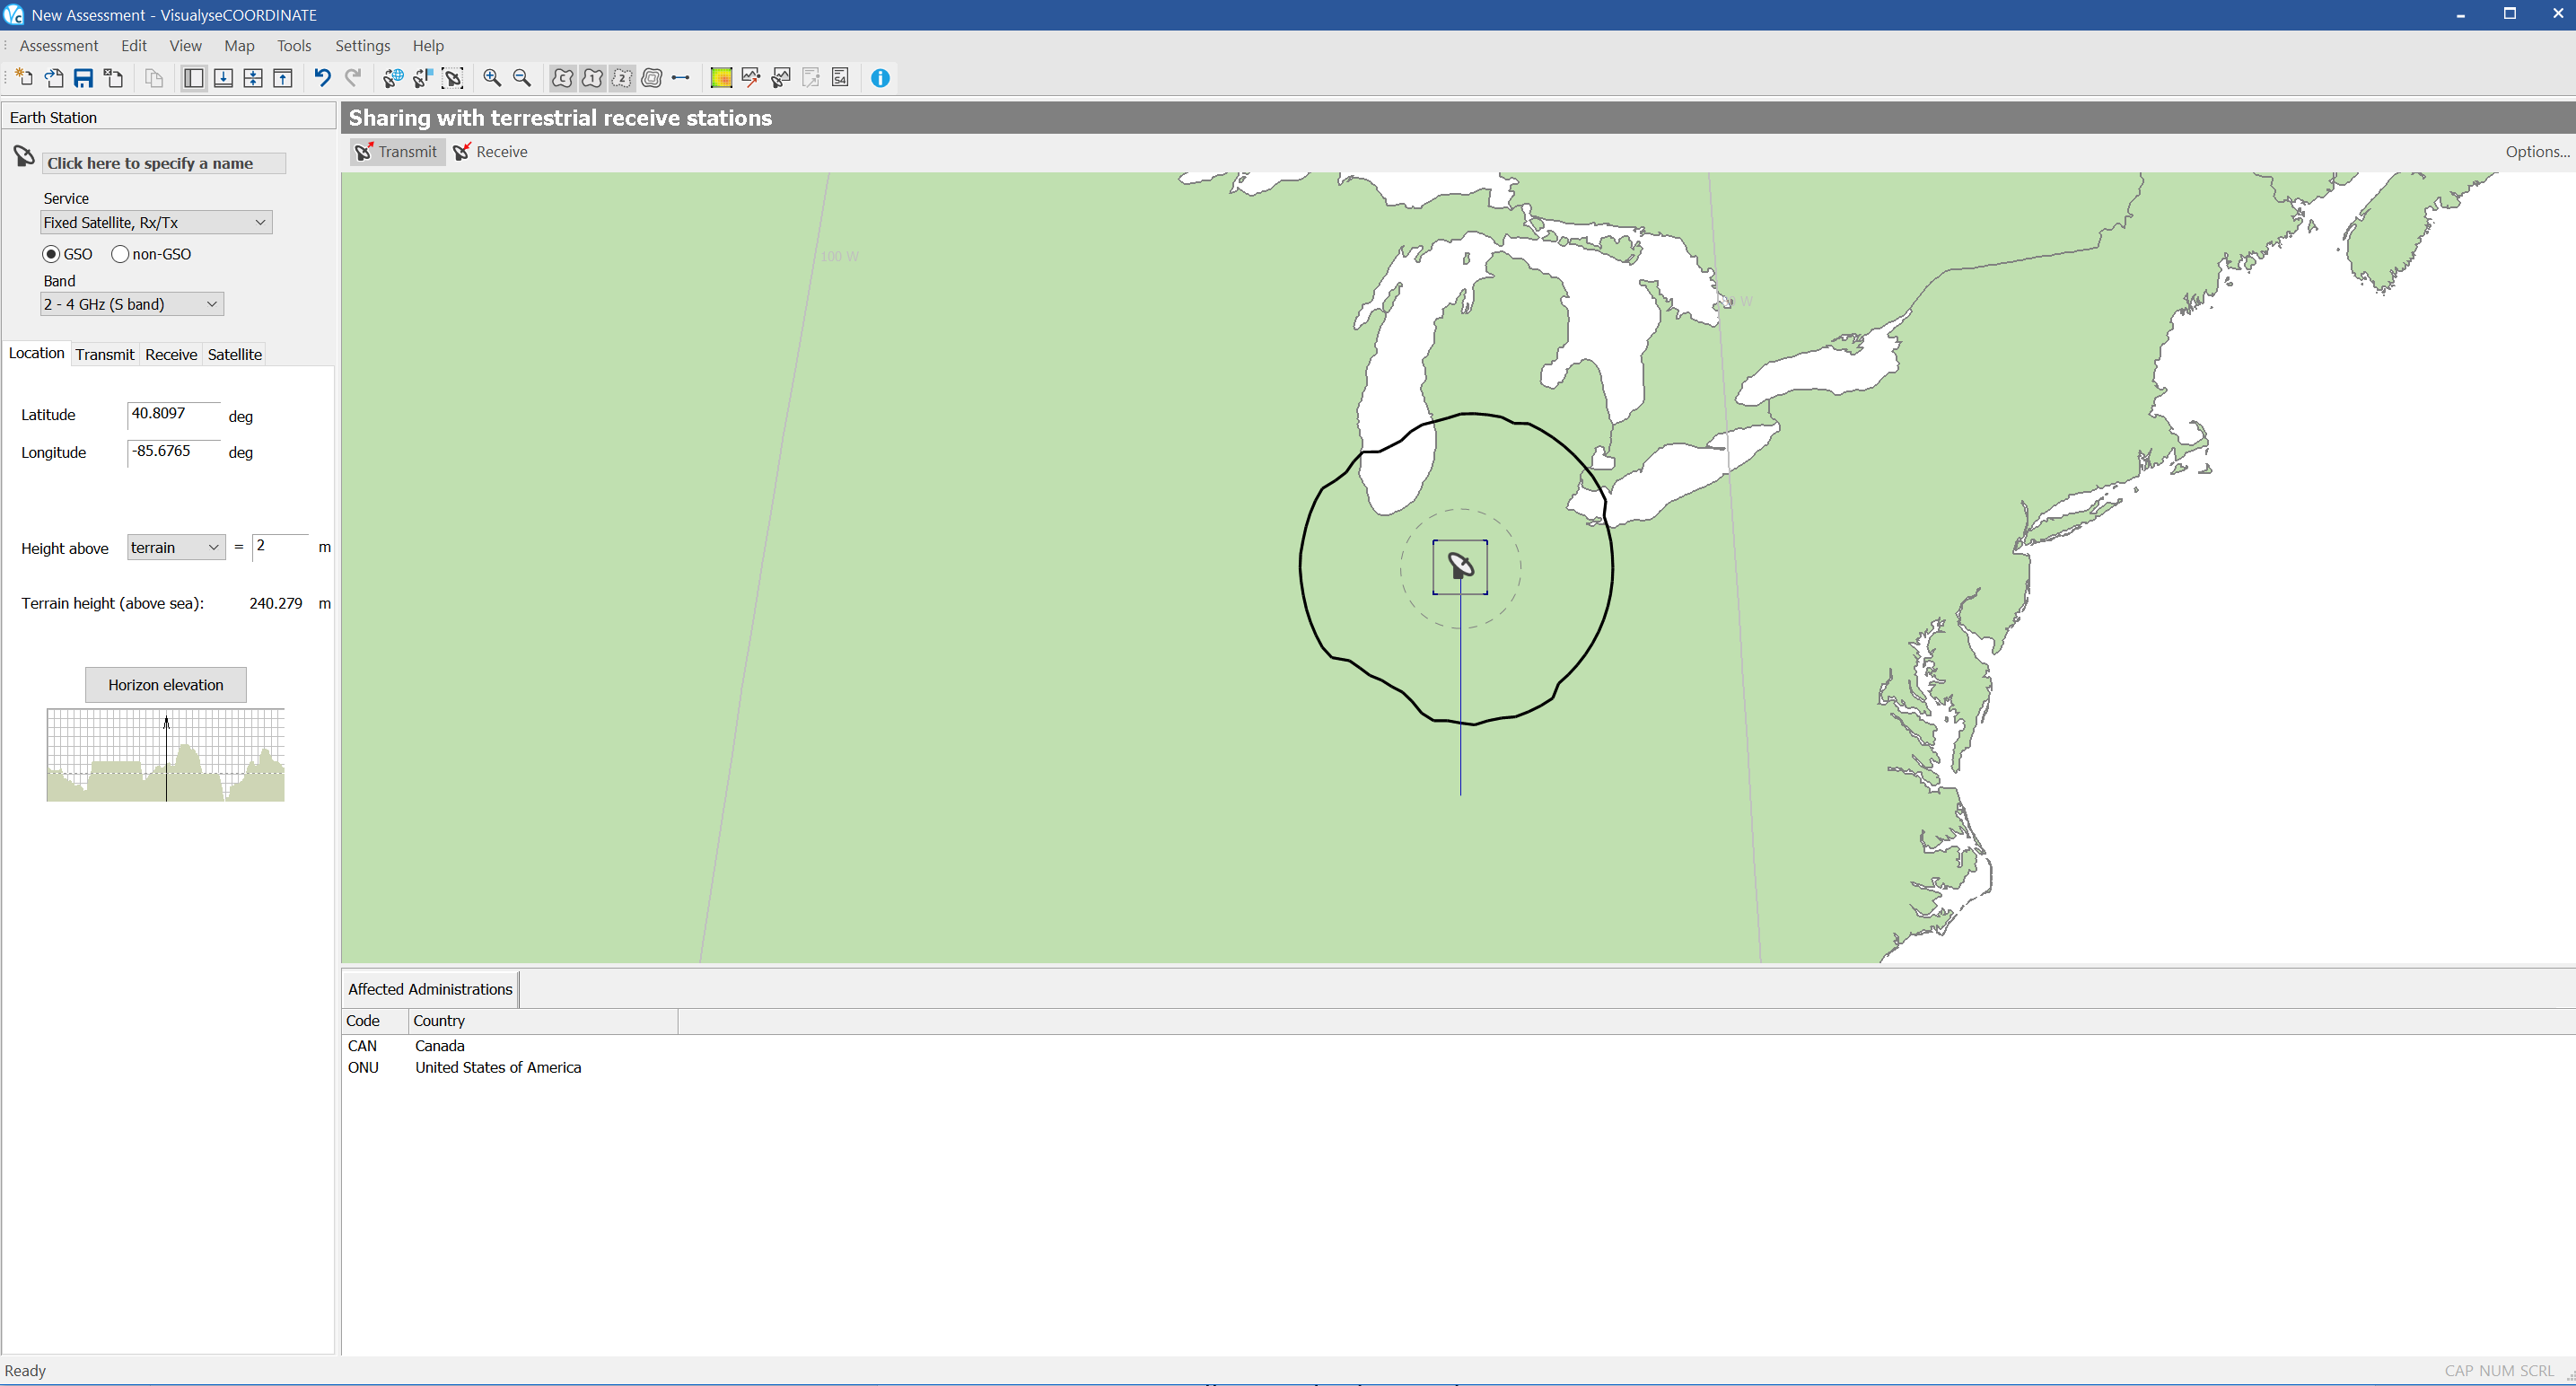
The mode 1 contour is shown as a grey line. The mode 2 contour is shown as a dotted grey line. The actual coordination contour is the outer envelope of the mode 1 and mode 2 contours. This is shown as a thick black line.
By default all the all these contours are visible. You can hide the contours using the toolbar. Click the ![]() button to show or hide the mode 1 contour. Click the
button to show or hide the mode 1 contour. Click the ![]() button to show or hide the mode 2 contour. Click the
button to show or hide the mode 2 contour. Click the ![]() button to show or hide the coordination contour.
button to show or hide the coordination contour.
In addition to the mode 1 and mode 2 contours, you can also display auxiliary contours.
These show the contour for more favourable conditions when an improvement by 5 dB is shown (this may come from decreases in power or extra shielding leading to additional propagation loss). To show or hide the auxiliary contours click the ![]() button on the map toolbar.
button on the map toolbar.
The affected administrations (countries which overlap with the contours) are highlighted in a distinct colour on the map. The administrations are also listed in text form at the bottom of the application window along with their ITU country code.
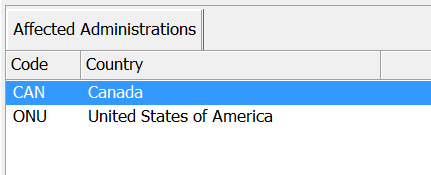
Using the Map View
The map view is displayed underneath the scenario bar and to the right of the Sidebar. The map uses the Azimuthal Equal Distance projection to display any part of the world.
The map is used to display the elements of your analysis. Your earth station, coordination contours and terrestrial assignments are all displayed on the map. When you define a location for a fixed earth station, the map will automatically centre on that location.
Navigating
You can navigate around the map. The software provides several ways of doing this. If you click on the Navigate button  , a miniature map of the world pops up.
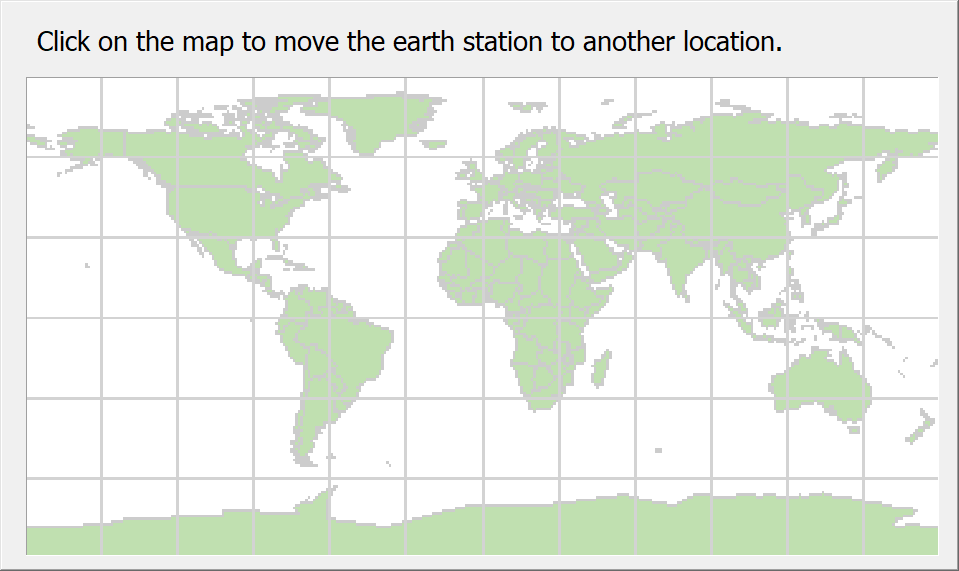
To move to another part of the world, simply click on the map. The pop-up map will disappear and your earth station will be moved to the part of the world that you requested. This will be reflected in the Map View.
If you know the name of the country you want to look at, you can go straight to it. Click the Jump to Country button  . The Jump to Country dialog will appear.
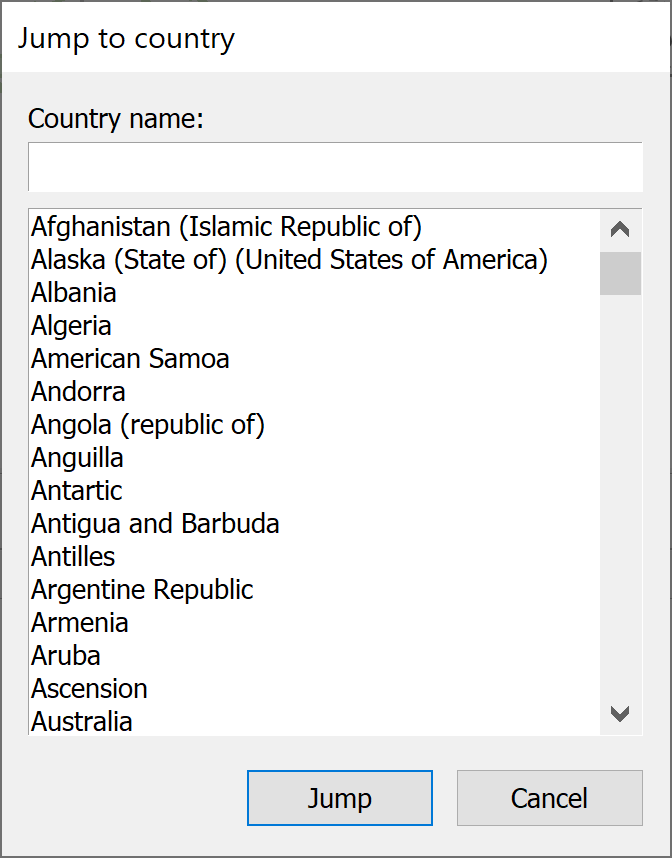
From here you can choose the country where you want to put your earth station. Either scroll through the list to find the country you want or type the name of the country in the name box at the top. As you type, the list of countries will automatically select the nearest match. You can then click Jump. Alternatively, double-click on the country. The map will pan to show the country you selected in the centre of the map and the earth station will be moved to that location.
Zooming
To zoom into the map, click the  button on the toolbar. To zoom out of the map, click the
  button.
If you have a mouse with a wheel, you can also use this to zoom in and out. With the mouse pointer over the Map View, roll the mouse wheel forward to zoom in and roll is backward to zoom out. You may have to click in the Map View first in order for this to work.
Panning
If you zoom in to a level where the complete coordination area will not fit on the Map View, the software will allow you to pan around.
Under these circumstances, when the mouse pointer is in parts of the Map View which do not contain selectable items, the cursor will change to a hand  .
.
Click and hold the mouse button down. The cursor will change to a clenched hand  . As you move the mouse, the map will pan accordingly. When you have the part of the map you want in view, release the mouse button.
Interference Analysis
Your system should have been configured on installation with a database of sharing assignments. This database can be managed and updated easily, but this administration function is not part of the Visualyse Coordinate user interface.
In this section we are assuming that your database is available and in the correct location on your PC or network (See 2.3.3 for more details).
Given a set of terrestrial assignments, Visualyse Coordinate can identify which assignments share spectrum with your earth station, and are within the coordination contour already calculated.
You can then go on to analyse point to point interference between the earth station and the sharing assignments.
Starting the Analysis
To import sharing assignments from your database and start the analysis, click ![]() on the tool bar.
on the tool bar.
Sharing assignments are imported for all sharing scenarios (Receive, Transmit and Reverse Band where applicable).
Sharing assignments are displayed on the map as blue dots. Only the assignments for the currently selected sharing scenario will be displayed, so that the assignments shown are relevant to the contour shown. To see the imported assignments for other scenarios you need to change to another using the Scenario bar.
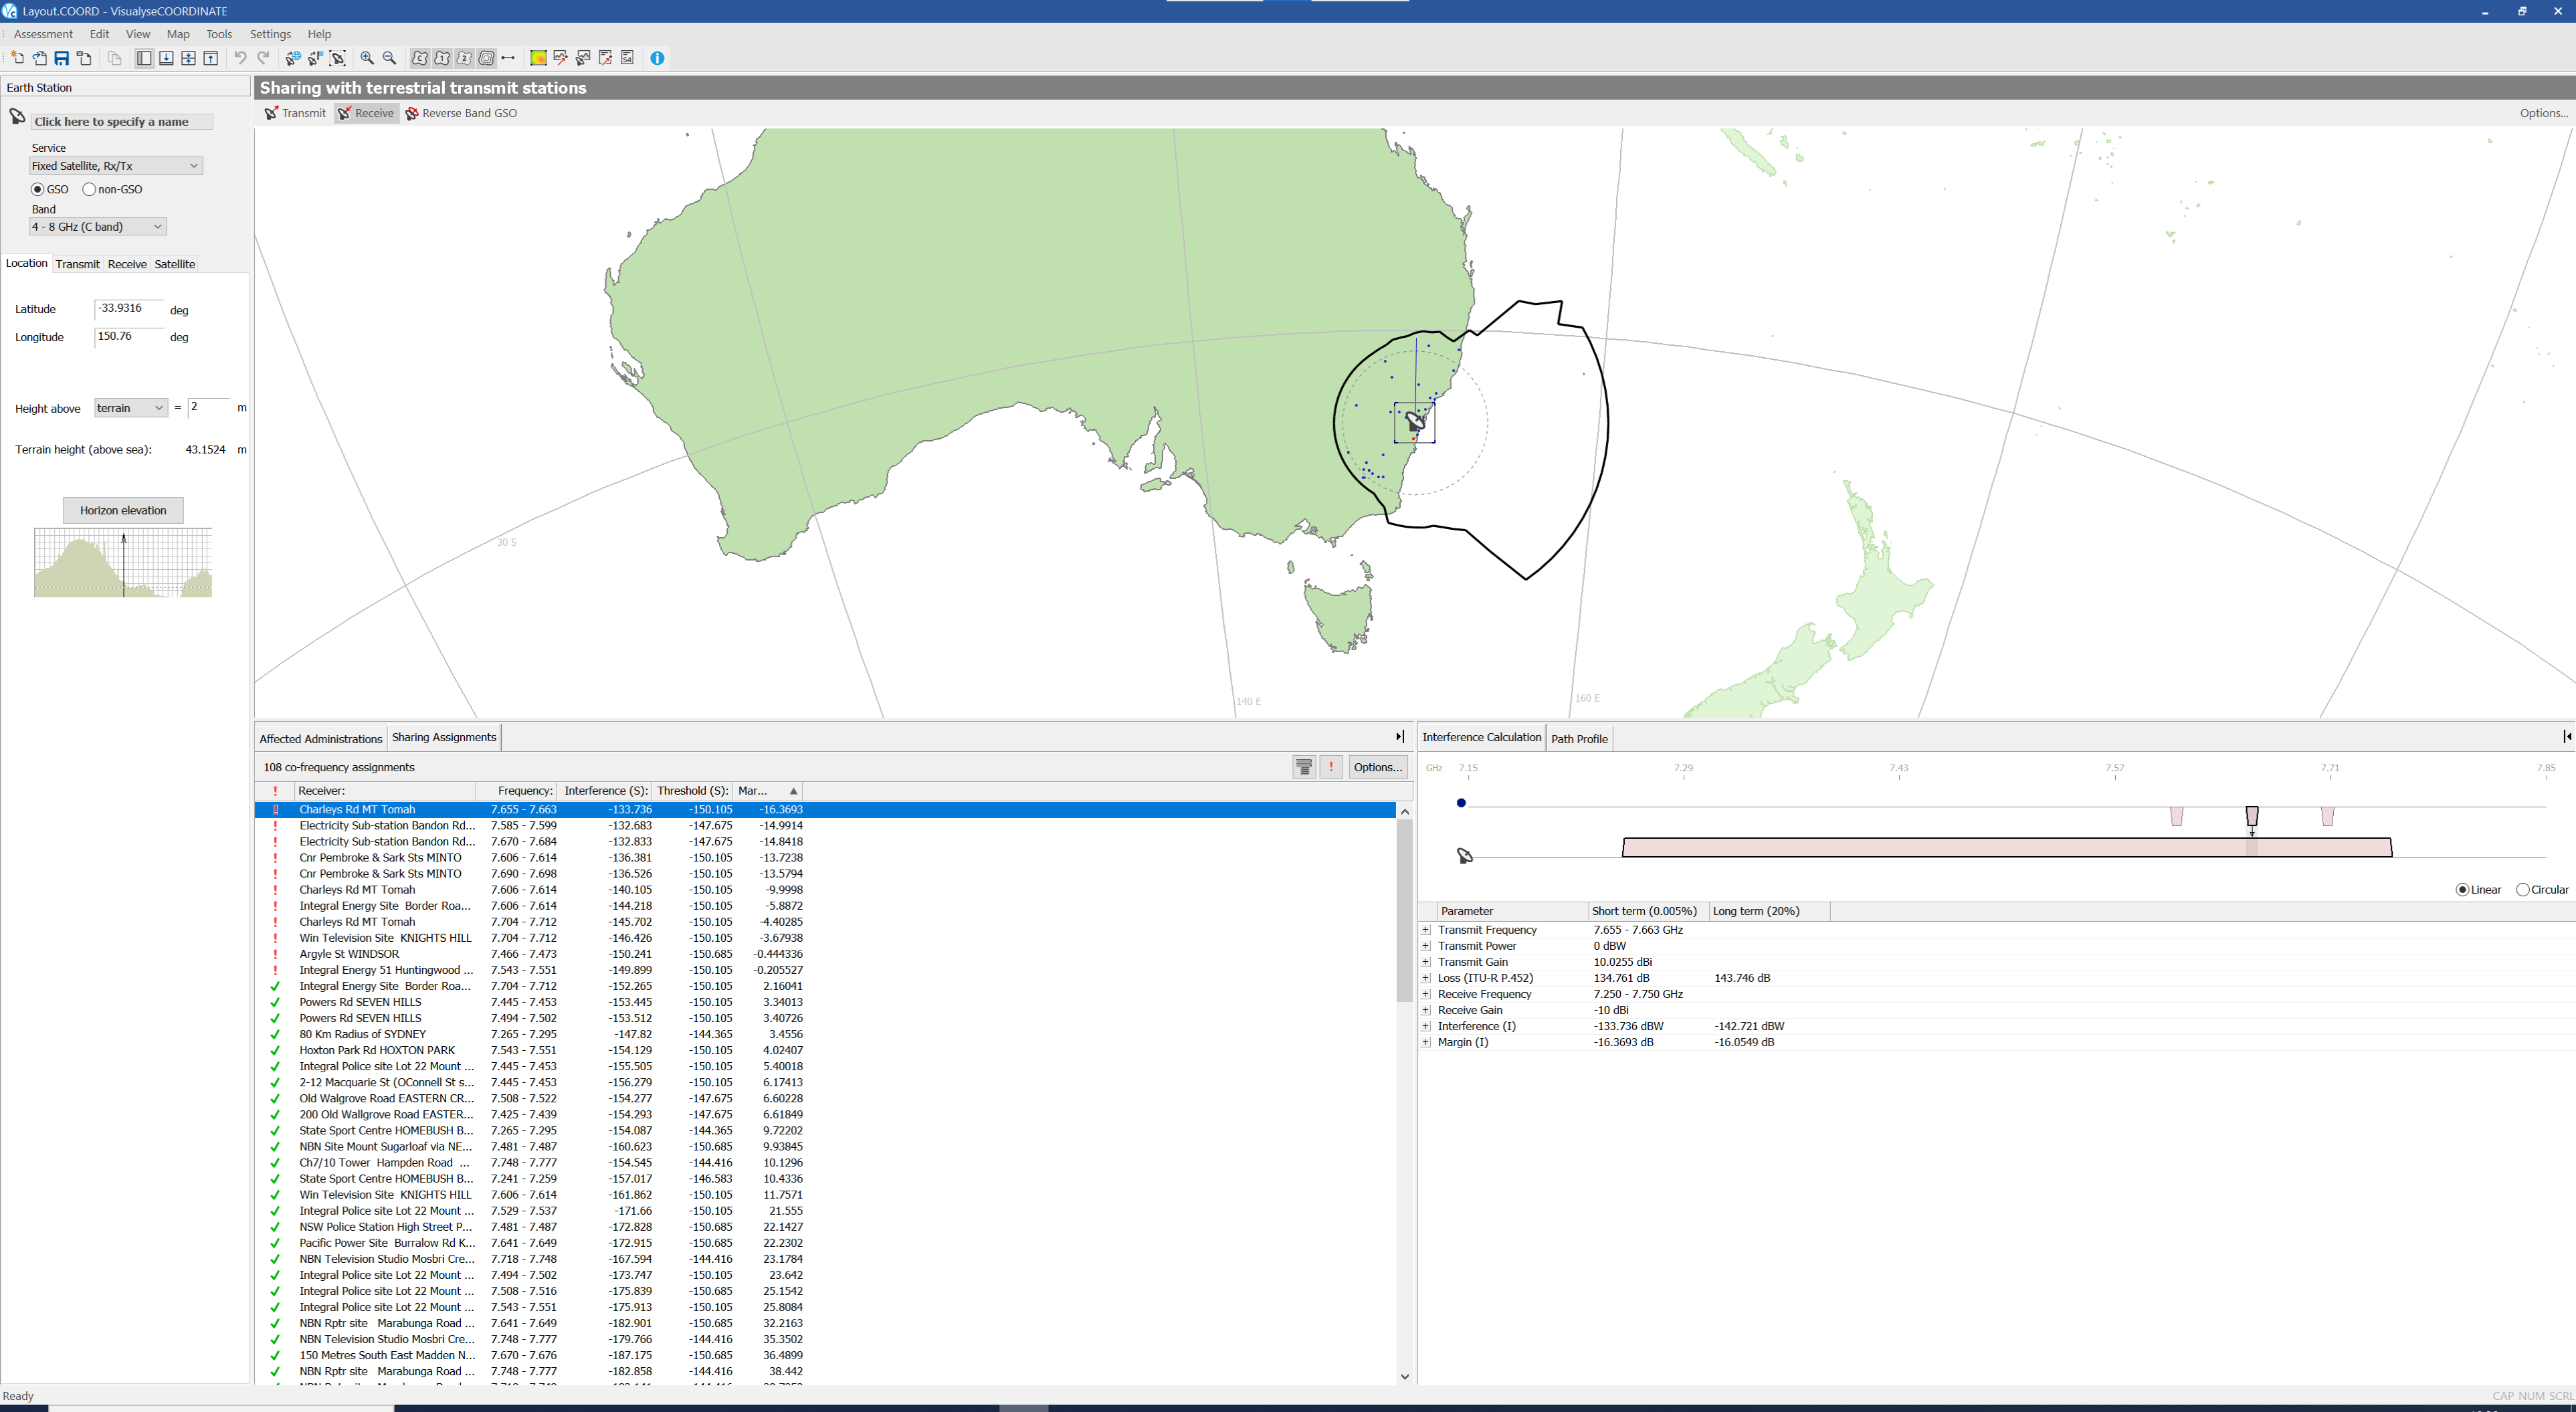
You can select an assignment by clicking on it. A square border identifies the current selection
The properties of the selected assignment will be displayed in the Sidebar. The examples below show the properties for a selected transmit assignment.
The name of the assignment is displayed at the top of the Sidebar. Below this is the owner and service class information. The owner refers to the company or person who owns the assignment. The service class indicates the type of service for the assignment.
Three tabs show the other properties of the assignment. The three tabs are described below.
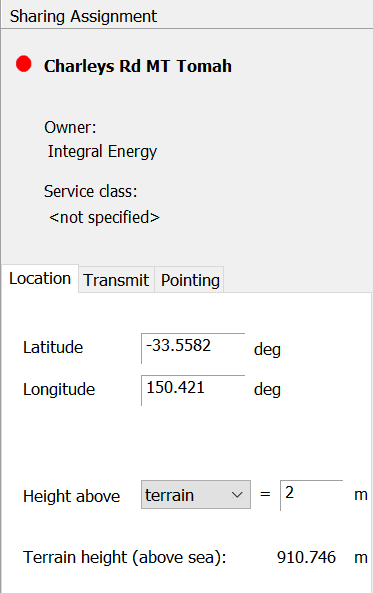
Location Tab
The location tab shows the latitude and longitude of the assignment, the height of the antenna above terrain or sea level and the terrain height.
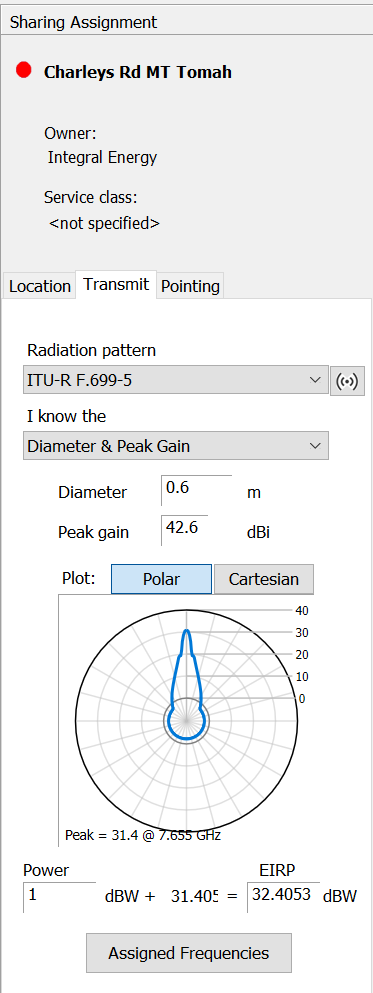
Transmit Tab
The transmit tab shows the transmit properties of the assignment. These include the antenna definition, the transmit power and the assigned frequency.
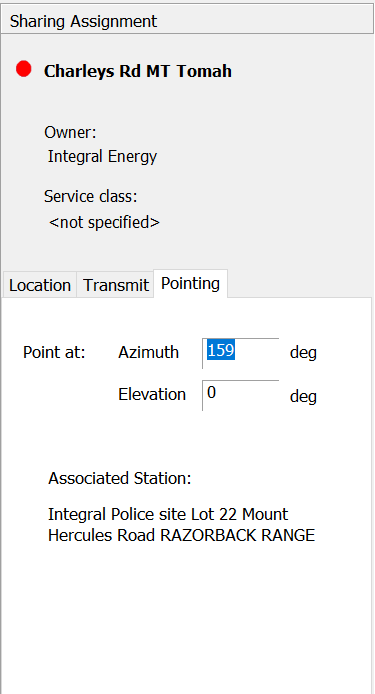
Pointing Tab
The pointing tab shows the pointing direction of the antenna. If the assignment is part of a fixed service link, the name of the intended receiver is also displayed.
You can change any of the properties of the assignment. This is useful during detailed coordination where the software can be used to demonstrate that improving the performance of a particular antenna may reduce interference to an acceptable level.
Any changes you make will only affect the data in your assessment. The software has taken copies of the terrestrial assignments from your database. The information in the database will not be affected.
NOTE: the earth station properties were originally displayed on the side bar. Click on the earth station to restore to them. Alternatively, click ![]() on the tool bar. The earth station is always displayed on top of the terrestrial assignments.
on the tool bar. The earth station is always displayed on top of the terrestrial assignments.
Point to Point Interference
Once you have imported some terrestrial assignments, you are in a position to look at potential interference levels both to and from these assignments.
As soon as terrestrial assignments have been imported, the bottom part of the application window will split into two panes. The left-hand pane will show a list of the sharing assignments that are displayed on the map together with centre frequency and the interference margin they cause or suffer. The right-hand pane will show the interference calculation for the currently selected assignment in detail.

You can change the space occupied by the two panes by dragging the resize bars between them. To do this, move the mouse pointer until it is above the boundary between the two panes. You will notice that the mouse pointer changes.Click and hold the mouse down, then drag the bar to achieve the desired split.
As well as manually moving and resizing the panes, you can automatically move the resize bar from one side of the window by clicking the  and
and  buttons. Clicking
  will move the resize bar all the way to the left hand side of the window. The sharing assignments and affected administrations will be hidden from view. The
  button will change to
  . If you click this button, the resize bar will return to it’s previous position.
Clicking  will move the resize bar all the way to the right hand side of the window. The interference calculations and path profile will be hidden from view. The
  button will change to
  . If you click this button, the resize bar will return to it’s previous position.
Sharing Assignments List
The sharing assignments list occupies the space where the affected administrations were displayed. You can switch between displaying the sharing assignments and the affected administrations by clicking on the appropriate tab.
At the top of the assignments list is a tool bar.
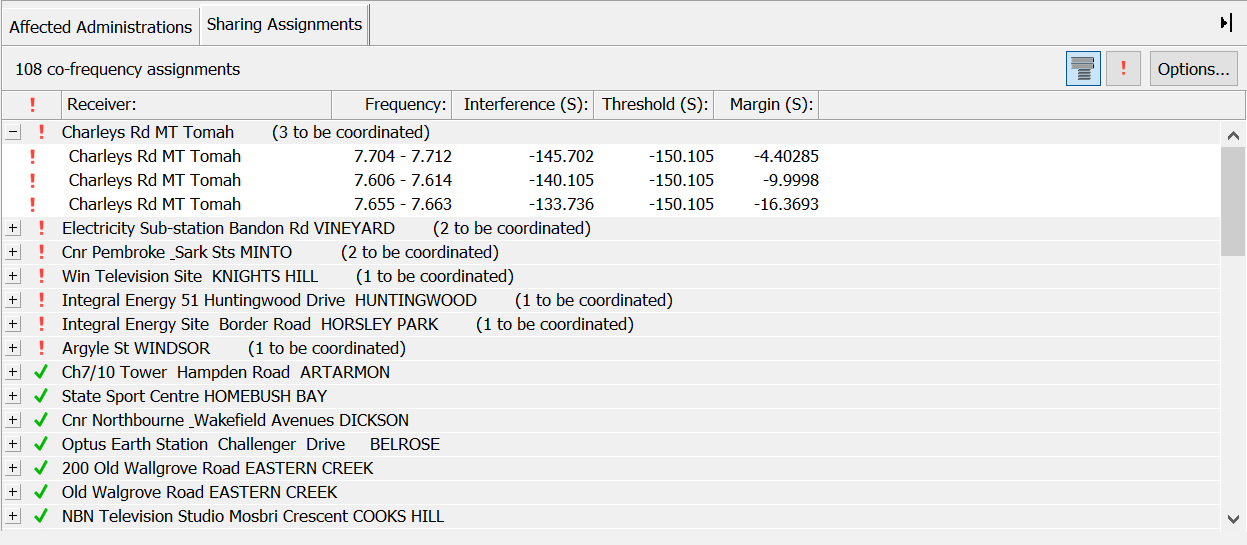
The  button groups the assignments together by site. The analysis is performed for each assignment, treated as a separate link, but the results might be better viewed in terms of a specific site, that will often be coordinated as a group.
The two views below show the assignment list grouped and ungrouped.
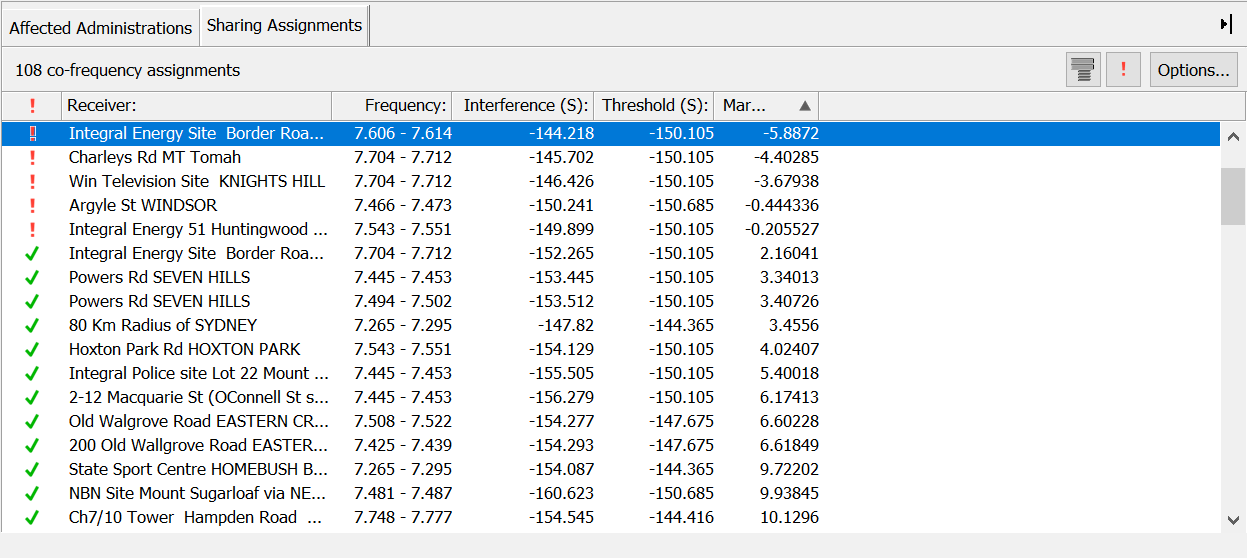
Click the  button to display only those assignments that have excess interference.
Sorting the List
The list of assignments contains a number of columns of data and can be sorted according to the data in one or more columns.
To sort by a single column, click on the column heading. A small arrow will appear next to the column heading to show the direction of sorting. Descending order is indicated by  and ascending order is indicated by
  . To switch between ascending and descending, click the column header again.
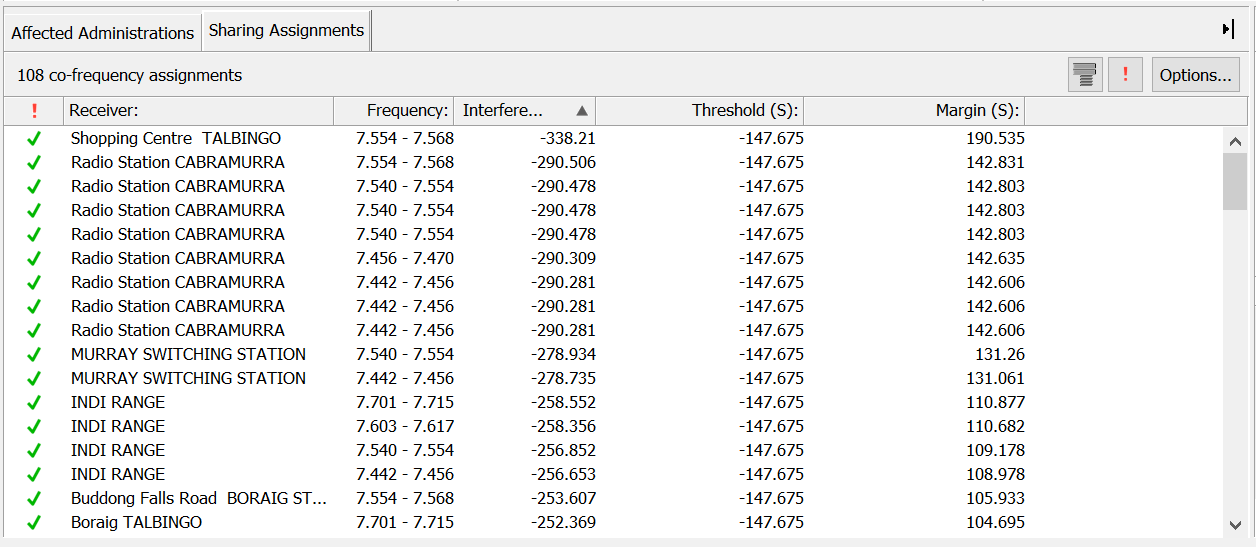
Selecting Assignments for Analysis
If you click on an assignment in the list, it becomes the current selection. The assignment will also be selected on the Map View.
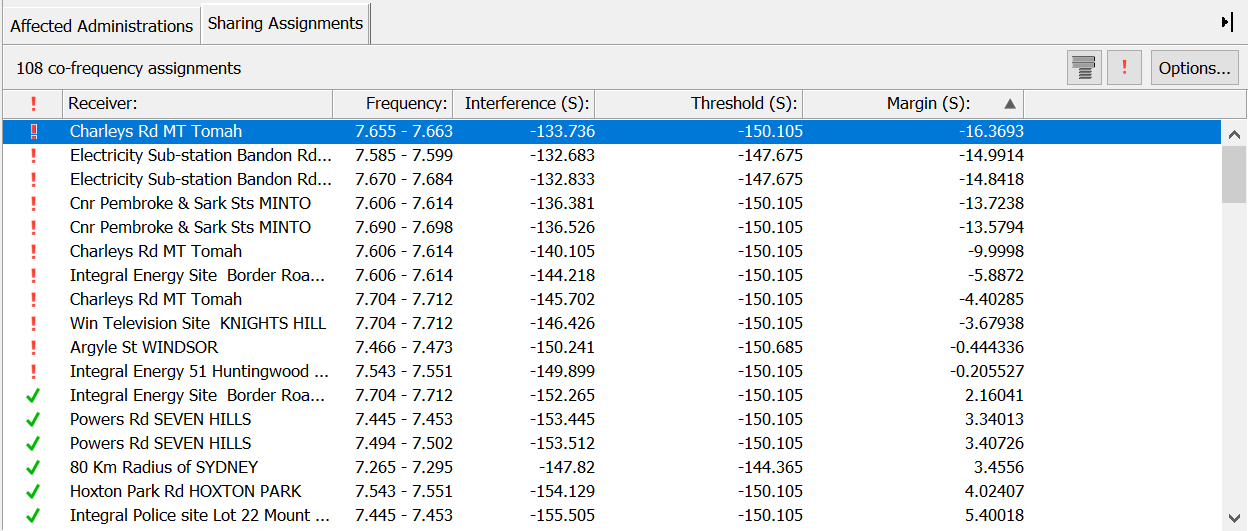
The interference window will change to show the interference calculations and path profile for the selected assignment (this will be interference into or from the earth station, depending on the sharing scenario). See the Interference Calculations section for more on this.
Sharing Assignment Options
You can change what data is displayed in the Sharing Assignments list. To do this click the Options button on the sharing assignments toolbar. The sharing assignment options dialog will appear.
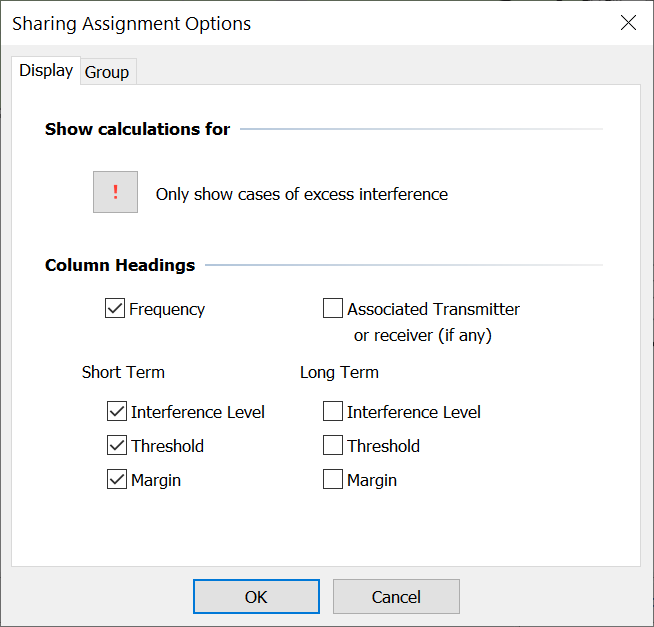
The dialog has two tabs.
Display Options
This tab allows you to specify what is displayed in the sharing assignments list. There are two sections on this tab. The first section allows you to choose which assignments are displayed.
The  button controls whether you display all assignments, or only those where coordination is needed. Click this button to toggle between these two states.
The second section of the Display tab allows you to say which column headings you want. Check the appropriate box to include a particular column heading.
Grouping Options
Although each interference calculation is performed separately on a per assignment basis, it may be better to group the results by site. The Group tab of this dialog allows you to do this by default and also sorts the Groups in the list by one of three options.
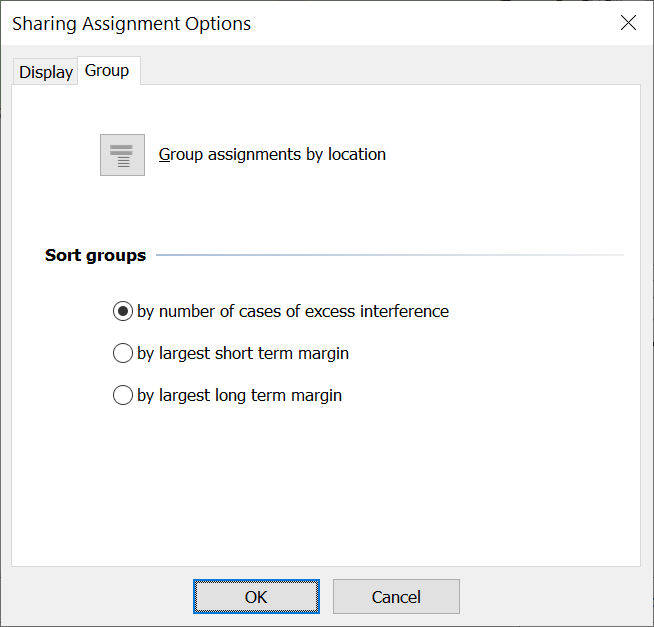
The  button controls whether assignments are grouped by site. Click on the button to toggle this option.
The group list can be ordered by one of three options
-
Largest number of coordinations in a group
-
Largest short term interference excess
-
Largest long term interference excess.
Interference Calculations
The Interference Calculations view shows the interference calculation for the selected assignment. The view shares space with the path profile view. If the interference view is not visible, click on the Interference Calculation tab to activate it.
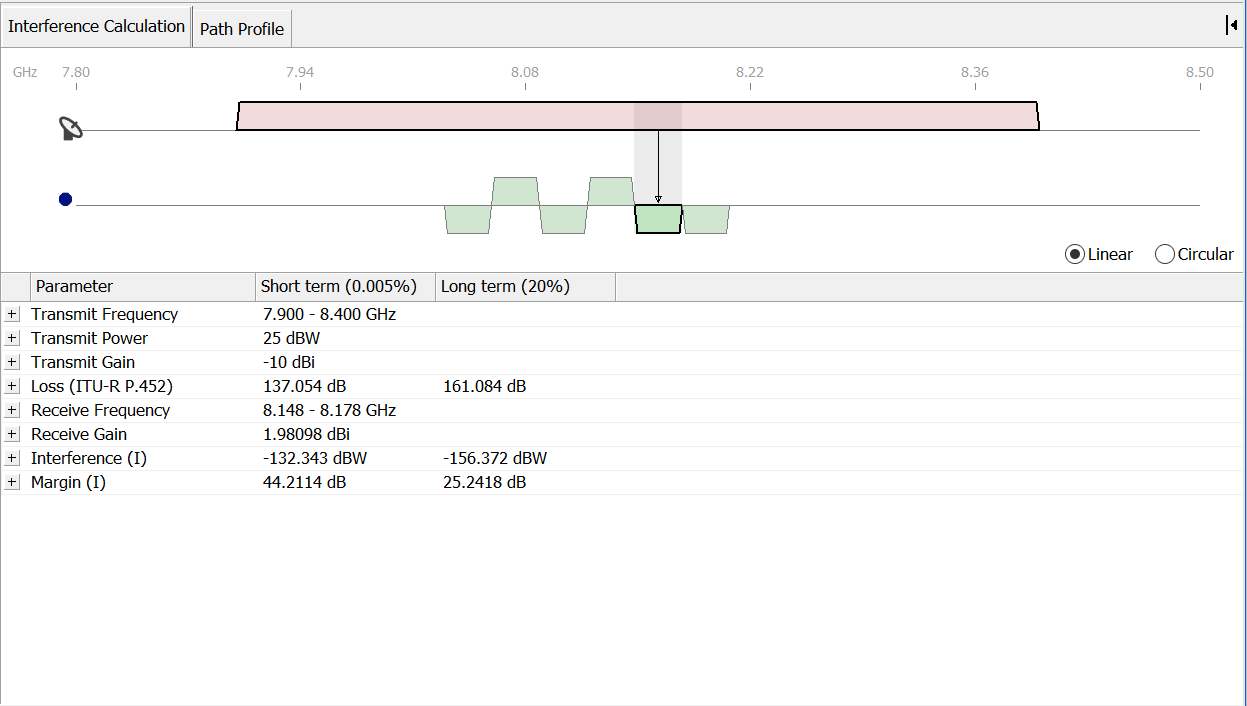
The view is split into two panes. The top pane shows the selected assignment and the earth station frequency plan (note that the assignment could be from another earth station operating in the reverse direction).
The assignment(s) for the interferer are shown at the top of the view and the assignments for the victim are shown at the bottom of the view. An icon indicates whether the interferer is the earth station or the selected sharing assignment.
The terrestrial assignment may overlap with more than one earth station assignment. Each assignment that is affected is highlighted in green. The other assignments in the station frequency plan are still displayed, but they are not highlighted.
You can look at the details of the interference calculation for each of the affected assignments. To select an assignment, click on the block in the diagram. When selected a thick black border surrounds the assignment. To switch to another assignment, simply click on it.


The bottom half of the Interference Calculation windows shows the details of the interference between the two selected assignments.
The left-hand pane shows the components of the interference calculation. Some of these components are themselves broken down into smaller components. The existence of more structure is indicated by a  button. You can click these buttons to show or hide parts of the calculation.

Click  next to Loss(ITU-R P.452)
Click 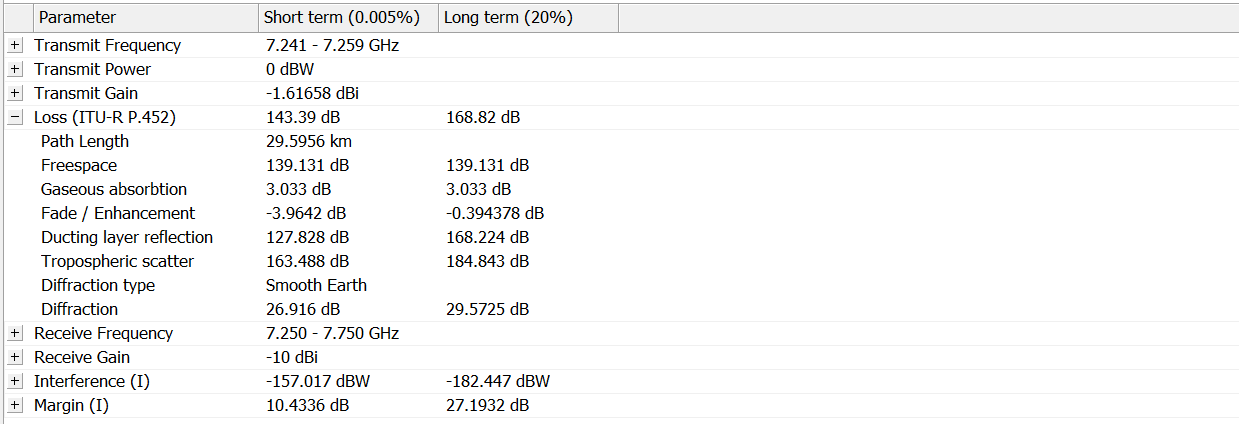

Figure 50: ITU-R P.452 expanded
Parameter values and units for short and long term percent times are shown.
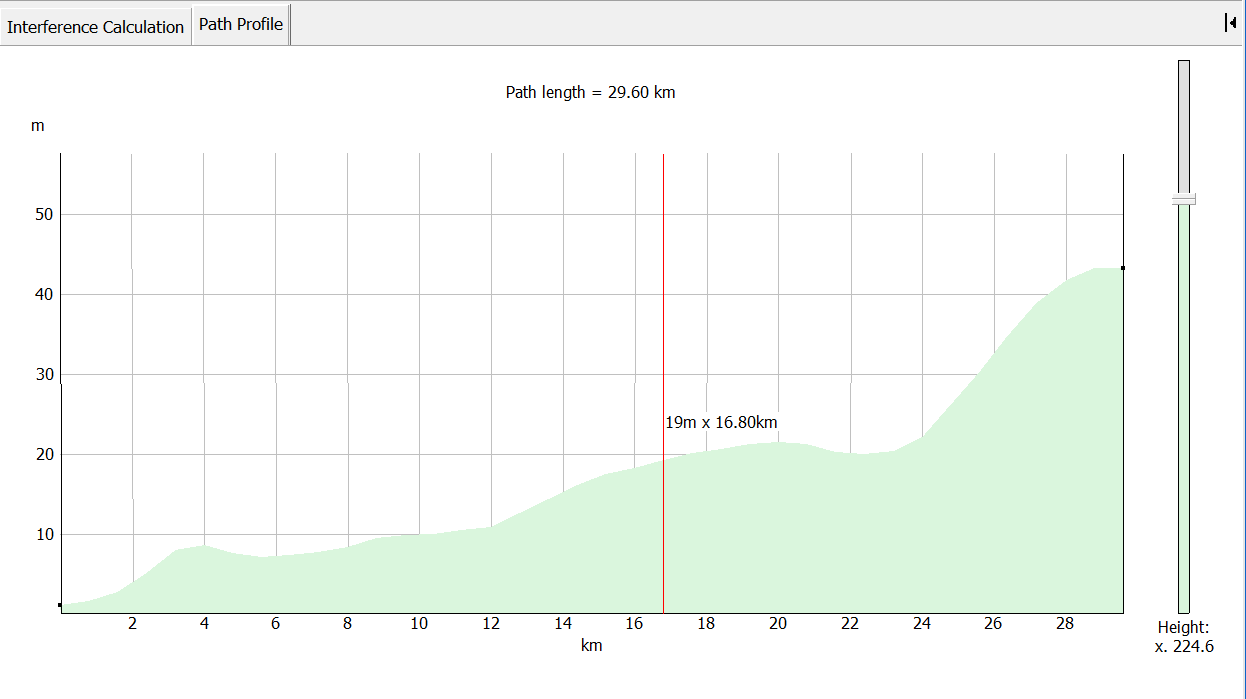
Path Profile Window
The path profile shows the path between the selected assignment and the earth station. The terrain heights for all points along the path are displayed. The direction of the path left to right is from the interferer to the victim.
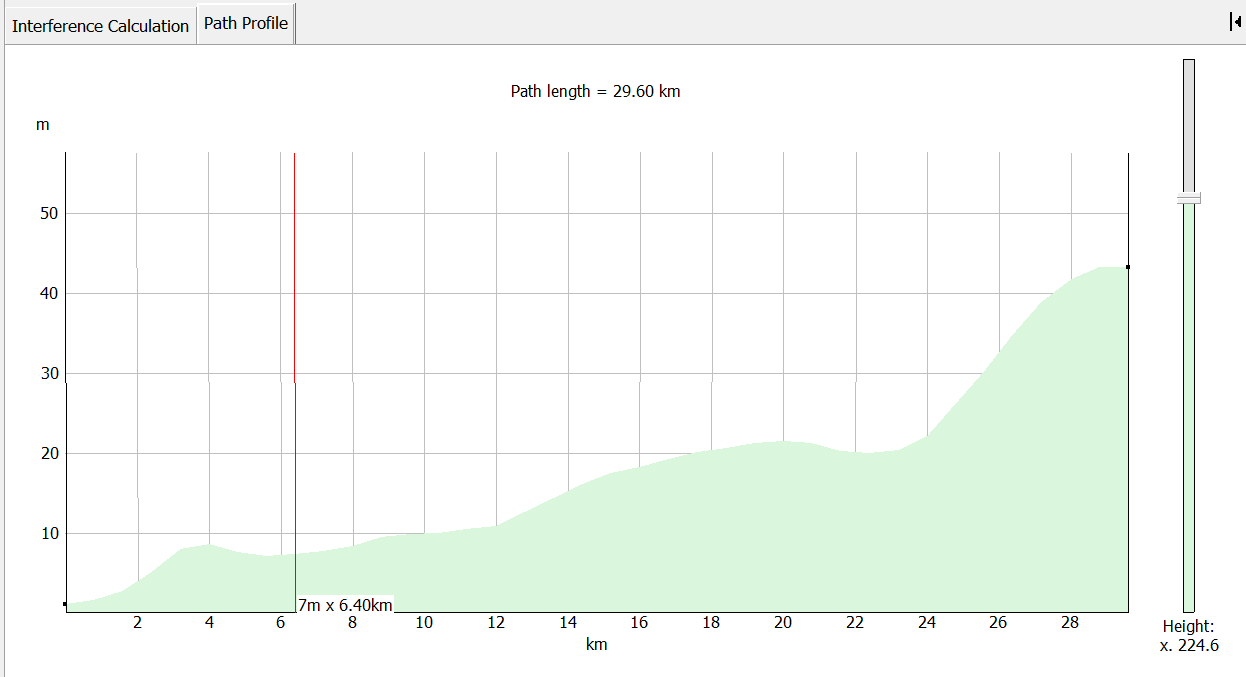
Small black squares indicate the positions of the assignment and the earth station on the terrain. Vertical and horizontal scales allow you to read off terrain heights and distances along the path.
In many cases the path length can be many kilometres whereas the height variation along the path is likely to be only a few hundred metres. The relative scale on the vertical and horizontal axes is variable. The slider on the right hand side changes this scale.
As you move your mouse pointer across the profile, the height and path distance for the relevant point on the path are displayed next to the pointer.
Site Analysis
Overview
The Visualyse Coordinate site analysis tool produces a graphical overview of the potential interference and coordination problems over a selected area.
The idea of this tool is to provide top level information relating to many potential locations. Detailed analysis of a specific location can then be performed by placing an earth station there and running the other functions of Visualyse Coordinate.
Site analysis requires a set of earth station parameters to be defined. Calculations are based on the relocation of the earth station to a discrete number of points within an area defined by user input. At each point the interference calculation is performed for all assignments within the coordination contour centred around that point.
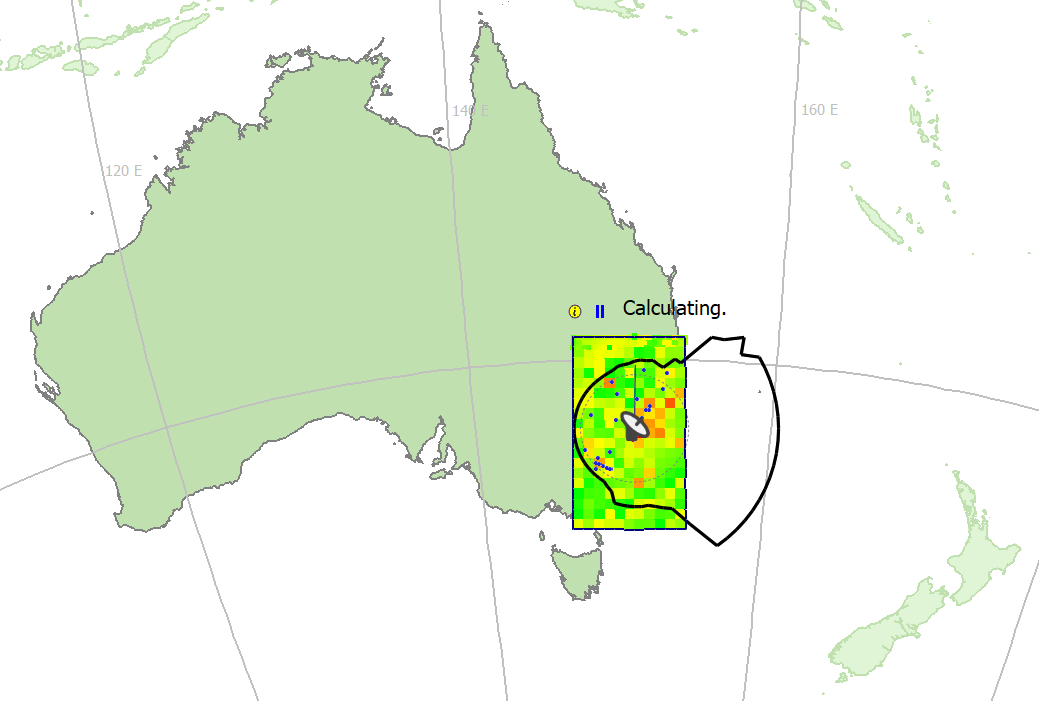
The top level function of Site Analysis is to provide a colour coded, pixelated map of either the worst single interference case or the number of coordinations that would be required at a location, given the database of sharing systems you have provided.
Colours are coded from green through yellow to red. Intense green indicates a benign environment, yellow areas are marginal and dark red indicates interference/coordination problems.
Initially the map is coarse, with large pixels. As the calculation is refined, the pixels become smaller, down to a level predetermined by software defaults that can be set by the user. At all stages you can see a global view of the situation, and over time this view becomes more and more detailed. You can pause or stop the analysis at any stage.
The figure below shows an example of a site analysis map.
How to Run Site Analysis
Creating a Site Analysis
Once you have defined you earth station you can begin site analysis by clicking the Site Analysis button ![]() on the tool bar or by selecting Site Analysis from the tools menu.
on the tool bar or by selecting Site Analysis from the tools menu.
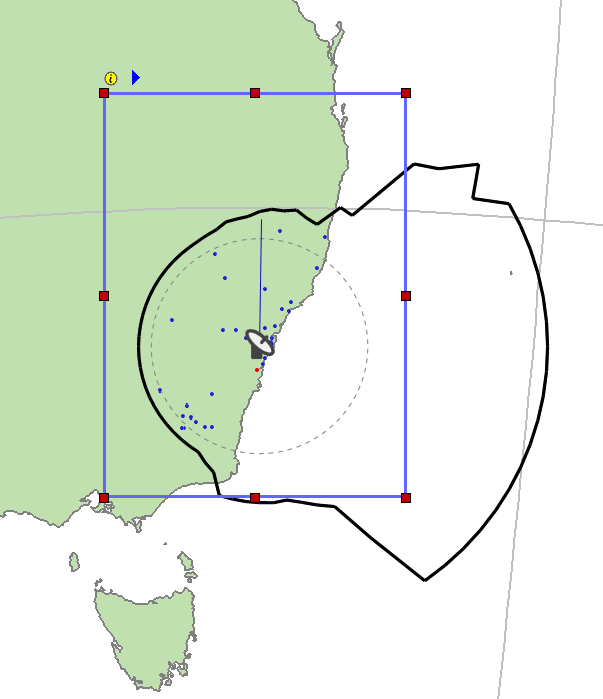
The mouse is then in a mode that allows you to select a rectangular area on the map (as shown in the figure below)
There are two control buttons associated with the site analysis.
- press
 to set site analysis properties
 - press
 to start the analysis. When the analysis is running, this button becomes the pause button
Site Analysis Display Properties
Site analysis properties for display options can be set by pressing the  icon.
icon.
The properties dialog is shown below.
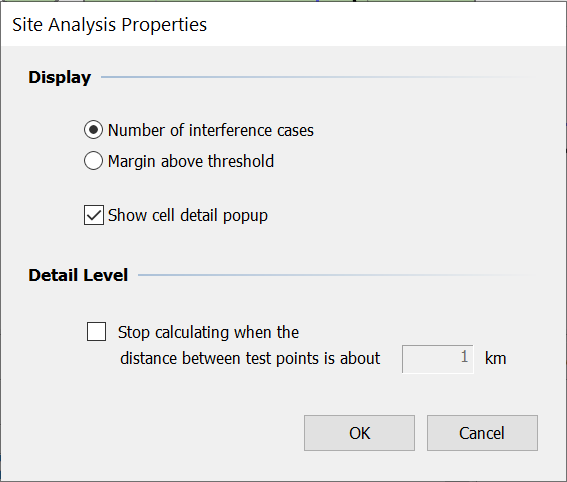
The pixelated map produced during site analysis can show either the number of coordination cases at each point or the worst margin at each point. To switch between the two, select the appropriate radio button.
You can also switch on and off the option to show a popup when the mouse pointer is passes over a site analysis pixel in the map view.
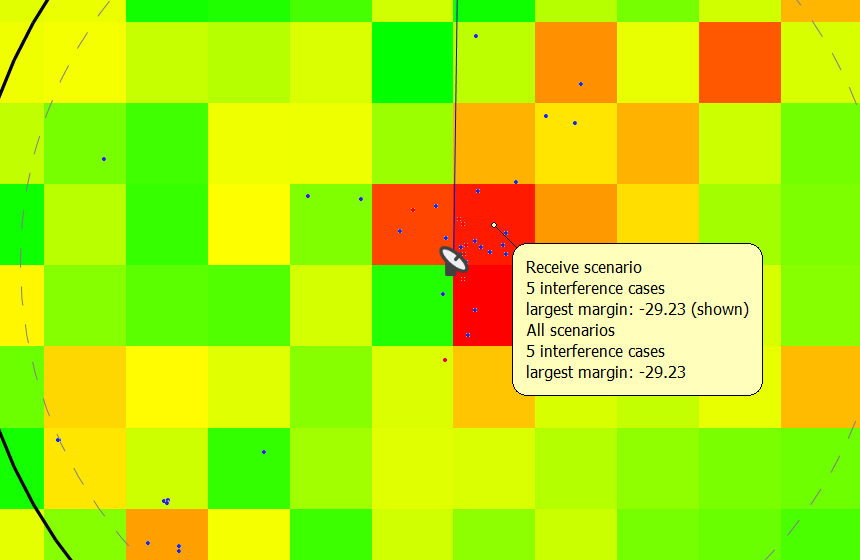
Site Analysis Detail Popup
Hovering the mouse pointer above a pixel, will produce a pop-up window with some detailed information (Number of Coordinations, Worst margin etc…). This is referred to as the Site Analysis Detail Popup.
The popup provides some detailed information about the situation at a specific point – an example is shown in the figure below.
Form Generation and Reporting
The generation of APS4 III forms and of interference reports can be done at any stage by simply clicking the buttons on the toolbar or selecting the appropriate items from the Tools menu.
Interference Report
The interference report button  will generate a formatted text file (.rtf) with information to one of three levels of detail that you specify.
You can select a Summary Report, Interference Report or Full Report as required.
- A Summary Report contains brief details of the number of assignments considered and the number of interference cases found
- An interference report contains details of the interference calculations for all cases where an excess was found
- A full report contains the details of the interference situation for all the cases considered.
APS4 Forms
The Apps4/II button  will produce an Microsoft Word document in the APS4 III format.
The document will have all the technical parameters used by Visualyse Coordinate filled in. However, there is more to an APS4 III filing than this and the form needs to be completed by hand. This is made much easier by the fact that the output is a fully formatted Microsoft Word file.
Visualyse Coordinate Maintenance History
This document describes the changes that have been made to Visualyse Coordinate for each maintenance release.
Release 3.3.3.0 (January/2026)
The following changes have been made to the software:
- Minor U.I revisions.
Release 3.3.2.0 (September/2025)
The following changes have been made to the software:
- Fix possible UI redraw issues.
Release 3.3.1.0 (August/2025)
The following changes have been made to the software:
- Fix possible issues connecting to licence.
Release 3.2.1.0 (May/2025)
The following changes have been made to the software:
- Restore support for Windows 8.1/Server 2012 R2.
- Make Antenna Radiation Patterns dialog resizable.
Release 3.2.0.0 (January/2025)
The following changes have been made to the software:
- Add support for v10 SRS databases.
- Fix startup performance when connected to SRS database (move initialisation to when data is going to be used).
- Add icon for Map Options.
- Fix DPI issues on Polar Plot / Line Graph
- Various calculation fixes.
- Visualyse Coordinate no longer runs on Windows 7. Further details can be found here: https://www.transfinite.com/content/VisualyseCoordinateWindows7
It is recommended all users install the latest DK2 device drivers (V8.28.33) from: https://www.transfinite.com/content/dongledriverinstall_V8_28_33
Release 3.1.9.1 (September/2024)
The following changes have been made to the software:
- Fix DPI font scaling issue on Map View.
- Fix possible icon button drawing issue.
Release 3.1.9 (April/2024)
The following changes have been made to the software:
- Add new Help menu item for online documentation
Release 3.1.8 (January/2024)
The following changes have been made to the software:
- Fix possible issue with losing connection to DK2 Network Server when PC goes to sleep.
Release 3.1.7 (December/2023)
The following changes have been made to the software:
- Revise About dialog to handle DK2 HID devices.
- Fix registry issue.
Release 3.1.6 (July/2023)
The following changes have been made to the software:
- Revise install program.
Release 3.1.5 (June/2023)
The following changes have been made to the software:
- Use .docx files rather than .doc.
- Update installed DK2 DLL.
It is recommended all users install the latest DK2 device drivers (V8.22.26) from https://www.transfinite.com/content/dongledriverinstall_V8_22_26
Release 3.1.4 (February/2023)
The following changes have been made to the software:
- Fix possible Toolbar icon redraw issue on low DPI displays.
Release 3.1.3 (February/2023)
The following changes have been made to the software:
- Add Notification for software update rather than modal dialog at startup.
- Fix issue refreshing Notification List when more than one entry.
It is recommended all users install the latest DK2 device drivers (V8.20.21) from https://www.transfinite.com/content/dongledriverinstall
Release 3.1.2 (November/2022)
The following changes have been made to the software:
- Fix scaling issue with Earth Station icon on low DPI screens.
Release 3.1.1 (November/2022)
The following changes have been made to the software:
- Fix drawing issues when map is panned.
Release 3.1.0 (July/2022)
The following changes have been made to the software:
- Add a search bar to the Application Title bar. This allows users to search the menu options.
- Add a notification icon to the Application Title Bar. This displays a badge with the number of notifications. Clicking displays the Notifications View. At present this is used to display general application information (new software updates, DK2 driver updates etc).
- Implemented Windows 11 Snap Layout. When the program is running on Windows 11 and the maximize/restore caption button is hovered, the layout popup menu will appear near this button.
- Update installed DK2 DLL.
Release 3.0.9 (January/2022)
The following changes have been made to the software:
- Improve scaling of UI components for Windows 10/11 scale factors of 125%, 175%, 225%.
Release 3.0.8 (November/2021)
The following changes have been made to the software:
- Fix issue with X Axis scaling on Path Profile View.
- Fix minor memory leak in Assignment Tree.
Release 3.0.7 (November/2021)
The following changes have been made to the software:
- Fix issue with Report Dialog.
- Get DeltaN / N0 used by P.452 from ITU data files.
- Fix possible issue with GetHeightSpacing in Terrain DLLs.
- Fix Interference Analysis issue.
Release 3.0.6 (August/2021)
The following changes have been made to the software:
- Display DK2 driver version on About dialog.
It is recommended all users install the latest DK2 device drivers (V8.19.7) from https://www.transfinite.com/content/dongledriverinstall
Release 3.0.5 (August/2021)
The following changes have been made to the software:
- Update installed DK2 DLL.
Release 3.0.4 (April/2021)
The following changes have been made to the software:
- Install newer DK2 driver DLL.
Release 3.0.3 (January/2021)
The following changes have been made to the software:
- Fix issue when checking for software updates via the “About Visualyse Coordinate” dialog.
Release 3.0.2 (January/2021)
The following changes have been made to the software:
- Minor performance improvements.
Release 3.0.1 (December/2020)
The following features have been added to the software:
- Improve cursors on high DPI screens.
Release 3.0.0 (December/2020)
The following features have been added to the software:
- New User Interface to improve display on high DPI screens.
- Align Radiation Patterns to the APL implementation.
Release 2.8.6 (January/2020)
The following features have been added to the software:
- Add ability to use ASTER V3 terrain data.
- Fix possible error conditions when using ASTER V1, ASTER V2 terrain data.
Release 2.8.5 (May/2019)
The following features have been added to the software:
- Change location of AppS4 documents to prevent issues in some environments.
- Minor performance improvements.
Release 2.8.4 (January/2019)
The following feature has been added to the software:
- Minor performance improvements.
Release 2.8.3 (August/2018)
The following feature has been added to the software:
- Minor improvements.
Release 2.8.2 (June/2018)
Windows Vista
As per our announcement in 2017 Visualyse Coordinate no longer runs on Windows Vista. Further details can be found here: https://www.transfinite.com/content/VisualyseCoordinateVista
The following feature has been added to the software:
- General performance improvements.
Release 2.8.1 (March/2018)
The following feature has been added to the software:
- It is now possible to export the contours to Google Earth (kmz) format by selecting the “Export to Google Earth” option on the “Tools” menu.
The following defects have now been rectified:
- Improve graph axis labelling.
Release 2.8.0 (February/2018)
Faults and Defects
The following defects have now been rectified:
- General performance improvements
- Use latest application icon
- Fix issue with display of grid data in Horizon Elevation dialog
- Navigation dialog can fail to display in some scenarios
- Add tooltips to the button on the Horizon Elevation/Antenna Patterns dialogs
- Ensure Gain Table and Equation patterns load correctly on application startup
Release 2.7.0 (January/2016)
Faults and Defects
The following defects have now been rectified:
- Minor performance improvements.
Release 2.6.0 (July/2015)
SRTM V3 Terrain Data
Visualyse Coordinate now supports version 3 of the SRTM terrain data. The download links can be found here:
http://downloads.transfinite.com/websitedownloads/SRTM_V3_TerrainDataInVisualyseCoordinate.pdf
SRTM V2.1 Terrain Data
Visualyse Coordinate now supports version 2.1 of the SRTM terrain data. The download links can be found here:
http://downloads.transfinite.com/websitedownloads/SRTM_V2_1_TerrainDataInVisualyseCoordinate.pdf
Windows XP
As per our announcement in June 2014 Visualyse Coordinate no longer runs on Windows XP. Further details can be found here:
http://www.transfinite.com/content/VisualyseCoordinateXP
Faults and Defects
The following defects have now been rectified:
- Toolbars can fail to display or display in the wrong position.
- Revise “Check for Update” functionality.
Release 2.5.0 (August/2014)
Faults and Defects
The following defects have now been rectified:
- Improve runtime performance.
- Revise “Check for Update” functionality.
- Show more information on “About Visualyse Coordinate” for timed licences.
- Ensure Visualyse Coordinate functions correctly on high DPI screens
Release 2.4.0 (June/2014)
Faults and Defects
The following defects have now been rectified:
- Visualyse Coordinate can display an error dialog when loading/saving for some locale settings.
Release 2.3.0 (November/2013)
Performance
Visualyse Coordinate performance has been further improved.
ITU-R S.465-6
Visualyse Coordinate now includes an implementation of this recommendation.
Faults and Defects
The following defects have now been rectified:
- Improve compatibility with Windows 7 and Windows 8.
Release 2.2.0 (May/2013)
Performance
Visualyse Coordinate performance has been improved for some scenarios.
Faults and Defects
The following defects have now been rectified:
- The map can draw incorrectly in some scenarios.
- Right-Clicking a Site Analysis can cause the application to crash.
- When defining a Site Analysis ensure the bounding rectangle is always drawn correctly.
Release 2.1.0 (March/2013)
Microsoft Windows 8
Visualyse Coordinate now includes improved Microsoft Windows 8 compatibility.
Increase maximum memory usage
Visualyse Coordinate can now access more memory when running on 64 bit operating systems.
Faults and Defects
The following defects have now been rectified:
- Visualyse Coordinate can report errors from the ITU IDWM software in some scenarios.
Release 2.0.0 (March/2012)
WRC-12
Visualyse Coordinate now supports the changes made at WRC-12.
Windows 7
Visualyse Coordinate is now fully compatible with Microsoft Windows 7.
Terrain Databases
Visualyse Coordinate is now supports a greater range of terrain databases including:
USGS GLOBE DEM, USGS GTOPO 30, USGS SRTM Level 1, USGS SRTM Level 3, Transfinite processed SRTM, SRTM .HGT format, ASTER GDEM (30m), ASTER2 GDEM (30m), Ordnance Survey public domain Landform Panorama 50m, National Elevation Dataset (NED) GeoTIFF 1, 1/3, 1/9 arc second.
ITU-R P.452-14
Visualyse Coordinate supports ITU-R P.452-14.
Interface to the SRS DVD
Visualyse Coordinate is now has an interface to the SRS DVD so the user can access GSO, non-GSO data.
Notification of updates
Visualyse Coordinate will now check for updates each time you start the software so you can be sure you are always running the latest version.
AMS Date
Visualyse Coordinate now displays the security dongle’s AMS date on the “About VisualyseCoordinate” dialog.
Faults and Defects
The following defects have now been rectified:
- Improve compatibility with existing Transfinite software.
- Visualyse Coordinate can incorrectly report IDWM installation issues on startup.
Release 1.5.2 (August/2009)
Faults and Defects
The following defects have now been rectified:
- Ensure compatibility with Visualyse GSO radiation patterns.
- Visualyse Coordinate can crash on application exit.
Release 1.5.1 (August/2008)
Faults and Defects
The following defects have now been rectified:
- Ensure compatibility with Visualyse GSO radiation patterns.
- Use newer common controls for grids/graphs etc.
Release 1.5.0 (May/2005)
Faults and Defects
The following defects have now been rectified:
- Earth station name is not being saved in the assessment file.
- There are some small memory leaks in the application which over time could affect performance on 9x systems.
- Importing assignments from the database can be slow
- Margins in the link budgets are not calculated correctly.
- The units for the bandwidth field in the frequency plan editing dialog should be selectable for easier reading.
- Reference bandwidth is not used in interference calculations.
- Auxiliary contours are not displayed correctly according to Appendix 7,
- I/N thresholds are not remembered between sessions.