Overview
The Visualyse Coordinate site analysis tool produces a graphical overview of the potential interference and coordination problems over a selected area.
The idea of this tool is to provide top level information relating to many potential locations. Detailed analysis of a specific location can then be performed by placing an earth station there and running the other functions of Visualyse Coordinate.
Site analysis requires a set of earth station parameters to be defined. Calculations are based on the relocation of the earth station to a discrete number of points within an area defined by user input. At each point the interference calculation is performed for all assignments within the coordination contour centred around that point.
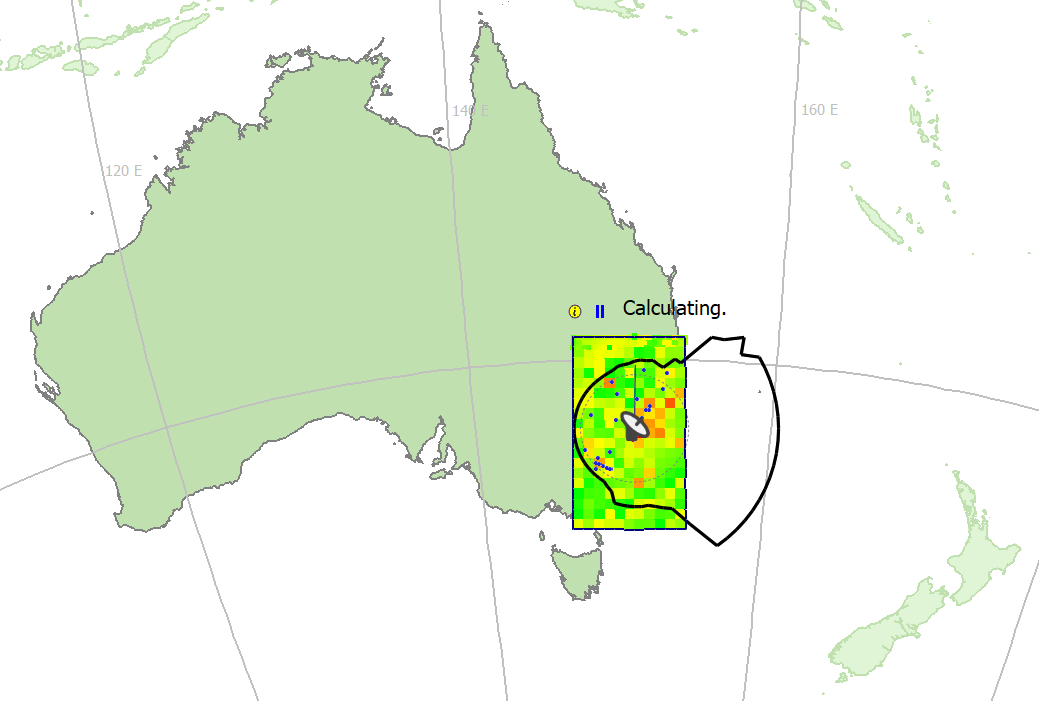
The top level function of Site Analysis is to provide a colour coded, pixelated map of either the worst single interference case or the number of coordinations that would be required at a location, given the database of sharing systems you have provided.
Colours are coded from green through yellow to red. Intense green indicates a benign environment, yellow areas are marginal and dark red indicates interference/coordination problems.
Initially the map is coarse, with large pixels. As the calculation is refined, the pixels become smaller, down to a level predetermined by software defaults that can be set by the user. At all stages you can see a global view of the situation, and over time this view becomes more and more detailed. You can pause or stop the analysis at any stage.
The figure below shows an example of a site analysis map.
