Horizon Elevation
The local horizon elevation around the site should be included in the calculation. Local shielding can have a dramatic effect on the coordination distance in a given direction.
To enter the data defining the horizon elevation profile around the earth station, click Horizon Elevation on the Location tab of the properties side bar.

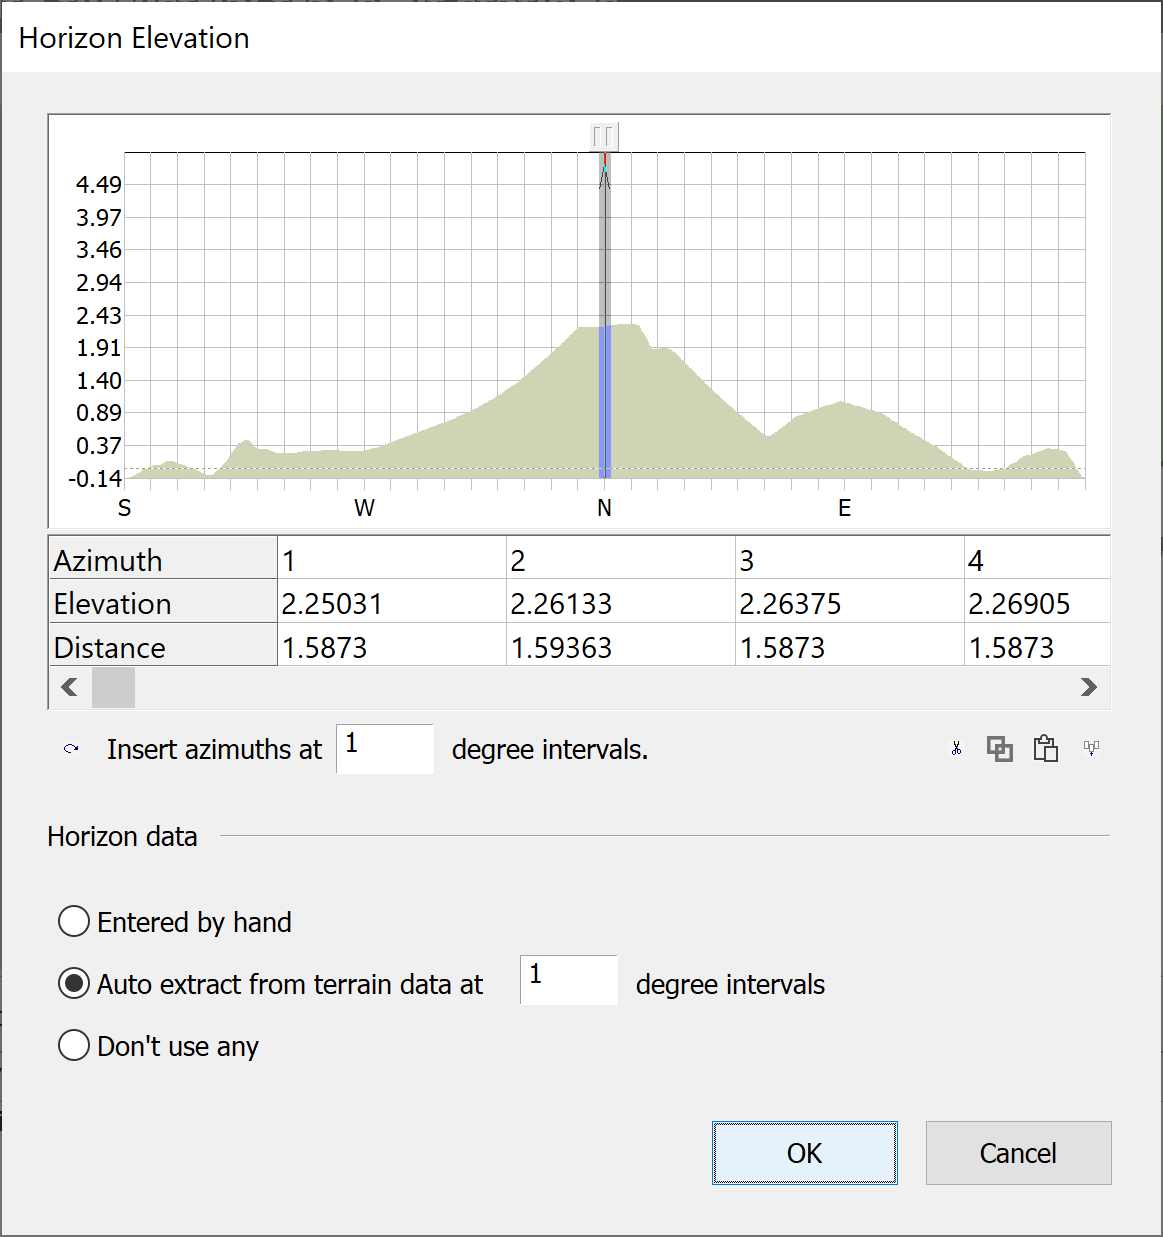
The horizon elevation dialog will be displayed. From here you can specify the elevation to the horizon for all azimuths around the earth station.

There are two ways to specify the horizon elevation. If you have measured the horizon elevation at the earth station site, then you can enter this data by hand. Choose Entered by hand in the Horizon Data section then simply type in the azimuth and elevation pairs in the table.
If you have this data in another format, you can import it into Microsoft Excel (or any other spreadsheet program). Modify the imported data it so that it is in two rows with the azimuths in the top row and the corresponding elevations and distances in the bottom rows, then copy and paste the data into the table.
If you don’t have any measured data, then the software can calculate the elevations for you using the terrain data loaded on your system. To choose this option, select Automatic from terrain data and specify the angular resolution you want to use to sample the data. The data will be calculated automatically and placed in the table.
If you don’t have any measured data and you don’t have any terrain data then you can choose not to use any horizon data. In this case the gain at the horizon will be assumed to be zero. To select this option, choose Don’t use any in the Horizon Data section.
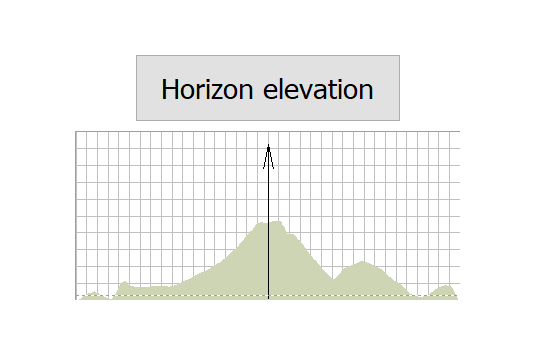
The chart at the top of the dialog shows a plot of elevation angle against bearing. The plot is always centred on the bearing that corresponds to the earth station pointing angle. In the centre of the chart a thick grey line with an arrow at the top indicates this angle.
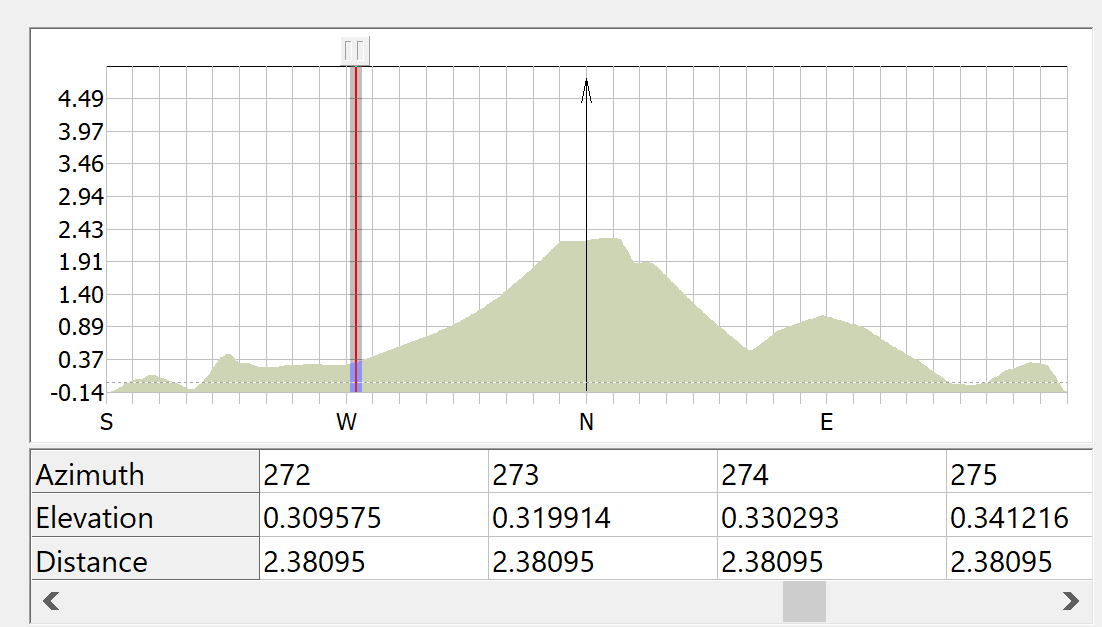
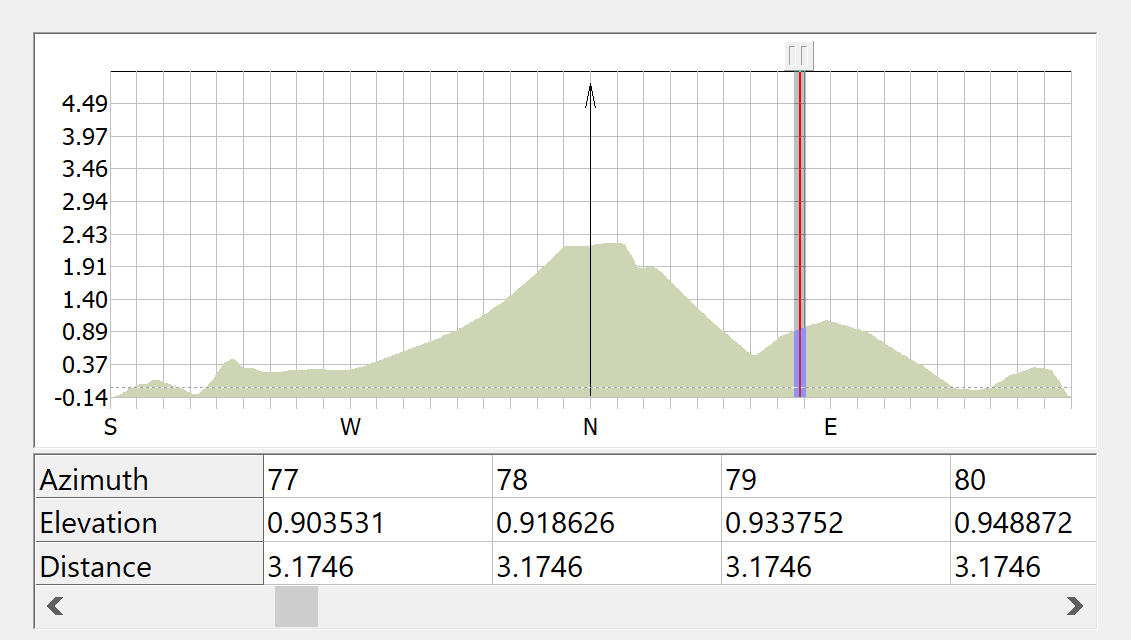
The table below the chart shows the horizon elevation data. Only a section of this data can be displayed at any one time. The leftmost part of the data visible in the table is indicated on the chart by a vertical red line. At the top of the red line is a button. You can click and drag this button to look at different sections of the data table. Alternatively, you can click the scroll bar below the table.

