Satellite & Terrestrial
This section contains the following examples:
HEO FSS and FS
| Action: | Run simulation |
| Modules used: | None |
| Terrain regions: | None |
| Frequency band: | Ka |
| Station types: | Non-GSO Satellite, Earth Station, Fixed |
| Propagation models: | Free space, ITU-R Rec.P.676 |

This example shows an example of analysis of the power flux density (PFD) mask that can protect terrestrial point to point fixed link from interference from constellations of satellites in highly eccentric orbits (HEO).
It is proposed that a PFD limits be -105 dBW / m^2 / MHz for elevation angles of arrival less 5°, -115 dBW / m^2 / MHz for elevation angles above 25°, and linear interpolation between 5° and 25°.
The interference that this PFD mask will generate will depend upon the characteristics of the satellite constellation. Therefore to check whether the mask is suitable not it is necessary to run a simulation assuming it applies and checking the predicted levels of interference.
The interference will also depend upon the characteristics of the FS receiver: in particular its:
- Latitude
- Longitude
- Antenna azimuth
- Antenna gain pattern
- Antenna height
In this example, we consider a single location, height and gain pattern and vary the azimuth, but other runs could analyse the impact of vary other parameters.
Interference is measured in terms of the I/N at the FS receiver and compared against a threshold I/N = -10 dB. Statistics are captured on what percentage of time this threshold is exceeded, and in addition what the worst I/N would be. Other statistics could be generated, such as the Fractional Degradation in Performance (FDP).
A 3-satellite HEO constellation is modelled with repeat period and hence simulation duration of 1 day, using a 10 second time step.
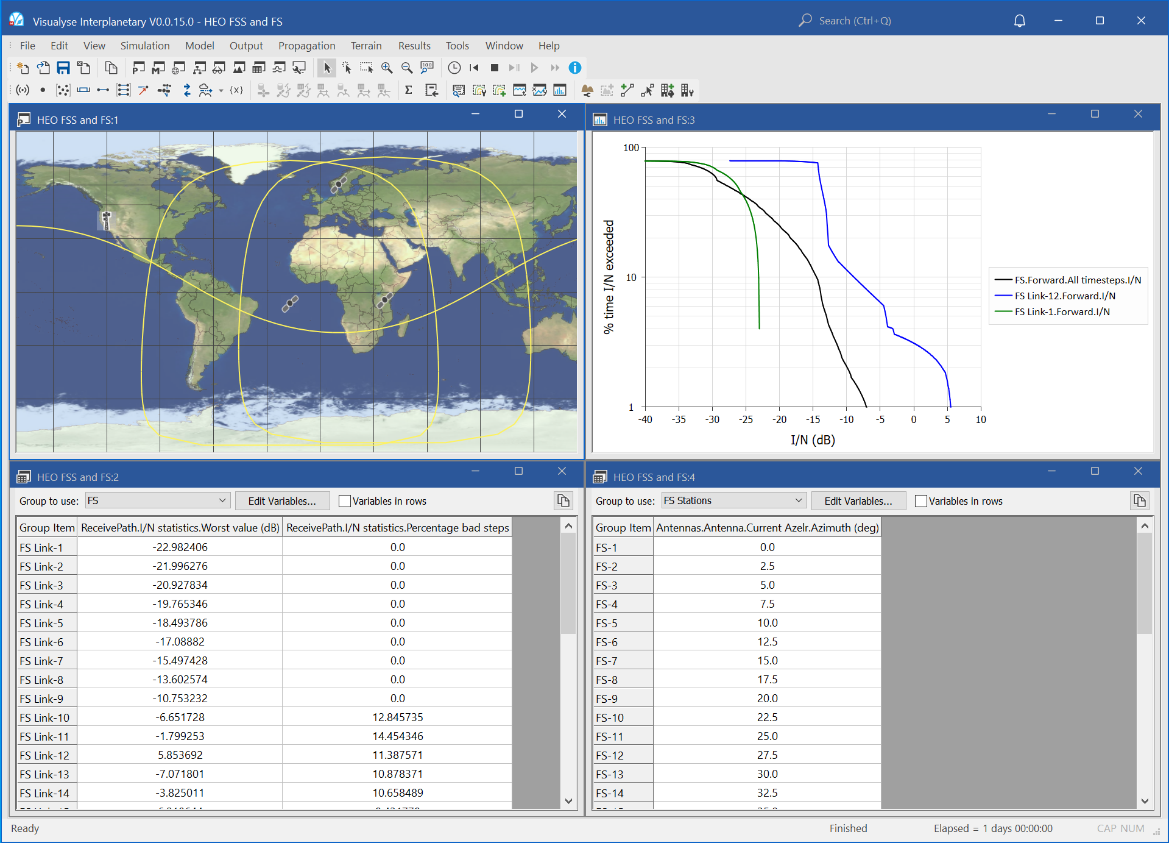
The screen shot above shows the following windows:
- Table view (far left) showing the azimuth angles of the test FS receivers, varying from 0° to 90° in 2.5° steps
- Table view (left) showing the worst I/N and percentage of time the I/N > -10 dB for each of these azimuths
- Plate Carrée view (top right) showing the location of the FS receivers, the satellites, and their foot prints
- Statistics view (bottom right) showing the cumulative distribution function of the I/N for all links and two in particular.
Note how the azimuth of the worst I/N is not the same as the azimuth of the receiver with the highest probability of interference!
Satellite ATC Example
| Action: | Run simulation |
| Modules used: | Define Variable |
| Terrain regions: | None |
| Frequency band: | L |
| Station types: | Non-GSO Satellite, Earth Station, Mobile |
| Propagation models: | Free space, ITU-R Rec.P.676, Hata, ITU-R Rec.P.452 |

This example analyses interference with a satellite network employing Auxiliary Terrestrial Component (ATC). This is used to extend and improve the coverage and capacity of the satellite network, particularly in urban areas where there can be significant reduction in coverage due to clutter (see next example file for details).
To improve performance in urban areas, terrestrial repeaters or base stations are deployed, typically operating within the spectrum allocated to the satellite system. However this can result in interference if not managed correctly – either within the satellite / ATC network or into other networks either co-frequency or in adjacent bands.
One of the key strengths of Visualyse Interplanetary is how it can analyse the various combinations of satellite and terrestrial systems. In this example file it is analysing both Uplink (UL) and Downlink (DL) and both satellite and terrestrial services in the same simulation file!
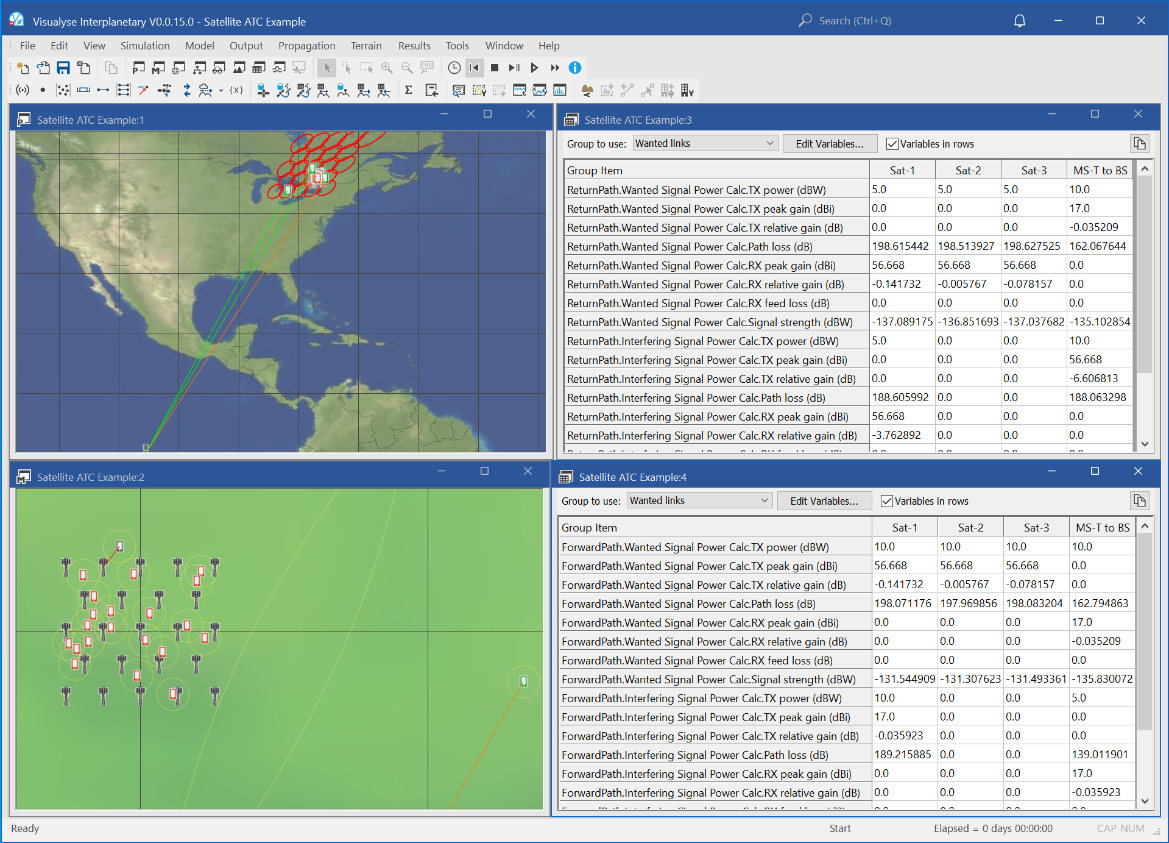
The various elements are shown in the following two figures. There are two sets of wanted paths:
- Space to Earth path between the satellite and the handsets operating in satellite mode, modelling used free space path loss and gaseous attenuation using Rec.P.676 plus 10 dB of clutter loss
- Terrestrial path between the ATC base stations and the handsets operating in GSM mode, modelling the short range urban path using the Hata / COST 231 propagation model
The first figure considers the downlink interference paths including:
- Space to Earth path: interference from the satellite DL into the ATC terrestrial component DL, modelling used free space path loss and gaseous attenuation using Rec.P.676
- Terrestrial path: interference from the ATC terrestrial component DL into the satellite DL, modelled using terrestrial propagation model ITU-R Rec.P.452
The second figure considers the uplink interference paths including:
- Terrestrial path: interference from the satellite UL into the ATC terrestrial component UL, modelled using terrestrial propagation model ITU-R Rec.P.452
- Space to Earth path: interference from the ATC terrestrial component DL into the satellite DL, modelling used free space path loss and gaseous attenuation using Rec.P.676
The simulation has been configured so that all links would work with adequate C/N in the absence of interference. However it can be seen that for three of the four interference paths the C/I is significantly negative.
The screen shot above shows four windows open:
- Plate Carrée view (top left), showing the locations of the satellite, handsets and base stations, and beam foot print of the satellite network (note only a sub-set of the spot beams have been included to simplify the simulation)
- Mercator view (bottom left), showing the grid of base stations, randomised deployment of mobiles, interference paths, and beam coverage
- Table view (top right) showing the wanted and interfering link budgets for the return paths (satellite downlinks and terrestrial uplinks)
- Table view (bottom right) showing the wanted and interfering link budgets for the forward paths (satellite uplinks and terrestrial downlinks)
This simulation could be developed further in many ways – contact us for more details.
Urban GSO S-DARS Coverage
| Action: | None |
| Modules used: | Terrain |
| Terrain regions: | S-DARS Lidar |
| Frequency band: | S |
| Station types: | GSO Satellite, Earth Station, Mobile |
| Propagation models: | Free space, ITU-R Rec.P.676, ITU-R Rec.P.452 |

This example show Visualyse Interplanetary being used to predict the coverage of a GSO satellite providing communication services and broadcasting multi-media to mobiles in urban areas. This can be problematic for areas of Europe, as the GSO arc is low on the horizon for the higher latitudes involved. This means that the direct path to the satellite is more likely to be obscured by a building, and in these cases with the minimal margin available the link will fail.
In this case an urban area has been created using the generic terrain file format containing streets between blocks, towers, plazas, and a river with bridges. Using only the GSO satellite the coverage is limited, particularly behind the towers, where there is considerable shadowing. To provide fill-in of these locations a terrestrial repeater has been included: the propagation has been modelled using the “over the top” path included in ITU-R Rec.P.452.
Two area analysis have been created:
- Dark green: showing where the C/N from the satellite exceeds 12 dB
- Light green: showing where the C/N from either the satellite or the terrestrial repeater exceeds 12 dB
The locations that are uncoloured show where there is coverage from neither the repeater nor the satellite.
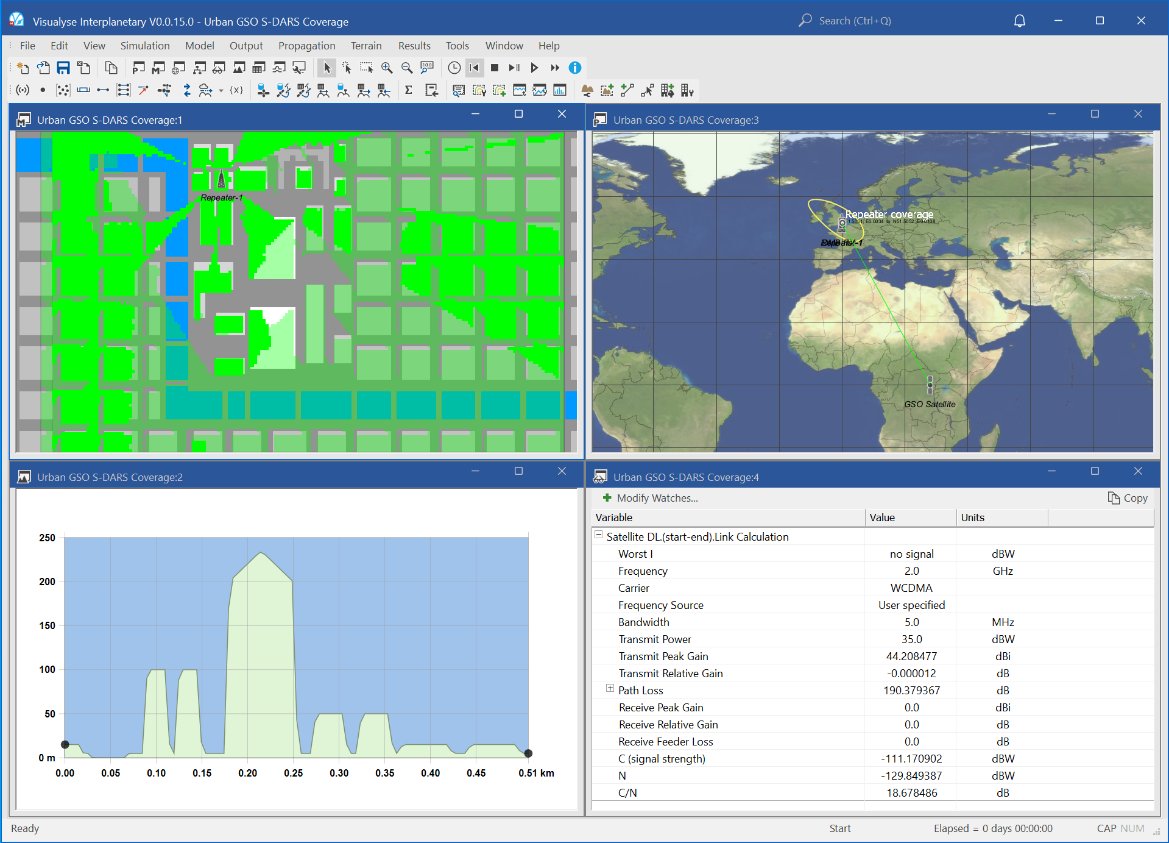
In the screen shot above there are four windows open:
- Mercator view (top right), showing the terrain area, river in blue, and the two area analysis, colour coded in green
- Path profile view (bottom right), showing a path across the area, with the towers, streets, and rivers visible
- Plate Carrée map view (bottom left), showing the location of the test area, the handset, and the GSO satellite.
- Watch window (top left), showing the link budget from the satellite to the handset
This analysis could be extended to show the effect of using other architectures – such as Highly Eccentric Orbits (HEO).