Short range devices
This section contains the following examples:
SRR into FS
| Action: | Run simulation |
| Modules used: | Define Variable |
| Terrain regions: | None |
| Frequency band: | Ka |
| Station types: | Fixed, Mobile |
| Propagation models: | ITU-R Rec. P.1791 |

This example shows study of the impact of short range radars (SRRs) on point to point fixed links around 26 GHz.
A fixed service receiver station is modelled at the centre of the test area. Its antenna is modelled using the Rec.P.699 gain pattern with azimuth = 90° (due East) and elevation just below horizontal (-0.75°).
In the vicinity of this FS receiver are assumed to be a number of roads on which are vehicles. These have been modelled by randomising the position (lat, long) using the Define Variable module.
It is assumed there are two roads running North-South, one East-West and several other small roads modelled as vehicles at random locations across the area of interest.
Note that the task of defining these roads with all these vehicles is simplified by the use of the duplicate feature! This sort of randomisation makes this a Monte Carlo style simulation.
The SRRs are assumed to be transmitting at -73 dBW: this is -43 dBm / MHz as per FCC requirements plus two factors:
- 3 dB increase due to the gain at the transmit antenna
- 3 dB increase due to multiple transmitters on the vehicle
The net result is an equivalent EIRP per vehicle of -37 dBm or -67 dBW.
The propagation model is assumed to be dual slope with decay factor 2 until 1 km and then 3.
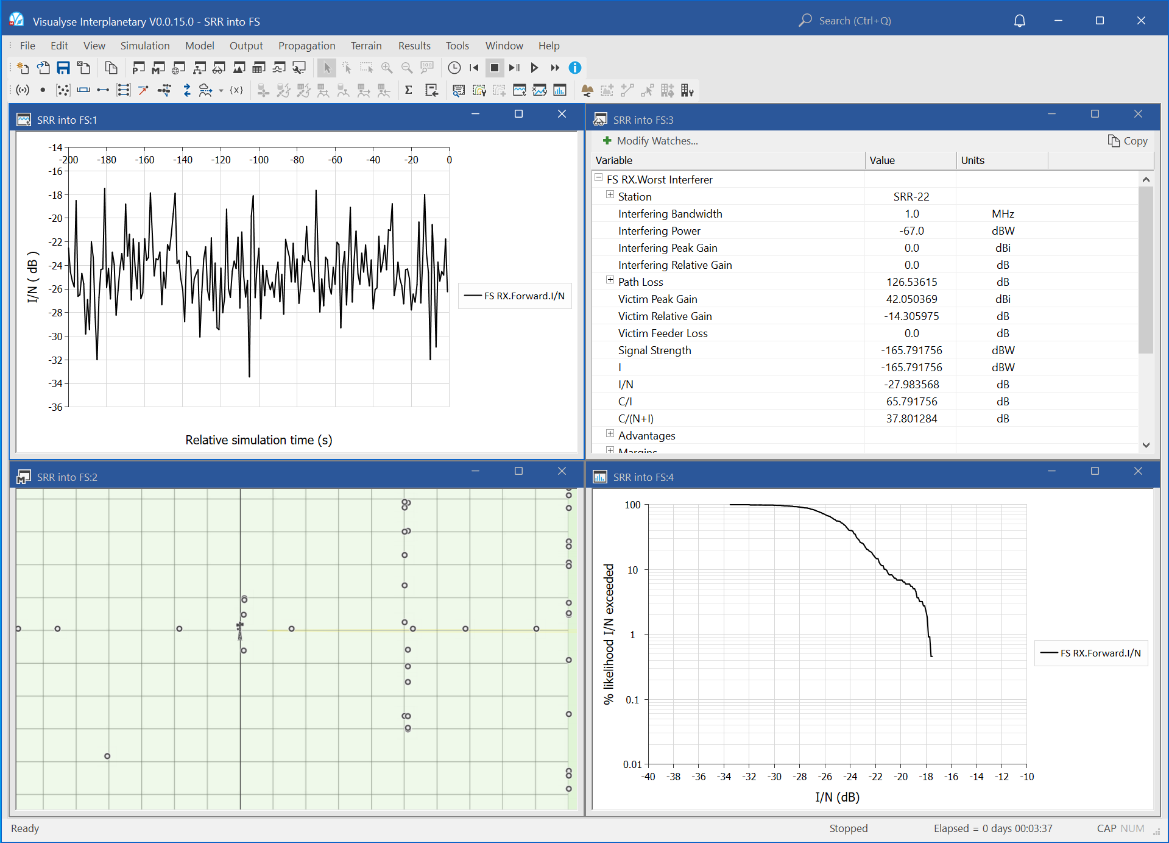
The figure above shows four windows:
- Mercator view (top left) showing the location of stations on a grid every 1 km for scale
- Quick graph view (bottom left) showing the variation in I/N at the FS receiver against Monte Carlo sample.
- Watch window (bottom right) single entry worst case interfering link budget and the aggregate interference from all 50 vehicles.
- Statistics graph (top right) I/N cumulative distribution functions for the FS receiver
Wi-Fi and BT
| Action: | Run simulation |
| Modules used: | Define Variable, Traffic |
| Terrain regions: | None |
| Frequency band: | S |
| Station types: | Mobile |
| Propagation models: | ITU-R Rec. P.1791 |

This example shows sharing between a Wi-Fi network and Bluetooth (BT) at around 2.4 GHz.
The simulation operates at short ranges with maximum radius of Wi-Fi network of 50m and paired BT devices 1 metre apart. The location of the user terminal is randomised within the Wi-Fi service area as is the paired BT device.
The wanted and interfering paths are assumed to use the propagation model in ITU-R Rec.P.1791, which is a dual slope model plus log-normal fading.
The Wi-Fi network is operating on one of the three non-overlapping 22 MHz channels while the BT device bandwidth is 1 MHz and is frequency hopping. BT devices can hop over all three channels but tend to avoid those where they suffer interference – such as when co-frequency with Wi-Fi networks. Hence in this example it is assume to hop at random outside the Wi-Fi’s channel.
Representative spectrum masks of both the Wi-Fi and BT have been used and for a given frequency offset Visualyse Interplanetary 7 calculates the net filter discrimination (NFD).
An additional factor modelled is the activity ratio of the BT device which is assumed to be active for 25% of the time. Hence the simulation calculates the performance using Monte Carlo methods to convolve:
- Randomisation of location
- Randomisation of fading on wanted paths
- Randomisation of fading on interfering paths
- Random selection of frequency of BT operation, and hence relative frequency offset, and hence variation in NFD
- Random activation of BT link
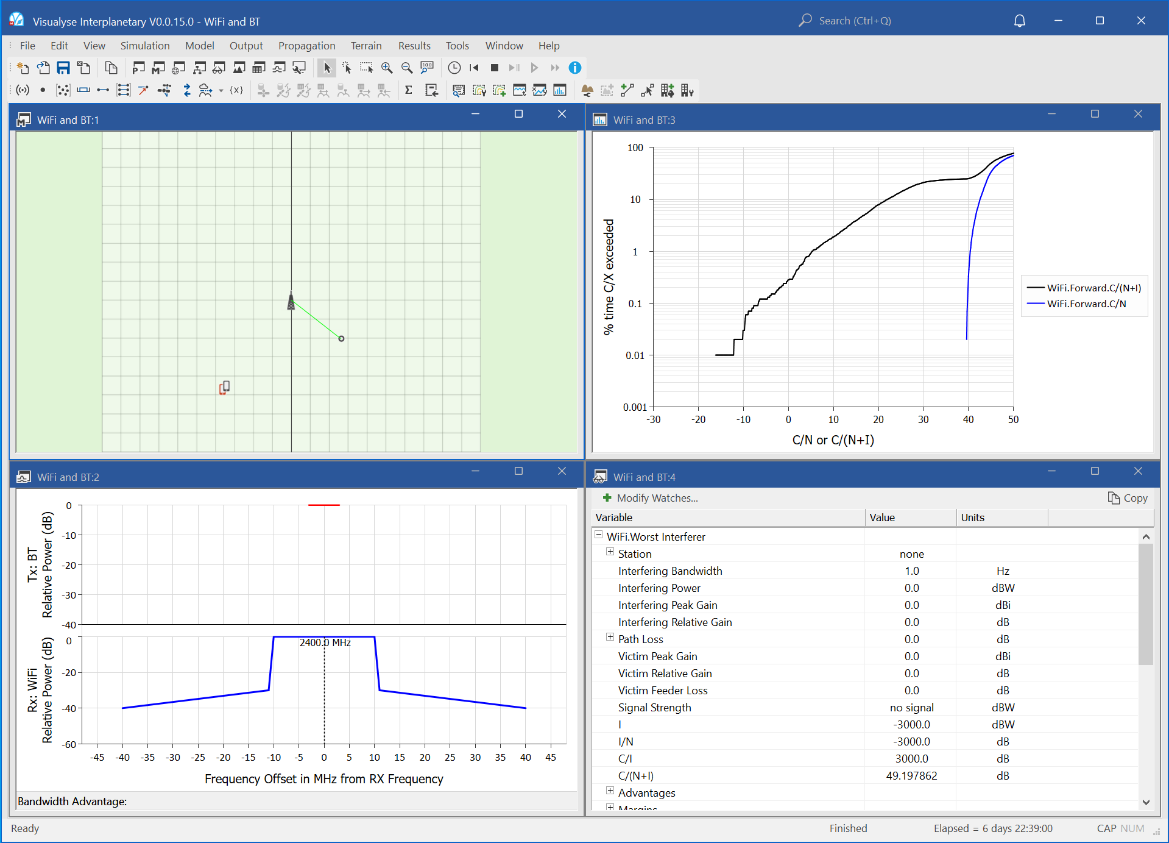
The result is degradation in performance of each link due to the other. The figure above shows four windows:
- Mercator view (top left) showing the location of stations on a grid every 10m for scale
- Frequency view (bottom left) showing the spectrum mask of the BT (as interferer) and receive filter mask of the Wi-Fi (as victim)
- Watch window (top right) showing the wanted and interfering link budgets
- Statistics graph (bottom right) showing the C/(N+I) and C/N cumulative distribution functions, showing how performance of the Wi-Fi network is degraded due to the proximity of the BT network.