File Formats
- Visualyse Binary Files
- Shaped Beams Gain Tables
- ITU Graphical Data
- Logged Data
- Terrain Data General Import File Format
- Land Use Generic File Format
- View Overlay XML Files
- Text File Format
- Service Area Wizard
- TLEs
- FS Import
- Import Tx System
- Import Rx System
- Import Non-GSO Orbit Elements
Visualyse Binary Files
Visualyse Professional binary files are stored complete with all the information that is required to describe a scenario including the windows used. The file format is not available to the user.
Shaped Beams Gain Tables
The shaped beams are constructed as a table, with a grid of azimuth and elevation angles, and a gain value for each point on the grid. To ease defining complex gain tables, the data can be read in from a text file.
Two formats are available:
HPCON
HPCON is a standard format for antenna pattern data. The format is defined by TICRA Copenhagen, the world leader in antenna design and analysis software.
The format used is described below:
| Record | Data | Format |
|---|---|---|
| First Line | Identifying label | 18 characters of text |
| Second Line | U1,U2,V1,V2,MU,MV Where: U1 = start azimuth, U2 = end azimuth, V1 = start elevation, V2 = end elevation, MU = number of azimuths, MV = number of elevations. | Floating point number represented by an 8 character fixed field padded out with spaces. Accuracy is 3 decimal places. Integer value represented by a 4 character fixed field padded out with spaces |
| Subsequent Lines | (ZR(I,J), J=1,MV) , I=1 MU Where ZR(I,J) is the gain for the Ith azimuth and Jth elevation. There is a maximum of 10 entries per line. | Floating point number represented by an 8 character fixed field padded out with spaces. Accuracy is 3 decimal places. |
Additional data may follow such as the phase of field for each azimuth and elevation, but this is ignored.
Visualyse Professional
There are two possible file formats whereby the data is read in in rows or columns.
The fields are text, separated by one of the following:
- tabs
- commas
- spaces
Format 1:
The file format is described below. The square brackets would not appear in the actual file.
[AzStart] [AzStep] [AzNum] [ElStart] [ElStep] [ElNum]

[Gain X-1 Y-1]

:

[Gain X-n Y-1]

[Gain X-1Y-2]

:

[Gain X-nY-2]

:

:

[Gain X-1Y-m]

:

[Gain X-nY-m]
where:
[AzStart] = start (smallest) azimuth in degrees
[AzStep] = spacing between azimuth grid points (degrees)
[AzNum] = number of azimuth points
[ElStart] = start (smallest) elevation in degrees
[ElStep] = spacing between elevation grid points (degrees)
[ElNum] = number of elevation points
[Gain Az-i El-j] = gain of i-th Azimuth point, j-th Elevation point in dB
Format 2:
The file format is described below using the same notation as for the previous version:
[AzStart] [AzStep] [AzNum] [ElStart] [ElStep] [ElNum]

[Gain X-1 Y-1]

:

[Gain X-1 Y-n]

[Gain X-2Y-1]

:

[Gain X-2Y-n]

:

:

[Gain X-nY-1]

:

[Gain X-nY-m]
Shaped Antenna Type: Multiple Tables File Format
This section describes the file format to load Multiple Tables into a Shaped Antenna Type. The Antenna Type should use an electronically steered beam.
File Type
The fields are text, separated by one of the following:
- tabs
- commas
- spaces
Header Format
The file format is described below for Shaped Antenna Type with N gain tables. The square brackets would not appear in the actual file.
[DataTypeCode] [NumberOfTables = N]

[GainTable 0]

[Azimuth-1] [Elevation-1]

[GainTable 1]

:

[Azimuth-N-1] [Elevation-N-1]

[GainTable N-1]
The following DataTypeCodes are valid:
101 = Gain tables dependent upon azimuth only and the elevation can be set to zero. Visualyse will select the gain table with skew angle closest to the given azimuth angle, rotate until the pattern has the same skew angle and then rotate the pattern around the sub-satellite point to align with the target pointing direction.
102 = Gain table dependent upon both azimuth and elevation. Visualyse will select the GainTable with (azimuth, elevation) closest to the beam pointing direction, and then rotate the pattern so it aligns with the target pointing direction.
The format of the field [GainTable N] is given in the following section.
The gain table Gain(az, el) reflects the beam when it is pointing at a direction = (azimuth, elevation). So, in most cases, the gain table should have it’s peak gain at the given (azimuth, elevation).
The 0-th gain table is the sub-satellite one i.e. for an (azimuth, elevation) = (0, 0) so there is no need to enter the azimuth or elevation angles for that table.
GainTable Format
The file format is described below. The square brackets would not appear in the actual file.
[AzStart] [AzStep] [AzNum] [ElStart] [ElStep] [ElNum]

[Gain X-1 Y-1]

:

[Gain X-n Y-1]

[Gain X-1Y-2]

:

[Gain X-nY-2]

:

:

[Gain X-1Y-m]

:

[Gain X-nY-m]
where:
[AzStart] = start (smallest) azimuth in degrees
[AzStep] = spacing between azimuth grid points (degrees)
[AzNum] = number of azimuth points
[ElStart] = start (smallest) elevation in degrees
[ElStep] = spacing between elevation grid points (degrees)
[ElNum] = number of elevation points
[Gain Az-i El-j] = gain of i-th Azimuth point, j-th Elevation point in dB
The gain values are loaded in azimuth rows (from lowest azimuth to largest azimuth) starting with the lowest elevation row.
ITU Graphical Data
Visualyse Professional has the ability to read/write files based on the format for shaped beams specified in ITU CR/58. The file format structure is text with sections as used by Microsoft Windows INI files, i.e.:
[SectionName1]

key1=value1

key2=value2

[SectionName2]

key1=value1

key2=value2
The sections are:
-
FormatInfo: specifies the file format
-
GeoMain: contains general information such as name and satellite location
-
COHeader: specifies parameters such as number of contours and boresights
-
Bi: one section for each boresight
-
Ci: one section for each contour, specifying level and series of lat/long points
These sections are described in more detail in the sections below.
FormatInfo
This has a single field to specify the version which is set to one, i.e.:
| Key | Type | Description |
|---|---|---|
| format_ver | int | Version, set to 1 |
GeoMain
This section contains global information about the file. The fields are:
| Key | Type | Description |
|---|---|---|
| adm | char | The notifying administration: this field is not used within Visualyse Professional and so is set to DK for export. |
| ntwk_org | char | The responsible organisation operating the satellite: this field is not used within Visualyse Professional and so is set to DK for export. |
| sat_name | char | This is the satellite name and is used as the antenna description |
| long_nom | char | The satellite’s nominal longitude, used as the antenna longitude |
| n_diag | int | The number of diagrams: not used by Visualyse Professional, so set to 1 for export. |
COHeader
This section describes the contours contained within the file. The fields are:
| Key | Type | Description |
|---|---|---|
| beam_id | char | The designation of the beam. Set to 1 for export |
| emi_rcp | char | The emission / reception flag at the satellite, set to E for emission, R for reception. Visualyse Professional does not distinguish between up and down beams: for export this field is set to E. |
| polar_disc | char | The polarisation discriminator, set to C for co-polarisation, X for cross-polarisation. Visualyse Professional contours are co-polar (though could be used as cross polar) and so this field should be set to C. |
| reason | char | The reason for notification: not used by Visualyse so set to A (advance publication) |
| n_bore | int | Number of boresights |
| n_cont | int | Number of contours |
Visualyse Professional adds a field to this section to specify the peak gain of the beam. This would not affect how the file is read by other systems, but is required to completely define the pattern. This field has the following structure:
| Key | Type | Description |
|---|---|---|
| gain | real | peak gain in dBi of the beam |
Bi
There is a separate section for each of the boresights. Each section has the section name of the form Bi, for example the first boresight would have section name B1.
Each boresight section has the following keys:
| Key | Type | Description |
|---|---|---|
| gain | real | gain relative to peak in dB of the boresight |
| p | geo-coord | The geographical co-ordinates of the boresight in degrees (longitude;latitude) |
Ci
There is a separate section for each of the contours. Each section has the section name of the form Ci, for example the first contour would have section name C1.
Each contour section has the following keys:
| Key | Type | Description |
|---|---|---|
| gain | real | gain relative to peak in dB of the boresight |
| n_point | int | The number of points forming the contour |
| p1 | geo-coord | The geographical co-ordinates of the first contour point in degrees (longitude; latitude) |
| : | : | |
| pn | geo-coord | The geographical co-ordinates of the n-th contour point in degrees (longitude; latitude) |
Visualyse Professional will convert open contours to closed contours when reading in.
Example
The following file was produced by creating a contour antennas in Visualyse Professional and then using the export to ITU file format option.
[FormatInfo]

format_ver=1

[GeoMain]

adm=DK

ntwk_org=DK

sat_name=GSO_Test_A

long_nom=-105.000

n_diag=1

[COHeader]

beam_id=1

emi_rcp=E

polar_disc=C

reason=A

gain=+30.00

n_bore=1

n_cont=3

[B1]

gain=+0.00

p=-99.559;+40.189

[C1]

gain=-3.00

n_point=30

p1=-109.008;+50.377

p2=-114.173;+49.623

p3=-120.598;+48.491

p4=-123.370;+47.547

p5=-124.126;+42.075

p6=-122.866;+37.170

p7=-120.724;+34.151

p8=-117.449;+32.264

p9=-114.551;+29.434

p10=-109.260;+28.679

p11=-105.102;+25.660

p12=-99.685;+23.208

p13=-96.913;+25.849

p14=-90.488;+28.679

p15=-86.079;+26.981

p16=-81.921;+23.396

p17=-77.890;+21.321

p18=-76.252;+21.321

p19=-77.008;+25.472

p20=-76.504;+31.887

p21=-74.866;+35.660

p22=-70.709;+39.434

p23=-68.945;+42.830

p24=-69.323;+46.415

p25=-72.724;+50.566

p26=-83.307;+51.698

p27=-90.866;+50.000

p28=-97.291;+49.811

p29=-105.228;+50.755

p30=-109.008;+50.377

[C2]

gain=-6.00

n_point=19

p1=-112.535;+62.453

p2=-124.882;+60.377

p3=-129.921;+51.887

p4=-131.307;+37.358

p5=-126.520;+28.113

p6=-116.189;+22.264

p7=-110.016;+16.415

p8=-99.433;+12.642

p9=-91.244;+12.453

p10=-80.787;+14.151

p11=-75.244;+12.642

p12=-69.701;+17.547

p13=-66.173;+35.472

p14=-64.283;+43.208

p15=-67.685;+55.660

p16=-78.898;+59.623

p17=-98.299;+62.264

p18=-108.882;+63.019

p19=-112.535;+62.453

[C3]

gain=-30.00

n_point=5

p1=-140.000;+70.000

p2=-60.000;+70.000

p3=-60.000;+0.000

p4=-140.000;+0.000

p5=-140.000;+70.000
Logged Data
Data can be logged to text file, where it has the following format (the entries in square brackets are fields with values that will depend upon the simulation setup):
Log data from run: [Filename]

Number of logs: [Number of variables logged, n]

Timesteps between logs: [Timesteps between file updates]

Elapsed Time [Var-1 long name] … [Var-n long name]

Time since start [Var-1 short name] … [Var-n short name]

s [Var-1 units] … [Var-n units]

[t-0] [Var-1 at t-0] … [Var-n at t-0]

[t-1] [Var-1 at t-1] … [Var-n at t-1]

: : :

[t-m] [Var-1 at t-m] … [Var-n at t-m]
Terrain Data General Import File Format
The General file format is a flexible documented format to the standard set of terrain file formats (USGS GTOPO 30, SRTM etc). Users can translate terrain of their own format into the General file format for loading into Visualyse Professional.
The first terrain data point read is the height at the bottom left of the terrain region specified. The file is binary and each spot height is 2 bytes.
By default values of -9999 will be displayed as sea on the map so as to differentiate from land with height zero. The Propagation models and Path Profile will use a height of zero in place of -9999.
The first height data point is taken to be the terrain height at the bottom left the next. All the fields are twos compliment, little-endian (Intel) integers and the file is packed binary.
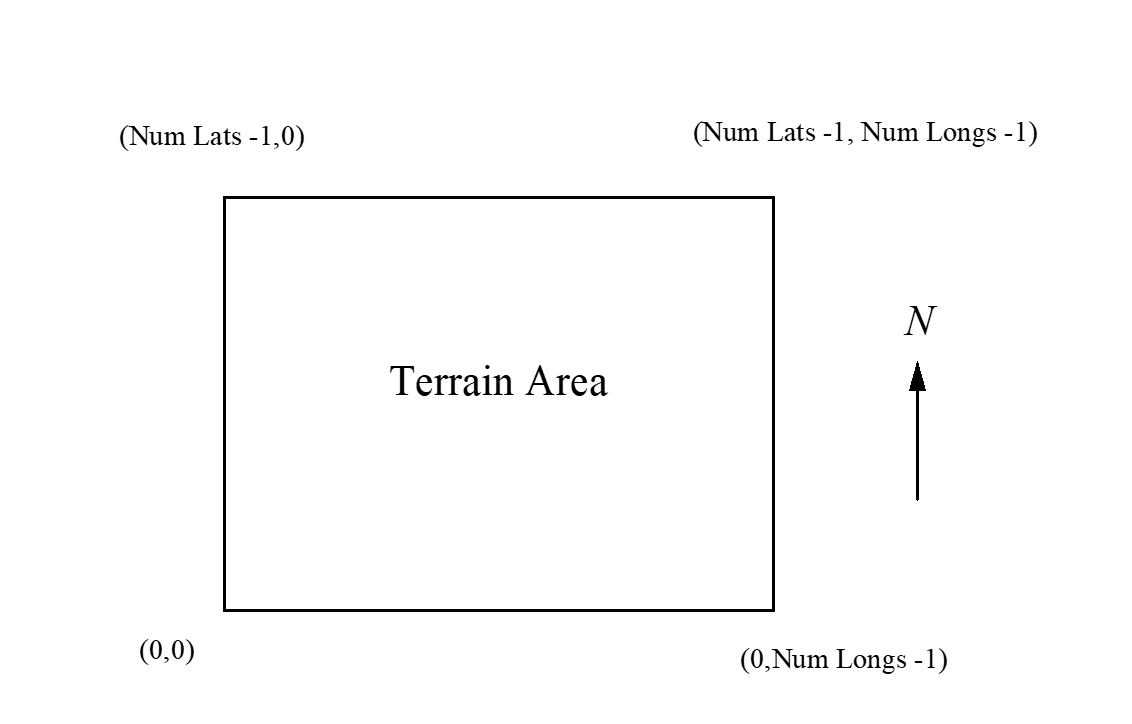
Terrain data can be imported into Visualyse Professional using the following file format:
| Description | Units | Size in bytes |
|---|---|---|
| Type | - | 4 |
| Version | - | 4 |
| Bottom most latitude | milliseconds | 4 |
| Left most longitude | milliseconds | 4 |
| Nlats | - | 4 |
| Nlongs | - | 4 |
| Spacing of latitude points | milliseconds | 4 |
| Spacing of longitude points | milliseconds | 4 |
| Height (1,1) | meters | 2 |
| Height (1,2) | meters | 2 |
| … | … | … |
| Height (1, nlongs) | meters | 2 |
| Height (2,1) | meters | 2 |
| Height (2,2) | meters | 2 |
| … | meters | 2 |
| Height (nlats, nlongs) | meters | 2 |
| EOF | - | - |
Where Nlats is the number of latitude points and Nlongs is the number of longitude points.
Land Use Generic File Format
The clutter data is assumed to be structured as in the figure below:
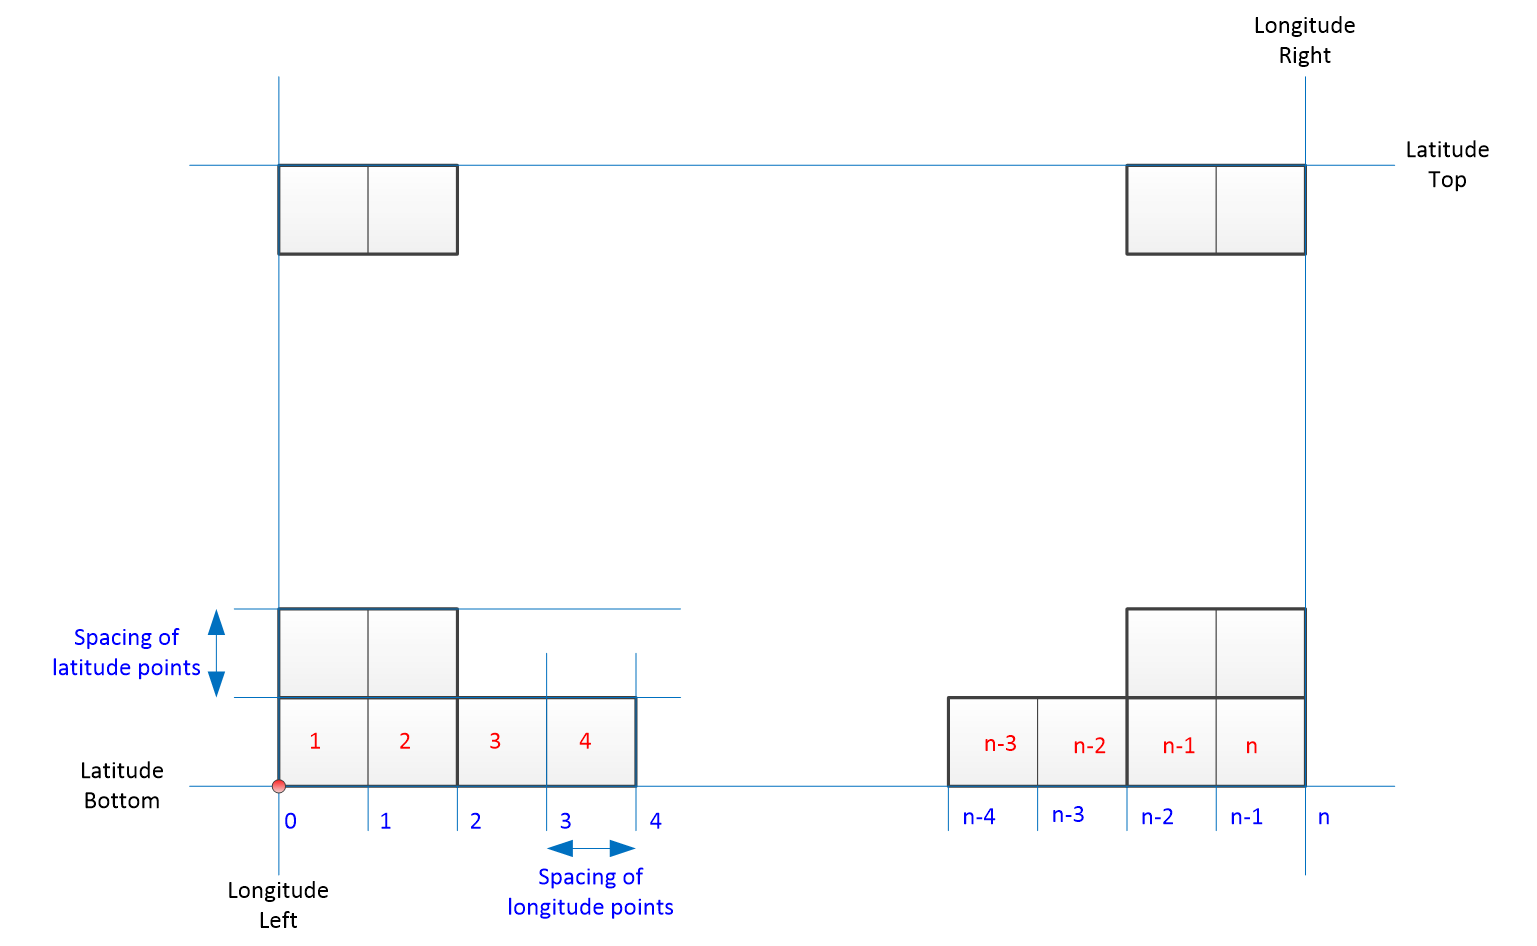
There is a grid of clutter codes starting from bottom left. Each clutter code represents the environment across the whole of the pixel: therefore with a grid of n lat/long lines there are n pixel codes not n+1 (as for terrain).
The location of the bottom right of the rectangle is defined via the (LatitudeBottom, LongitudeRight) point. The other corner of the rectangle is calculated from:
LongitudeRight = LongitudeLeft + LongitudePoints * LongitudeSpacing
LatitudeTop = LatitudeBottom + LatitudePoints * LatitudeSpacing
Each clutter code is assumed to be an integer in the range [0..15] so that there are sixteen possible clutter environments.
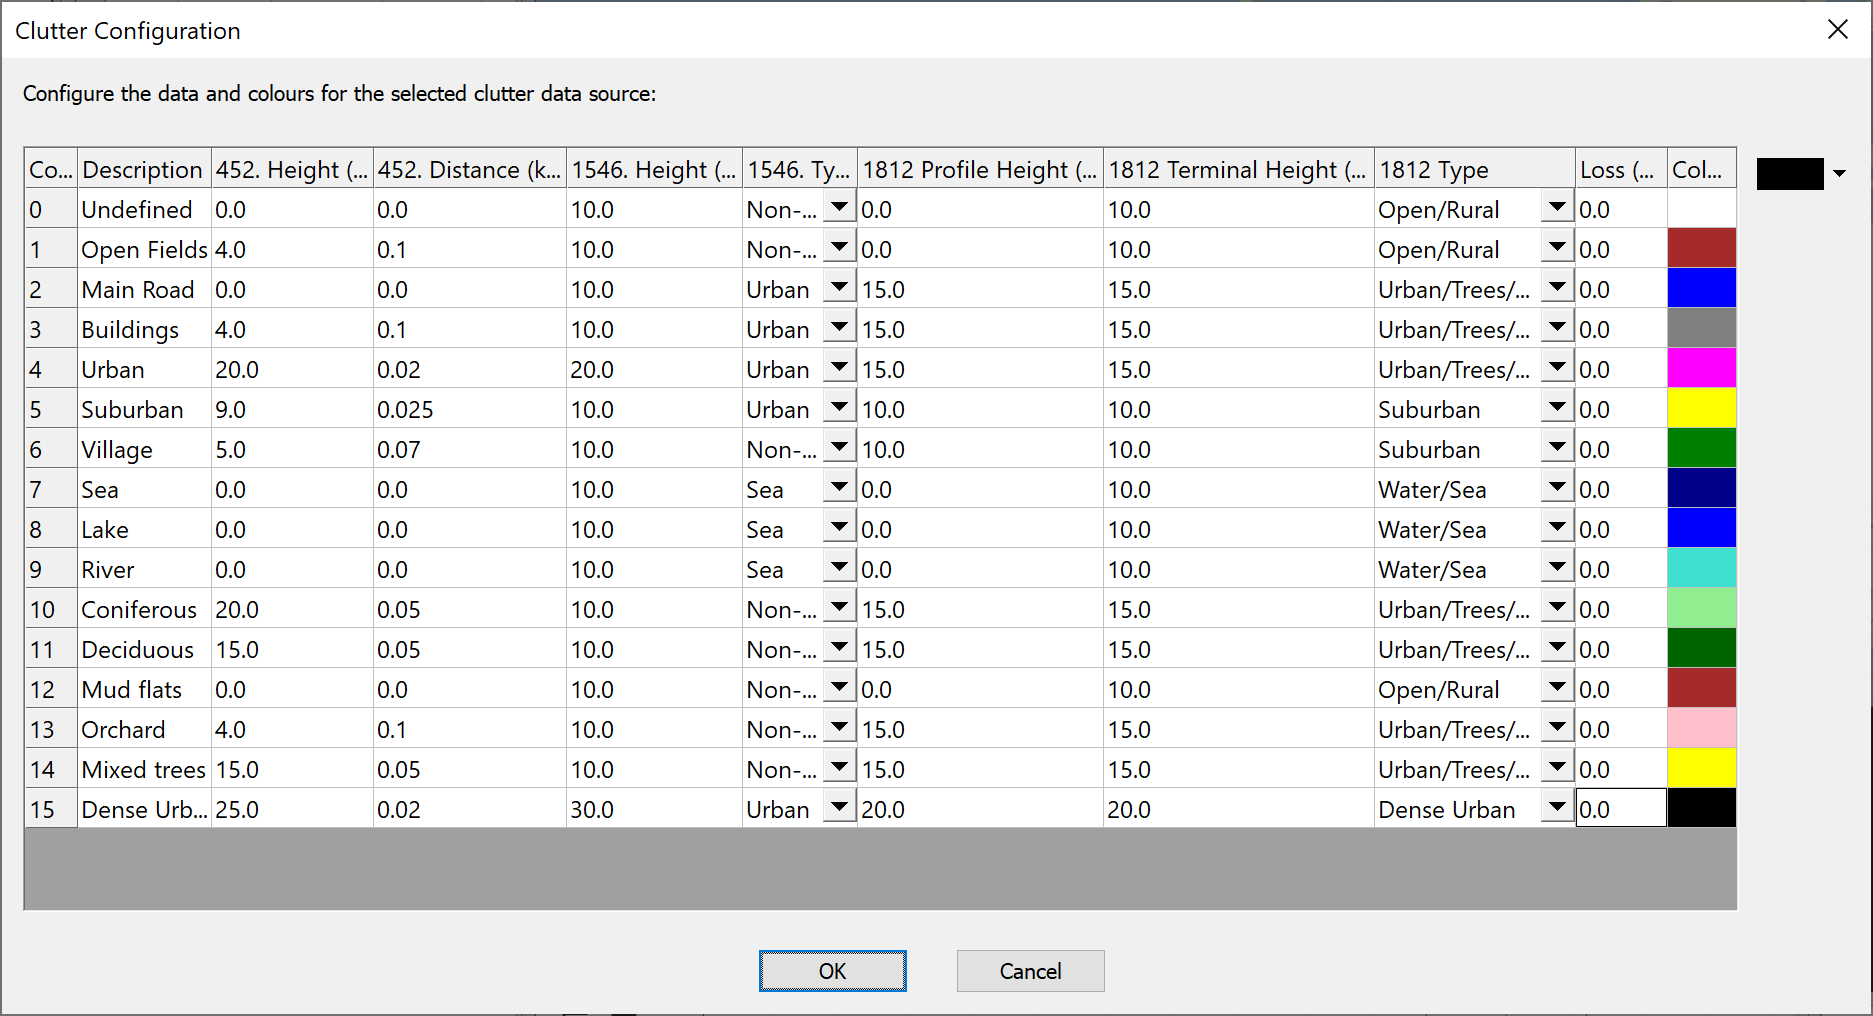
Mapping of codes to propagation parameters
The clutter codes are mapped to propagation parameters such as height of clutter and distance to clutter in the Visualyse Professional configuration dialog as shown in the figure below:
Reference Geoid
The clutter file format does not specify the reference geoid and all data used in a simulation (clutter data, terrain data and station locations) should use the same reference geoid.
File Format
Generic clutter data can be imported into Visualyse Professional using the following file format.
| Description | Units | Size in bytes |
|---|---|---|
| Type | - | 4 |
| Version | - | 4 |
| Bottom most latitude | milliseconds | 4 |
| Left most longitude | milliseconds | 4 |
| nLats | - | 4 |
| nLongs | - | 4 |
| Spacing of latitude points | milliseconds | 4 |
| Spacing of longitude points | milliseconds | 4 |
| String name of clutter type 1 | - | 20 |
| String name of clutter type 2 | - | 20 |
| : | : | : |
| String name of clutter type 16 | - | 20 |
| Code(1,1) | - | 1 |
| Code(1,2) | - | 1 |
| … | … | … |
| Code(1, nLongs-1) | - | 1 |
| Code(1, nLongs) | - | 1 |
| Code(2,1) | - | 1 |
| Code(2,2) | - | 1 |
| … | … | … |
| Code(nLats, nLongs-1) | - | 1 |
| Code(nLats, nLongs) | - | 1 |
| EOF | - | - |
The field “Type” should be set to 200 and the field “Version” should be 100.
Strings should be ASCII coded zero terminated and padded to a length of 20 bytes including zero.
All the fields are twos compliment, little-endian (Intel) integers and the file is packed binary.
View Overlay XML Files
It is possible to overlay images such as maps and vector data such as boundaries, roads etc on top of the Mercator, Plate Carree and 3D views. This section gives the file format for the XML file that describes the data.
The XML file and any referenced graphics files must be located in the “Visualyse 7/Overlays” directory at the time that Visualyse Professional 7 is started.
- View Overlay Images
- View Overlay Vector Line Data
- View Overlay Point Data
- View Overlay Drawing Objects
View Overlay Images
Images in formats such as JPG and BMP can be displayed on top of Visualyse Professional’s views. An XML file is used to define the four corners (lat, long) in either degrees or radians, and also point to the relevant file.
The format is given below, with the fields to complete contained within square brackets and in capital letters - i.e. [MAP_NAME]
<?xml version="1.0" encoding="utf-8"?>
<image xmlns="http://www.transfinite.com"
xmlns:xsi="http://www.w3.org/2001/XMLSchema-instance"
xsi:schemaLocation="http://www.transfinite.com overlay.xsd" name="[NAME]">
    <texture>[FILENAME]</texture>
    <bottomLeft units="[UNITS]" latitude="[LAT_BL]" longitude="[LONG_BL]" />
    <topLeft units="[UNITS]" latitude="[LAT_TL]" longitude="[LONG_TL]" />
    <topRight units="[UNITS]" latitude="[LAT_TR]" longitude="[LONG_TR]" />
    <bottomRight units="[UNITS]" latitude="[LAT_BR]" longitude="[LONG_BR]" />
    <colour>[TTRRGGBB]</colour>
</image>
The fields to enter are therefore:
NAME used to display this image on list of possible overlays
FILENAME filename may include full path or be relative to overlays directory
UNITS either “degrees” or “radians”
LAT_BL latitude in relevant units of bottom left of image
LAT_TL latitude in relevant units of top left of image
LAT_BR latitude in relevant units of bottom right of image
LAT_TR latitude in relevant units of top right of image
LONG_BL longitude in relevant units of bottom left of image
LONG_TL longitude in relevant units of top left of image
LONG_BR longitude in relevant units of bottom right of image
LONG_TR longitude in relevant units of top right of image
TTRRGGBB codes in hex for the Transparency, Red, Green & Blue to use
Note that it is necessary to define the lat/long of all four corners of the image rather than just top (top left and bottom right) as some images could be rotated. For example, maps generated in Universal Transverse Mercator (UTM) or local variants such as the UK’s National Grid do not always align with vertically with the North-South line.
An example of this format is given below:
<?xml version="1.0" encoding="utf-8"?>
<image xmlns="http://www.transfinite.com"
xmlns:xsi="http://www.w3.org/2001/XMLSchema-instance"
xsi:schemaLocation="http://www.transfinite.com overlay.xsd"
name="Google Maps Seattle">
    <texture>C:\Program Files (x86)\Visualyse 7\Overlays\Seattle Area.bmp</texture>
    <bottomLeft units="degrees" latitude="47.17" longitude="-125.6121825" />
    <topLeft units="degrees" latitude="49.81" longitude="-125.6121825" />
    <topRight units="degrees" latitude="49.81" longitude="-120.5035395" />
    <bottomRight units="degrees" latitude="47.17" longitude="-120.5035395" />
    <colour>ffffffff</colour>
</image>
View Overlay Vector Line Data
Vector data such as roads, railways, borders, boundaries etc can be displayed on top of Visualyse Professional’s views. An XML file is used to define a set of (lat, long) points and a line colour is used to connect them.
The format is given below, with the fields to complete contained within square brackets and in capital letters - i.e. [NAME]
<?xml version="1.0" encoding="utf-8"?>
<lines xmlns="http://www.transfinite.com"
xmlns:xsi="http://www.w3.org/2001/XMLSchema-instance"
xsi:schemaLocation="http://www.transfinite.com overlay.xsd"
name="[NAME]" colour="[TTRRGGBB]">
<line units="UNITS">
<coordinates>
“[LAT_1]”, “[LONG_1]”,
“[LAT_2]”, “[LONG_2]”,
“[LAT_3]”, “[LONG_3]”,
...
“[LAT_n]”, “[LONG_n]”
</coordinates>
</line>
</lines>
The fields to enter are therefore:
NAME used to display this image on list of possible overlays
TTRRGGBB codes in hex for the Transparency, Red, Green & Blue to use
UNITS either “degrees” or “radians”
LAT_i set of latitudes
LONG_i set of longitudes
Any number of (lat, long) points may be used, though there could be performance implications for very large data sets.
An example of this format is given below:
<?xml version="1.0" encoding="utf-8"?>
<lines xmlns="http://www.transfinite.com"
xmlns:xsi="http://www.w3.org/2001/XMLSchema-instance"
xsi:schemaLocation="http://www.transfinite.com overlay.xsd"
name="Washington BEA" colour="8000ffff">
    <line units="degrees">
        <coordinates>
        39.194801,-79.487396,
        39.205856,-79.487099,
        39.279827,-79.487877,
        39.216099,-79.507797,
        39.194801,-79.487396
        </coordinates>
    </line>
</lines>
View Overlay Point Data
Point data such as capital cities can be displayed on top of Visualyse Professional’s views. An XML file is used to define a set of (lat, long) points with a label.
The format is given below, with the fields to complete contained within square brackets and in capital letters - i.e. [NAME]
<?xml version="1.0" encoding="utf-8" ?>
- <points xmlns="http://www.transfinite.com"
xmlns:xsi="http://www.w3.org/2001/XMLSchema-instance"
xsi:schemaLocation="http://www.transfinite.com overlay.xsd"
name="[NAME]">
  <poi units="[UNITS]" legend="[LEG_1]" latitude="[LAT_1]" longitude="[LONG_1]" />
  <poi units="[UNITS]" legend="[LEG_2]" latitude="[LAT_2]" longitude="[LONG_2]" />
  <poi units="[UNITS]" legend="[LEG_3]" latitude="[LAT_3]" longitude="[LONG_3]" />
  <poi units="[UNITS]" legend="[LEG_4]" latitude="[LAT_4]" longitude="[LONG_4]" />
  <poi units="[UNITS]" legend="[LEG_5]" latitude="[LAT_5]" longitude="[LONG_5]" />
  <poi units="[UNITS]" legend="[LEG_6]" latitude="[LAT_6]" longitude="[LONG_6]" />
</points>
The fields to enter are therefore:
NAME used to display this image on list of possible overlays
UNITS either “degrees” or “radians”
LEG_i set of legends
LAT_i set of latitudes
LONG_i set of longitudes
Any number of (lat, long) points may be used, though there could be performance implications for very large data sets.
An example of this format is given below:
<?xml version="1.0" encoding="utf-8"?>
<points xmlns="http://www.transfinite.com"
xmlns:xsi="http://www.w3.org/2001/XMLSchema-instance"
xsi:schemaLocation="http://www.transfinite.com overlay.xsd"
name="Capital Cities of the World">
  <poi units="degrees" legend="Kabul" latitude="34.467" longitude="69.1833" />
  <poi units="degrees" legend="Tirane" latitude="41.3" longitude="19.81666667" />
  <poi units="degrees" legend="Algiers" latitude="36.7" longitude="3.133333333" />
  <poi units="degrees" legend="Plymouth" latitude="16.6802" longitude="-62.2014" />
  <poi units="degrees" legend="Saint Johns" latitude="17.1175" longitude="-61.8455" />
  <poi units="degrees" legend="The Valley" latitude="18.2249" longitude="-63.0668" />
</points>
View Overlay Drawing Objects
Basic shapes including Rectangles, Ellipses and Grids can be displayed on top of Visualyse Professional’s views. An XML file is used to define the drawing object as below:
Rectangle
The format is given below, with the fields to complete contained within square brackets and in capital letters - i.e. [NAME]
<?xml version="1.0" encoding="utf-8"?>
<drawing xmlns="http://www.transfinite.com"
xmlns:xsi="http://www.w3.org/2001/XMLSchema-instance"
xsi:schemaLocation="http://www.transfinite.com overlay.xsd"
name="[NAME]" colour="[TTRRGGBB]">
<rect units="[UNITS]" top="[LAT_TOP]" left="[LONG_LFT]" bottom="[LAT_BTM] right="[LONG_RGT]" />
</drawing>
The fields to enter are therefore:
NAME used to display this image on list of possible overlays
TTRRGGBB codes in hex for the Transparency, Red, Green & Blue to use
UNITS either “degrees” or “radians”
LAT_TOP top latitude
LONG_LFT left longitude
LAT_BTM bottom latitude
LONG_RGT right longitude
An example of this format is given below:
<?xml version="1.0" encoding="utf-8"?>
<drawing xmlns="http://www.transfinite.com"
xmlns:xsi="http://www.w3.org/2001/XMLSchema-instance"
xsi:schemaLocation="http://www.transfinite.com overlay.xsd"
name="Test Rectangle" colour="8000ffff">
<rect units="degrees" top="37.0" left="-9.0" bottom="23.5" right="12.0" />
</drawing>
Ellipse
The format is given below, with the fields to complete contained within square brackets and in capital letters - i.e. [NAME]
<?xml version="1.0" encoding="utf-8"?>
<drawing xmlns="http://www.transfinite.com"
xmlns:xsi="http://www.w3.org/2001/XMLSchema-instance"
xsi:schemaLocation="http://www.transfinite.com overlay.xsd"
name="[NAME]" colour="[TTRRGGBB]">
<ellipse units="[UNITS]" centrelat="[CTR_LAT]" centrelong="[CTR_LNG]" radiuslat="[RAD_LAT] radiuslong="[RAD_LNG]" />
</drawing>
The fields to enter are therefore:
NAME used to display this image on list of possible overlays
TTRRGGBB codes in hex for the Transparency, Red, Green & Blue to use
UNITS either “degrees” or “radians”
CTR_LAT centre latitude
CTR_LNG centre longitude
RAD_LAT radius latitude
RAD_LNG radius longitude
An example of this format is given below:
<?xml version="1.0" encoding="utf-8"?>
<drawing xmlns="http://www.transfinite.com"
xmlns:xsi="http://www.w3.org/2001/XMLSchema-instance"
xsi:schemaLocation="http://www.transfinite.com overlay.xsd"
name="Test Ellipse" colour="8000ffff">
<ellipse units="degrees" centrelat="60.0" centrelong="20.0" radiuslat="10" radiuslong="20" />
</drawing>
Grid
The format is given below, with the fields to complete contained within square brackets and in capital letters - i.e. [NAME]
<?xml version="1.0" encoding="utf-8"?>
<drawing xmlns="http://www.transfinite.com"
xmlns:xsi="http://www.w3.org/2001/XMLSchema-instance"
xsi:schemaLocation="http://www.transfinite.com overlay.xsd"
name="[NAME]" colour="[TTRRGGBB]">
<grid areaunits="[UNITS]" top="[LAT_TOP]" left="[LONG_LFT]" bottom="[LAT_BTM] right="[LONG_RGT]" horzres="[HOR_RES] vertres="[VER_RES]" />
</drawing>
The fields to enter are therefore:
NAME used to display this image on list of possible overlays
TTRRGGBB codes in hex for the Transparency, Red, Green & Blue to use
UNITS either “degrees” or “radians”
CTR_LAT centre latitude
CTR_LNG centre longitude
RAD_LAT radius latitude
RAD_LNG radius longitude
HOR_RES horizontal resolution (km)
VER_RES vertical resolution (km)
An example of this format is given below:
<?xml version="1.0" encoding="utf-8"?>
<drawing xmlns="http://www.transfinite.com"
xmlns:xsi="http://www.w3.org/2001/XMLSchema-instance"
xsi:schemaLocation="http://www.transfinite.com overlay.xsd"
name="Test Grid" colour="8000ffff">
<grid areaunits="degrees" top="30.0" left="-50.0" bottom="10" right="-30" horzres="300" vertres="300" />
</drawing>
Text File Format
Structure
Visualyse Professional has a file format that allows complete definition of simulations in a standard ASCII text file. In it are definitions of all objects and their attributes required to specify any Visualyse Professional sharing scenario. The file format can also be used to define single elements – for example a station or an antenna.
The format is based upon the Microsoft Windows INI structure, using section headers and field names as follows:
[Section Header]

[Field Name] = (value)
The section header describes the object being defined based upon the Visualyse Professional object tree. Each simulation starts at the root object “Simul” and then has branches for stations, antennas, links etc separated by a period or “.”1.
So the section header for the geographic location of a station called “FS TX” would be:
[Simul.Station List.FS TX.Start LatLongHeight]
Field names are the variables associated with the object defined by the section header – so for the geographic location the variables would be latitude and longitude. The section would then start as follows:
[Simul.Station List.FS TX.Start LatLongHeight]

Name=Start LatLongHeight

Description=Start Earth latitude, longitude, height

Latitude=N38:58'31.2034"

Longitude=W77:9'39.1658"
Creating Text Files
While in theory it is possible to create text files solely using a text editor, in practice it is easier to get Visualyse Professional to make a template which you can then edit. This ensures the format is the one that Visualyse Professional expects, as all the variables and objects must be specified in the correct format.
These can be done by either:
- Creating a simulation file (as normal) and then using the “Save As” option and selecting the text file format;
- Opening the Model View and saving the object required as a text file.
Batch Mode
It is also possible to run Visualyse Professional in batch mode from the command line. This could be useful if there are many simulations to be run or an iterative approach is required.
With this file format the command line would be something like:
C:\\Program Files (x86)\\Visualyse 7\\Program\>visualyse –x mss-fs.txt
where the -x command closes Visualyse Professional on completion of the run.
This command line would save the results into the file “mss-fs.txt” which could then be read in by other programs.
Service Area Wizard
Station locations can be read into Visualyse Professional using the service area wizard. This requires a text file with a set of rows similar to this:
[Lat-1], [Long-1]

[Lat-2], [Long-2]

: :
The fields should be separated by commas.
TLEs
Satellites orbit data can be read into Visualyse Professional using the Two Line Element (TLE) format.
This file format is defined in the document that can be found here:
http://celestrak.com/columns/v04n03/
Note: Visualyse Professional requires the first line to be the name of the satellite so the software can identify it.
FS Import
The FS Import tool uses a pre-defined format in which each row defines one point to point (PtP) link. The FS Import requires the following fields to be defined and then either pasted into Visualyse Professional or be available in a CSV format file:
| Column | Field |
|---|---|
| 1 | Link Number |
| 2 | Link Name Or Reference |
| 3 | Operator Name |
| 4 | Centre Frequency (GHz) |
| 5 | Licensed Bandwidth (MHz) |
| 6 | Tx OBW (MHz) |
| 7 | Transmit Station Name |
| 8 | Tx Longitude (degrees) |
| 9 | Tx Latitude (degrees) |
| 10 | Tx Height Above Terrain (m) |
| 11 | Receive Station Name |
| 12 | Rx Longitude (degrees) |
| 13 | Rx Latitude (degrees) |
| 14 | Rx Height Above Terrain (m) |
| 15 | Transmit Power (dBW) |
| 16 | Tx Antenna Peak Gain (dBi) |
| 17 | Tx Antenna Gain roll-off Code |
| 18 | Tx Antenna Beam width (degrees) |
| 19 | Tx Feed Loss (dB) |
| 20 | Rx Antenna Peak Gain (dBi) |
| 21 | Rx Antenna Gain roll-off Code |
| 22 | Rx Antenna Beam width (dB) |
| 23 | Rx Feed Loss (dB) |
| 24 (*) | Hop Geoclimatic Factor (c) |
| 25 (*) | pL (Rec P.453) |
| 26 | Pol |
| 27 | System Temp (k) |
| 28 | C/I Threshold |
| 29 | C/N Threshold |
| 30 | C/(N+I) Threshold |
| 31 | I/N Threshold |
Fields marked (*) are not required in Visualyse Professional Version 7 but are there to ensure backwards compatibility.
Valid polarisation codes are given in the table below:
| Polarisation | Code |
|---|---|
| Linear horizontal | H |
| Linear vertical | V |
| Left hand circular | LHC |
| Right hand circular | RHC |
The gain patterns should match one of the following codes or text descriptions:
| Code | Gain Pattern |
|---|---|
| 0 | Analytic ES |
| 1 | Analytic NGSO |
| 2 | App 29 Earth Station |
| 3 | App 30 Earth Rx Reg 1 & 3 Comm |
| 4 | App 30 Earth Rx Reg 1 & 3 Ind |
| 5 | App 30 Earth Rx Reg 1 & 3 WRC-97 |
| 6 | App 30 Earth Rx Reg 2 |
| 7 | App 30 Satellite Tx Reg 1 & 3 |
| 8 | App 30 Satellite Tx Reg 1 & 3 FR |
| 9 | App 30 Satellite Tx Reg 2 |
| 10 | App 30 Satellite Tx Reg 2 FR |
| 11 | App 30 Space |
| 12 | App 30 Space Fast roll-off |
| 13 | App 30A Satellite Rx Reg 1 & 3 |
| 14 | App 30A Satellite Rx Reg 1 & 3 FR |
| 15 | App 30A Satellite Rx Reg 2 |
| 16 | App 30A Satellite Rx Reg 2 FR |
| 17 | App 30B Earth Station A |
| 18 | App 30B Earth Station B |
| 19 | App 30B Space Station |
| 20 | App 30B Space Station FR |
| 21 | App 7 Earth Station |
| 22 | App 7 Fixed Service |
| 23 | App 8 Earth Station |
| 24 | Bessel |
| 25 | Bessel Standard |
| 26 | Capped Bessel |
| 27 | Cosine |
| 28 | ETS 300-157 Rx |
| 29 | ETS 300-158 Rx |
| 30 | ETS 300-159 Rx |
| 31 | ETS 300-159 Tx Spec 1 |
| 32 | ETS 300-159 Tx Spec 2 |
| 33 | ETS 300-327 Rx |
| 34 | ETS 300-327 Tx |
| 35 | ETS 300-332 Rx |
| 36 | ETS 300-332 Tx |
| 37 | ETS 300-333 Rx |
| 38 | FSATMULTI_1A Earth Station |
| 39 | FSATMULTI_1A Type A |
| 40 | GPS L1 |
| 41 | GPS L2 |
| 42 | GPS User |
| 43 | IMT-MODEL 28 GHz BS |
| 44 | IMT-MODEL 28 GHz UE A |
| 45 | IMT-MODEL 28 GHz UE B |
| 46 | IMT-MODEL BS Indoor |
| 47 | IMT-MODEL BS Suburban |
| 48 | IMT-MODEL BS Urban Outdoor |
| 49 | IMT-MODEL UE Indoor |
| 50 | IMT-MODEL UE Suburban |
| 51 | IMT-MODEL UE Urban Outdoor |
| 52 | ITU-R BO.1443-1 |
| 53 | ITU-R BO.1443-3 |
| 54 | ITU-R F.1245 |
| 55 | ITU-R F.1245-1 |
| 56 | ITU-R F.1245-1 Annex 1 |
| 57 | ITU-R F.1245-2 |
| 58 | ITU-R F.1245-2 Annex 1 |
| 59 | ITU-R F.1245-3 |
| 60 | ITU-R F.1245-3 Annex 1 |
| 61 | ITU-R F.1336 (2.1.1) |
| 62 | ITU-R F.1336 (2.1.2) |
| 63 | ITU-R F.1336 (2.2) |
| 64 | ITU-R F.1336 (4, NOTE 4) |
| 65 | ITU-R F.1336-1 (k=0) |
| 66 | ITU-R F.1336-1 (k=0.1) |
| 67 | ITU-R F.1336-1 (k=0.2) |
| 68 | ITU-R F.1336-1 (k=0.7) |
| 69 | ITU-R F.1336-2 (2.1) [k=0.1] |
| 70 | ITU-R F.1336-2 (2.1) [k=0.2] |
| 71 | ITU-R F.1336-2 (2.1) [k=0.7] |
| 72 | ITU-R F.1336-2 (2.1) [k=0] |
| 73 | ITU-R F.1336-2 (2.2) [k=0.1] |
| 74 | ITU-R F.1336-2 (2.2) [k=0.2] |
| 75 | ITU-R F.1336-2 (2.2) [k=0.7] |
| 76 | ITU-R F.1336-2 (2.2) [k=0] |
| 77 | ITU-R F.1336-5 Rec 2.1 |
| 78 | ITU-R F.1336-5 Rec 2.2 |
| 79 | ITU-R F.1336-5 Rec 3.1.1 |
| 80 | ITU-R F.1336-5 Rec 3.1.2 |
| 81 | ITU-R F.1336-5 Rec 3.2 |
| 82 | ITU-R F.1336-5 Rec 4 |
| 83 | ITU-R F.1336-5 Annex 4 |
| 84 | ITU-R F.1891 (LN = -25) |
| 85 | ITU-R F.699-2 |
| 86 | ITU-R F.699-2R |
| 87 | ITU-R F.699-3 |
| 88 | ITU-R F.699-3R |
| 89 | ITU-R F.699-5 |
| 90 | ITU-R F.699-6 |
| 91 | ITU-R F.699-7 |
| 92 | ITU-R F.699-8 |
| 93 | ITU-R M.1851 (COS Average) |
| 94 | ITU-R M.1851 (COS Peak) |
| 95 | ITU-R M.1851 (COS) |
| 96 | ITU-R M.1851 (COS2 Average) |
| 97 | ITU-R M.1851 (COS2 Peak) |
| 98 | ITU-R M.1851 (COS2) |
| 99 | ITU-R M.1851 (COS3 Average) |
| 100 | ITU-R M.1851 (COS3 Peak) |
| 101 | ITU-R M.1851 (COS3) |
| 102 | ITU-R M.1851 (COS4 Average) |
| 103 | ITU-R M.1851 (COS4 Peak) |
| 104 | ITU-R M.1851 (COS4) |
| 105 | ITU-R M.1851 (SIN Average) |
| 106 | ITU-R M.1851 (SIN Peak) |
| 107 | ITU-R M.1851 (SIN) |
| 108 | ITU-R M.2101 |
| 109 | ITU-R RA.1631 |
| 110 | ITU-R RS.1813 (Recommends 1) |
| 111 | ITU-R RS.1813 (Recommends 2) |
| 112 | ITU-R S.1328 USAKUL1 |
| 113 | ITU-R S.1428 |
| 114 | ITU-R S.1428-1 |
| 115 | ITU-R S.1428-1 Rec |
| 116 | ITU-R S.1528 (1.2) LN = -15 |
| 117 | ITU-R S.1528 (1.2) LN = -20 |
| 118 | ITU-R S.1528 (1.2) LN = -25 |
| 119 | ITU-R S.1528 (1.2) LN = -30 |
| 120 | ITU-R S.465-5 |
| 121 | ITU-R S.465-5 (APL) |
| 122 | ITU-R S.465-5 prior to 1993 |
| 123 | ITU-R S.465-6 Rx |
| 124 | ITU-R S.465-5 Tx |
| 125 | ITU-R S.580-6 |
| 126 | ITU-R S.580-6 (APL) |
| 127 | ITU-R S.672-3 Annex 1 Ls = -10 |
| 128 | ITU-R S.672-3 Annex 1 Ls = -20 |
| 129 | ITU-R S.672-3 Annex 1 Ls = -25 |
| 130 | ITU-R S.672-3 Annex 1 Ls = -30 |
| 131 | ITU-R S.672-3 Ln = -20 |
| 132 | ITU-R S.672-3 Ln = -25 |
| 133 | ITU-R S.672-3 Ln = -30 |
| 134 | ITU-R S.672-4 Annex 1 Ls = -10 |
| 135 | ITU-R S.672-4 Annex 1 Ls = -20 |
| 136 | ITU-R S.672-4 Annex 1 Ls = -25 |
| 137 | ITU-R S.672-4 Annex 1 Ls = -30 |
| 138 | ITU-R S.672-4 Ln = -20 |
| 139 | ITU-R S.672-4 Ln = -25 |
| 140 | ITU-R SA.509 Rec 1.1 |
| 141 | ITU-R SA.509 Rec 1.2 |
| 142 | Linear with angle |
| 143 | NGSO FSS RX |
| 144 | NGSO FSS TX |
| 145 | Omni directional |
| 146 | PFD Area |
| 147 | Parabolic rolloff |
| 148 | Resolution 221 (LN = -25) |
| 149 | Resolution 221 (LN = -26) |
| 150 | Resolution 221 (LN = -28) |
| 151 | Resolution 221 (LN = -30) |
| 152 | Resolution 221 (LN = -32) |
| 153 | SMATV |
| 154 | Sine |
| 155 | Sine(x)/x |
| 156 | SkyBridge RX Type A |
| 157 | SkyBridge TX Type A |
| 158 | TVRO |
| 159 | Teledesic 2 - RX |
| 160 | Teledesic 2 - RX fixed BW |
| 161 | Teledesic 2 - TX |
| 162 | Teledesic 2 - TX fixed BW |
| 163 | Teledesic Type A |
| 164 | Teledesic Type B |
| 165 | Teledesic Type C |
Import Tx System
The Import Tx System tool uses a pre-defined format in which each row defines one Transmit station and link. The Import Tx System tool requires the following fields to be defined and then either pasted into Visualyse Professional or be available in a CSV format file:
| Column | Field |
|---|---|
| 1 | Number |
| 2 | Reference |
| 3 | Operator Name |
| 4 | Centre Frequency (GHz) |
| 5 | Licensed Bandwidth (MHz) |
| 6 | Tx OBW (MHz) |
| 7 | Tx Station Name |
| 8 | Tx Longitude (degrees) |
| 9 | Tx Latitude (degrees) |
| 10 | Tx Height Above Terrain (m) |
| 11 | Transmit Power (dBW) |
| 12 | Tx Antenna Peak Gain (dBi) |
| 13 | Tx Antenna Gain roll-off Code |
| 14 | Tx Antenna Beam width (degrees) |
| 15 | Polarisation |
| 16 | Icon |
| 17 | Tx Antenna Azimuth (degrees) |
| 18 | Tx Antenna Elevation (degrees) |
| 19 | Tx Antenna Feeder Loss (dB) |
| 20 | Number of Links (optional field) |
Valid polarisation codes are given in table 3 in the previous section
The gain patterns should match one of the codes or text descriptions in Table 4 in the previous section.
The Icon should be a string of the form icon-name (R,G,B) where R,G,B are values in the range 0 – 255 to indicate colour. For example: dish-medium (200,60,25)
Tower Icons
| Name |
|---|
| broadcast-tower |
| cell-tower |
| golf-ball |
| microwave-tower |
| office-building |
| broadcast-tower |
Dish Icons
| Name |
|---|
| 5G-base |
| dish-large |
| dish-medium |
| dish-small |
| dish-tiny |
| house |
| microwave-dish |
| radar |
| router |
Satellite Icons
| Name |
|---|
| 3-cube |
| 3-panel-h |
| 3-panel |
| 4-dish |
| 8-panel |
| cube |
| eos |
| gps |
| gso |
| hubble |
| iss |
| leo-2-dish-h |
| leo-2-dish |
| leo |
| ngso-v |
| ngso |
| t-long |
| t-short |
| wide-span |
Handset Icons
| Name |
|---|
| mobile-small |
| mobile |
| satphone |
Vehicle Icons
| Name |
|---|
| aircraft |
| blimp |
| car |
| ferry |
| helicopter |
| rocket |
| ship |
| shuttle |
| tank |
| train |
| truck |
Broadcasting Icons
| Name |
|---|
| camera-small |
| camera |
| hand-mic-small |
| hand-mic |
| headset-small |
| headset |
| mic-symbol-small |
| mic-symbol |
Marker Icons
| Name |
|---|
| marker-cross |
| marker-dot |
| marker-flag |
| marker-map-rounded |
| marker-map |
| marker-pin |
| marker-ring |
| marker-triangle |
Import Rx System
The Import Rx System tool uses a pre-defined format in which each row defines one Receive station and link. The Import Rx System tool requires the following fields to be defined and then either pasted into Visualyse Professional or be available in a CSV format file:
| Column | Field |
|---|---|
| 1 | Number |
| 2 | Reference |
| 3 | Operator Name |
| 4 | Centre Frequency (GHz) |
| 5 | Licensed Bandwidth (MHz) |
| 6 | Rx OBW (MHz) |
| 7 | Rx Station Name |
| 8 | Rx Longitude (degrees) |
| 9 | Rx Latitude (degrees) |
| 10 | Rx Height Above Terrain (m) |
| 11 | Rx Antenna Peak Gain (dBi) |
| 12 | Rx Antenna Gain roll-off Code |
| 13 | Rx Antenna Beam width (degrees) |
| 14 | Polarisation |
| 15 | Icon |
| 16 | Rx Antenna Azimuth (degrees) |
| 17 | Rx Antenna Elevation (degrees) |
| 18 | Rx Antenna Feeder Loss (dB) |
| 19 | Rx Temperature (K) |
Valid polarisation codes are given in table 5 in the previous section
The gain patterns should match one of the codes or text descriptions in Table 4 in the previous section.
The Icon should be as per the previous section.
Import Non-GSO Orbit Elements
The Import Non-GSO Orbit Elements tool uses a pre-defined format in which each row defines one Non-GSO station. The Import Non-GSO Orbit Elements requires the following fields to be defined and then either pasted into Visualyse Professional or be available in a CSV format file:
| Column | Field |
|---|---|
| 1 | Number |
| 2 | Semi-major axis, a (km) |
| 3 | Eccentricity, e |
| 4 | Inclination, i (degrees) |
| 5 | Use LAN (TRUE/FALSE) |
| 6 | Longitude ascending node / RAAN (degrees) |
| 7 | Argument of periapsis (degrees) |
| 8 | True anomaly (degrees) |
-
This is the reason that Visualyse Professional object names are not allowed to include the “.” character ↩