Visualyse User Guide

Documentation Control
| Date: | Software Version: |
|---|---|
| April 2024 | 7.10.9.2 |
Contact Information
You can contact us at:
Address Transfinite Systems Ltd, Suite 24 (5th Floor), AMP House, Dingwall Road, Croydon, CR0 2LX U.K
Phone +44 20 3904 3220
Fax +44 20 3904 3211
Email info@transfinite.com
Web www.transfinite.com
Transfinite Systems reserves the right to change features and screen layouts without notice.
©Transfinite Systems Ltd
Introduction
Welcome to the Visualyse Professional User Guide
Visualyse Professional is a software tool that allows you to simulate a wide range of radiocommunication systems, and the potential interference levels between them. This User Guide provides all the information you need to operate the software.
In other documents you will find the User Guide for the add-on Modules, a Tutorial, a Technical Annex giving background to the calculations, and a description of each of the example files.
Our assumptions about you, the User are that you are an engineer of some kind and that your understanding of radio systems and interference issues is good. We assume that you are mainly looking for guidance on the operation of the software.
Therefore the main aim of this Guide is to show you how to map your real world understanding onto the abstract models and concepts in Visualyse. This is relatively easy to do as the concepts and models in Visualyse are based on our analysis of the real world of radiocommunications, and we anticipate significant overlap between our world and yours.
We recommend that you read at least the overview section thoroughly. Other sections of this User Guide can be used as reference books when you are building and editing your simulations. If you are a typical user you will be able to make some good progress by experimenting with the software itself – perhaps after having followed the Tutorial.
This section of the User Guide gives an overview of the software. It explains at a high level what the software can do and also serves as a road map to rest of the guides.
Other sources of information include:
-
The example files shipped with the software, plus the document describing them
-
Telephone technical support (if you have a current Annual Maintenance and Support contract)
-
Web site:
-
User group newsletter – issued periodically to everyone with an Annual Maintenance and Support Contract
-
Training courses – by arrangement with the Transfinite Systems
About The User Guide
What is Visualyse Professional?
Visualyse Professional has been designed to simulate radio systems and to analyse potential interference between such systems.
Visualyse will allow you to faithfully model many types of radio system and provides support for the definition of terrestrial networks, space based systems, radar, fixed and mobile communications.
Its range of built-in antenna and propagation models means that most of the time the elements needed to model your system, even if the systems as a whole is innovating and new, are already there and you simply pick them from list.
Increasingly we find that people are using Visualyse for other types of modelling, and this is possible due to the open and flexible design of the software.
Visualyse can be used for many other types of analysis, and users are supported in this by the graphical feedback, the possibility to track and analyse internal variables and the simple underlying model that the software uses.
Graphical Feedback
An important feature of Visualyse is the graphical interface and the animated interactive views. The feedback from these views allows complex simulations to be set-up and more easily verified.
You will see immediately if you create a station or a link and it is not in the location you intended. The dynamics of your scenario can be displayed on a variety of map projections.
Graphs showing the evolution of any variable or statistical information on any variable are also interactively updated.
Not a Black Box
Engineering software is often presented as a black box system. This means that you set up your input and the software tells you an answer, with little or no explanation. In some applications you may see improvements on this and have results presented at several levels of detail.
In Visualyse, details of every calculation can be displayed and analysed - using Model Views, Table Views and Watch Windows and in statistical form as histograms or cumulative distributions. This is true for every variable whether specified as an initial input (it may after all evolve), whether a direct output, or whether part of some intermediate calculation.
Any variable can be written to a text file and logged at each time step for external analysis and processing if necessary. This option allows you to completely verify the calculations against external standards.
Object Orientation
The data needed to define a simulation are entered via a series of dialogs: one for each of the Visualyse modelling elements. The modelling elements reflect real world objects and concepts from radiocommunications.
As such, communications engineers should be familiar with the modelling concepts with Visualyse and may find the software intuitive and simple to use.
The next sections explain this main function of Visualyse, as an interference analysis tool. Build on Simple Foundations outlines some of the other uses of the software.
Visualyse as an Interference Analysis Tool
The structure of Visualyse reflects its core function as an interference analysis tool. User defined elements are the basic building blocks. These elements include Antennas, Carriers, Stations and Links.
An overview of how the building blocks fit together is described in Overview of Visualyse Professional.
Basic Modelling Elements
The basic process in setting up interference scenarios is to define radio stations and to link them together – Visualyse includes objects called Stations and Links.
In the real world stations use antennas and so Visualyse has an Antenna object to model the behaviour of antennas. A Station in Visualyse is defined by a location, rules for its movement and the antennas it uses and how it points them.
Links can be defined by a start and end Station and include details of EIRP, Frequency and each has a specified Carrier.
Having defined the basic modelling elements, Links can then be selected as wanted or interfering (or both), and this reflects our experience of how spectrum sharing and interference analysis studies are conceptualised.
Antennas, Carriers, Stations and Links contain almost all the information needed to perform interference calculations.
Stations and Links can be placed into Groups e.g. satellite constellations can be treated as a single Group of Stations, multiple uplinks to a single satellite can be treated as a Group of Links. Analysis of Groups of Stations and Links allows large scenarios to be analysed more easily.
Define the Required Output
Interference can be analysed in terms of:
- C – the wanted carrier level
- I – the interfering carrier level
- N – the wanted system noise
- C/I
- C/N
- C/N+I
- I/N
- PFD – the Power Flux Density
- EPFD – the Equivalent Power Flux Density
Interference can be from a single source or aggregated from multiple antennas on multiple Stations.
Where interference or wanted signal levels vary with time (due to the motion of stations, signal fading or perhaps some other time dependent effect), Visualyse can collect and display statistical information.
Propagation Modelling
In Visualyse Professional Version 7 you can select from 22 propagation models and apply them alone or in combination to Visualyse Links.
As different models may apply in different environments, you can define any number of link ‘Types’ and have a different set of propagation conditions for each. By default you will see there are the following Link Types:
- Terrestrial Fixed
- Terrestrial Mobile
- Space to Earth
- Space to Space
- Broadcasting
Interference Calculation
The interference calculation that Visualyse performs requires you to specify:
- Your wanted or victim link(s)
- The unwanted or interfering link(s)
- A number of calculation options
In default configuration the software will take the carrier centre frequency and bandwidth that you have specified and calculate the overlap between the wanted and unwanted carriers.
It will perform an aggregation based on the power sum of all the unwanted sources, taking into account their relative power levels, antenna gain (calculated based on geometry), path loss etc.
There are a number of additional factors that can be included in the calculation. For example:
- The net filter discrimination calculated from the transmit and receive spectrum masks
- Polarisation isolation
- Possible multiple hits from a narrow band unwanted carrier to a broadband wanted
- Radar ‘on tune rejection’.# Interference Calculation
Build on Simple Foundations
Although based on the combination of very simple elements, it is very easy to create scenarios that are large and complex using Visualyse.
The software supports you in the complex analysis through:
- Grouping of Station and Link objects
- Use of Wizards to create and modify groups – for example, the Service Area Wizard that allows you to create (among other things) large numbers of hexagonally deployed terrestrial stations, or the Link to Service Area Wizard that will allow you to connect all these Stations in multiple Links.
- Import of data from various external sources, including the space and terrestrial IFICs or from a simply formatted grid (or CSV file) that you can define and edit in your windows compatible spreadsheet.
- Definition of ‘Dynamic Links’ and complex ‘Tracking Strategies’ that allow you to model networks that may include handover
- Modelling traffic variations (with use of the Traffic Module)
- Use of Monte-Carlo modelling for any variable (with use of the Define Variable Module)
- Use of terrain data, land use and clutter data in our propagation models (with use of the Terrain Module).
These and other features allow you to refine and expand simple scenarios into large and accurate representations of sharing scenarios.
The key point is that it is simple to learn the basic operation of the software and simple models for the basis of much more complex ones.
This is true of general modelling and analysis (described in the next section) as it is of communications and interference modelling.# Build on Simple Foundations
Visualyse as a General System Analysis Tool
The flexibility and basic design of Visualyse means that it can be used for many purposes other than interference analysis. All the variables contained in the simulation are open to the user and can be charted and exported for further processing.
You can collect statistics on any variable in the simulation – a feature whose usefulness is unlimited.
Some indication of the flexibility of the software can be given by the following list of possible use. This is in no way exhaustive.
- Terrestrial network deployment and coverage analysis
- Visualisation of the geometry and dynamics of complex scenarios
- Antenna Beam and Footprint display
- Satellite Constellation definition and analysis
- Coverage and service level analysis.
- End to end performance analysis of multi-hop systems
- Path loss analysis
- Link multipath fading analysis
- Link Budget Analysis
- Production of maps containing features from the ITU IDWM data
- Analysis of visibility statistics for non-GSO satellite constellations
Most probably you have bought Visualyse to do interference analysis, but as your experience and confidence with the tool grows; you will find many other ways to use it.
Visualyse Windows and View
The structure of Visualyse is referred to as a “Document-View” architecture.
Your simulation information is all contained in a Visualyse document. This is a file with extension .sim. A document is a simulation plus all the collected data, current state information and current configuration parameters.
The information in the document can be analysed through several ‘Views’, such as Map views, Model View or Graph Views. Multiple views of multiple documents can be open at the same time. Each offers a different perspective on the same information.
Visualyse simulations can be viewed using the following types of windows:
- Flat projection Map View - this is a rectangular projection of the earth's surface. When a Map View is created the projection is either Plate-Carrée or Mercator projection.
- 3D View - this is a perspective projection of the Earth and surrounding orbits, viewed from a point in space.
- Watch Window - in the watch window, select simulation variables to watch as they evolve. The variable is presented in textual form.
- Model View - the Model View shows a hierarchical view of the simulation elements. You can create, edit, save and load objects from this view.
- Data vs. Time graph - this is a graph of any variable in the simulation against simulation time, updated interactively.
- Distribution chart - this view is used to show probability distributions and cumulative distributions calculated during a simulation.
- Data vs. Data graph - this allows any two Visualyse variables to be plotted against each other on a scatter plot.
- Frequency View – this shows graphically the relative centre frequencies of the wanted and a selected interfering link together with the interferer’s transmit spectrum mask and victim’s receive filter
If you have the Visualyse Terrain Module, there is also the:
- Path profile view that will show the terrain spot heights along any chosen great circle path.
All views can be configured: if you right mouse clicking in the view, outside the active plot area, it will bring up the properties dialog. This is equivalent to selecting Configure from the View menu.
Map and 3D Views
The flat projection map and 3D windows provide animated views of the simulation geometry and connectivity i.e. where the Stations are, where they are going and which Stations are connected together. These views can also be used to plot antenna coverage, colour coded or contoured area analysis and to display overlays on top of a simulation.
As a snapshot of the scenario you are simulating for a report or for your own verification purposes, these views are invaluable.
Watch Window
The watch window is a way of monitoring the evolution of selected simulation variables.
Select and order a list of variables and watch as they are interactively updated as the simulation runs.
The data in the watch window can be copied at any time using the copy button at the top right. The copied data can be pasted into other applications (for example Microsoft Word or Excel) in a tab delimited form.
Model View Window
The Model View shows the structure of a simulation in a hierarchical arrangement of objects and their parameters. Simulation objects can be added, edited, duplicated, deleted, loaded and saved from this view.
Save and Load options allow you to save and object and it’s parameters to a text file. This allows you to edit the object externally and reload with new data.
Graph Windows
There are three kinds of Graph Windows allowing variables and statistics to be plotted. The three graph types are:
- Data vs. Time graph
- Data vs. Data graph
- Distribution charts
Data vs. Time graphs allow an interactive monitor to be placed on any simulation variable. Interference levels and event profiles can be obtained using a Data vs. Time graph.
Data vs. Data graphs are scatter plots, whose axes can be any two variables in the simulation. An example use of a Data vs. Data is to plot the azimuth and the elevation of an antenna on the same plot.
Distribution charts are used to plot histograms and cumulative distribution functions. These plots can only be used for those variables that you have asked Visualyse to collect statistics on. In the default configuration, Visualyse collects no statistics until asked.
All three types of graph are produced using software provided by Graphics Server. Many configuration options are provided via the Graph Control, which is described in detail in the Configuring Graphs.
How to Create and Change Things in Visualyse
Objects are created and changed in Visualyse via dialogs. Each dialog consists of a number of sheets (or tabs) via which the relevant parameters are entered.
There are a number of ways to access the dialogs:
Via the toolbar – for example, clicking the Station icon will bring up the Station List. This shows all the Stations in the current simulation, and gives options to Add, Edit, Duplicate and Delete.
Via the menus – element lists can all be accessed from the Model menu.
Via the Model window – you can create new elements by clicking on the “Add” button. Editing can be achieved by double clicking or right clicking a particular object.
Add, Edit, Duplicate and Delete
For inputting and editing system data, you will work with Visualyse object lists.
So, for example, when you click the Station icon, you will be presented with the station list:
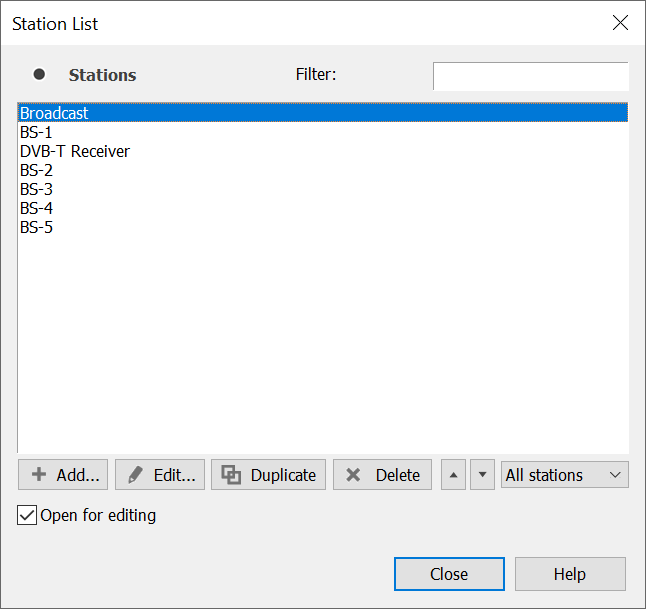
Note at the bottom of the list the four functions ‘Add’, ‘Edit’, ‘Duplicate’ and ‘Delete’.
These are common to all the list dialogs and are used for management of the list
The Example Files
Visualyse is installed with a number of pre-configured example files. The example files cover many areas and can provide you with a quick start in the use of Visualyse.
A separate document is available explaining each example file in turn. This document can accessed from the Help menu.
Overview of Visualyse Professional
This section describes the way the structure of Visualyse relates to real world radiocommunications systems, their operation and their compatibility.
Before we discuss the ways in which systems can be built, we need to say a few words about the settings that define the environment in which the systems will operate (chiefly which propagation models you want to use) and settings that tell Visualyse what outputs you are interested in.
These should be considered before you start to model your systems, but can be changed at any point before you start to run the simulation. The purpose of the discussion below is to make you aware of the options that are available.
Propagation Modelling
The Propagation menu determines the global default settings for the propagation environments.
As Visualyse allows you to look at compatibility between fundamentally different types of system, there are often times when one single set of models cannot be applied to all links in simulation. An example here is where terrestrial networks are sharing with space networks.
To allow maximum flexibility Visualyse classifies all links and allows you to select different propagation environments for each type. We have defined a five link types for you, but also allow you to add any number of custom types. For each Link type select the propagation models to be used and define the default parameters for those models.
Also, you can select different models to use when the Link is a victim and when it is an interferer. The reason for this is founded in the philosophy of ITU-R Recommendations. Propagation models used for link design and coverage are quite distinct from those used to calculate the level of an interfering signal.
Propagation options are defined from the Propagation menu. From this menu select a Link type from:
- Terrestrial Fixed
- Terrestrial Mobile
- Space to Earth (= Earth to Space)
- Space to Space
- Broadcasting
- Advanced
You can select models from the following list:
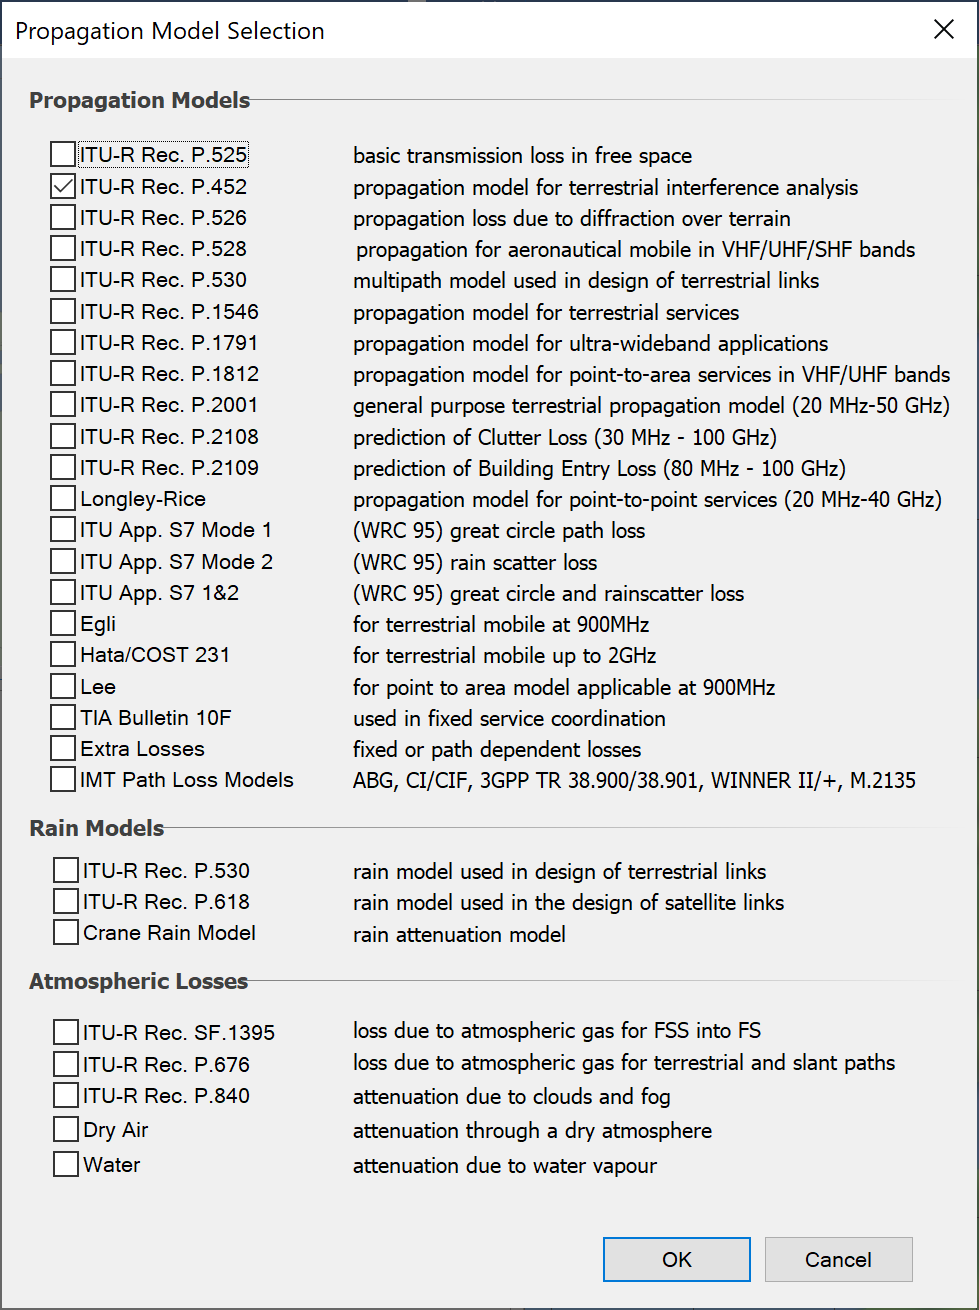
You can select any combination of models: Visualyse will warn you if there are any unusual combinations (e.g. multiple basic path loss) but will not stop you from using them.
More information about the scope and usage of each propagation model is given in the Technical Annex.
What to Calculate and how to Collect Statistics
The Output Menu is where you tell Visualyse which types of data to collect and which specific parameters to write into a log file.
Where the analysis you are performing is dynamic, data is collected in statistical form. At each time step or sample point the output data is recorded in a ‘bin’ of a histogram. Over time the histogram becomes the probability distribution for that data.
Visualyse will not by default record actual values of a parameter at each time step – this would require enormous amounts of memory. We do, however, have a log file option that allows you to select parameters for logging.
This is useful for post-processing and validation – normally the output from Visualyse is statistical information on Link parameters.
Antennas, Stations, Carriers and Links
Now we come to the main modelling elements, through which you define your systems and scenarios.
The structure of the software underlying Visualyse is based on an object-oriented analysis of radiocommunications systems and interference analysis. The objects and the relationships between objects will seem familiar to most engineers.
However, there may be some differences between the Visualyse model and your model of the world of radiocommunications. It is important that the exact structure of the software is understood if you are to gain maximum benefit from the tool.
The following sections describe the Visualyse simulation elements at the top level. Each section provides examples of how these elements map on to objects in the real world and is intended to provide an overview of the structure of the software. This section does not provide a detailed description of the dialogs which is given in Creating and Editing Simulation Objects of this guide.
The fundamental modelling elements that you will need to include in any interference modelling scenario are:
Other elements are:
Antennas
Antenna performance has a significant impact on wanted signal levels and on interference levels. Antenna gain is directional and Visualyse allows you to model this directivity in 3-dimensions in a number of ways.
To begin defining a communications system we start by defining the performance of the Antennas that we will use in the modelling. You create and edit antennas either from the Model menu or by clicking the Antenna icon on the Toolbar. The Antenna List will appear.
The figure below shows an Antenna List when three Antennas have been created – by default the List will be empty.
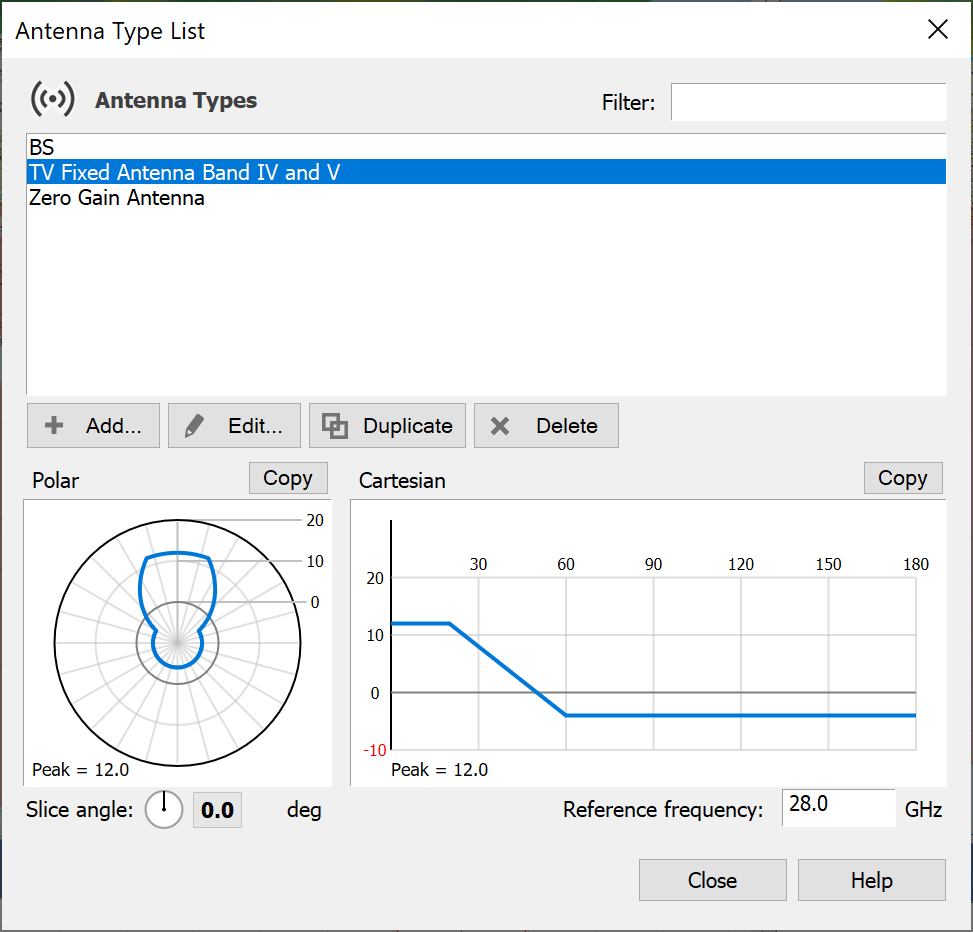
There are several types of Antenna in Visualyse:
- Single beam antennas
- Multiple beam antennas (with many different beams)
- Multiple beam antennas (with many identical beams)
- Spot Beam Pattern Antennas – with spot beams arranged in symmetric patterns
- Satellite PFD mask beams – gain is calculated to provide a given PFD level at defined elevation (or Alpha) angles.
Within each type there are several ways to describe the beams used:
- Circular – defined by data or gain mask
- Elliptical – defined by data or gain mask
- Shaped – defined by data
- Contour – defined by iso-gain contours
Visualyse includes over 80 predefined masks that cover ITU Recommendations, Radio Regulations, ETSI Standards and many other popular masks. Full details are given in the Technical Annex. You can also define roll-off in a look up table.
If your antenna is shaped, you can define a table of gain in two dimensions (antenna pointing angles) or can use GIMS contours. Visualyse provides a simple facility to create and edit GIMS contours.
Stations
The role of Stations is to define the geometry and dynamics of the analysis – where are the transmitters and receivers and where will they be in the future.
Stations also contain Antenna objects and points the Antennas according to one of a selection of pointing methods.
When you create a new Station you are given the option to select from the following types:
- Earth
- Terrestrial Fixed
- Mobile
- Maritime
- Aeronautical
- Geostationary Satellite
- Non-geostationary satellite
Visualyse internally distinguishes Station Types by the information you need to provide in order to define their dynamics.
Carriers
Carriers are used to define the bandwidth and polarisation parameters to be used in the Links. The carrier dialog is also where you can define spectrum masks that can be used in calculating adjacent channel and out of band interference levels.
For basic calculations the carrier defines the bandwidth. Later, when you set up the interference calculation, you will tell Visualyse what to do when the bandwidths of wanted and interfering carrier are different – this bandwidth overlap option can have a significant effect on results.
It is also important to bear in mind that you will be entering power levels later and that you may already have entered the antenna gain for the link that this carrier will use – those three parameters together determine the Power Spectral Density.
If you want to consider out of band or adjacent channel then this is the place where you will define the out of band mask.
Links
Links define how the stations are connected together. There are four types of Link in Visualyse:
- Fixed Links
- Transmit Links
- Receive Links
- Dynamic Links
Examples of the different Link types available in Visualyse are given in the following figures.
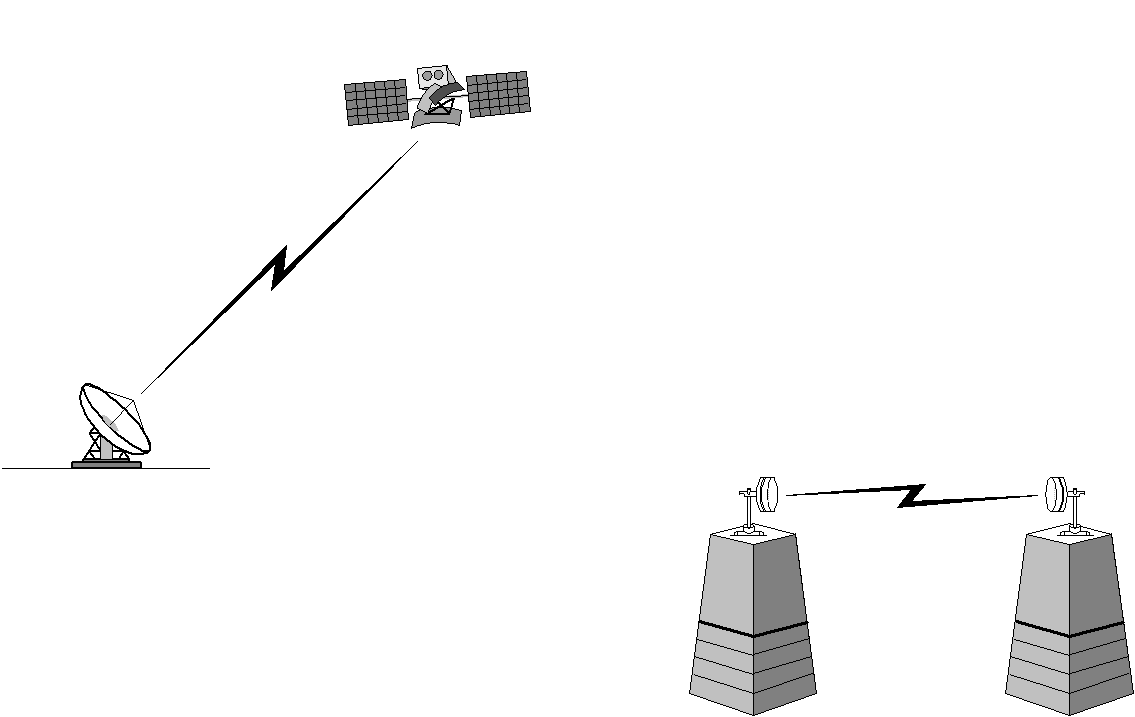
The figure above shows a satellite to ground station link and a terrestrial microwave link. Both these would be modelled as Fixed Links in Visualyse.
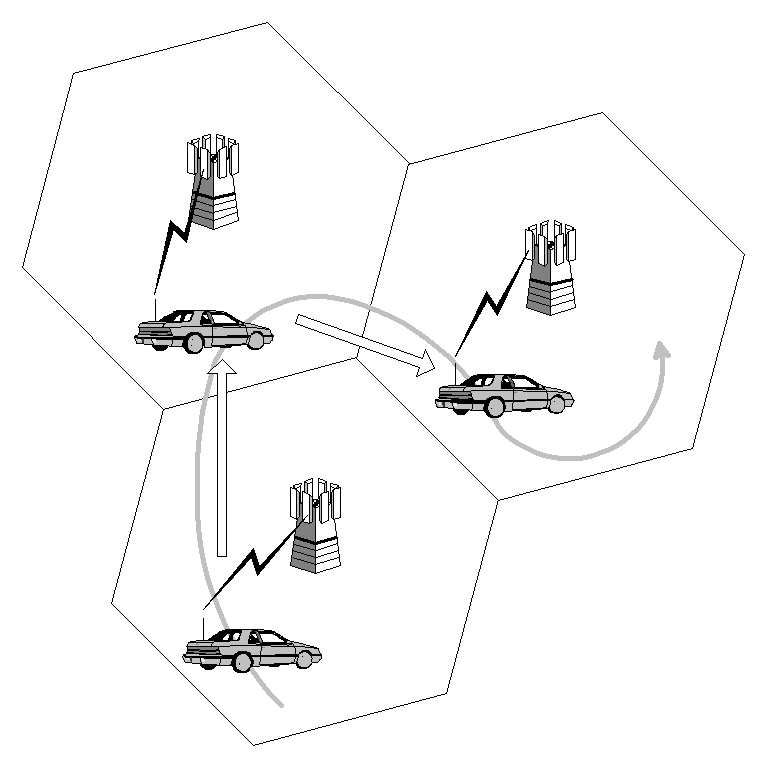
The figure above illustrates the movement of a vehicle through the cells of a mobile phone system. In this case the signal is handed over from base station to base station as the car moves. This would be modelled as a Dynamic Link in Visualyse.
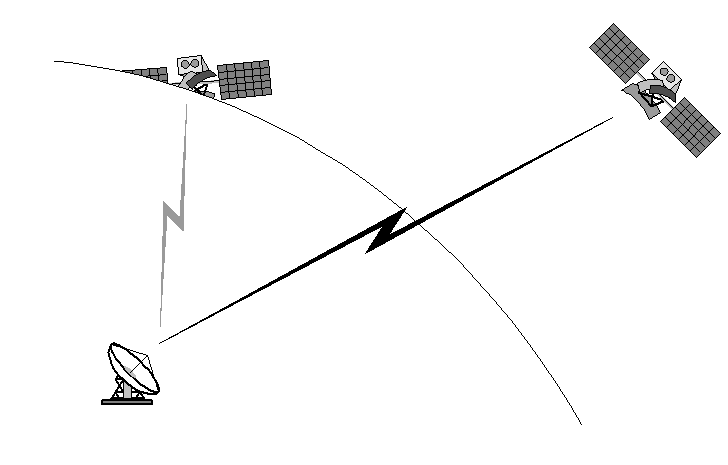
The figure above illustrates the handover from one satellite to another as the first satellite falls below the horizon. This would also be modelled as a Dynamic Link.
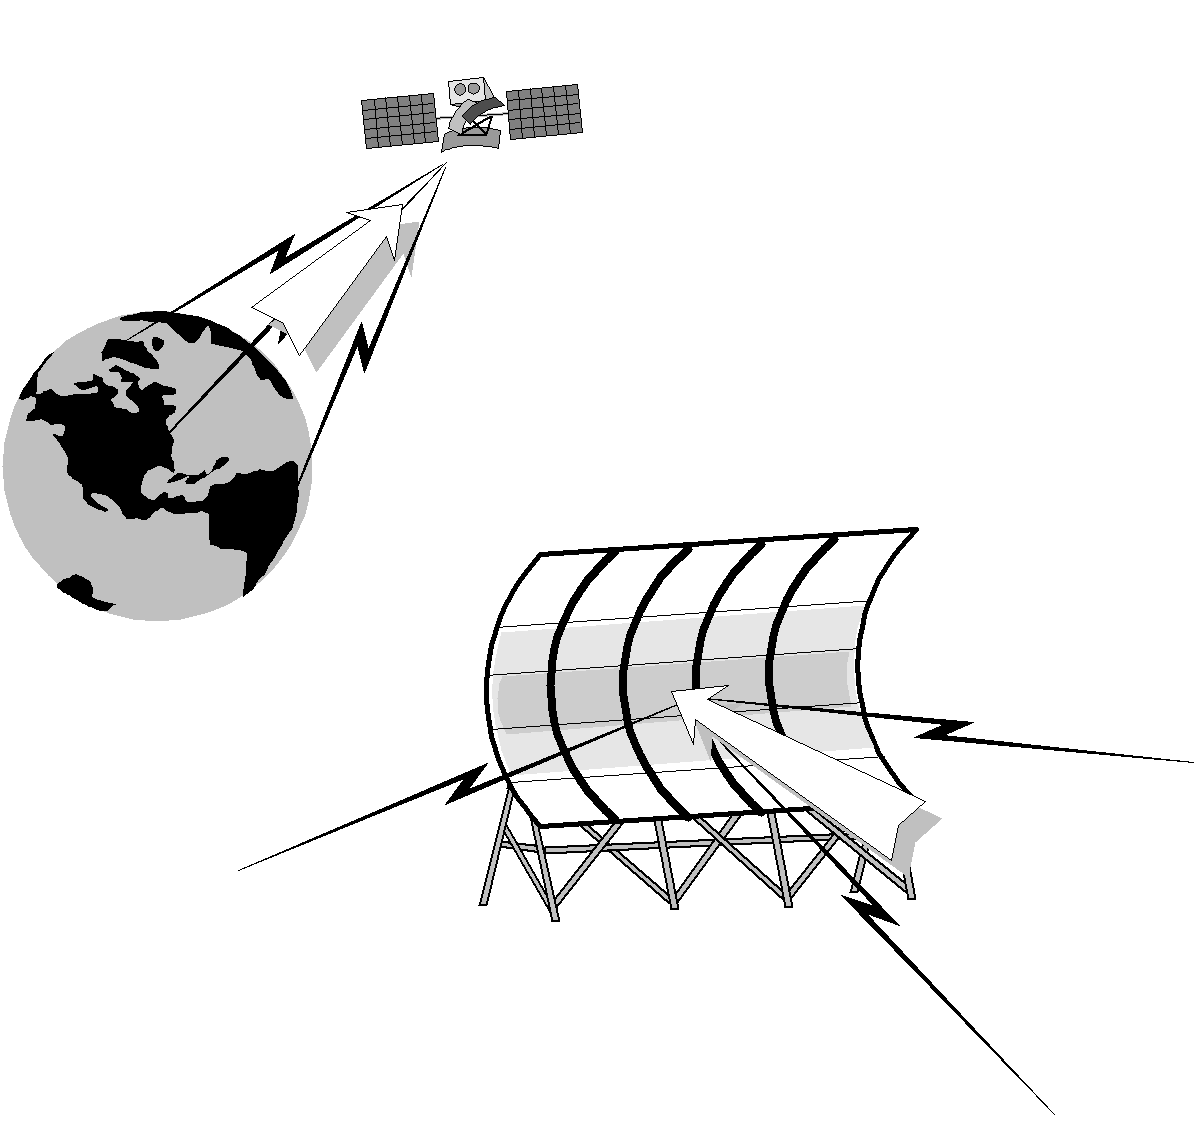
The figure above illustrates two examples that would be modelled as Receive Links in Visualyse.
The first represents an earth observation satellite. The second is a scanning radar dish. In both cases, there is no defined wanted transmitter, and the wanted signal level has a known value or is unused. These links could be used to gather information about interference levels, when the wanted signal level is either known or is not relevant.
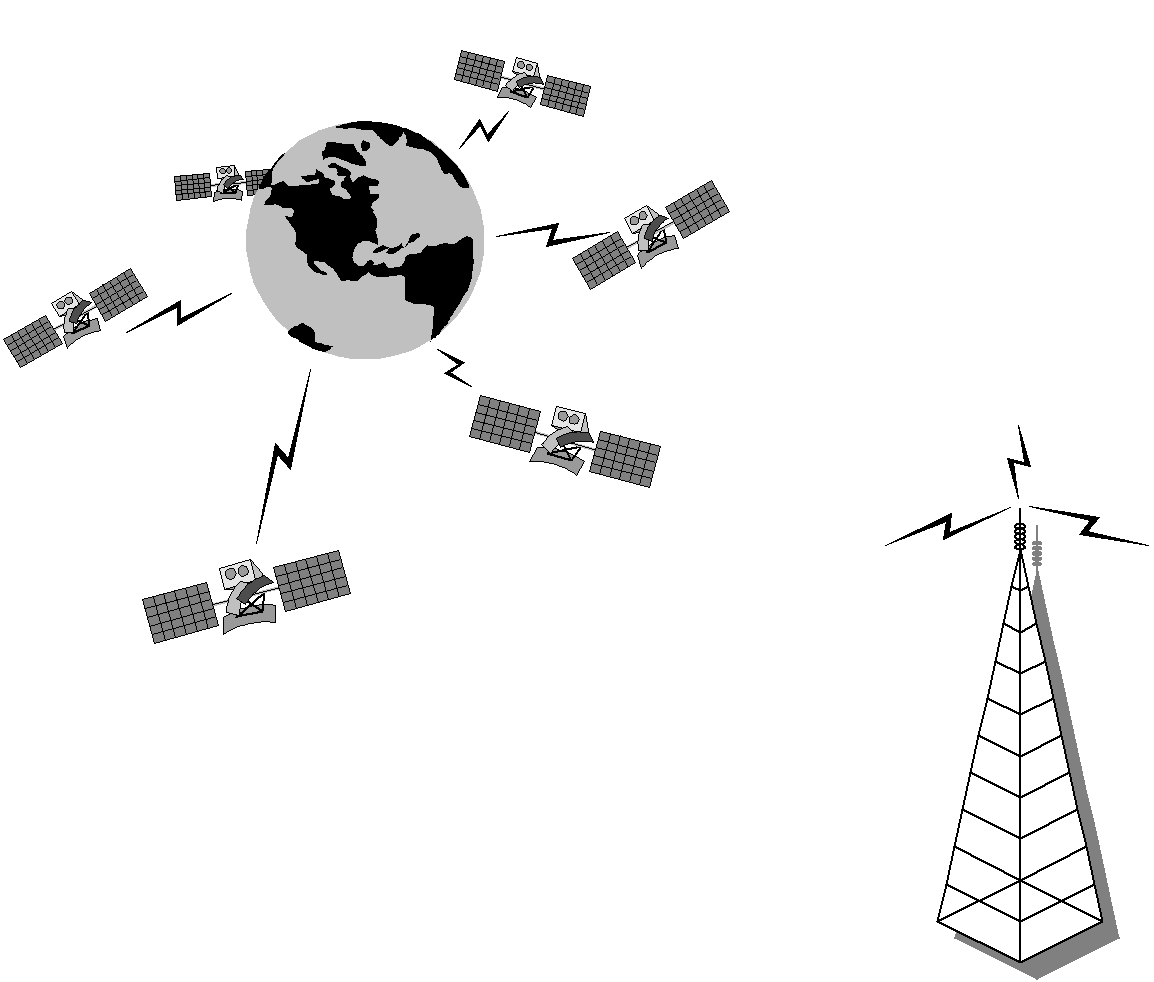
This figure shows two examples of transmit links. The first is a constellation of non-GSO satellites; the second is a terrestrial broadcast station. In cases where these are considered as interferers only, they would be modelled as Transmit Links in Visualyse.
Example Scenario
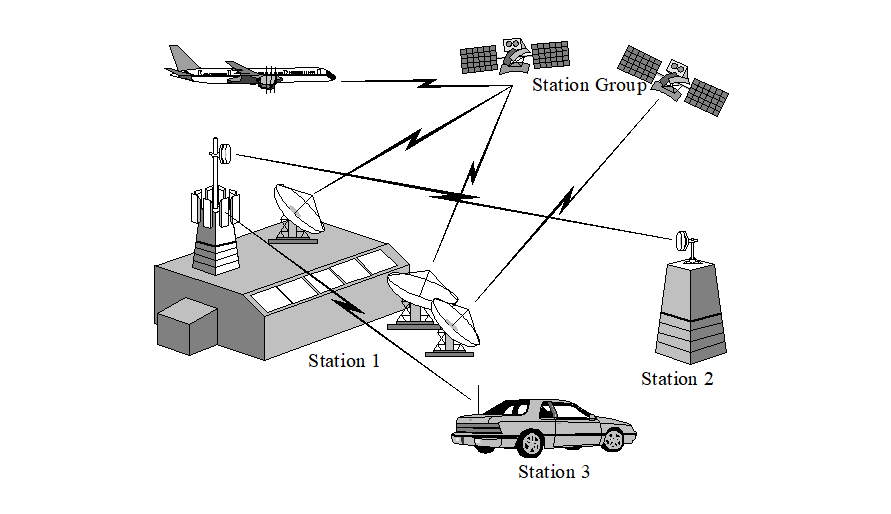
The final figure illustrates an example scenario in which a number of wanted Links of different types have been defined from Stations with multiple Antennas.
Interference Paths
An Interference path specifies an interference scenario. This comprises a wanted link or a group of wanted links and a set of interfering links. The purpose of an Interference Path is to calculate the interference from the interfering links into the wanted links.
Tracking Strategies
Tracking Strategies define the criteria for selecting a tracked station from a group of candidate stations. They are used in Dynamic Links to determine the link end station.
There are two types of Tracking Strategy: Predefined and User Defined.
If you cannot find the strategy you need on the predefined list, then you can define your own as a series of geometric constraints on end station selection.
Station and Link Groups
You may find that a Visualyse simulation can become very large very quickly. This is especially true if you are working with constellations of satellites or large groups of terrestrial links.
Visualyse provides a way to simplify the management of large simulations in the form of Link Groups and Station Groups.
Groups can act as simple containers for stations and links – so that all your victim links are in one group and all your interferers in another, for example – or can represent real world groupings such as satellite constellations or fixed service chains.
Visualyse includes ‘Wizards’ to help in the creation of some groups, making the production of complex scenarios much easier.
Full details are given in the Simulation Elements section of the User Guides.
How It Fits Together
Steps in the Construction of a Visualyse Simulation
The flexibility of Visualyse means that there is no fixed prescription for setting up and analysing spectrum sharing scenarios. In addition, the number of other uses of the tool mean that there are very many ways you can begin to use the software.
A prerequisite to starting up the simulation is that have a clear idea of the results you are looking for and have a full description of both your wanted and interfering systems.
You need to know the RF, geometric and dynamic characteristics of both systems, and have some understanding of how these characteristics can be represented in Visualyse. This understanding can be gained by reviewing the User Guide, or from the example files and related document provided with Visualyse.
However, if you follow the prescription below you will be able to set up Visualyse to produce C/N+I, C/I and I/N results within a matter of hours.
The recommended steps involved in the creation and analysis of a spectrum sharing scenario are listed below:
- Define a library of Antennas that will be used
- Create the Stations, using Station Groups and Wizards where appropriate
- Define a library of communications carriers via the Carrier dialog
- Set up your Propagation Environments via the Propagation menu
- Set up communications Links – both wanted and interfering – using Link Groups and Wizards where appropriate
- Set up Interference Paths, where wanted and interfering Links are specified
- Define run duration and time step size using the Time Settings option on the Simulation menu
- Set up the Output you are interested in via the Output menu
- Run the simulation
- Analyse the results via the graphs, watch and table windows, and the various map views.
Location of Key Parameters
In the calculation of C, I, N, C/I, C/N, C/(N+I) and I/N there are a number of key parameters that are defined by your input data. In Visualyse it is sometimes possible to define these parameters in more than one place – this ensures that the software remains more flexible without becoming overly complex. It does, however, sometimes lead to confusion in new users because not every parameter in every dialog is used in the interference calculation.
This section describes where the basic link budgets parameters are or can be defined, and the configuration options under which the parameter will be used.
Wanted and interfering Links are defined in exactly the same way
| Parameter | Where Defined |
|---|---|
| Transmit Antenna Gain | The antenna gain is a combination of the peak gain plus the relative gain in the direction of interest. Both of these are defined in an Antenna object. |
| Transmit EIRP | The usual way to define the Link EIRP as a combination of Link power plus Antenna peak gain1 |
| Path Loss | The path loss depends on the propagation model selected and the environmental parameters, defined via the propagation menu. |
| Link Power | Power is defined in the Link dialog. |
| Spectral Density | By a combination of Link power and the bandwidth of the carrier used by the Link. |
| Carrier Bandwidth | The bandwidth is defined in the edit Carrier dialog. There are two values, the occupied bandwidth and the allocated bandwidth. |
| Bandwidth Overlap Factors | The calculation of the C/I ratio can be done in number of ways as defined in the Interference Path. |
| Central Frequency | The central frequency is defined in the Link dialog. In the Interference Paths dialog, it is possible to force the wanted and interfering carriers to be co-frequency. This has the effect of shifting the interfering carrier to be on the same central frequency as wanted carrier. |
| Frequency overlap | The frequency overlap is calculated automatically based on the wanted and interfering carrier central frequencies and bandwidth. |
| Wanted (or victim) Links | The wanted Link is selected in the Interference Path dialog. A Link can be selected in multiple Interference Paths. Interference levels on a Link will be aggregate values due to all Interfering Links on all Interference Paths. |
| Interfering Links | The interfering Links are selected in the Interference Path Dialog |
| Polarisation Advantage | Polarisation advantage is defined in the Interference Path dialog. |
-
A second is using the default values associated with the Antenna. The Link dialog has options to select either the default Antenna value or the Link power. ↩
The Tools Menu
The 'Tools' menu provides access to tools and utilities that allow relationships between many parameters to be calculated and checked.
The equations used by all the tools are described in the Technical Annex.
VisTools
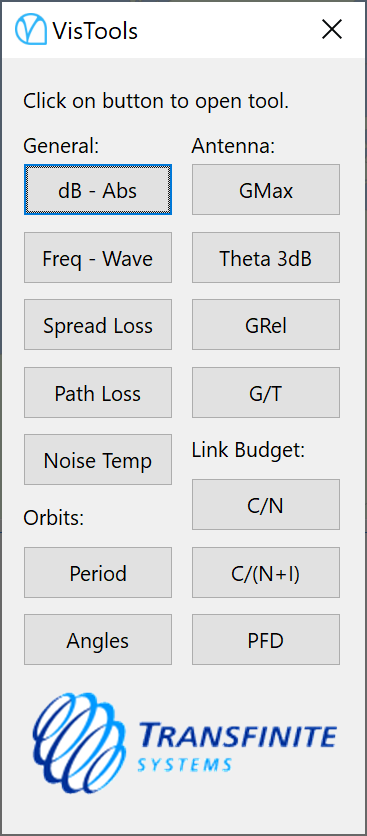
The Tools menu option “Launch VisTools” will start the link budget and radio engineering calculator as shown in the figure below.
Solve for and Optimise
Visualyse provides two tools for performing “what if…” analysis:
The Solve For is used to find the value of a parameter that gives the wanted value for a second parameter.
The Optimize is used to minimize or maximize a parameter, subject to the variation of a second parameter.
Solve For
The Solver can be used to change the value of an object attribute that is dependent on another object attribute. Ordinarily, the only way to change an attribute of this kind is to keep changing the attribute on which it depends until you achieve the desired result. The Solver takes over this trial and error process and does all the hard work for you.
For example, say you had an Earth station communicating with a geostationary satellite. Your problem might be that the satellite should be positioned such that the relative gain at the Earth Station is 2 degrees down from main beam.
You can use the Solver to find the longitude position for the satellite which achieves the requirements for relative gain at the Earth station.
Optimise
The Optimizer is used to maximize or minimize the value of an object attribute that is dependent on another object attribute.
For example, say you had an FS network, and want to create a new hop. What frequency should you use?
The Optimiser can assist you by finding a frequency that minimises interference from all the other FS links.
General User Interface Features
Right Mouse Button Functions
Right mouse clicking can be used to perform many operations in Visualyse. For example:
- Right clicking in the Map, 3D, and Graph views brings up menu options that allows you to change the display properties for the view.
- Right clicking on a Station Icon gives you the option to duplicate or delete the station or to invoke the edit Station dialog.
Double Click Functions
Double clicking on a station invokes the edit dialog allowing you to change the properties of the station.
Double clicking on objects that appear in lists opens the object for editing
Drag and Drop
Station drag and drop is available in the map views if you active the station move icon:
For earth stations and aeronautical stations this allows the latitude and longitude of the station to be changed by clicking on the Station and dragging it to a new position.
Geostationary satellites can be moved along the geostationary arc only.
Dragging and dropping a non-GSO satellite will move the satellite along a fixed latitude by changing the ascending node of its orbit.
Common Dialog Features
Most dialog boxes include the following buttons:
OK - clicking this button confirms and implements any changes you have made then closes the dialog box.
Cancel – clicking this button closes the dialog box without saving the changes you have made.
Apply – saves the changes you have made without closing the dialog box.
Note you do not need to click “Apply” before clicking OK.
Dynamic Lists
As new elements are added to a simulation, they will appear on a list that is accessible via the dialog appropriate to that element. If an element is removed it will disappear from the list.
These lists are referred to as dynamic lists. The use of dynamic lists means that Visualyse places no limits on the number of Stations and other elements that can be defined in a simulation.
Double clicking list items will generally invoke the edit dialog for that item.
Naming of Visualyse Elements
Element names must be unique on each list as it is used to identify that object. Hence, for example, as all Stations appear on the Station list, they must all have unique names.
Error Messages
Visualyse produces error messages whenever an input error occurs. The message consists of three boxes showing:
- the problem
- a description of the error
- a suggestion as to how to carry on
Help Menu
From the help menu you can access the following documents:
- User Guide
- Modules User Guide
- Technical Annex
- Maintenance History
- Tutorial
- Introduction to Example Files
You can also open the About dialog, such as the one below:
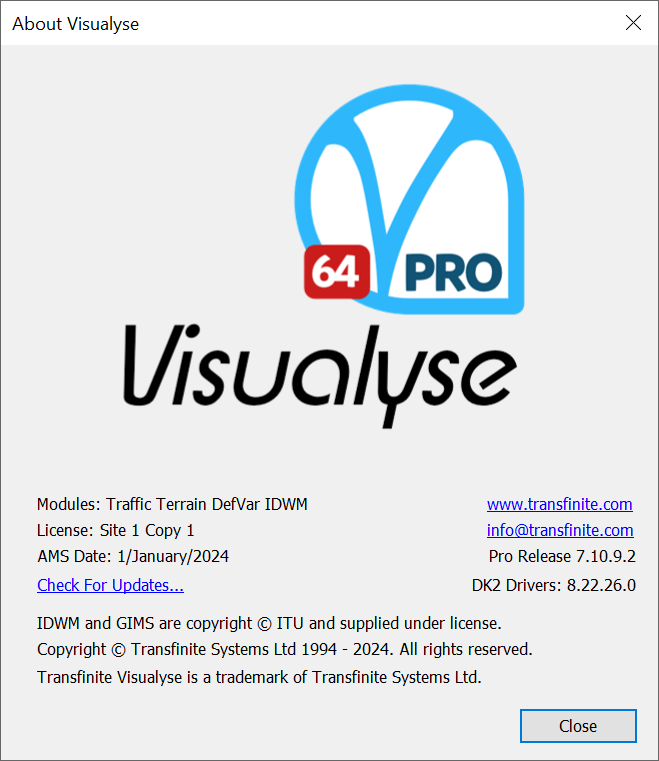
This gives important information such as:
- Program version number (here 7.10.9.2)
- Licence site and copy numbers (here Site 1 Copy 1)
- Date of expiry of annual maintenance and support or AMS (here 1/January/2024)
- Active modules (here Traffic, Terrain, DefVar and IDWM)
If the security key or dongle is not identified by the program then the licence site and copy number will be replaced by “Demo”.
Creating and Editing Simulation Objects
This section of the User Guide provides a complete reference to creating and editing Visualyse objects using the simulation dialogs.
In order to benefit from this section you should already be familiar with the bigger picture of the way Visualyse works.
This familiarity can be gained by reading the Overview, by examining the example files and associated documentation or by simply experimenting with the software.
The sections below guide you through each dialog, explaining how to enter the data needed to define your system components, your environmental data, and how to tell Visualyse what to calculate for you.
Antenna Modelling
The Antenna object is fundamental element in Visualyse. In encapsulates the on and off axis performance of antennas in isolation. An Antenna object can then be attached to multiple Stations where the pointing and tracking options are defined.
So, to begin defining a communications system we now start by defining Antennas – either from the Model menu or by clicking the Antenna icon on the Toolbar. The Antenna list will appear.
The figure below shows an Antenna List as it would appear when three Antennas have been created – by default the List will show a single omni-directional, zero gain antenna.
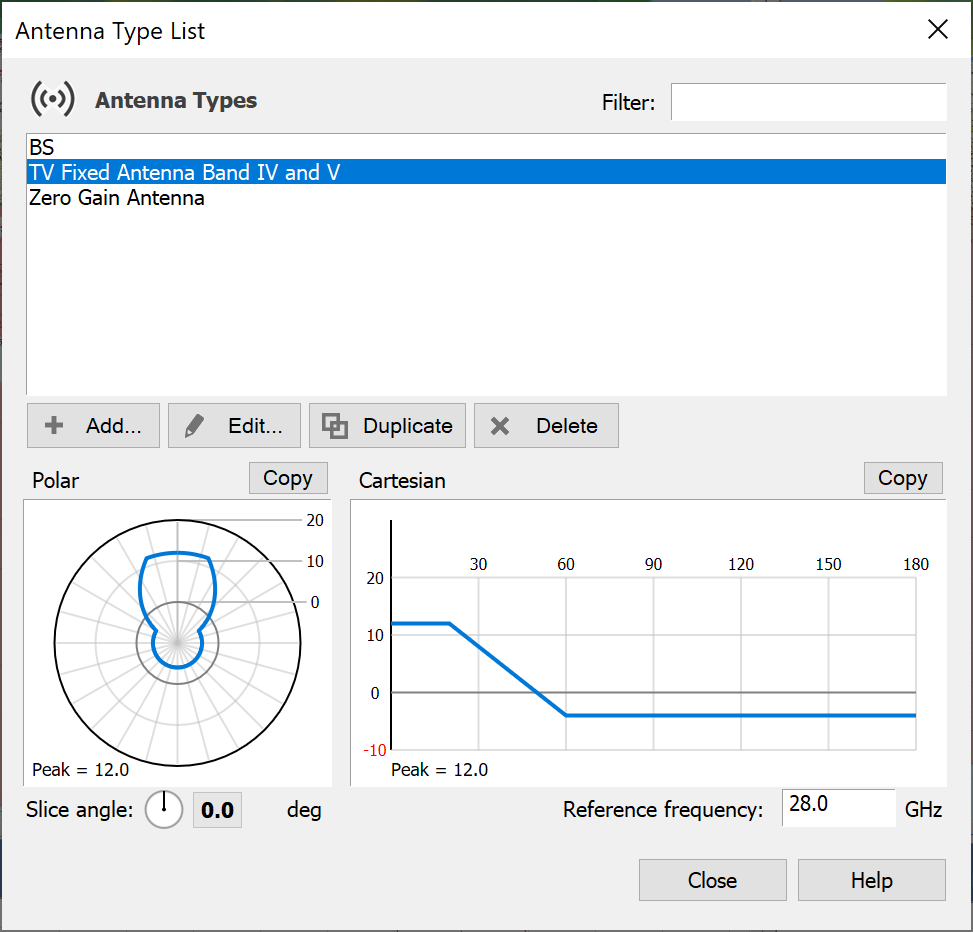
The Antenna list dialog has an integrated roll-off plot in either Polar or Cartesian coordinates to show the variation in gain against off-axis angle for the selected Antenna.
To create a new Antenna, click the Add button. The Antenna types dialog will be displayed.
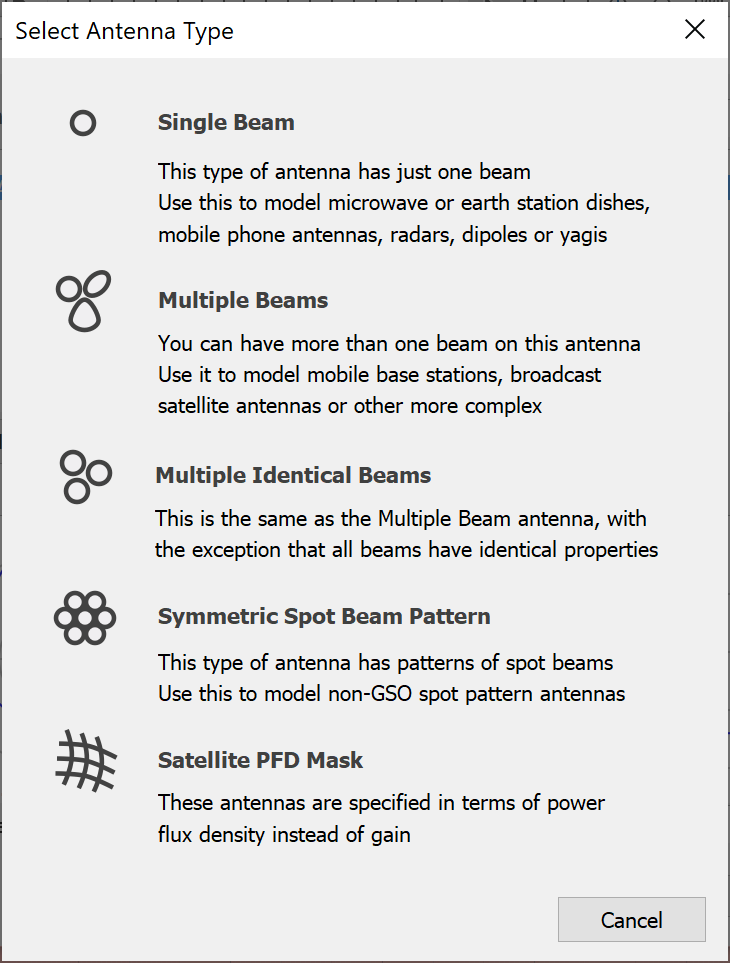
You then select from one of the five antenna types, by clicking the icon on the left of the list. The five types are:
- Single beam antenna – this is the simplest choice, the Antenna has a single beam. The beam can be circular, elliptical or shaped.
- Multiple beams – the most flexible option. The Antenna can have multiple beams with different characteristics. The pointing angles of the different beam boresights are defined individually in terms of azimuth and elevation relative to the antenna mechanical boresight.
- Multiple Identical Beams – this option is used where an antenna has multiple beams with identical performance characteristics but different point directions.
- Symmetric Spot Beam Pattern – use this option where the beams in a multiple spot are deployed with circular, hexagonal or square symmetries.
- Satellite PFD Mask – where the antenna performance is constrained by regulatory PFD limits, use this option to define those limits in terms of elevation angle on the ground (or Alpha angle).
We recommend that you read Creation of a Single Beam Antenna to familiarise yourself with the process of creating antennas. The other subsections below, give additional information needed to define the more complex antennas.
Creation of a Single Beam Antenna
In this section, you will be guided through the process of creating an Antenna with a single beam. The Beam may be circular, elliptical or shaped in cross-section.
Begin by selecting Antenna from the Model Menu
Select the Single Beam option and click Ok. The Antenna properties dialog will be displayed.
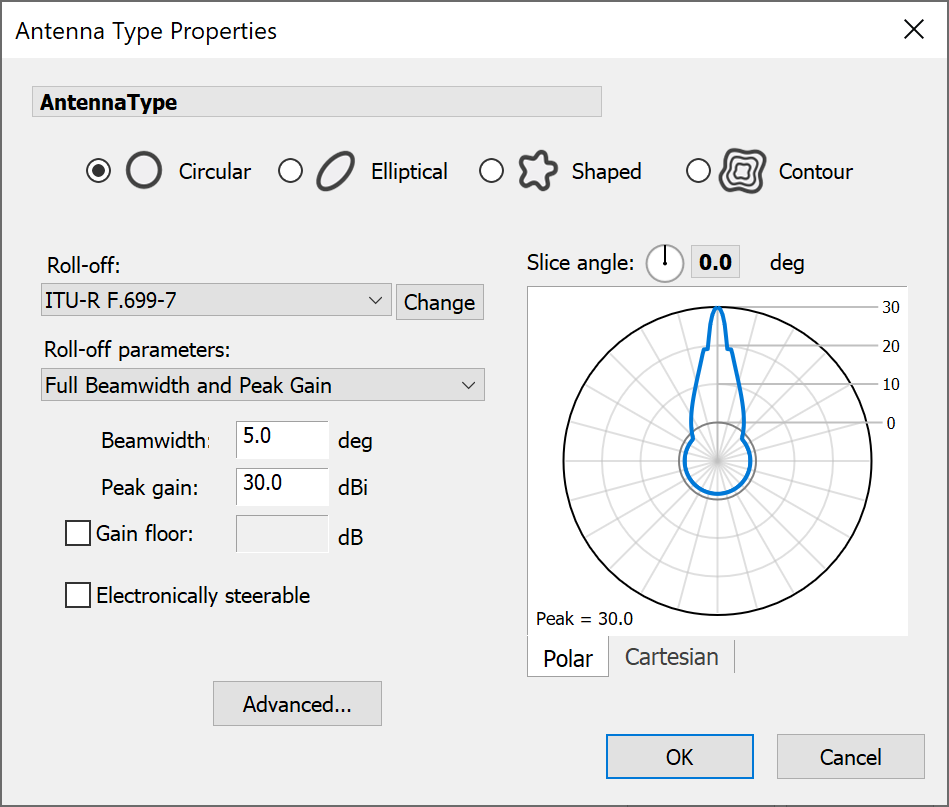
Antenna Name
The name of the Antenna (defaults to Antenna Type) is shown in bold in the top left-hand corner of the dialog. When the mouse passes over the name, the cursor also changes to a ‘caret’ 

If you click on the name, it changes to an edit box so that you can enter a name for your Antenna. This is shown below.

There are four options under Single Beam, each relating to how the cross-section of the beam will be specified. The choice made determines what other parameters are needed to fully define the Antenna.
Each of the input parameter options is now explained in turn.
Beam Cross-section
The beam can be circular, elliptical or irregular shaped in cross section.
The beam shape is selected at the top of the beam tab. As you switch between the options the parameters below the will change.


Circular and Elliptical Beams
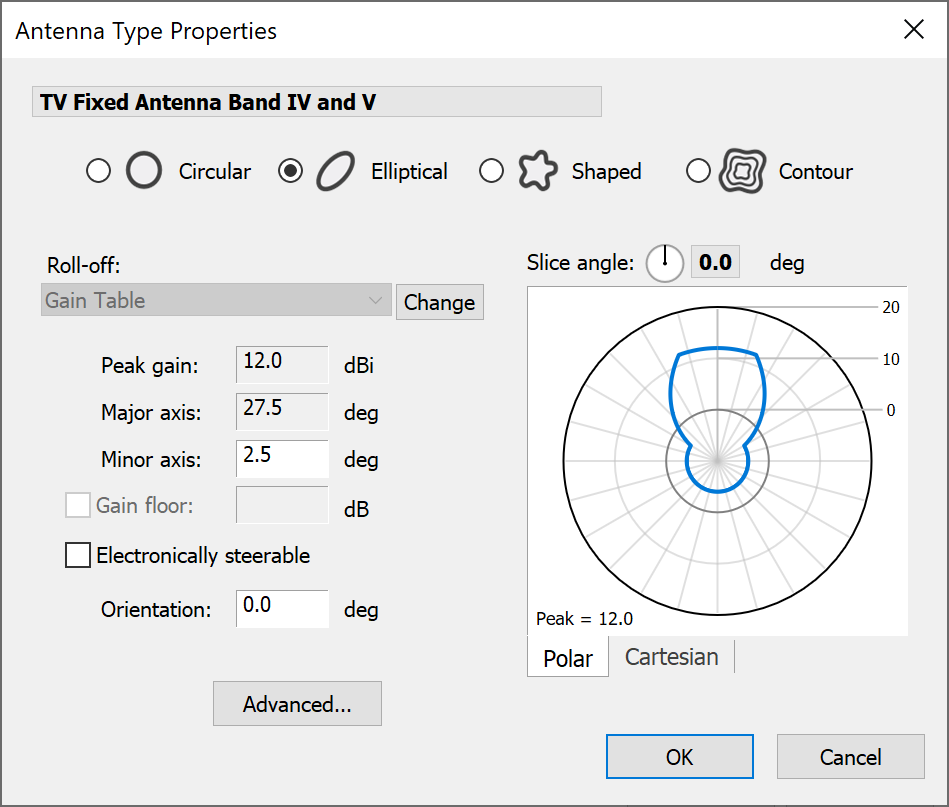
For circular and elliptical beams, the gain pattern is defined by the roll-off mask and a few Antenna parameters.
Roll-Off
To change the way the roll-off is defined, choose the Change button next to the roll-off field.

The Roll-off dialog is shown below.
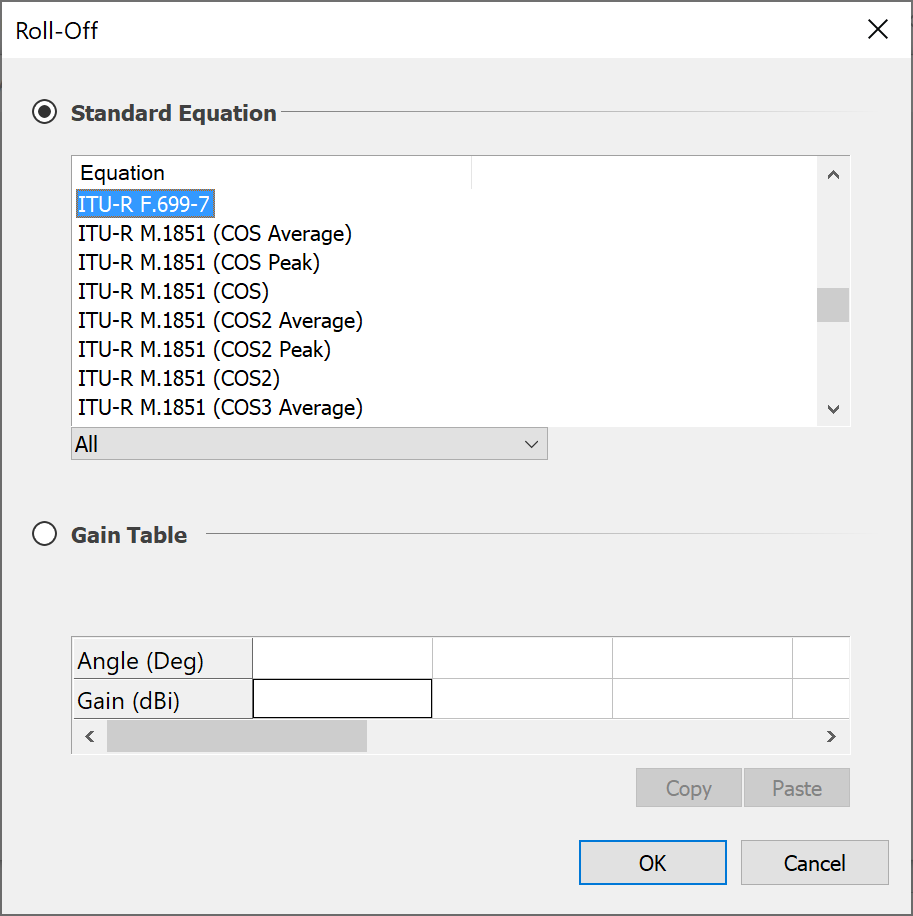
The dialog provides two options. You can use either:
- a standard equation as a mask, or
- a table of gain/off-axis angle pairs
Roll-Off Masks
Visualyse already includes 80 or so standard roll-off masks. These are described in detail in the Technical Annex
Gain Tables
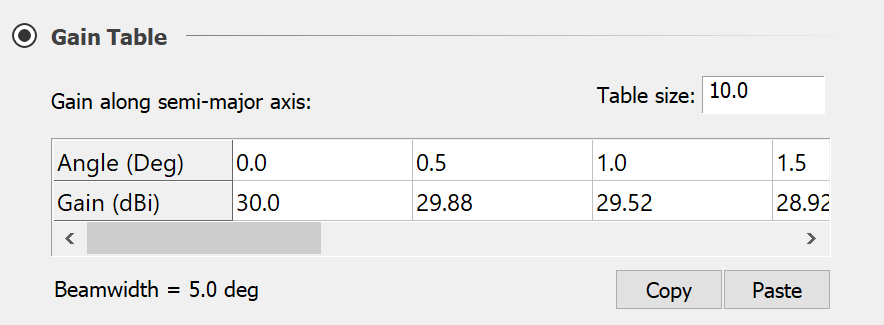
The gain table option allows you to enter the complete roll-off as a set of gain, angle pairs. To help with data entry, you can now copy and paste data to and from different sources, including from Excel spreadsheets.
In this case is no need for you to supply other Antenna parameters such as peak gain and beamwidth. This will be indicated as in the dialog – under Antenna parameters it will say ‘determined by the gain table’.
If the beam shape is elliptical, text will appear above the gain table to indicate that the gain along the semi-major axis is required. In both the circular and elliptical cases, the beam width (as derived from the table) is displayed.
Antenna Parameters
There are four parameters that are commonly used in defining Antenna characteristics. The four are related in standard Antenna theory and no more than two are ever needed to fully define an Antenna.
As an engineer you may know your Antenna diameter but not its beamwidth, or vice-versa. Alternatively, you could be working to a standard antenna and know only the D/
The ‘Antenna parameters drop-down allows you to say which characteristics of the Antenna you know.
Depending on the option selected, a number of applicable fields will appear. You can then fill in these fields with the appropriate information.
For circular beams the combinations are as follows:
- Dish Size & Efficiency
- Full Beamwidth & Peak Gain
- Footprint Diameter
For elliptical beams the antenna must be defined by peak gain and the two beamwidths.
For the case when a gain table defines an elliptical beam, the semimajor axis is determined from the data you have already put into the table (or the default data) and therefore does not need to be entered here. You must however, give the minor axis, and Visualyse will then scale the roll-off in all directions other than along the major axis to give the correct ellipticity.
Beam Roll-off Preview
A preview of the roll-off is shown to the right of the Antenna parameters. You can choose between polar or Cartesian plots. Each plot has its own controls that allow you to modify the display.
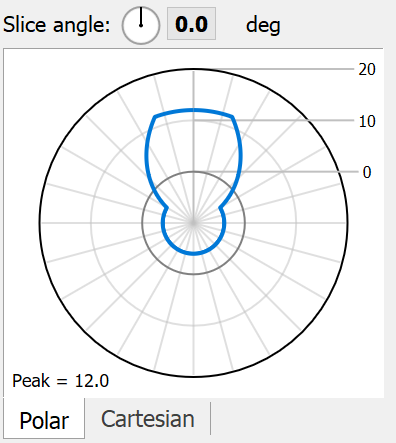
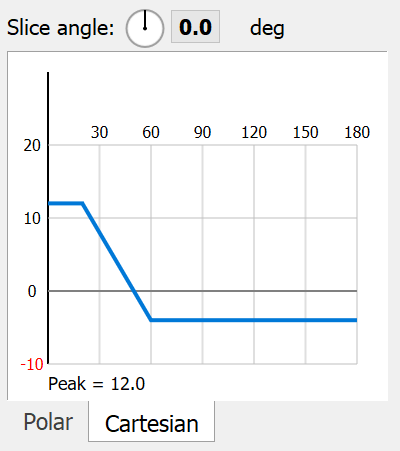
For both plots, you can change the slice angle by clicking and dragging the angle control. On the Cartesian plot, you can also zoom into areas of the graph.
In order to understand the meaning of slice angle – if you consider and elliptical beam, the slice angle of the major axis is 0 or 180. The minor axis is 90 or -90.
These plots are provided to give you a basic idea of the shape of your Antenna while you are editing it. Additional plotting options are provided on the Antenna list dialog
Shaped Beams
For shaped beams, a table of gain for various azimuth and elevation () angles replaces the roll-off and Antenna parameters.
The dialog is shown below. The data table is shown in a scrolling window, and has an Edit button to the top left.
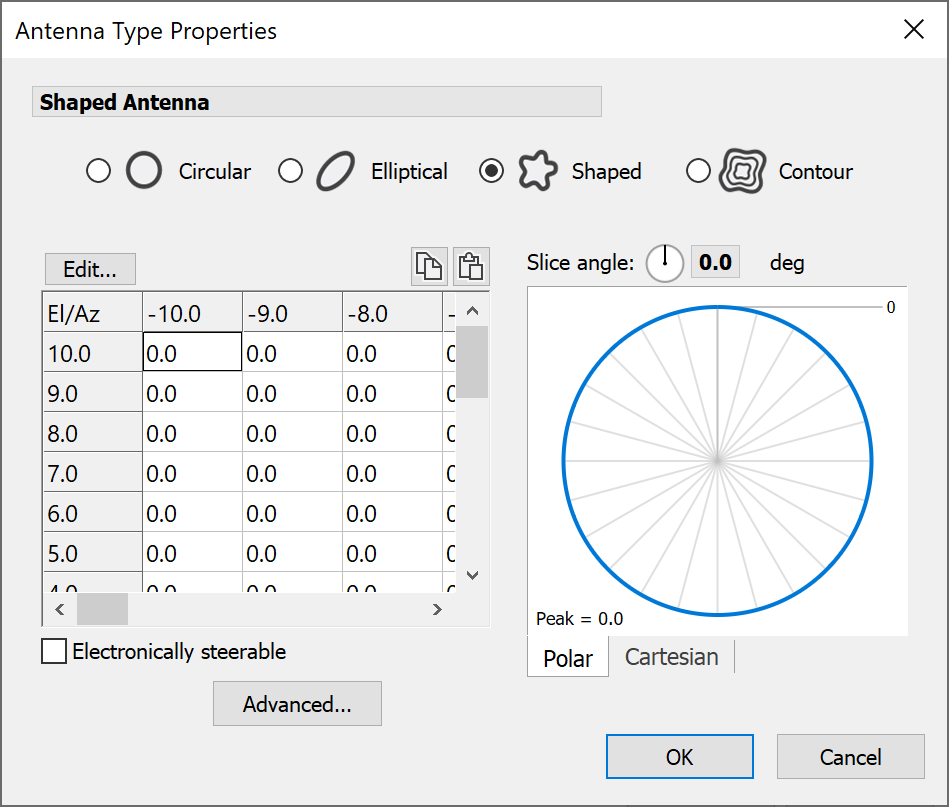
To change the table, click Edit. This opens the shaped beam properties dialog shown below.
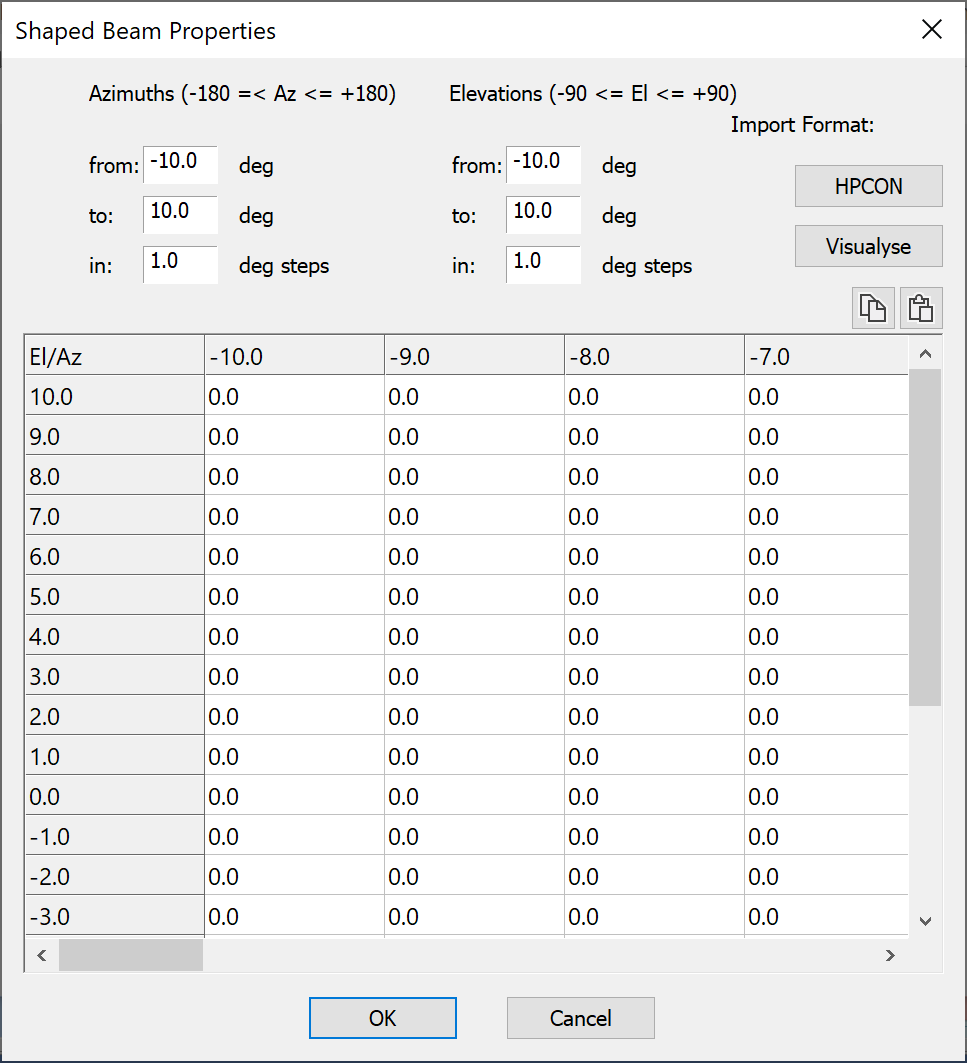
You can change the size of the table from here. You can copy and paste data to and from the table directly from other sources, including Excel. You can also import from text file in various formats (see Technical Annex for more information).
Contour Beams
Visualyse allows you to create, import and edit antennas that are defined in terms of their gain contours in GIMS format.
You can create and edit beams as polygons using the mouse to click on a map view. This allows you to define coverages from scratch or to approximate coverages that you only have as printed map.
Visualyse provides facilities to import data directly from the ITU database and also to enter contours as polygons using the mouse.
Visualyse then converts these to a grid of gain vs. Antenna angles and stores both the contours and the grid using a proprietary algorithm. In order to do this conversion, Visualyse needs a reference satellite longitude. This is the longitude of the satellite from which the contours were plotted or the longitude at which they will be used. If you subsequently change the longitude of the satellite using the Antenna, the Antenna coverage will move with the satellite.
A new feature is that for patterns imported from GIMS, you can now select the GIMS algorithm for the interpolation of the gain to points in between contours – which ensures compatibility with results obtained using ITU-R software. This option is set in Visualyse Settings (see Visualyse Default Parameters).
The dialog is shown below.
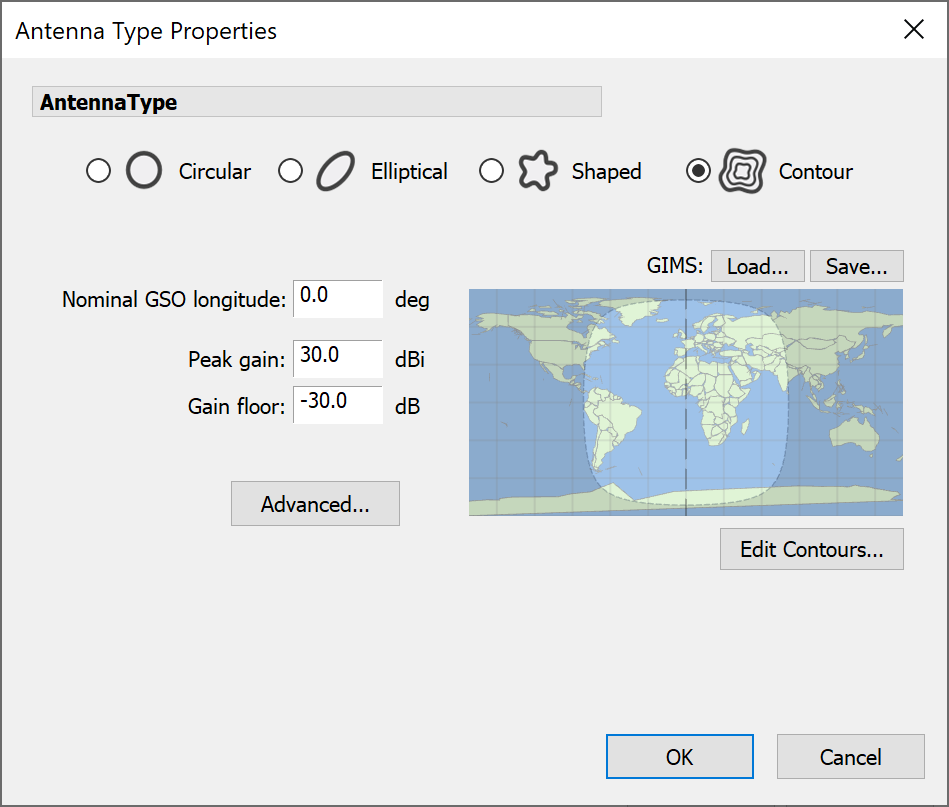
Before you can enter any contours, you need to specify the longitude of the GSO satellite that would host the Antenna.
Next you need to enter the limits on the gain: the peak gain and the gain floor (the limit of relative gain for points along way from the peak gain point). Once you have done this, you can go straight in and add some contours. Click Edit Contours. The Edit Contours dialog will appear.
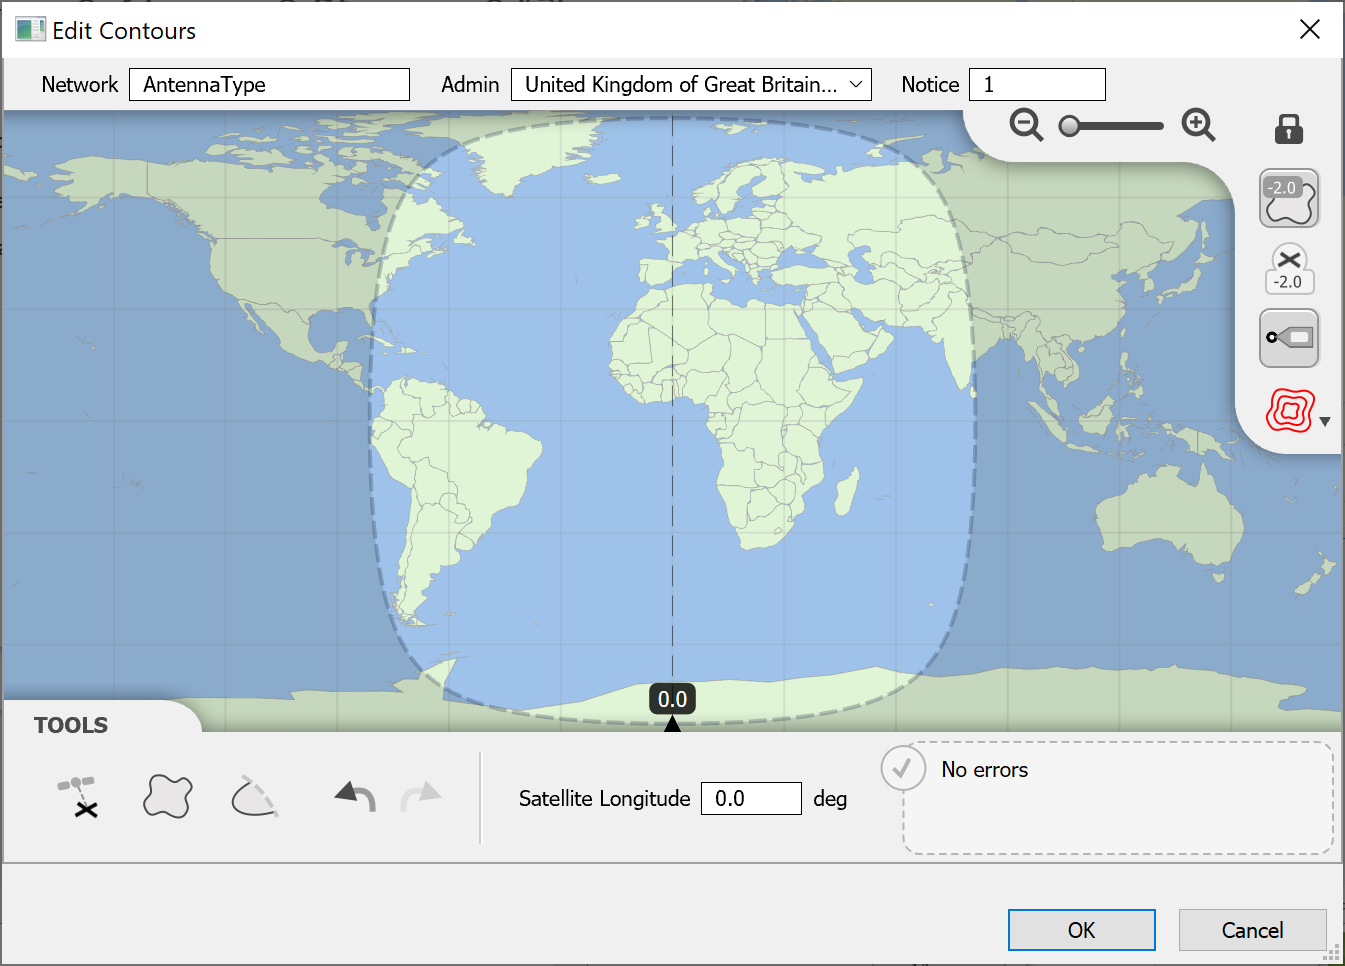
Setting Network Details
Use the controls at the top to set the name, admin and notice id for the network that the beam is to be a part of.

The orbital position of the satellite is set from the toolbar at the bottom of the window. When you change this, you’ll see that the highlighted area of map representing the satellite field of view will change accordingly.

Adding Boresights
Click the Add Boresight button
 , then click on the map to add a boresight (hold SHIFT while clicking to add more than one).
Editing Boresights
You can move a boresight by clicking on it, holding the mouse button and dragging it to a new location.
To edit a boresight, first click to select it. You’ll see a small toolbar appear below the selection rectangle. This is called the Selection Toolbar.
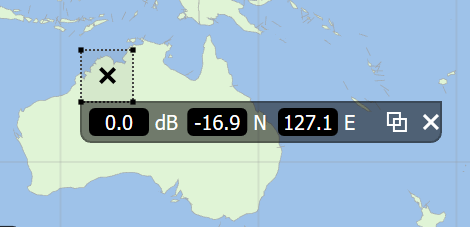
From here you can set the relative gain and the exact location in latitude and longitude coordinates. A boresight can also be duplicated and deleted from the selection toolbar.
Adding Contours
To add a Closed Contour, click on the Closed Contour button:

- Click to add the first point then continue clicking to add more points. You can also hold the mouse button and drag to draw.
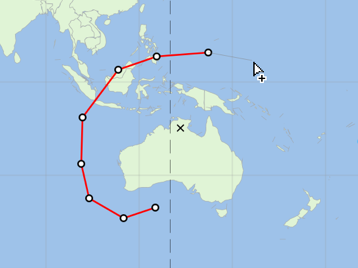
- To complete the contour, click on the first point again or you can double-click to add the last point and finish, or press ENTER.
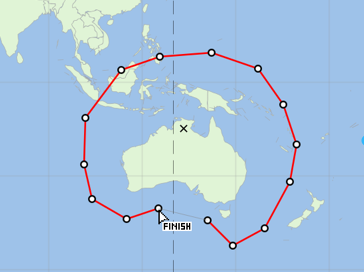
- The completed contour is shown as the current selection. Note that you can cancel at any time by pressing ESC.
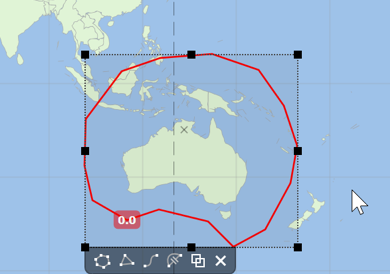
- You then need to set the relative gain for the contour. This is shown in the label on the contour itself. By default, it’s set to zero. To change it simply click on it then type in the relative gain you want and either click away or press ENTER.

To add an Open Contour, click on the Open Contour button:

- Open contours must start on the field of view. When you move the mouse, you’ll see where the first point will be. When you click, both the first point and the clicked point will be added.
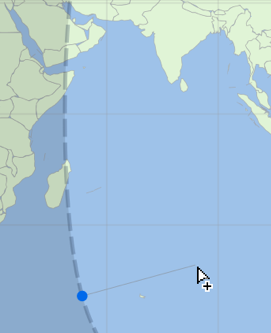
- Keep clicking to add more points. You can also hold the mouse button and drag to draw.
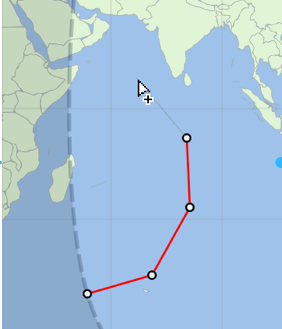
- Open contours must end on the field of view. When you get close the software will detect this. Simply click to finish. You can also double-click on the last point you want to add, or press ENTER, and the end point will be added automatically.
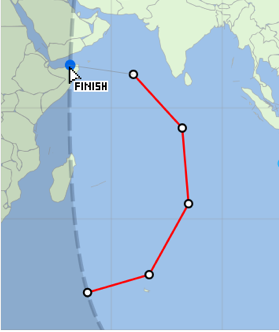
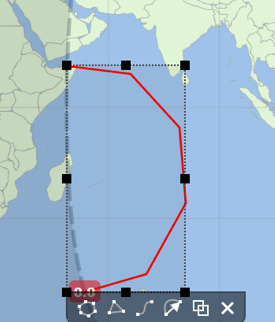
- The completed contour is shown as the current selection. Note that you can cancel at any time by pressing ESC.
Editing Contours
Click on a contour to select it. Just like boresights, contours have their own selection toolbar. Buttons are provided to Edit Points, Reduce Points, Smooth Points, Switch to Open Contour, Duplicate and Delete.

Editing contour points is described in the next section.
Reducing the number of points will intelligently reduce the number of points by around half. Smoothing on the other hand will re-sample the contour and add extra points to smooth out any sharp edges.
You can resize a contour by dragging one of the eight control points that surround the selection rectangle.
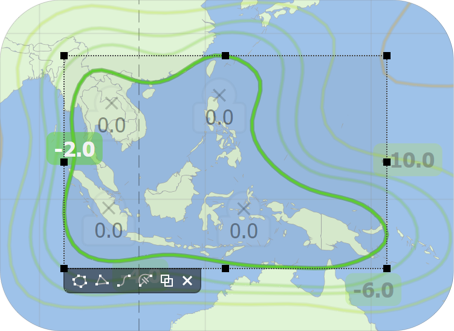
Editing Contour Points
To edit a Contour (be it Closed or Open), either double-click on it or select it and then press the Edit Points button on the Selection Toolbar or press ENTER.
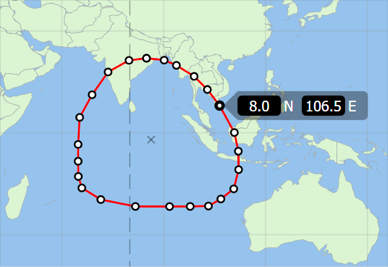
Click on a point to select it. Hold SHIFT to select multiple points it and then press the Edit Points button on the Selection Toolbar or press ENTER.
Click on the latitude or longitude boxes to make precise positional changes for the selected point
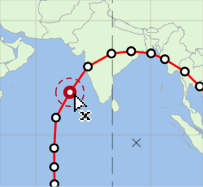
Hold CTRL while hovering on a point then click to delete it. You can also delete any selected points by pressing the DELETE key
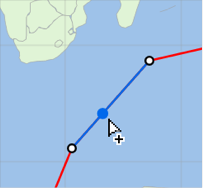
Hover near a segment and click to insert a point
You can click on a point and drag it to a new position. You can also use the cursor keys to move the selected point by small amounts up, down, left or right. Hold SHIFT while doing this to move the point by a larger amount each time. The same applies to selections containing multiple points.
Pressing the TAB key will select the next point in the contour and SHIFT + TAB will select the previous point.
To finish editing either click on the Map or another item or alternatively press ESC.
Detaching from the Field of View
As mentioned earlier, open contours should start and end on the satellite field of view. If you drag an open contour, then the end points will always remain on the field of view.
If you want to detach the end points from the field of view, there are a couple of ways to do this. If you want to move the whole contour, then simply click and drag it but hold SHIFT as you do this. The end points will then detach.
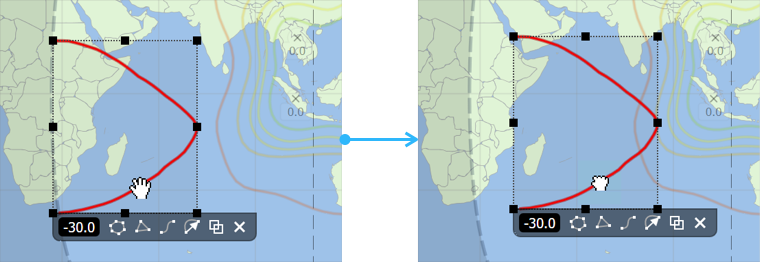
To re-attach the end points do exactly the same thing. Once an end point gets close to the Field of View both end points will re-attach at the nearest intersection.
If you only want to move the end points then first edit the contour. Click and drag an end point while holding SHIFT. The point will switch between being unattached or detached. Note that reattaching will only happen when you drag close to the field of view.
Warnings and Errors
You may notice that as you start to construct your shaped beam an orange panel will appear in the bottom-right corner of the application window. This shows any warnings or errors. These are mostly advisory so that you can check your beam will conform to GIMS requirements as you go along.
If there are no errors or warnings, you’ll see this:

If there are any warnings or errors, you’ll see something like this:

Multiple Selections
You can select multiple contours and boresights and then move, duplicate or delete all of them in one go. There are two ways to do this. You can click on an empty area of the map and then drag out a selection rectangle. Any contours or boresights that are caught in the rectangle will be selected. Alternatively just hold SHIFT and click to add or remove items from the selection.

Multiple selections have their own Selection Toolbar. If you have a combination of boresights and contours then you will only get options to Duplicate or Delete.
However, if your selection only contains contours then you’ll get all the options that are available to you when just a single contour is selected. This allows you make changes like smoothing or point reduction to several contours at once. You can also resize the selection when it only contains contours. All contours will size proportionally and maintain the same relative spacing from each another.
Copy and Paste
You can copy any selected contour or boresight, or any selected combination by using the standard keyboard shortcut CTRL+C. To paste the copied selection use the standard keyboard shortcut for paste, CTRL+V.

Display Options
There are several options for controlling the way that items are displayed. Click the Contour Colours button to choose one of eight built in colour schemes for displaying contours. Click on the map to finish.
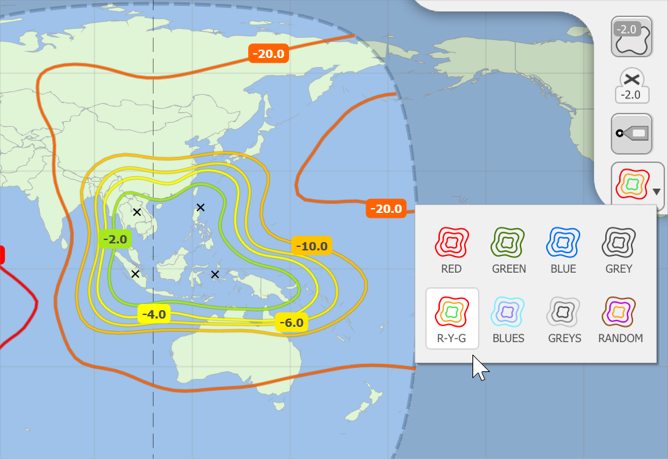
When you are finished, click OK to return to the Antenna dialog.
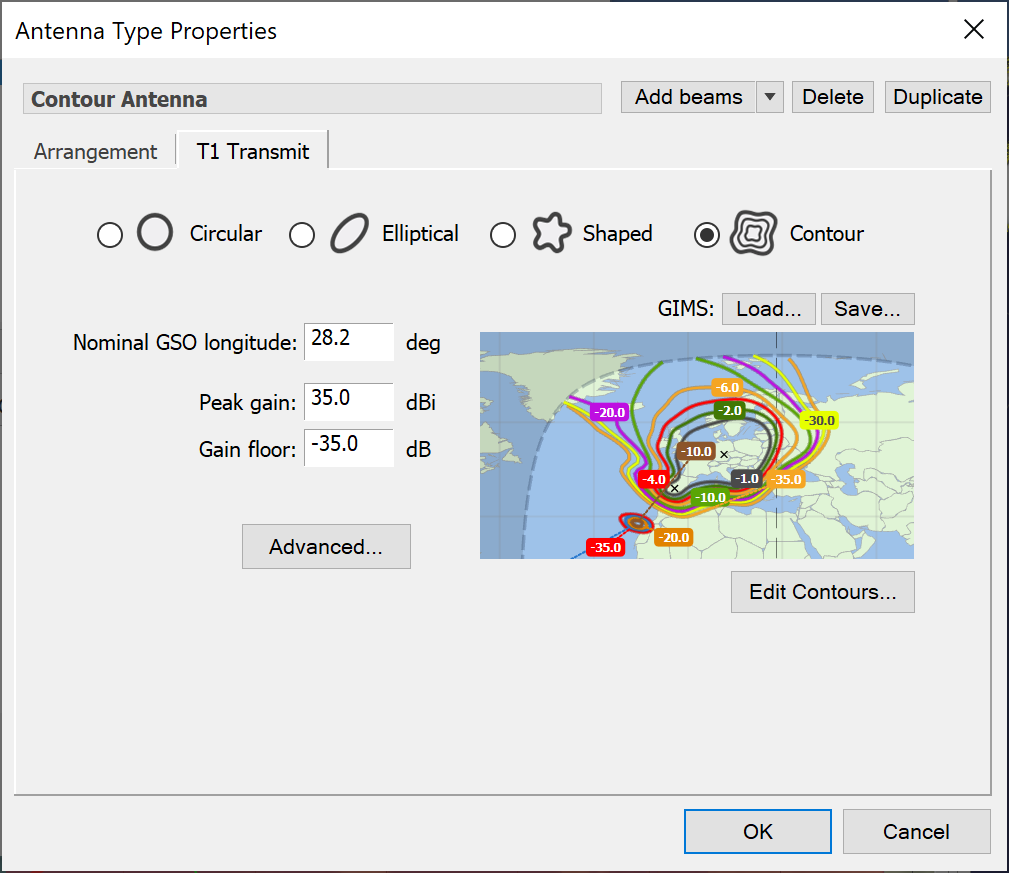
You will now see your contours displayed in the preview window.
If you have the contour data in GIMS format, you can load this into the software by clicking the Load button. Contours can also be saved to this format.
Advanced Beam Options
For all Beams
For most purposes, you will only need to specify the gain pattern for a beam. However, in some circumstances you may need to specify default EIRP, frequency, noise and polarisation – this will depend on choices made in defining your Links and in most modelling situations, these parameters are specified directly in the Link and the Antenna parameters are ignored.
Example applications of Antenna Advanced parameters are for:
- Frequency re-use in multiple beam antennas
- To plot antenna footprints where no Link has been defined and a default frequency is needed
- To model simple variation in EIRP, as a random variable between a maximum and minimum value.
For traffic modelling you may need to define a maximum load parameter (see the Modules User Guide).
These parameters can be entered by clicking the ‘Advanced’ button.
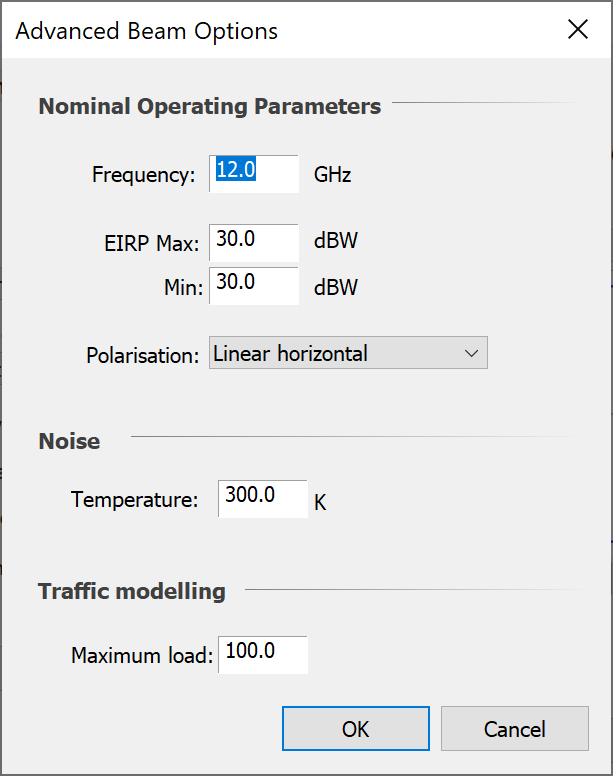
The noise represents the temperature of the Antenna (sky noise, plus earth noise etc) and can be used in the Link as part of the calculation of system noise. It will only be used if you decide not to enter the system temperature directly into the Link. If you specify this parameter and intend to use it, you must also enter the feeder loss (in the Station dialog) and the receiver noise figure (in the Link).
If you intend to specify the system noise temperature for your Link, then you don’t need to bother with Antenna temperature.
Note that the traffic modelling options will not be displayed unless the traffic module is enabled.
Shaped Beams
For shaped beams, there is another set of advanced options.
These allow you to add additional gain tables depending on the angle from the sub-satellite point. This allows you to model adaptive Antennas (sticky beams) using data derived from detailed models of the Antenna.
The options appear below the options described above.
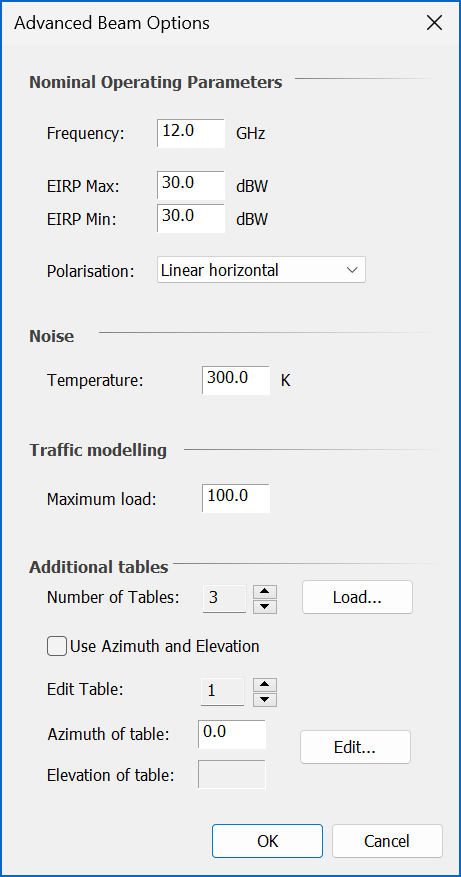
Set the number of tables using the spin control or click the “Load…” button to load the data from a TXT file (note: the format of this file is described in the Technical Annex).
To edit a table, select the table number using the spin control then type the Azimuth from the sub-satellite point in the box provided then click “Edit” to configure the table.
If the option “Use Azimuth and Elevation” is selected, then an Elevation value can be input for the table.
Contour Beams
There are additional parameters for contour beams which are shown under ‘Interpolation Options’.
The software calculates the gain from contours beams by interpolation. You can change the way in which the interpolation is performed by clicking the Advanced button.
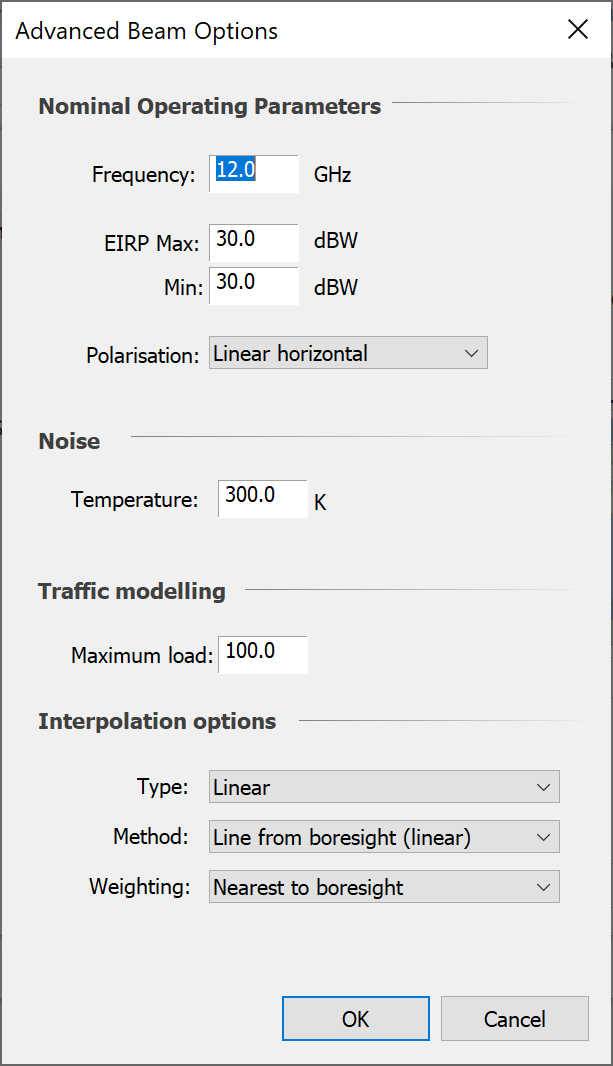
You can change the calculation method and the way in which multiple boresights are weighted in this process.
IMT-Model Non-Co-Frequency Parameters
There are additional parameters under the advanced beam options dialog when using one of the IMT-Models gain patterns. These allow the gain pattern to be different between co-frequency and non-co-frequency scenarios.
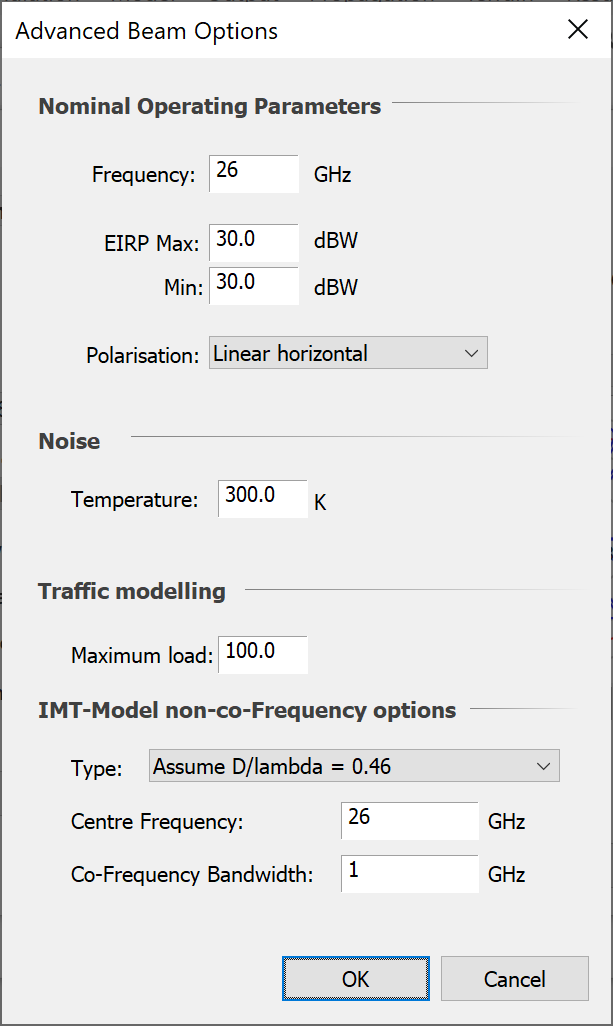
The following options are available:
- Use co-frequency pattern: the M.2101 pattern is used with D/lambda = 0.5 for both co-frequency and non-co-frequency scenarios
- Single element pattern: the M.2101 single element pattern is used if the victim centre frequency is non-co-frequency
- Assume D/lambda = 0.46: in the M.2101 gain pattern a D/lambda of 0.46 is used rather than 0.5
- Variable D/lambda: it is assumed that at the centre frequency supplied the D/lambda = 0.5, and so for other frequencies the D is derived and fixed but the lambda varies depending upon the victim frequency
The definition of what constitutes “co-frequency” and what “non-co-frequency” for the IMT-MODEL gain pattern is set via:
- Centre Frequency: this is the centre frequency that the IMT-MODEL antenna has been tuned to
- Co-Frequency Bandwidth: this is the total bandwidth that is defined as being co-frequency in range:
- Minimum = CentreFrequency – CoFrequencyBandwidth./2
- Maximum = CentreFrequency + CoFrequencyBandwidth./2
Outside this frequency range the interference path is assumed to be non-co-frequency.
Note that to activate these non-co-frequency gain patterns it is necessary to configure the Interference Path as described in Interference Paths.
Multiple Beams
The properties dialog for multiple beam Antennas, where each beam can have different properties is shown below.
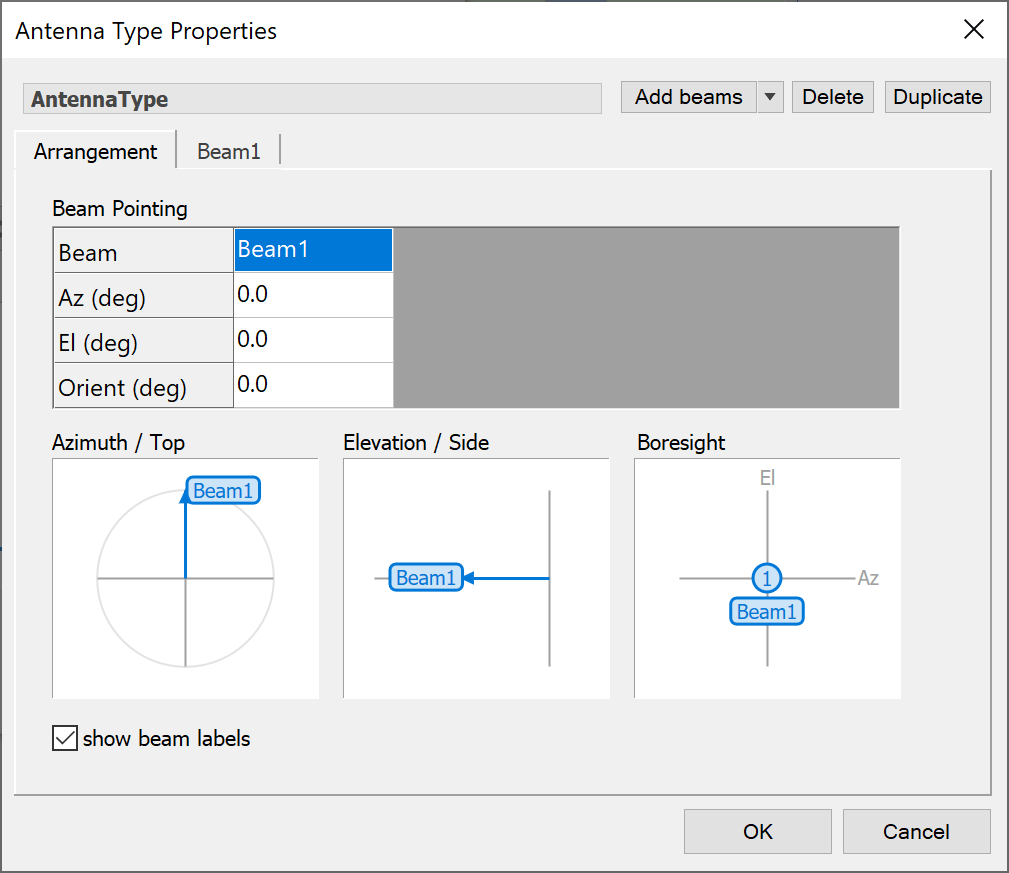
The dialog has multiple tabs. Each beam has its own tab. These tabs contain the same set of controls as a single beam Antenna.
The Arrangement tab is where the layout of the multi-beam structure is determined – here you:
- Define the azimuth and elevation of each beam relative to the antenna boresight,
- Give the orientation of each beam
- Preview the layout from three different perspectives.
Managing Beams
The beam tools, along the top right of the dialog, allow you to change the number of beams on your Antenna. There are buttons for adding, duplicating and deleting beams.
Here is how to add a beam:
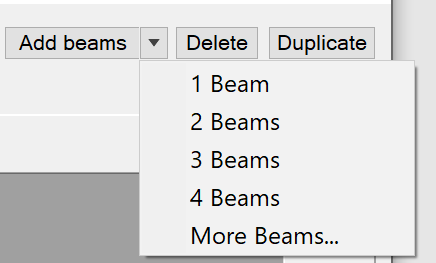
Click the Add button: a pop-up menu will appear. There are options for selecting 1, 2, 3, 4 or more beams.
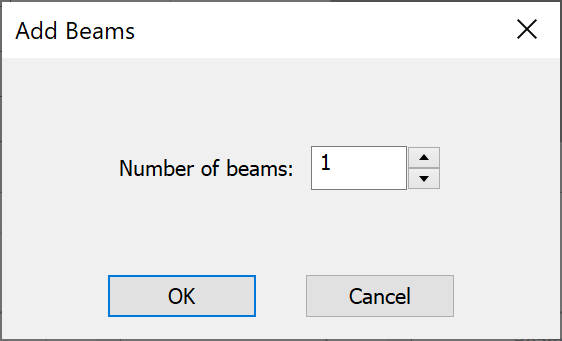
If you select More beams, you will be asked to say how many you want:
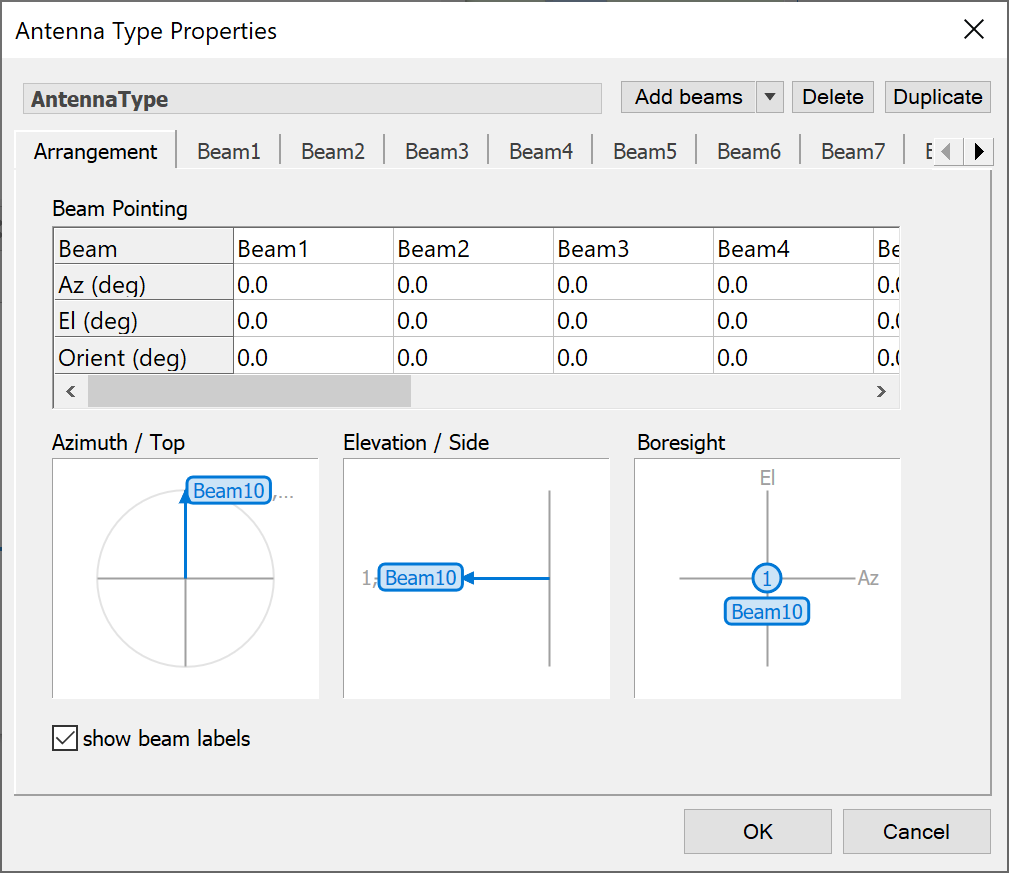
The new beams will appear as extra tabs on the dialog. If there is not enough space to display all the beams, as many beams as possible will be displayed. Two scroll buttons will appear allowing you to scroll through the tabs.
Arranging Beams
The Arrangement tab allows you to organise the beams within your Antenna. By this we mean pointing the beams relative to the mechanical boresight of the Antenna.
At the top of the arrangement tab is a table. This table allows you to set the pointing and the orientation for each beam. By default, all beams are pointed along the boresight of the Antenna. To change any of the entries in the table, simply click in the table and type a new value. You can paste in data if you have the information elsewhere.
The example below shows three beams. Each one is pointing in a different direction relative to the Antenna boresight.
There are three views – the top view (showing the azimuth of each beam), the side view (showing the elevation of each beam) and the boresight view (showing the 3dB contours of each beam viewed from the perspective of the Antenna).
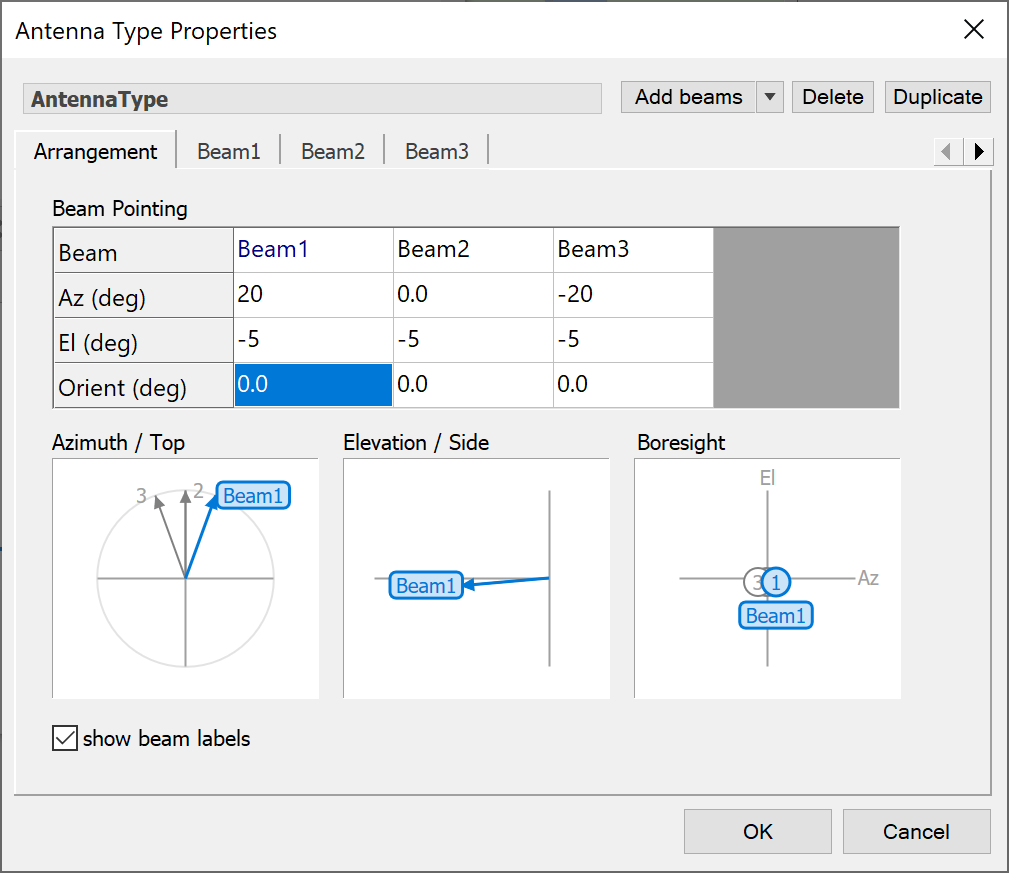
You can choose whether you want the beam labels to be displayed in the preview windows. If more than one beam overlaps exactly in any of the windows, the label of the first beam is shown followed by two dots. This indicates that there is more than one beam represented at that location.
As well as entering the (azimuth, elevation) directly, you can also move the beam pointing by selecting a beam on one of the previews and moving it to a new location.
Beams can be designated as electronically steerable. If this option is selected the beams will be pointed by according to the Link set up. This means that you won’t have to specify any pointing information on the arrangement tab.
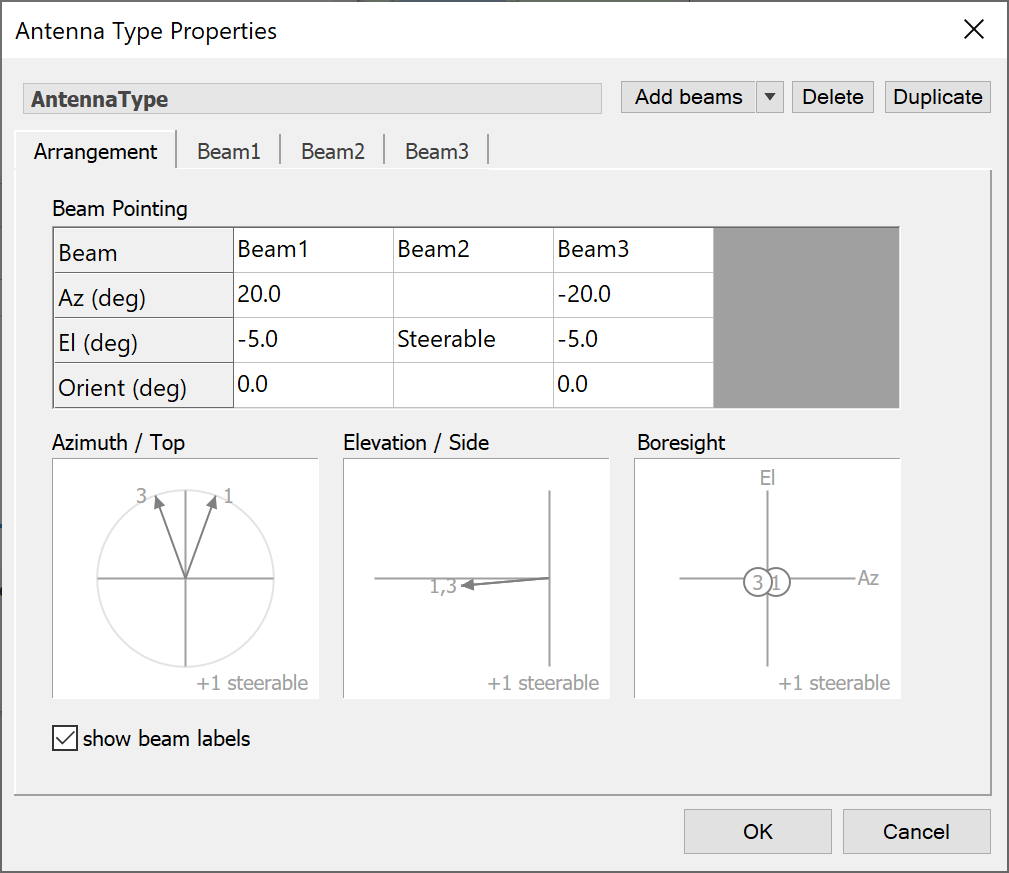
In this example, Beam 2 is steerable and so the pointing options are replaced with text that indicates this. In addition, the beam no longer has a pointing direction in the preview windows. Instead, steerable beams are shown in the bottom-right corner of each preview.
Modifying Beams
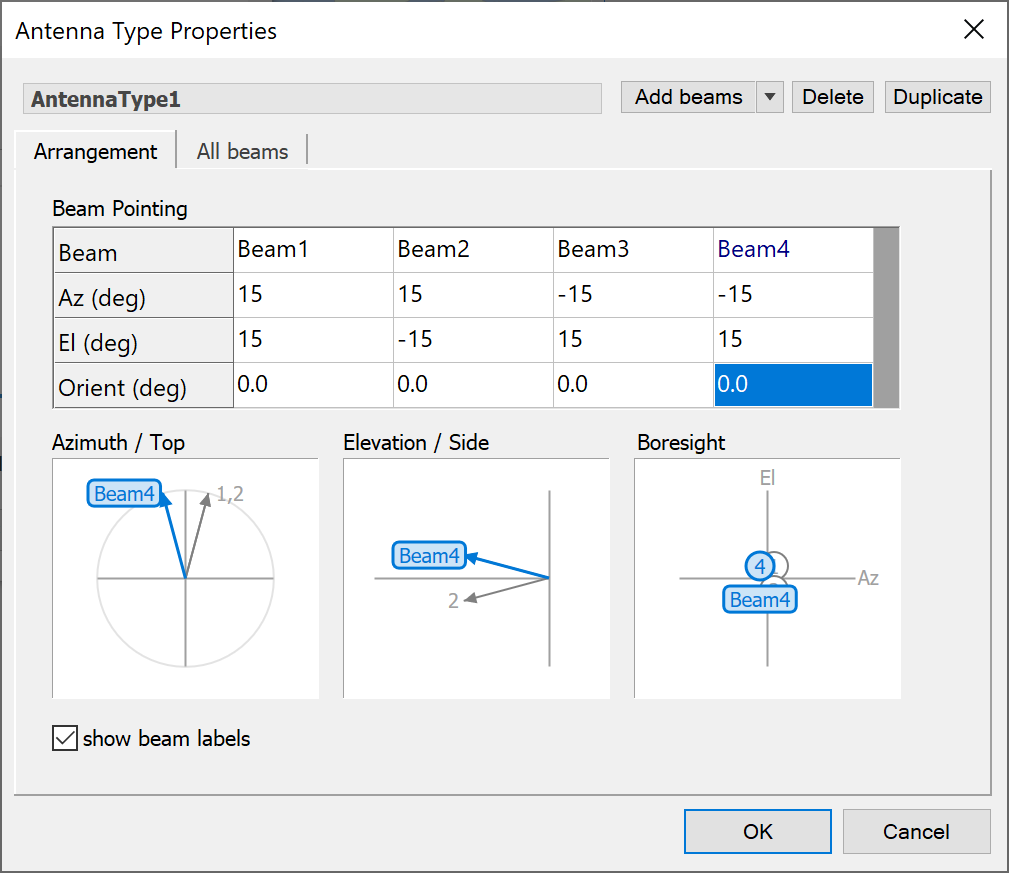
When you click in the Beam Pointing table on the Arrangement tab, the corresponding beam name is highlighted in the table. To help with identification, the beam is also highlighted in the preview windows and on the beam tab. If the tab for the beam is not visible it is scrolled into view.
To modify the parameters for a beam, you can either click on the beam tab or you can double click on the beam in one of the preview windows. If you use the double-click option and the beam tab is not visible, it will be scrolled into view and selected.
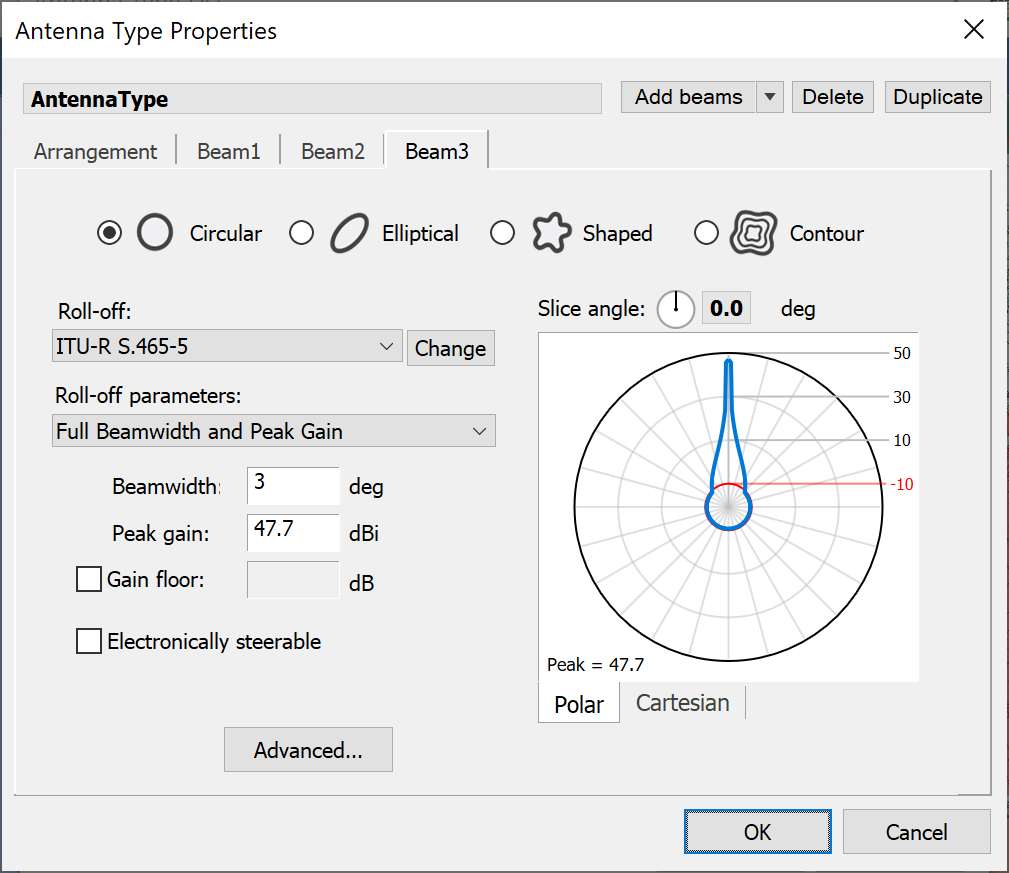
Editing of individual beam properties is exactly the same as for single beam Antennas. However, because this is a multiple beam Antenna, the individual beams can be duplicated and deleted.
Duplicating and Deleting Beams
When a beam has been selected, the duplicate and delete beam buttons become available. To duplicate a beam, click duplicate. A new copy of the beam will be created. The copy will become the selected beam. To create multiple copies, simply keep pressing the duplicate button until the desired number of beams has been created.
To delete the selected beam, click Delete.
Multiple Identical Beams
The Multiple Identical Beams option differs from the Multiple Beams option in that however many beams you create, there will be only one Beams parameter tab and this will be applied to all the beams.
Symmetric Spot Beam Pattern
Many popular satellite systems designs include multiple spot beams, arranged in symmetric patterns around the Antenna boresight. The regular arrangement of beams with circular, hexagonal or square symmetry is used to provide cellular coverage on the ground.
These can be created using the symmetric spot beam pattern antenna, as in the figure below.
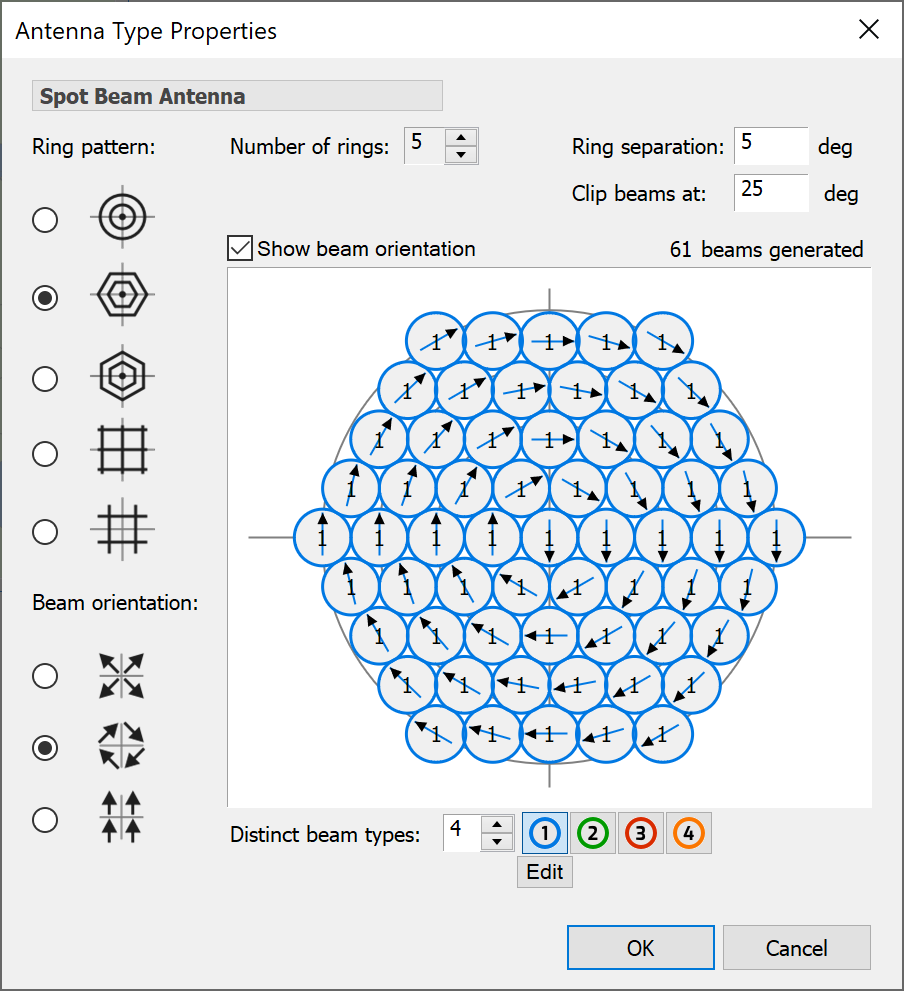
Note that you will have to change the beam type from isotropic / omnidirectional to see the beams as circles.
This dialog allows complex arrangements of beams to be created using the various controls. After the standard field for the antenna name, the dialog is split into the following sections:
- Pattern
- Orientation of beams
- Configuration of beam layout
- Definition of beam(s)
Starting with the pattern, a number of configurations can be defined, including circular, hexagonal (either orientation) or square (with or without central beam).
Some examples are shown below.
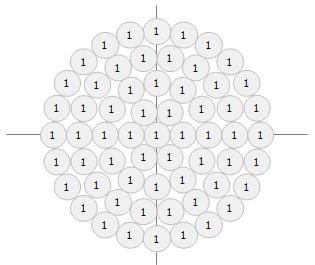 Circular Pattern Circular Pattern | 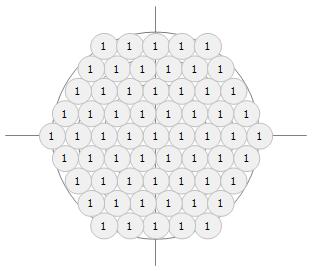 Hexagonal Pattern Hexagonal Pattern | 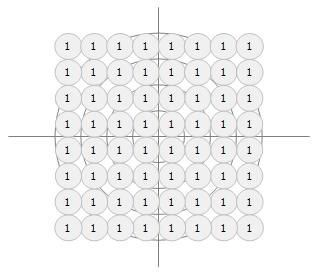 Square Pattern Square Pattern |
|---|
If all the beams are circular, then it doesn’t matter how they are orientated. However, if they are elliptical it can make a significant difference – for example to maximise coverage or to reduce number of handovers between beams. Hence there are options to select the following three orientation options:
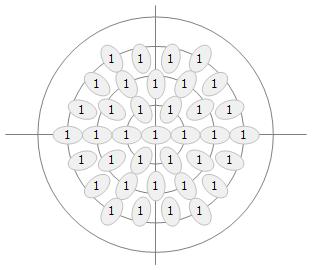 Long Axis Towards Sub-Satellite Point Long Axis Towards Sub-Satellite Point | 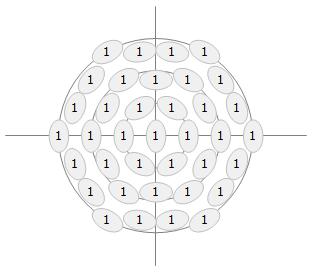 Short Axis Towards Sub-Satellite point Short Axis Towards Sub-Satellite point | 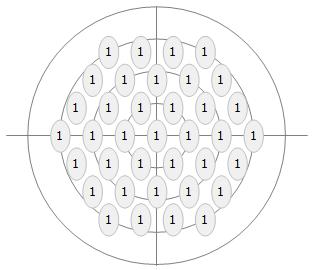 Long Axis Aligned with Velocity Vector Long Axis Aligned with Velocity Vector |
|---|
A check box control on the dialog allows the orientation axis to be shown or hidden.
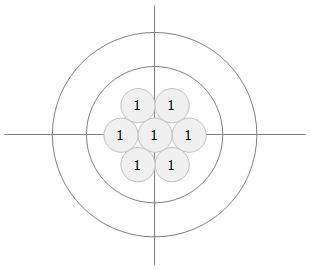
There are then controls to define the number and spacing of beams with the pattern, as in the figures below:
 Hexagonal Pattern with 2 Rings of Spots Hexagonal Pattern with 2 Rings of Spots | 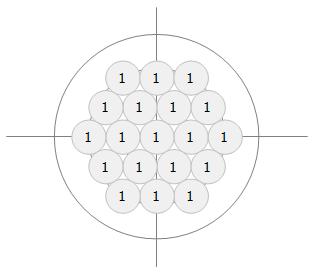 Hexagonal Pattern with 3 Rings of Spots Hexagonal Pattern with 3 Rings of Spots | 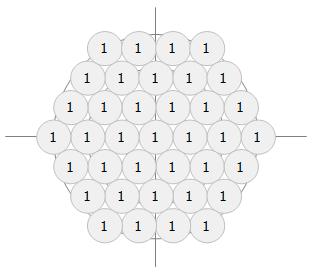 Hexagonal Pattern with 4 Rings of Spots Hexagonal Pattern with 4 Rings of Spots |
|---|
If you are using a hexagonal pattern to cover the field of view from a non-GSO satellite the outer beams are often not required as they would point towards space rather than intersect the Earth. Hence there is a trim or clip option to cut the outer beams at a specified angle, as in the examples below.
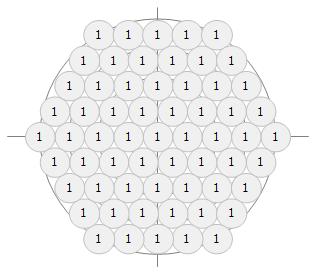 5 Ring Hexagonal Pattern without Clip 5 Ring Hexagonal Pattern without Clip | 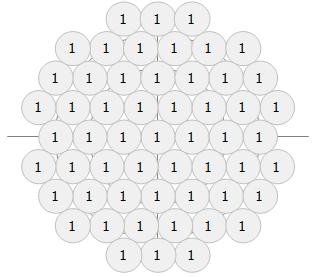 5 Ring Hexagonal Pattern with Clip 5 Ring Hexagonal Pattern with Clip |
|---|
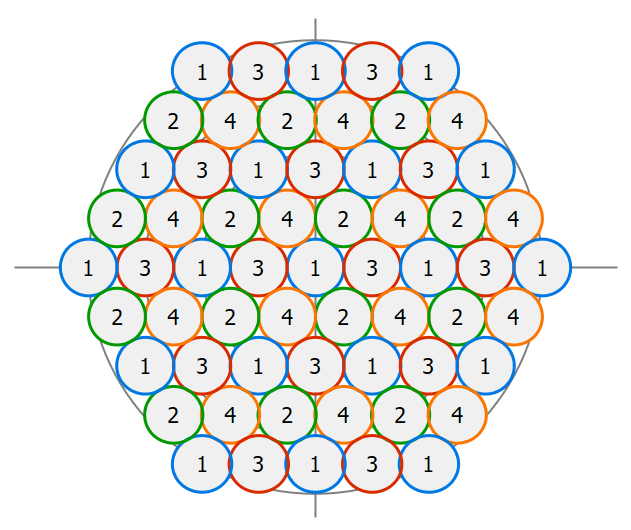
All the beams can use the same pattern, as in the examples above. If you want different beams to use different patterns, then you can create a set of beam types that can be assigned to each beam. To increment the number of beam types that can be used and to edit each one, use these controls:

These beam types can be assigned by clicking on one of the numbers to select it and then on each of the beams on the preview. This can be used (for example) to create frequency re-use patterns, as in the figure below.
Satellite PFD Mask
Visualyse can create a special type of Antenna that will reproduce the constraints of an elevation (or alpha angle) dependent PFD mask. To create a satellite PFD mask, select Satellite PFD mask from the Antenna Types dialog: this will open the Antenna properties for the new PFD mask.
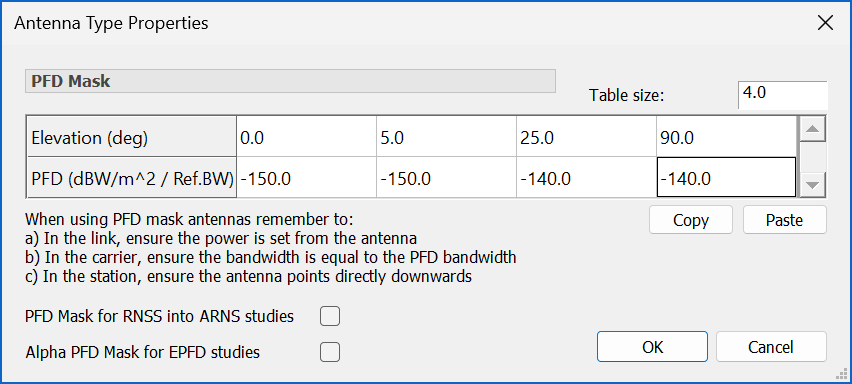
Satellite PFD masks are specified as arrays of maximum allowable PFD at defined elevation (or alpha) angles.
The PFD Mask can be modified to specify the PFD mask is used for RNSS calculations under Resolution 609 via the "PFD Mask for RNSS into ARNS studies" option.
To define the PFD mask using Alpha angle (for EPFD studies) check the "Alpha PFD Mask for EPFD studies option".
Note the prompts as to how to use the PFD mask e.g. that the reference bandwidth will be defined when this Antenna is associated with a Link via its Carrier.
Stations
Stations define the locations of your transmitters and receivers. They also define the dynamics i.e. how the scenario will evolve.
The Station object includes, by reference, one or more Antennas which the Station points using one of the eight pointing options.
Stations are an essential part of the definition of the geometry of a scenario. Later we will see how this geometry is completed and the topology defined by the addition of Link objects.
Creating Stations
The Station List can be accessed from the Model menu or from the toolbar. The list is shown below.
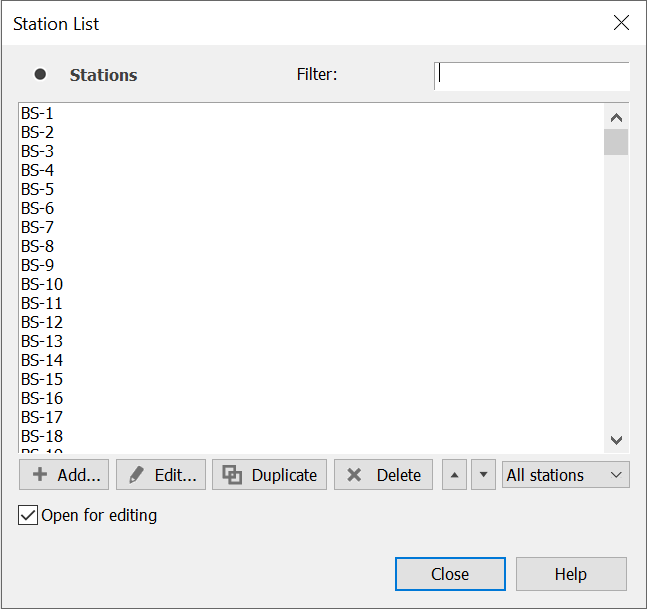
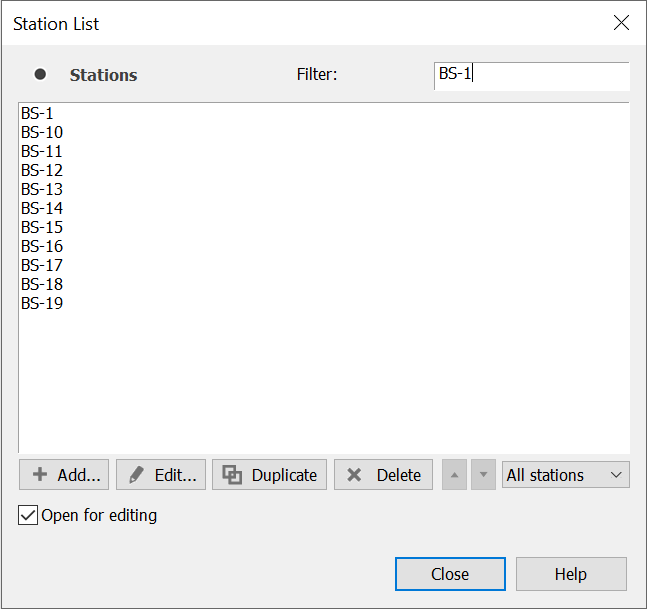
This list and its window can be filtered in two ways. First, it can be filtered on name.
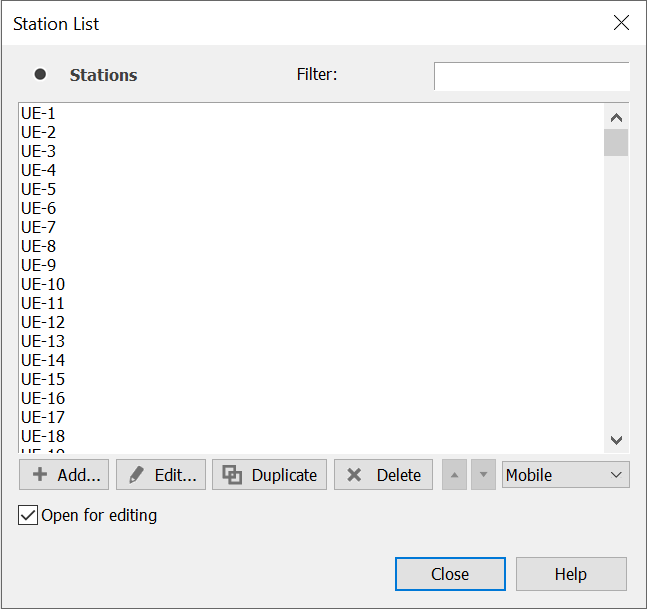
Secondly you can filter the list by Station type.
To add a Station from this location, click the add button. This will display a Station type selection dialog.
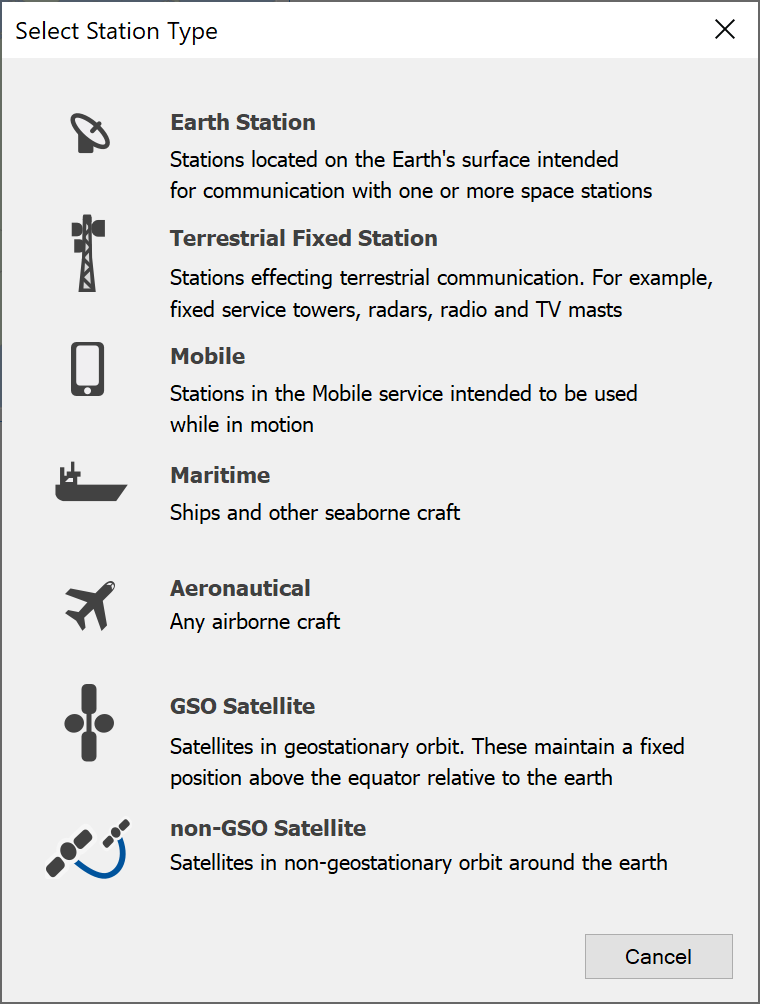
By default, the software opens a new edit dialog as soon as you create a Station. You can switch off this option by unchecking the box in the bottom right of the List Dialog
Station Types in Visualyse
Visualyse Professional has seven station types:
- Earth Station
- Terrestrial Fixed Station
- Mobile Station
- Maritime Station
- Aeronautical Station
- GSO Satellite
- Non-GSO Satellite
The difference between the various types relates to fundamental difference in their dynamics – e.g. terrestrial fixed stations are constrained to move with a fixed point on the earth’s surface, GSO satellite have a fixed longitude in the geostationary orbit etc.
Logically there is no distinction between an Earth Station (commonly taken to be a satellite earth station) and a terrestrial fixed station – in fact some investigation will show that the only difference between the dialogs is in the default icon that is used.
It is recommended that you read Stations, which give information relevant to all station types.
The other subsections below give information specific to the station type you may wish to model.
Antenna and Beam Pointing
Common to all Station types is a selection of the method used to point the antennas.
Antennas can point in one of eight ways:
- Fixed pointing direction
- Point at another Station
- Rotate in the azimuth plane
- Scan between two azimuths
- Allow the Link to set pointing
- Point at another Station OR the common volume
- Track a station with fixed elevation
- Point at another station using random offsets
- Elevation by latitude
In addition, electronically steerable beams can have their pointing angles changed by Links.
These options are described below.
Note that all Antennas have their own position and velocity vectors based upon the position and velocity vectors of the containing Station, with offset for Antenna height if required.
Fixed Pointing Direction
In this case the user specifies the (azimuth, elevation), and these values are fixed for the duration of the run for the relevant beam or Antenna.
Point at Another Station
Fixed on Station can take one of the following as it’s tracking target as:
- Fixed upon a target Station
- Fixed upon a target Antenna
In each case at each time step the pointing angles of the Antenna are set up using the vector position and velocity of this Antenna and the vector position and velocity of the target Station/Antenna.
Rotate in the Azimuth Plane
Scanning Antennas have the following parameters defined:
- Elevation angle
- Start azimuth
- Scan rate in degrees / second
Scan between two azimuths
Scanning Antennas have the following parameters defined:
- Elevation angle
- Start azimuth
- End azimuth
- Scan rate in degrees / second
Allow the Link to Set Pointing
These Antennas have their pointing angles updated by a Link during Link update if the Antenna is used, otherwise the angles are not changed.
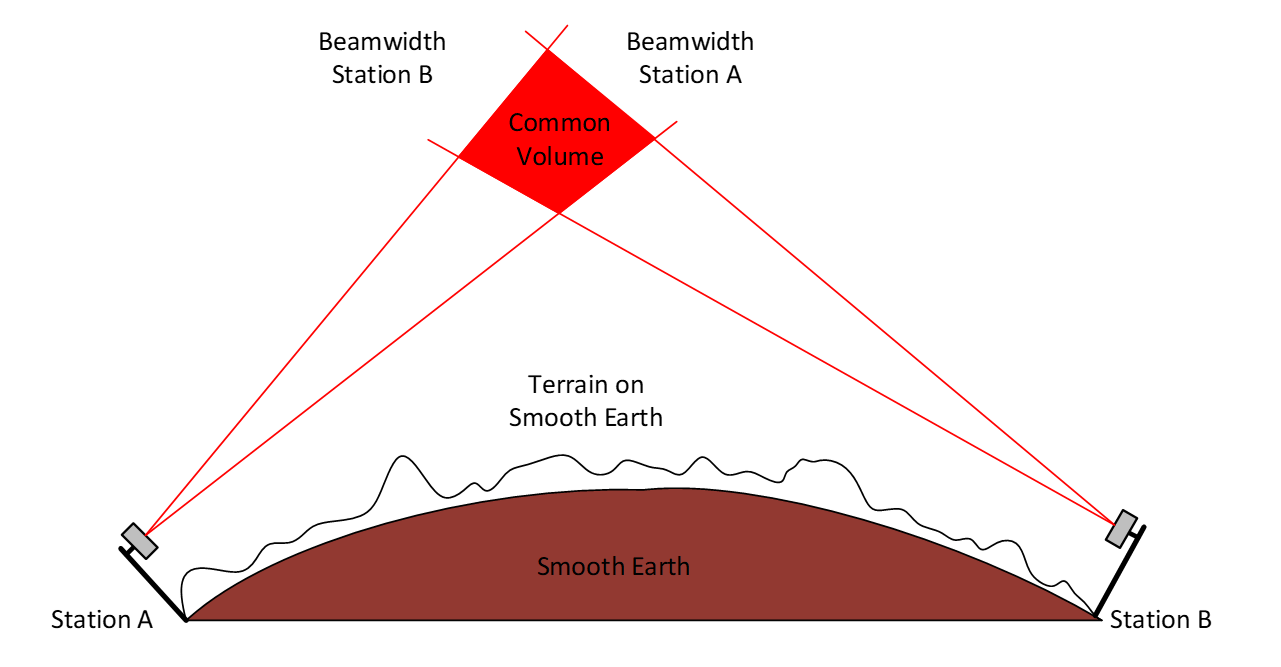
Point at Another Station or the Common Volume
In this case the Antenna will point in the direction (azimuth) of the selected Station, but that Station is (or becomes if the Station is moving) transhorizon, will point at the horizon in the direction. In effect this is how a troposcatter system points its Antennas.
The ‘common volume’ is indicated in the diagram below
Track a station with fixed elevation
This option is as “Point at Another Station” but the user can enter a fixed elevation value that is used at every time step instead of the calculated value.
Point at another station using random offsets
This option is as “Point at Another Station” but the user can enter a random offset range for azimuth and elevation that are used at every time step instead of the calculated value.
Elevation by latitude
A table of elevation angle vs. latitude should be entered together with the azimuth to use. At each time step the current latitude of the station will be used to derive an elevation angle from the table using linear interpolation. For non-GSO systems the coordinate reference system should be set to “North based”.
Note on Electronically Steerable Beams
If a beam is defined in the Antenna dialog as ‘Electronically Steerable’ the point angles can be defined by reference to a Link where the end point of a link moves, or is subject to handover, the point angles of the beam may change from whatever is defined in the Station.
Fixed Terrestrial Stations
When you create a new fixed terrestrial Station, the dialog shown below will appear.
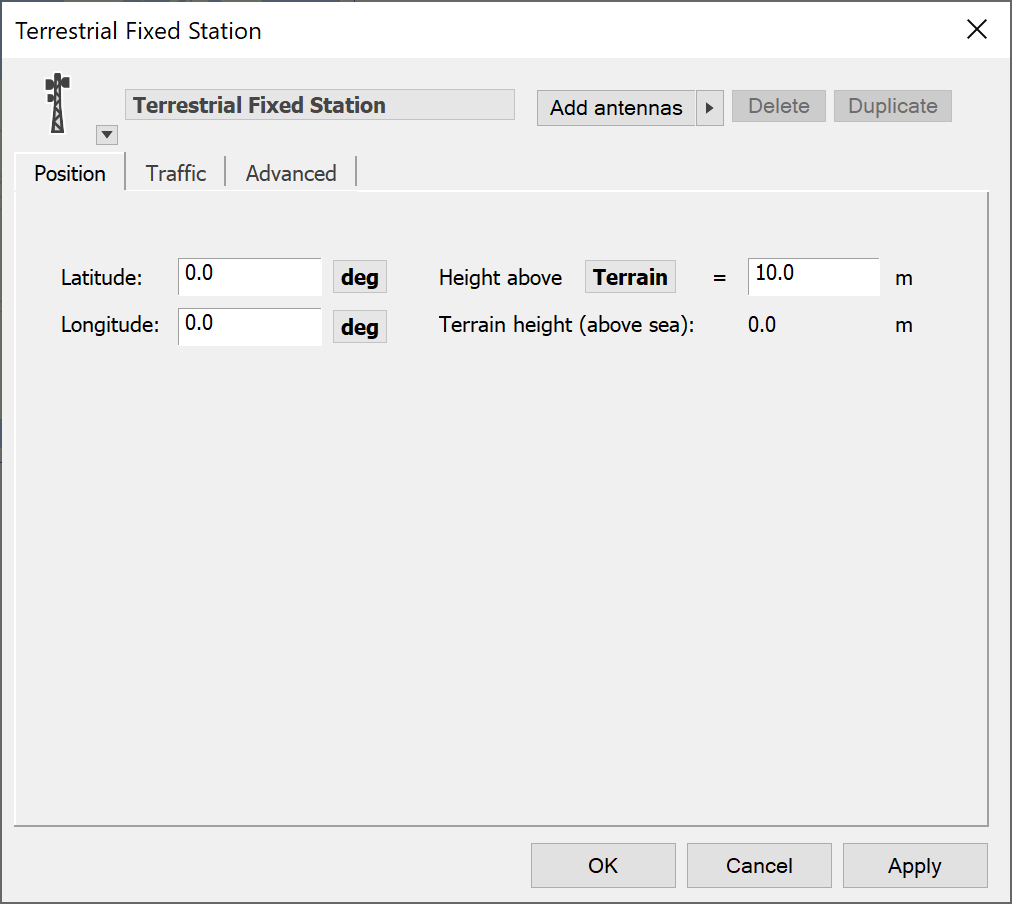
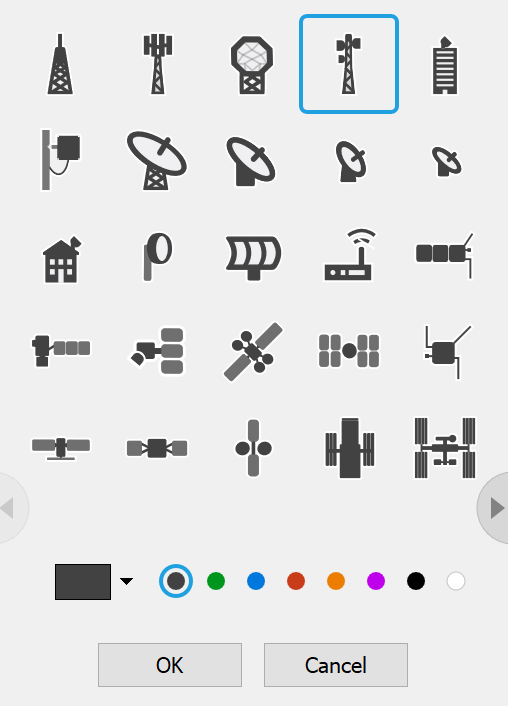
The Station icon can be changed by clicking on the small black arrow by the side of the icon. This produces a drop-down menu from which a new icon can be selected.
The tabs shown when this station is created are Position, Traffic and Advanced.
Position
The position tab allows you to set the location of the Station.
You can change the latitude and longitude of the Station. Clicking on the units will produce a popup menu from which you can pick the units that are appropriate.

If you select degrees, minutes, seconds, the format is:
[N/S/E/W] DD:MM’SS.SS”
You can choose whether to specify the height of your Station above the terrain or above sea level. If you have any terrain data in this simulation the terrain height at that location is displayed.
Adding and Managing Antennas
A Station can have multiple Antennas. The parameters for each Antenna are presented on a separate tab. By default, a Station is created with one Antenna.
An example Antenna tab is shown below.
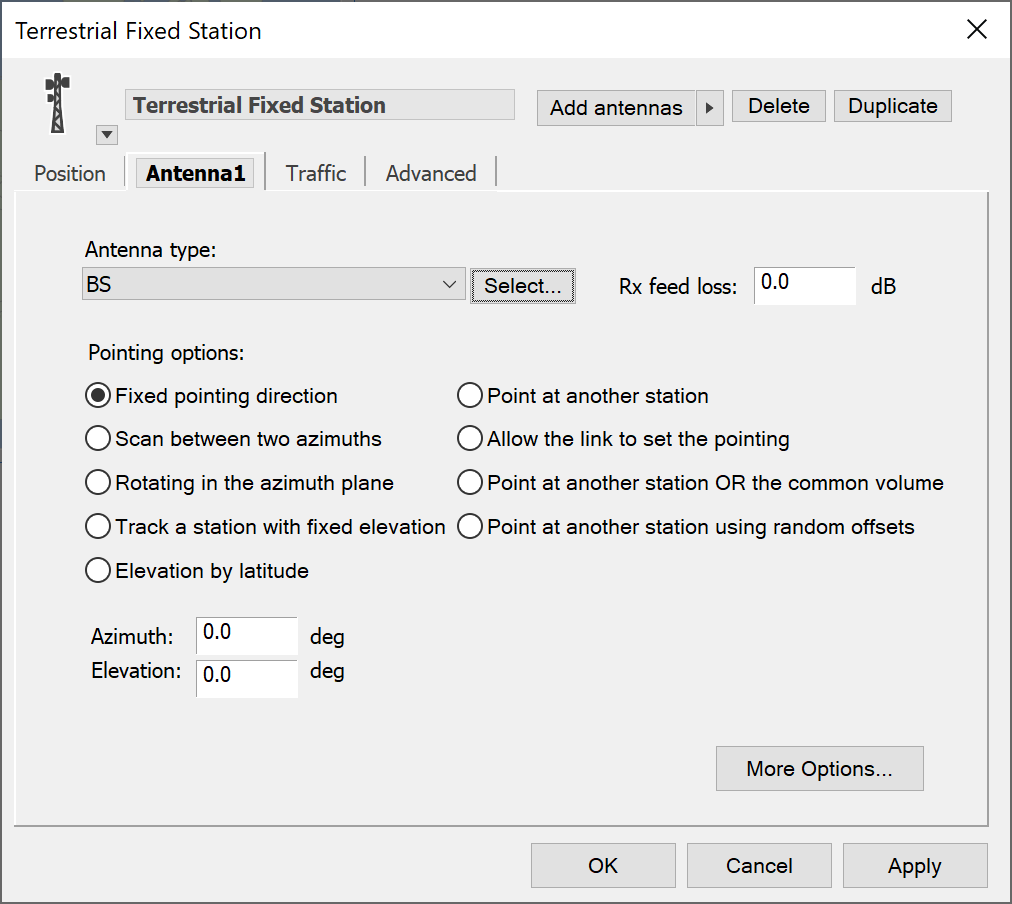
The parameters for the selected Antenna are:
- Type – which of your library of antenna models to use for this station
- Feeder loss – what is the loss in dB due to the feed from the antenna to the receiver (not transmitter – see Technical Annex for more information)
- Pointing options – how is the pointing of this antenna determined.
Click the Select button to change the type of Antenna. This will show a dialog from which you can choose one of the new Antennas you have created.
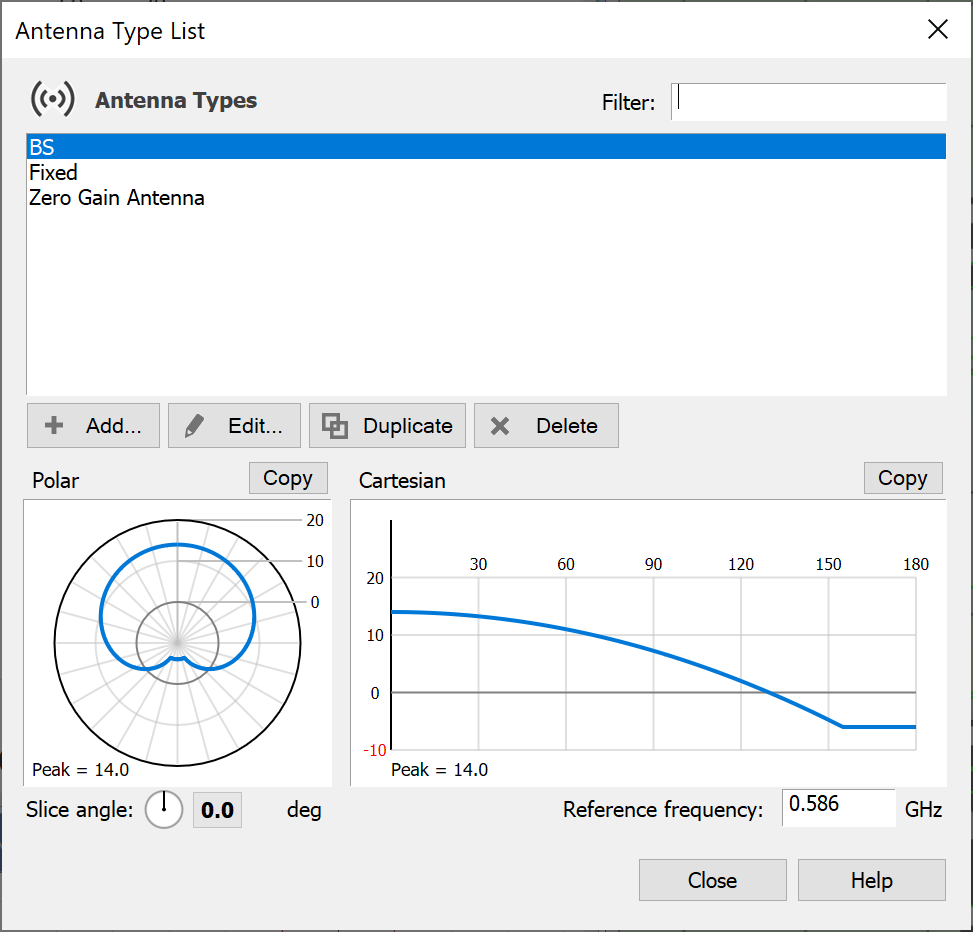
Choosing an Antenna Type means that the Station will use the characteristics of the Antenna as defined in the Antenna list. An important point is that if the Antenna in the Antenna list changes, all Stations that use that Antenna will change accordingly.
Antenna Pointing
They presented as a set of radio buttons and the options are described in Antenna and Beam Pointing. Clicking the required method reveals the parameters needed to fully define it.
First you decide how you want to point your Antenna, and then you set the required parameters for the pointing option you have chosen.
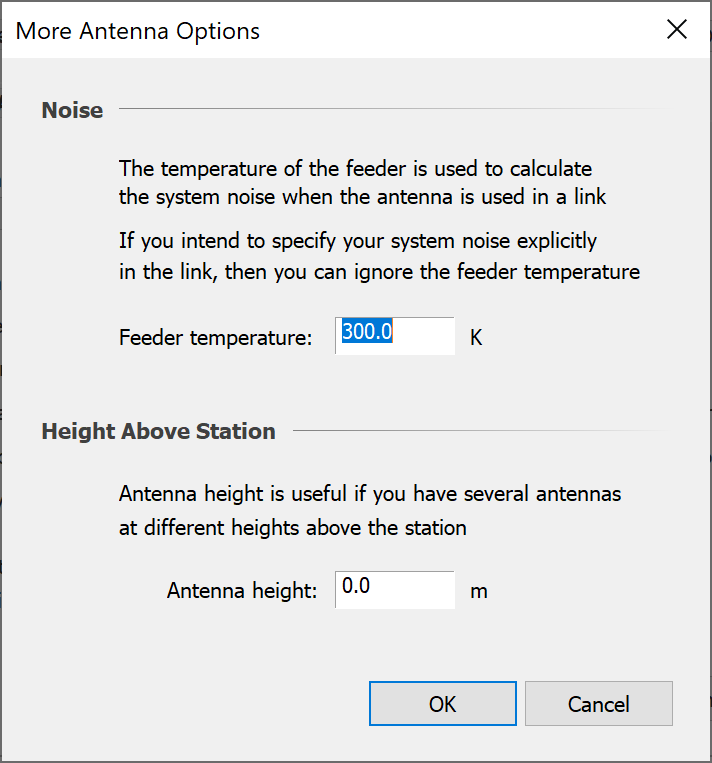
More options
The ‘more options’ button allows you to specify Antenna temperature and the Antenna height.
Feeder temperature is needed if you are going to let Visualyse calculate system noise from the component contributions due to the Antenna, feeder and receiver. The choice of how to calculate system noise is made in the Link dialog – you have the option simply to enter the system noise directly in Kelvins, and if you are going to do this there is no need to enter the Antenna noise.
Antenna height is the height above the Station, and has some influence on some propagation models and, of course some influence on the simulation geometry.
Managing Multiple Antennas in a Single Station
Management of multiple antennas is very similar to that of beams on the Antenna dialog (Managing Beams). To add multiple Antennas, click on the black arrow to the right of the Add Antennas button.
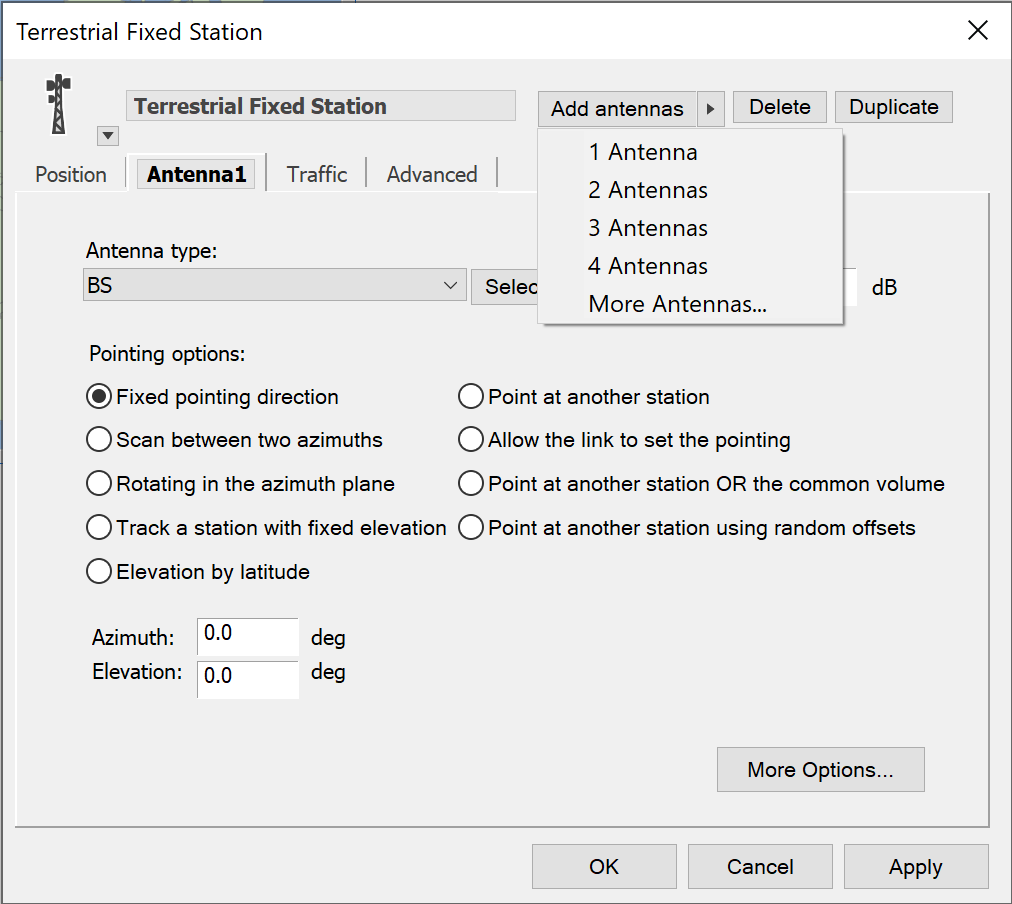
From this menu, you can choose how many Antennas you want to add to your Station. There are options for quickly adding up to four Antennas at a time. If you want more than four Antennas, click the More Antennas option. A dialog box will appear allowing you to specify the exact number of Antennas you require.
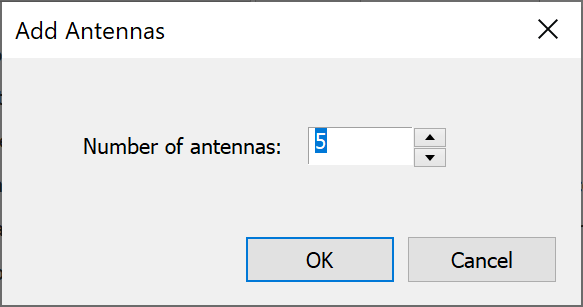
New Antennas appear as new tabs. If there are more Antennas than will fit across the dialog, scroll buttons will appear to allow you to access the extra tabs.
Duplicating and deleting functions work on the currently selected Antenna. If you duplicate, the new Antenna becomes the active selection. If you delete, the next Antenna becomes the selection (unless you delete the last Antenna in which case the previous Antenna becomes the active selection)
Naming Antennas
Antennas are automatically given names by the software. However, you can give your Antennas more meaningful names, and this practise is encouraged because good naming makes complex models easier to understand (especially if you revisit them at some time in the future and need to remember what you were doing)
You rename the antenna by interacting with the name on the tab directly. It works in the same way as when you change the Station name.
When the mouse passes over the Antenna name the cursor changes to a caret, 
If you click on the name, it changes to an edit box so that you can alter it. This is shown below.

Typing a new name causes the tab to automatically resize. Click away or hit Return to finish editing.

You can only do this with the selected Antenna. To change the name of another Antenna, you need to select it first.
Advanced Option
The advanced tab incorporates the Station coordinate system parameters and attitude parameters relating to the station reference frame.
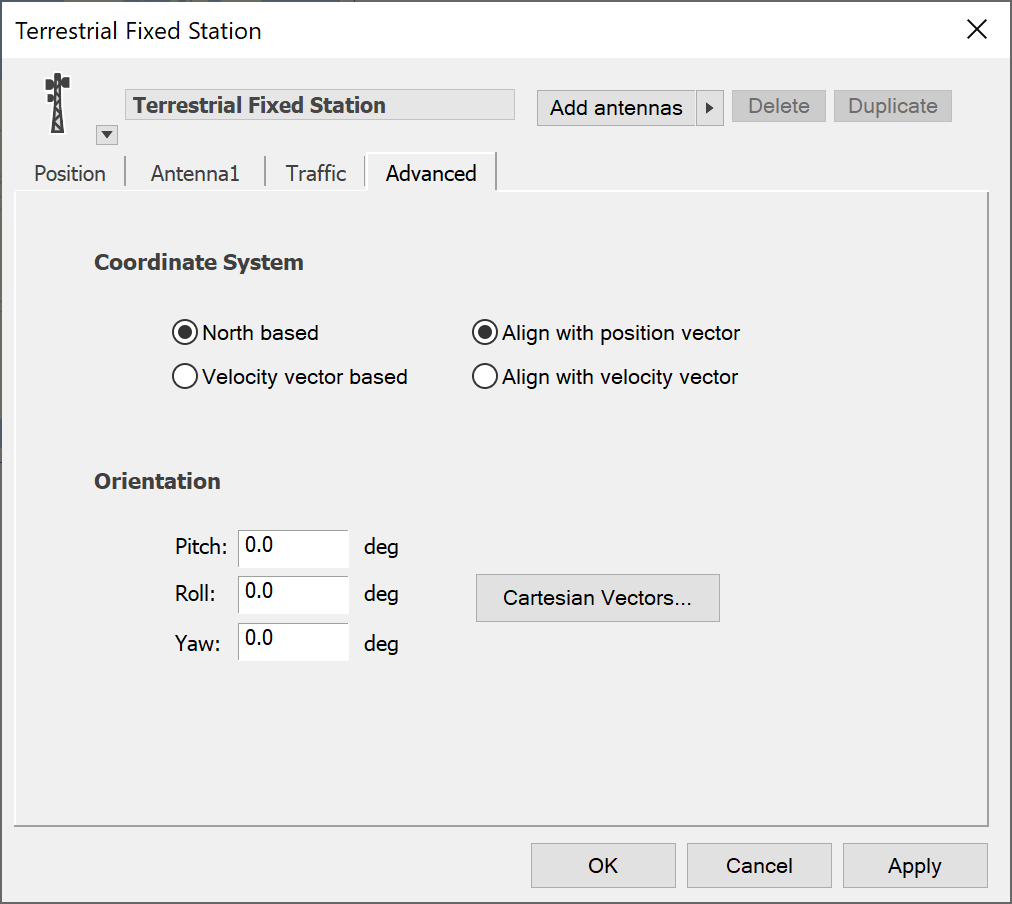
For a description of the effect of changing the coordinate system reference, and for definitions of the Station azimuth and elevation see the Technical Annex.
Parameters relating to the reference frame definition and to the station attitude are editable here.
Click the ‘Cartesian Vectors’ button to bring up the definitions of the vector position and velocity of the station.
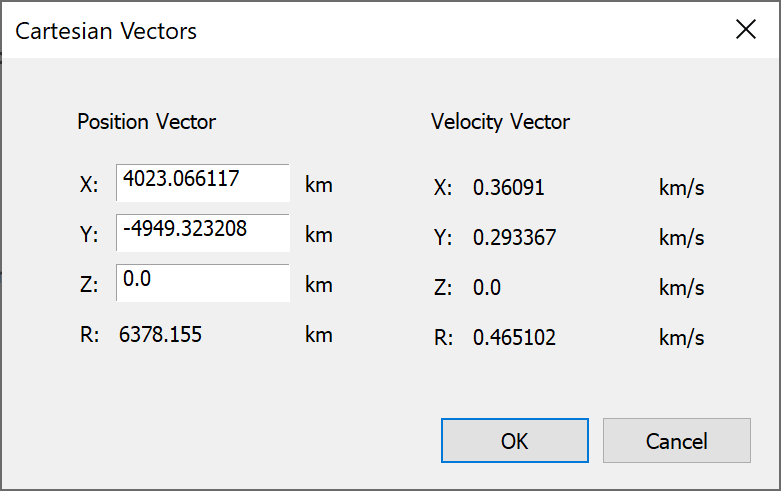
You can edit the vector components directly here – it is unlikely that you will ever want to do this, and we recommend that, unless you know exactly what you are doing, do not change these fields.
Traffic Modelling
Traffic won’t appear on the Station dialog at all unless your installation has the traffic module. If traffic is enabled, the traffic tab will appear as shown below.
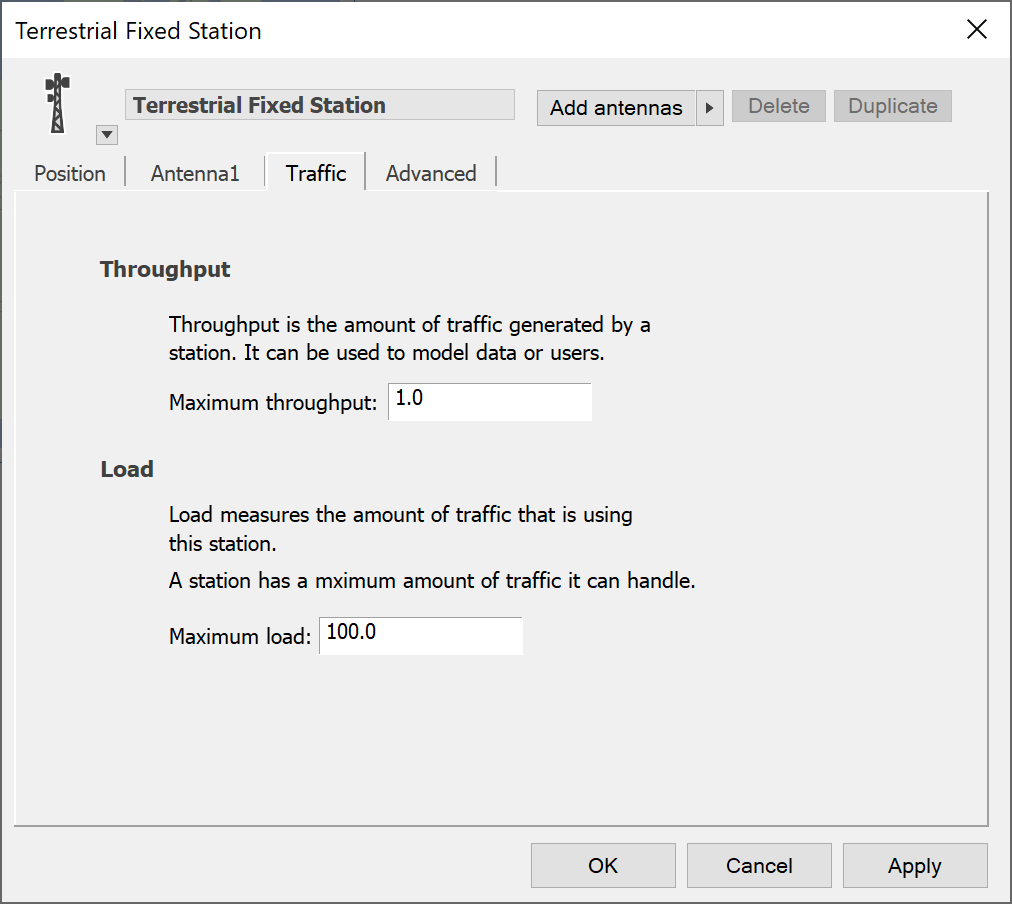
For details of how to use the traffic module, please refer to the Module User Guide. Note the maximum load field can be used by the Population Data processing as described in Service Area Wizard.
Earth Station
These are identical to Terrestrial Fixed Stations in terms of functionality. The only difference is the dialog name and the default icon (an Earth Station).
Mobile Stations
Mobile Stations are the same as Terrestrial Fixed Stations except that they can move around. The position tab allows you to set the start location and how the Station moves from that start location.
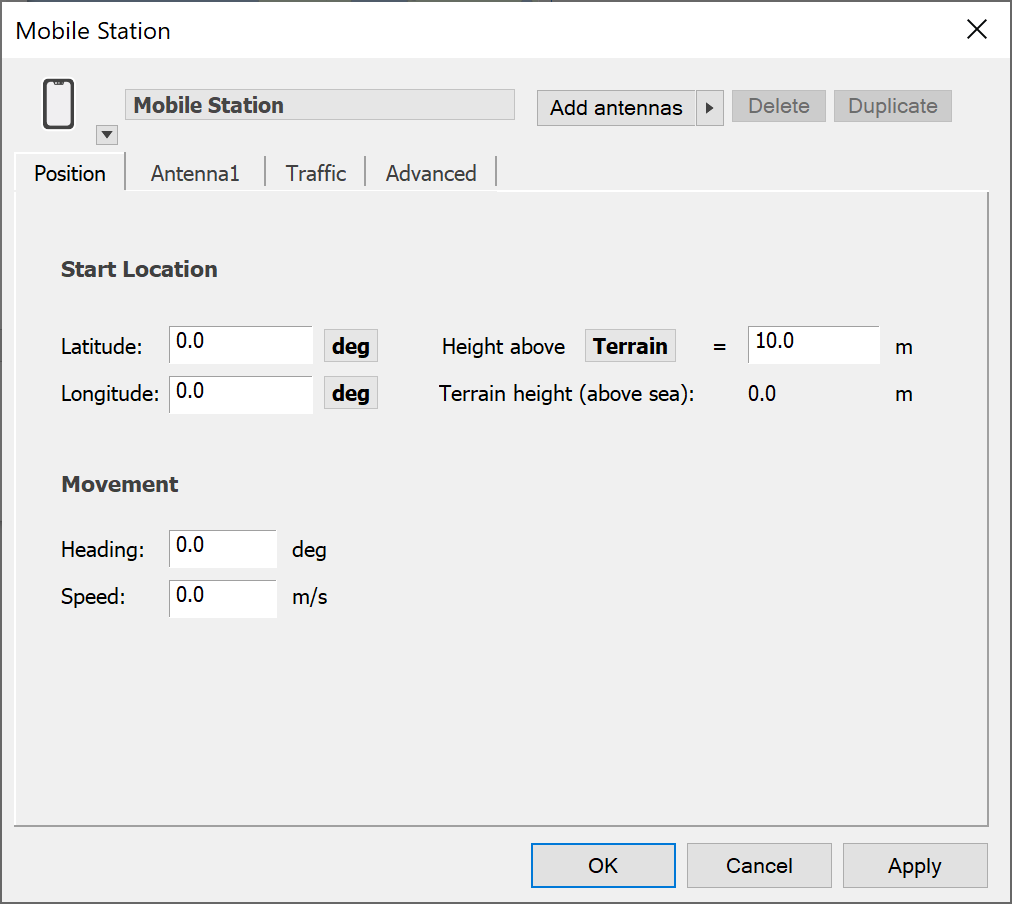
Heading can be changed by typing a value in the box. The angle control next to the box indicates the angle that has been entered. By clicking and dragging in the angle control itself, you can also set the heading.
Note: that this simple motion can be over-ridden by using the Define Variable module, which allows you complete control over the location of the station throughout a simulation. This module also allows you to vary parameters randomly and hence perform Monte-Carlo simulations (see the Modules User Guide)
Maritime
These are the same as mobile stations. The only difference is the default icon (a ship).
Aeronautical
Again, identical to mobile stations, but with the addition of a climb rate parameter on the Position tab. Default icon is an aircraft.
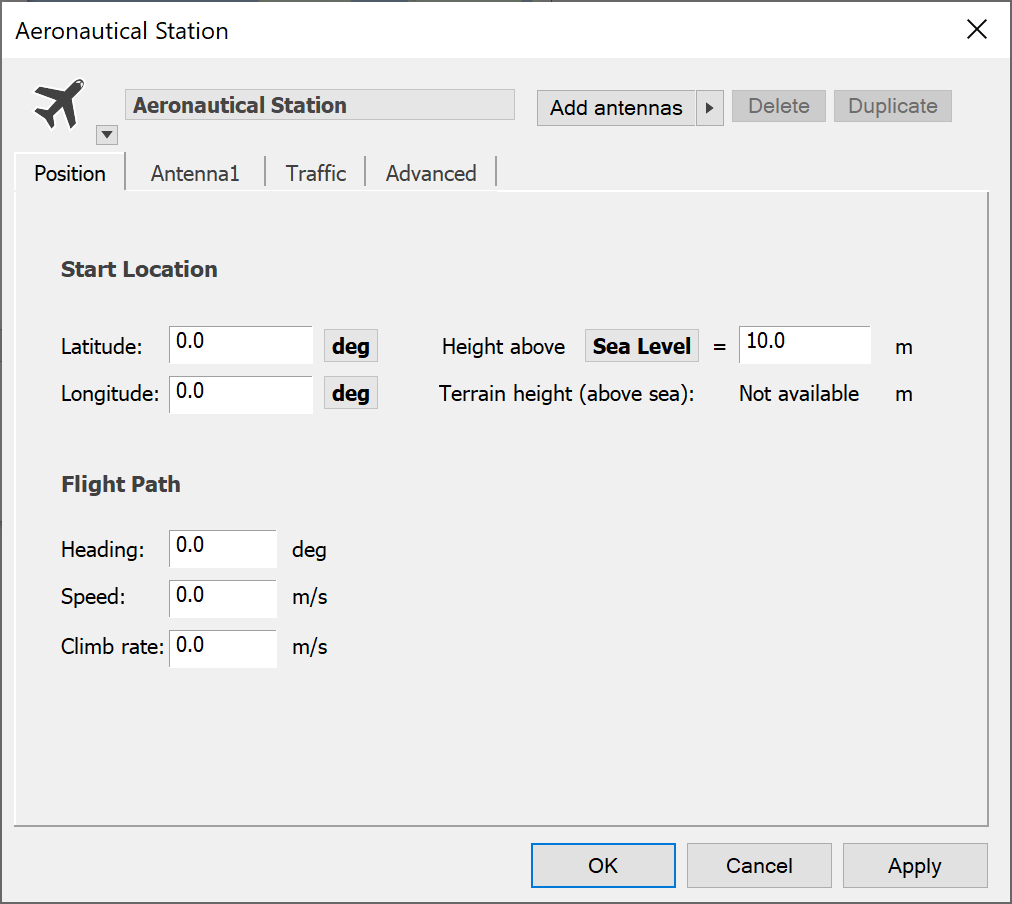
Non-GSO Satellites
Satellites differ from fixed and mobile Stations only by the way their position is specified. For non-GSO satellites, the classical orbit elements describe an orbital pattern that allows the position of the satellite to be calculated for any point in time.
So instead of the position page on the Station dialog, for non-GSO satellites, we have the Orbit page.
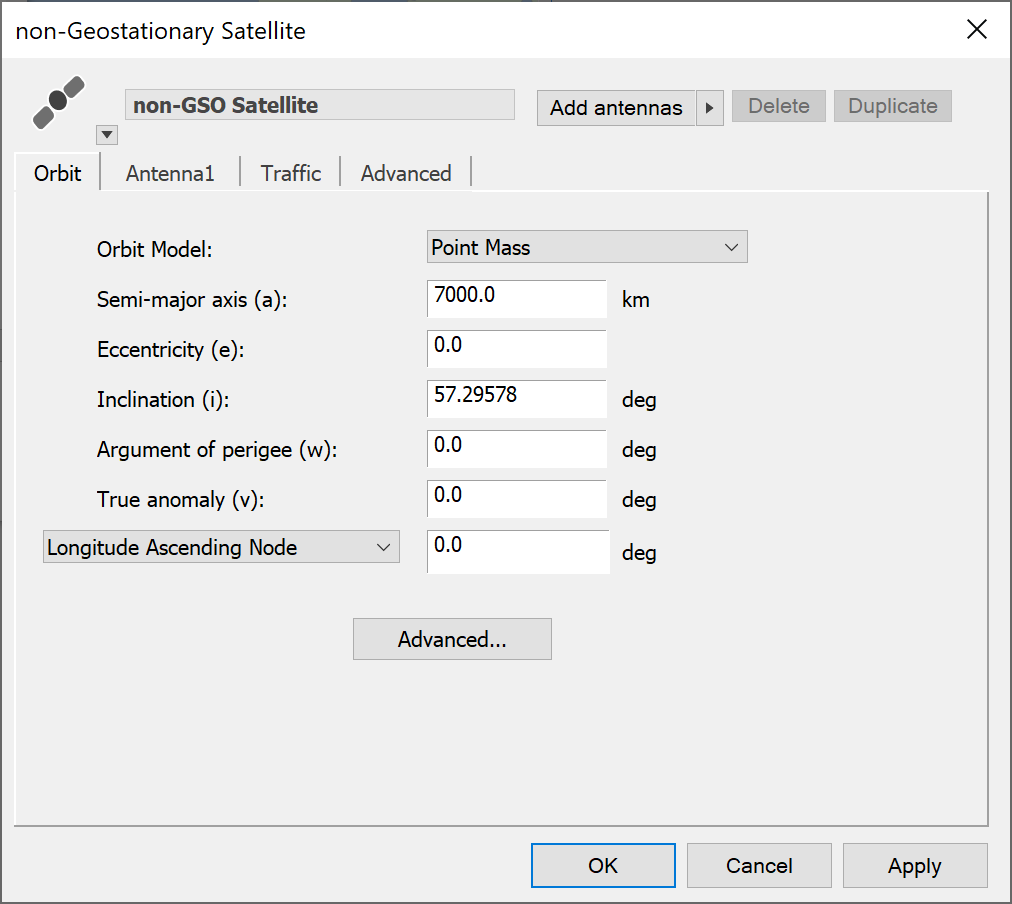
This dialog prompts you for a set of parameters that define the orbital elements of a satellite.
There are two modelling options here:
- Selection of the orbit model
- Selection of way to define the ascending node.
Visualyse has two orbit propagation options:
- Simple central potential
- Central potential plus secular perturbations due to the J2 term associated with asphericity of the earth.
For technical details you can refer to the Technical Annex.
The ascending node can be specified relative to a fixed location on the earth (longitude) or a fixed location in space (first point of Aries). The first option is called ‘Longitude of Ascending Node’ the second is ‘Right Ascension’
Choosing right ascension now requires you to specify an epoch for the orbit. This is needed as the location of a satellite will change relative to the earth if the time at which the orbital elements were valid is different from the current simulation time.
So, for example, you may have an element data from a couple of weeks ago but only just be ready to make your simulation. In this case you need to tell Visualyse the date on which the orbit data were valid (the Epoch).
The Epoch definition is accessed via the Advanced button on this dialog
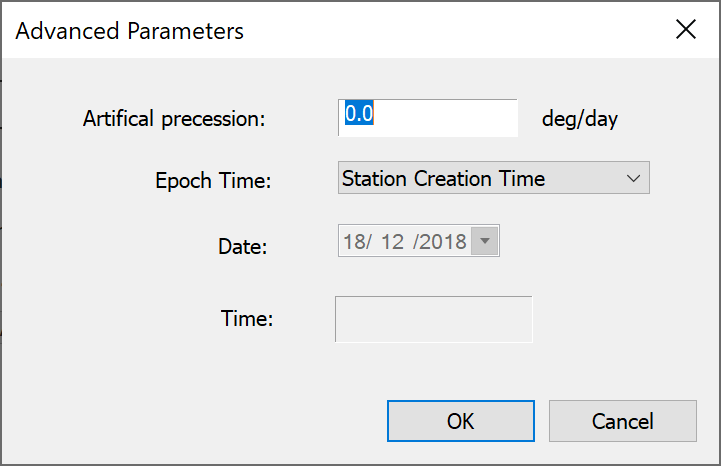
GSO Satellites
Geostationary satellites are in orbit just like the non-GSOs. However, because they maintain a roughly fixed position above the earth, we don’t need to define them by the classical orbit elements and can specify their position in a simpler way.
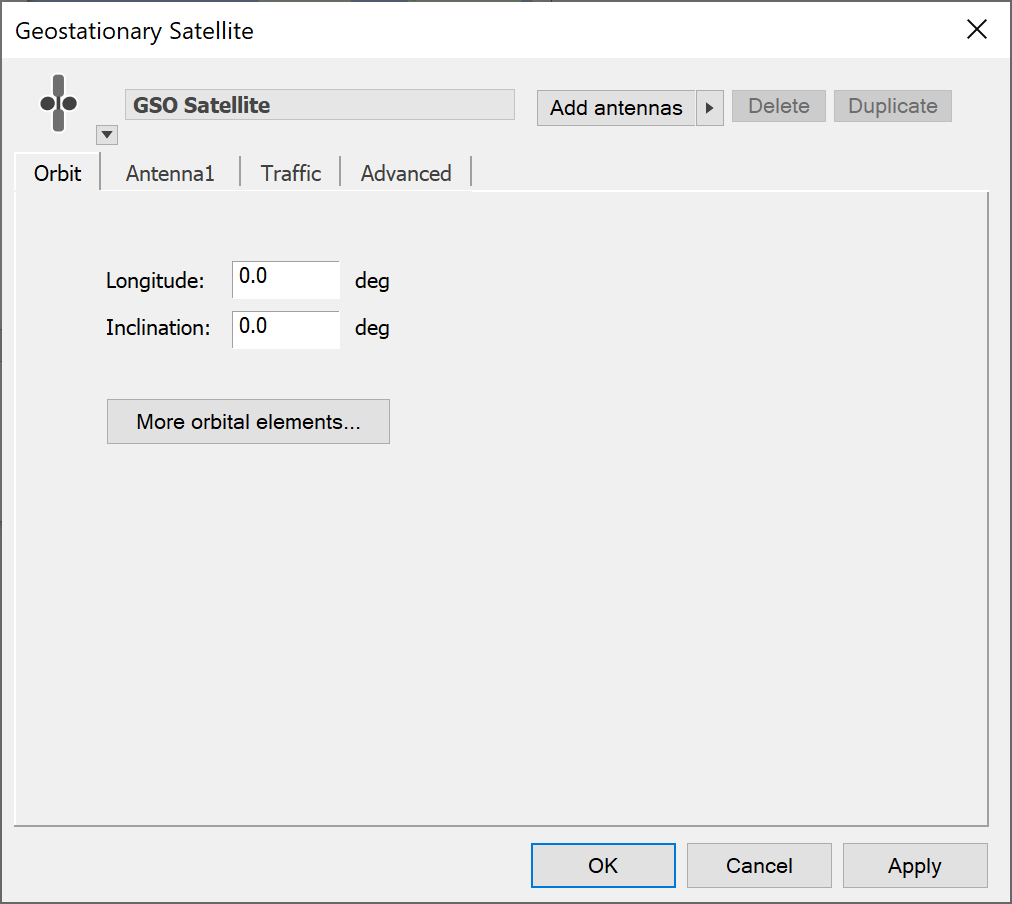
For most GSO work, only the longitude and inclination angle are required. For more advanced modelling, click the “More orbital elements” button. This will open the GSO orbital elements dialog. This allows you to specify the eccentricity, and phase in e and i.
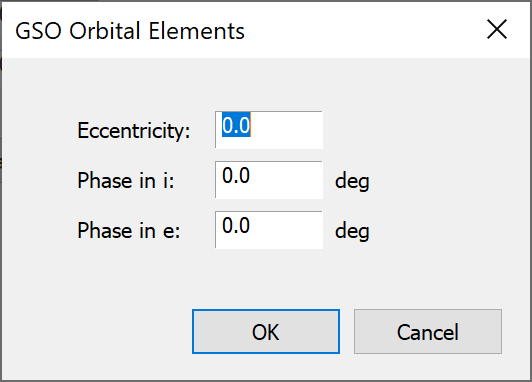
Phase in e (eccentricity) and Phase in i (inclination) relate to orbital anomaly (see the Technical Annex). Phase in e tells you how far from the apogee the satellite is at and Phase in i how far it is from maximum inclination – when the satellite was created. These parameters can have a dramatic effect on the ground track of satellite that is not in exactly circular orbit.
Station Groups
Station Groups are introduced in Visualyse Professional to make large simulations more manageable and understandable.
They also have associated ‘Wizards’ that allow for simpler creation of multiple identical stations based on a few parameters – for example you can make large constellations of identical satellites, or thousands of test point stations in defined service area.
As a general tip, it is better to manage Stations through Groups rather than directly through the Station List. The Station List can become very large, even in relatively simple scenarios
Stations in Visualyse can be collected into Groups. Stations in a Group may or may not be connected for interference calculation purposes. Groups can be used simply as aids to organising and analysing data.
A Station can be in more than one Group at the same time. Station Groups are treated as subsets of the complete Station List.
Visualyse Professional includes four methods for creating Station Groups, each of which is now briefly discussed. Detailed descriptions of each type are given in the subsequent sections.
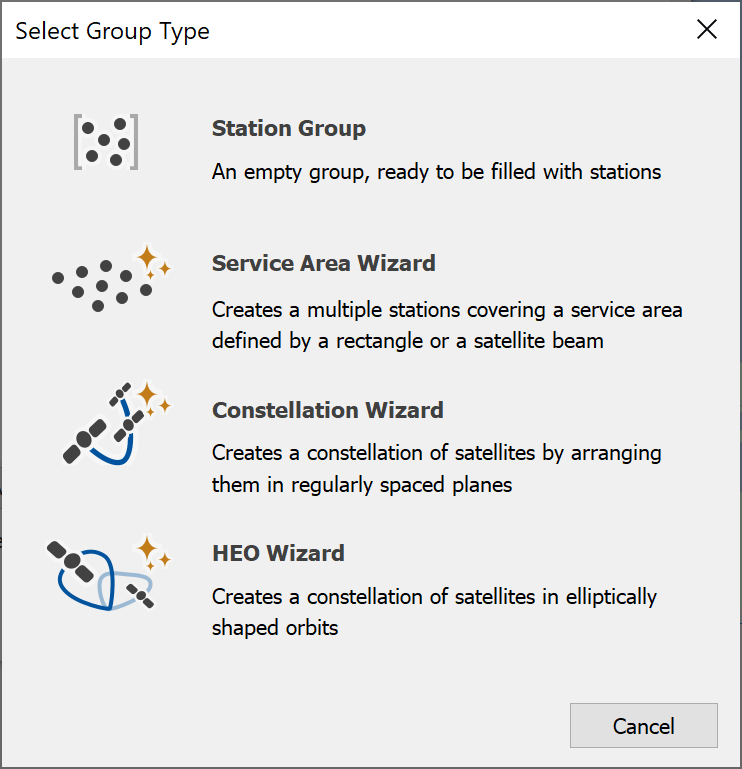
Station Group - Create Empty
Empty groups can be created and Stations can be added to it from the list of all Stations within the simulation. Even if Stations are being created individually it can be useful to assign them to a Group – for example to manage simulations by collecting like Stations together.
This also allows groupings of Stations that are not related in any of the ways assumed by the other Groups.
For example, satellite constellations that do not have the symmetries assumed by the Constellation Wizard are not excluded in Visualyse. The Constellation Wizard can be run several times to produce single planes of satellites with differing orbital parameters. Then, by creating and editing an empty Group it is possible to put all the planes into the same group and create a new constellation.
Mixed GSO/nonGSO constellations can be created in a similar way.
Constellation Wizard
The Constellation Wizard creates a Group of identical Stations in a nonGSO constellation with certain symmetry properties. Stations are assumed to orbit in equally spaced planes and to be equally spaced around each plane. You can also use the Constellation Wizard to import two-line element sets (TLEs).
Service Area Wizard
The Service Area Wizard creates multiple Stations in or on the boundary of a geographical area defined by latitude/longitude limits, or by the footprint of a selected antenna
HEO Wizard
The HEO Wizard allows you to define constellations of HEO satellites in several useful orbit configurations.
Re-running the Wizards
In certain circumstances Wizards can be re-run in order to modify the Station Group. You need to be aware of the knock-on effect that this can gave on the rest of your simulation. The first thing that re-running a Station Wizard does is delete the existing station in the group to be re-defined – and this results in any Links that use those stations becoming un-defined. You will need to fix the affected links.
The Constellation Wizard
Selecting Constellation Wizard starts the wizard dialog. The Dialog consists of a single sheet as shown below.
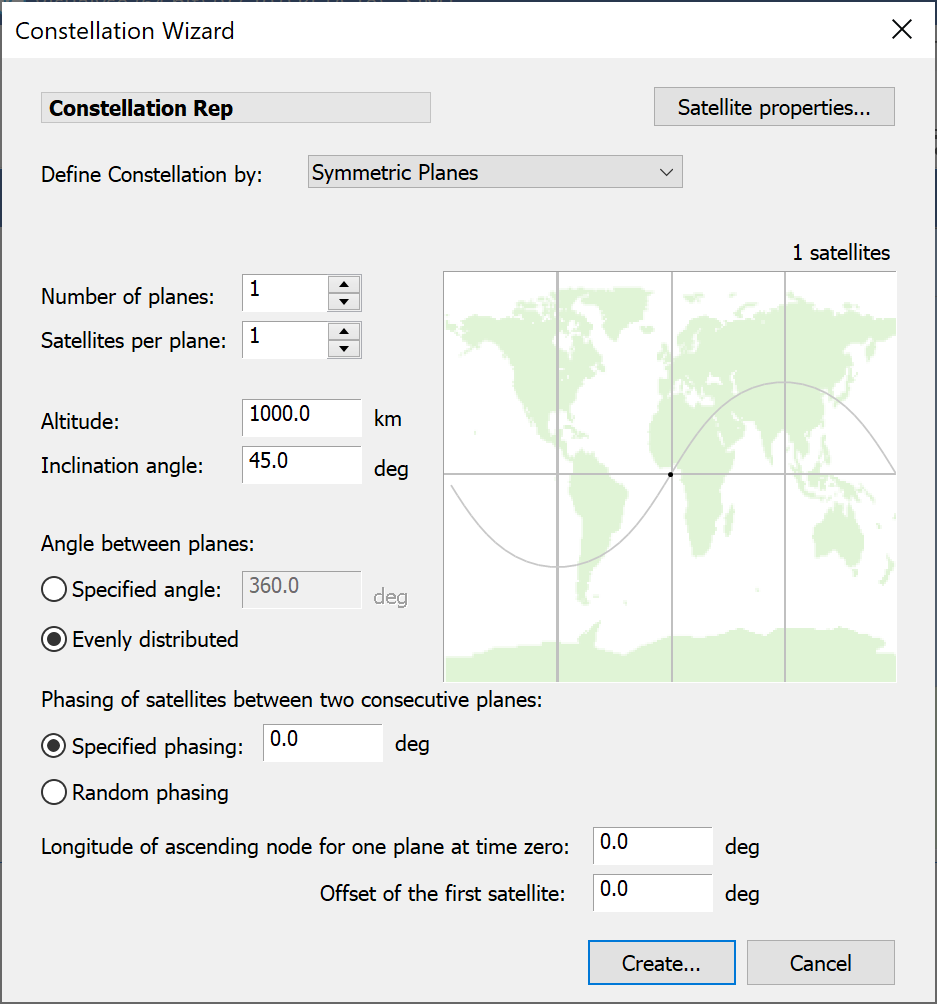
A non-GSO constellation is defined in the wizard either by a set of parameters which you input directly or by pointing to a data file that contains TLEs.
If you select Define Constellation by ‘Symmetric Planes you will need to enter the parameters as described below:
- Number of planes of satellites
- Number of satellites per plane
- Orbit height (altitude) - given in kilometres above mean sea level
- Orbit inclination - given in degrees
- Angle between planes – this is difference in latitude between adjacent satellite planes. You can set this to any angle or ask Visualyse to space the planes evenly.
- Phasing between consecutive planes – this specifies whether there is any relative offset in anomaly between equivalent satellites in adjacent planes
- The longitude of the ascending node of the first plane (at t=0)
- The offset of the first satellite in the first plane (specifies the anomaly of the first satellite in plane one at t= 0)
- The artificial precession rate.
The preview facility shows the sub-satellite points of all the satellites in the constellation and can be used to fine tune the coverage.
For many larger constellations, the phase between satellites in different planes is not controlled and can be modelled as essentially random. The Constellation Wizard provides a facility to randomise the phase. To use this feature, select the ‘Random’ box. To see the effect of the random phasing, click the Randomise button, followed by the preview button.
To make even randomly generated results repeatable, the Randomise button will always use the same sequence of pseudorandom numbers. To get n different random phasings, click the randomise button 1, 2, 3, … n times.
Constellations Based on Two Line Elements
If you choose “Define Constellation by” to be “TLE File”, you will see the dialog below:
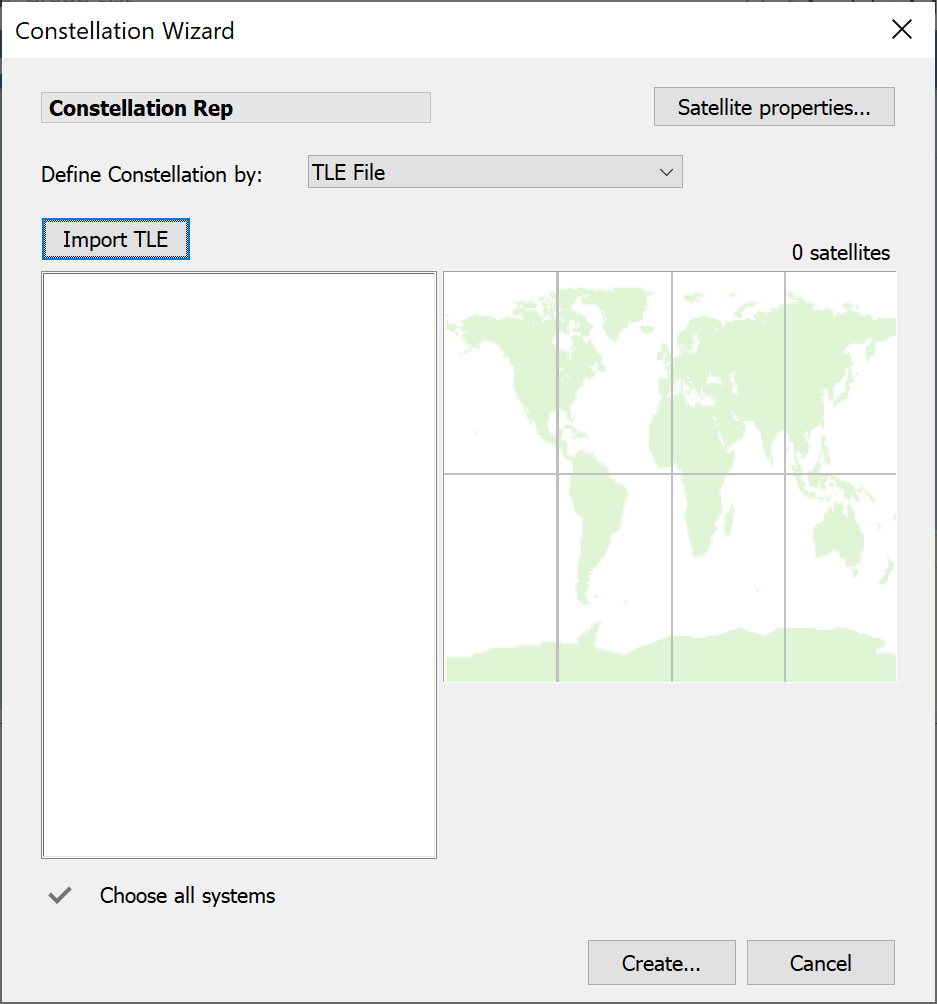
To import data click the ‘Import TLE button’ and locate the text file containing the elements.
You will be presented with a list of all satellites in the file, which may look something like the following
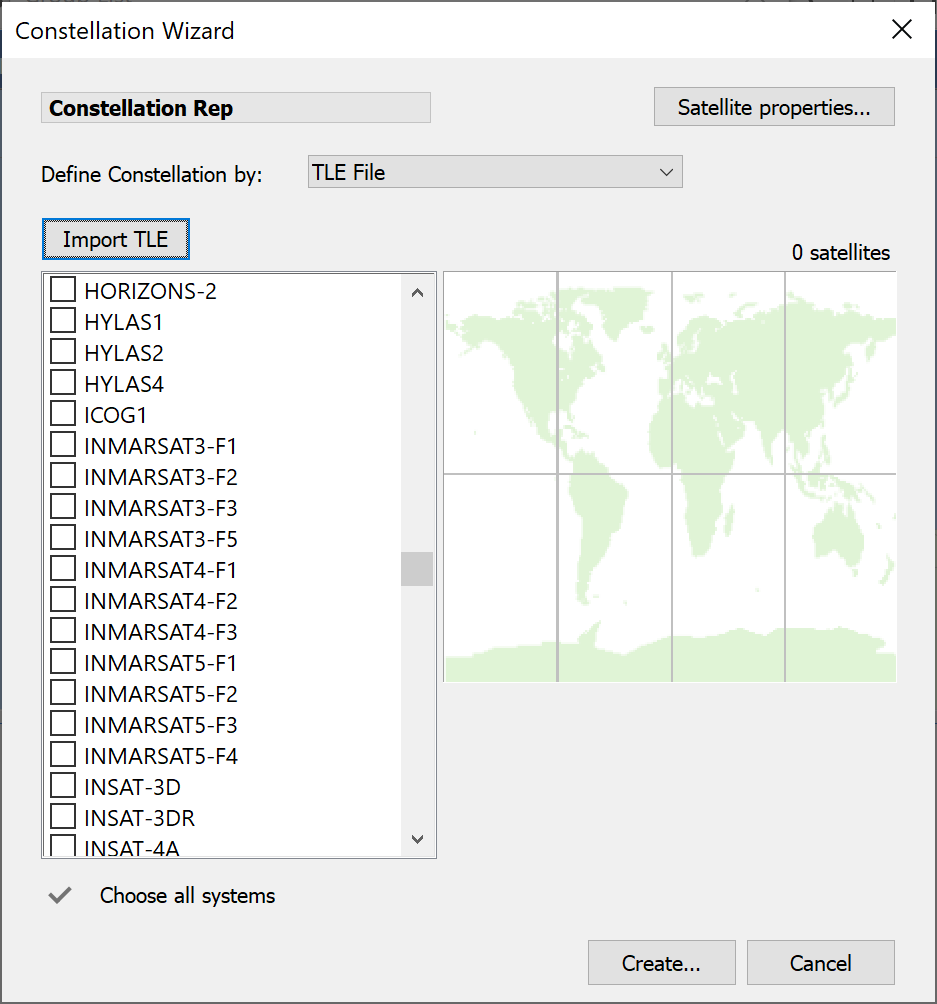
You must either select each satellite you want to import individually or click ‘Choose all systems’. When you have made you choice, a preview will appear and when you are ready to go, click the Create button bottom right of the dialog..
Template Satellite Parameters
As well as Constellation parameters, you will need to define the satellite parameters that will be used for each satellite (you define one set of parameters and all satellites are identical on creation).
To define your template satellite, click on the ‘Satellite Properties’ button. This will bring up the non-GSO Satellite dialog. The orbit tab can be ignored, as this will be over-ridden by the constellation dynamics.
Set up the Antenna for your template satellite and the Wizard will create a constellation of identical satellites for you.
Service Area Wizard
Service Area analysis, looking at detailed results over a wide area, can be performed by distributing test point Stations over an extended area and setting up Links to each Station. Useful information about service levels can then be obtained by analysing the Links to find ‘worst cases’ (see Link Groups for more details).
The Service Area Wizard has three pages. The first page is the Template Station page (shown below).
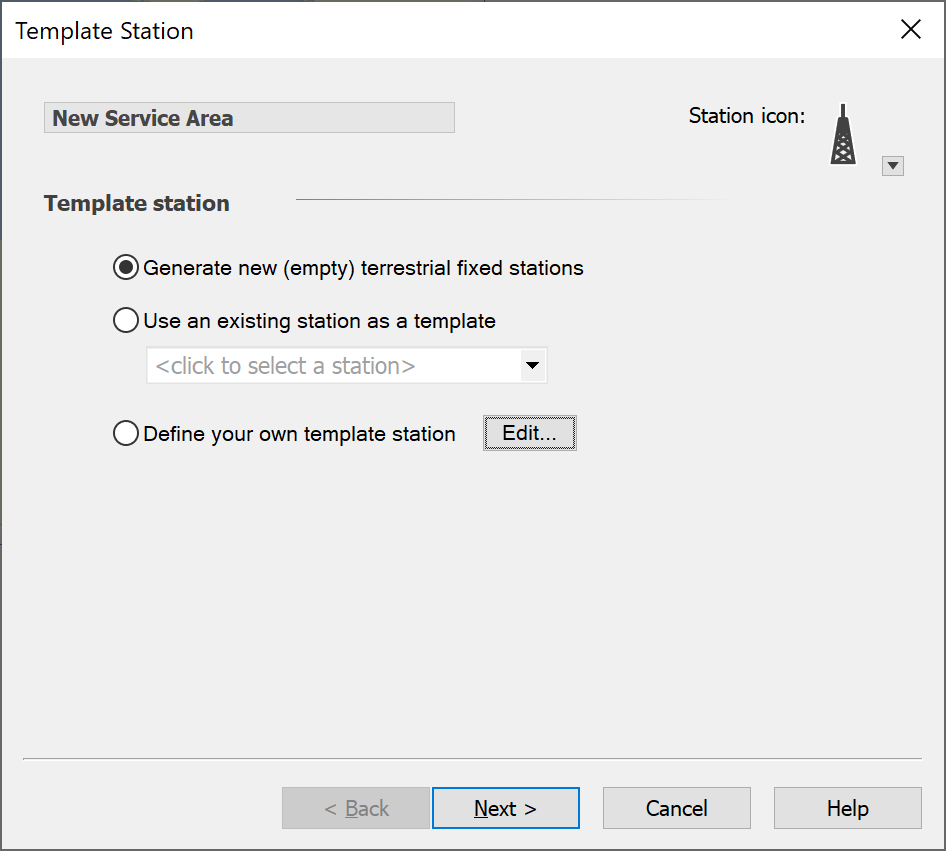
You can set the name of the Service Area Group in the top-left of the dialog. The station icon can also be changed.
The other options allow you to say which station will be replicated across the service area. The choices are:
- To generate new stations
- Use an existing Station as a template – you will then need to select the Station to use from the list box
- Define a new template Station: pressing the Edit button allows you to define the new station which will be used as the template
Having made the selection and defined your template Station, click Next to move on to the Service Area page. From here you can define the extent of your service area.
There are five ways you can define your service area:
- As a rectangular region
- By reference to a particular Beam footprint
- Using a Country border derived from the IDWM database
- Based on a series of discrete points defined in a text file
- Using a hexagonal deployment
Service Area Defined by Region
If you want to define it by a rectangular region, select the Region option. This is the default and is shown below.
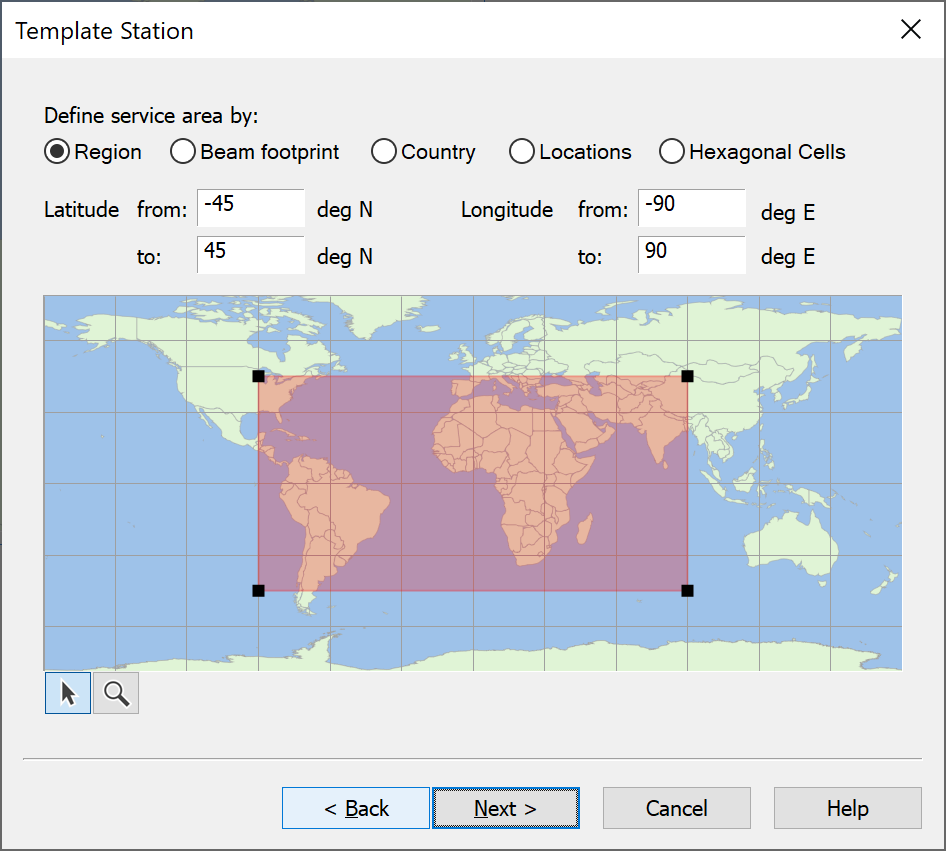
The extent of the area is shown, and you can edit the latitude and longitude of the corners directly at the top of the dialog. The area is also shown on the map as a shaded red border. You can resize and move this border to change the size of the service area.
You can zoom into the map by clicking the magnifying glass. This puts you into zoom mode. When you pass the mouse over the map the pointer will change to a magnifying glass - left-click to zoom in and right-click to zoom out. You can move around by dragging the map as you move around on the Plate Carrée or Mercator views.
When you have selected the geographic extent of your area you then need to decide whether to fill the area or populate its edges. If the former, then it is necessary to specify:
- How many stations will fill it.
- How will those stations be deployed.
You must choose between three methods for defining your grid:
- Stations: in that case you simply say how many columns of stations there will be (‘North’) and how many rows (‘East’). Visualyse will create a rectangular grid based on this input
- Grid: this also creates a rectangular grid, but this time based on the spacing of stations N-S and E-W.
- Hexagon: in this case the grid is in a hexagonal not rectangular pattern, again based upon spacing of stations N-S and E-W.
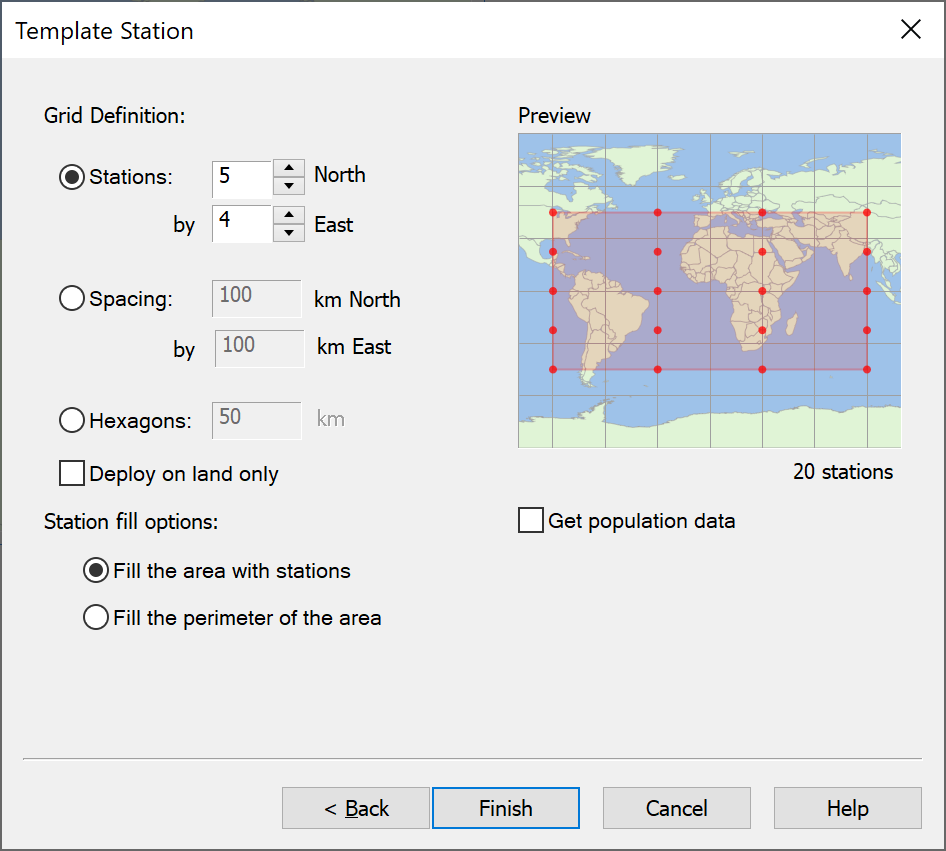
If rather than filling the area you want to fill the perimeter you must defined the spacing between Stations.
If “Get population data” is selected, then each of the Stations created will have their “Maximum load” field set from the population database. The population will be that calculated to be in a tile defined using the number of stations North/East or spacing in km North/East. Note that this option is not available when deploying stations in hexagons or with the fill the perimeter option. This requires the population data directory be set as in Population Data Settings
The preview window shows where stations will be located on a map. This is automatically updated whenever you change any of the parameters.
Service Area Defined by Beam
The second way of specifying an area is by a beam footprint. To do this, select the Beam Footprint option.
Select the satellite, antenna and beam you want to use, as shown in the figure below.
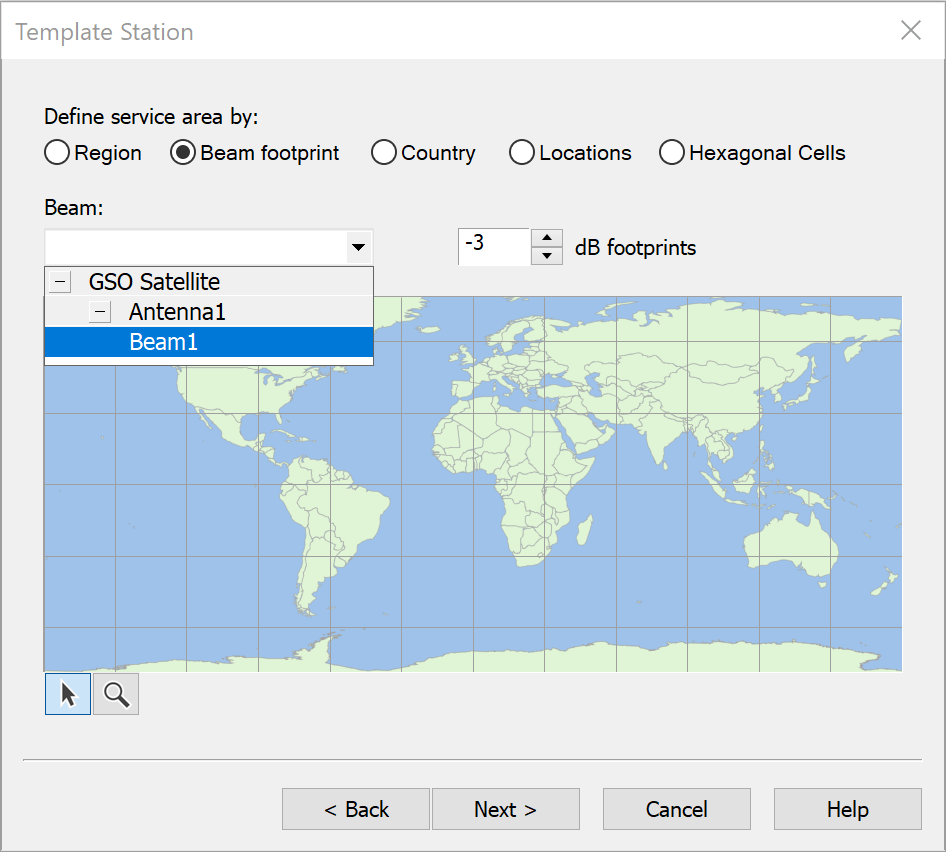
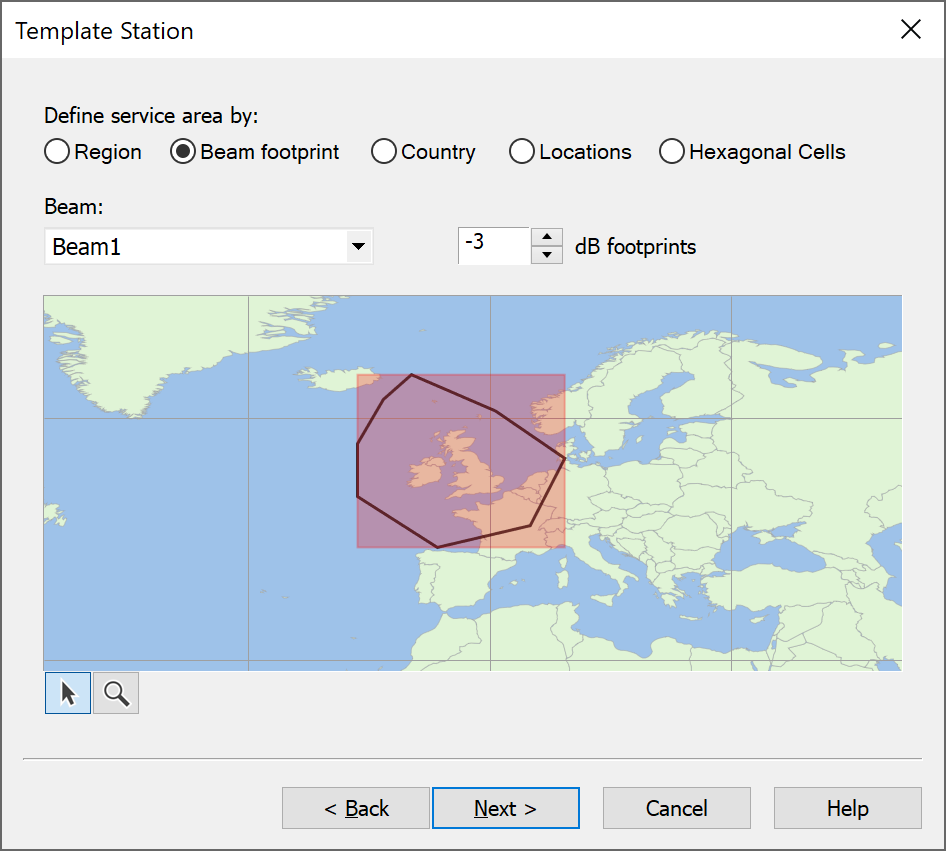
As with the region option, you can zoom into the map if you need to.
When you are happy with your service area, click Next. This will take you to the Station Deployment page. From here you decide how stations will be arranged in the service area.
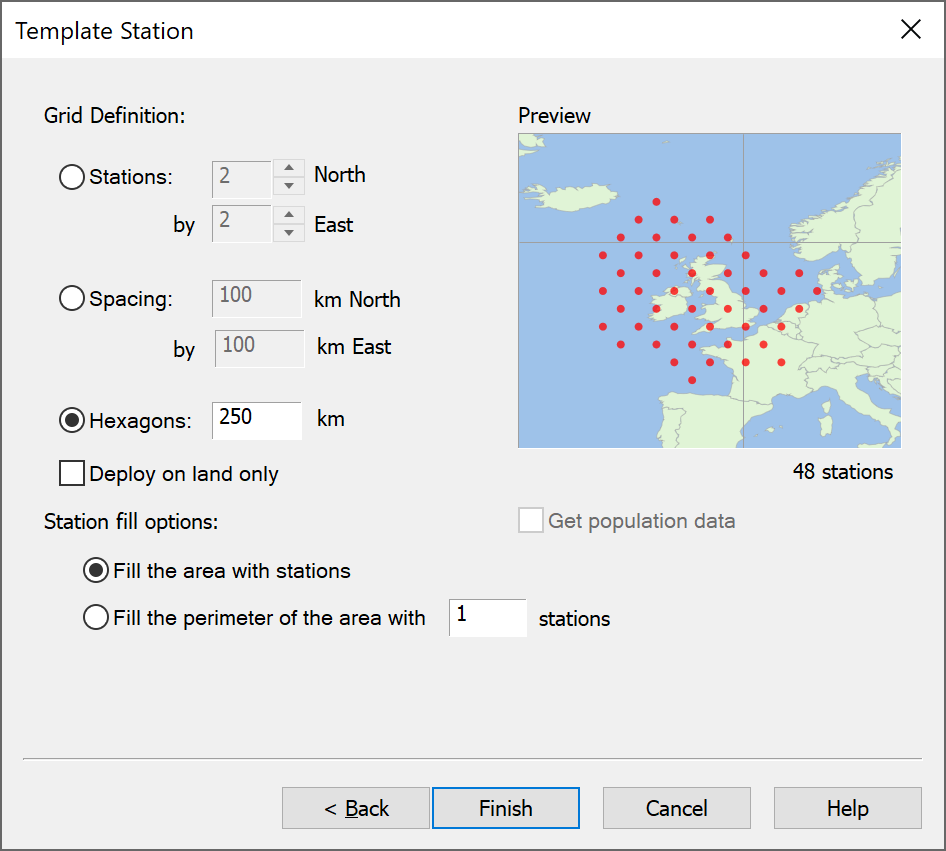
There fill options are the same as for the region option described above.
Service Area Defined by Country
The next way of specifying an area is by using a country’s border. To do this, select the “Country” option and then from the drop-down list select the one of interest, as in the figure below:
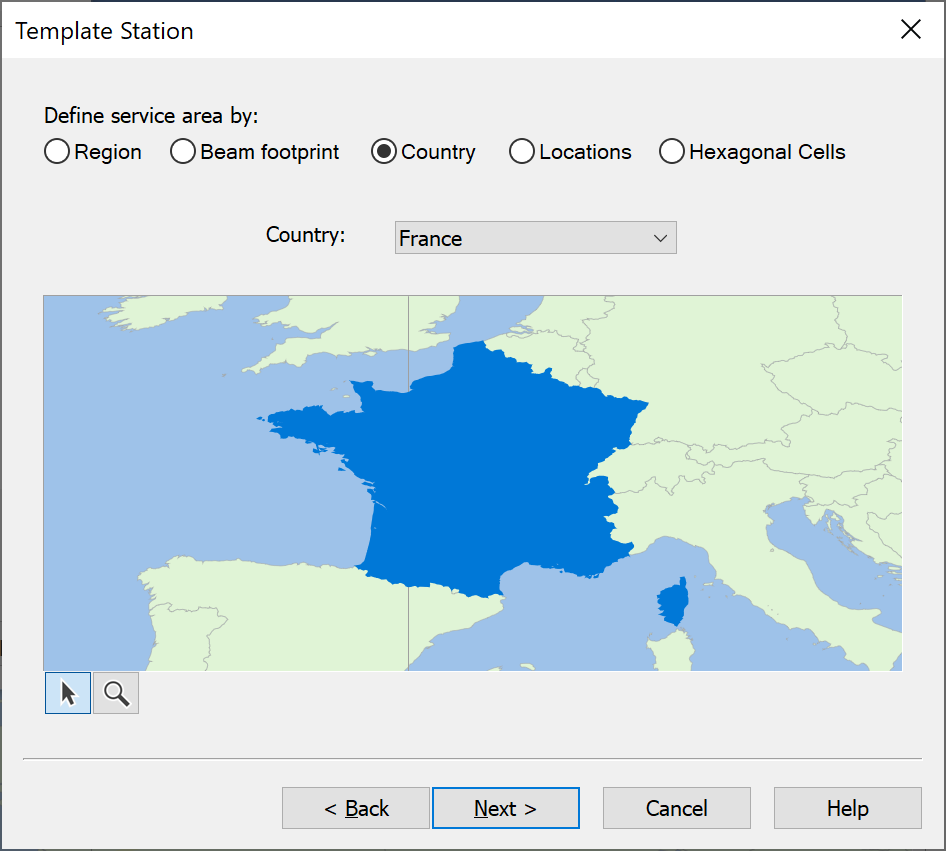
Having done the selected country will be highlighted in the preview which you can configure using the standard zoom and map move options.
If you click on next you will be able to use the standard Service Area Wizard controls to either populate either the country’s area or border with Stations.
An example of the fill border options is shown in the figure below.
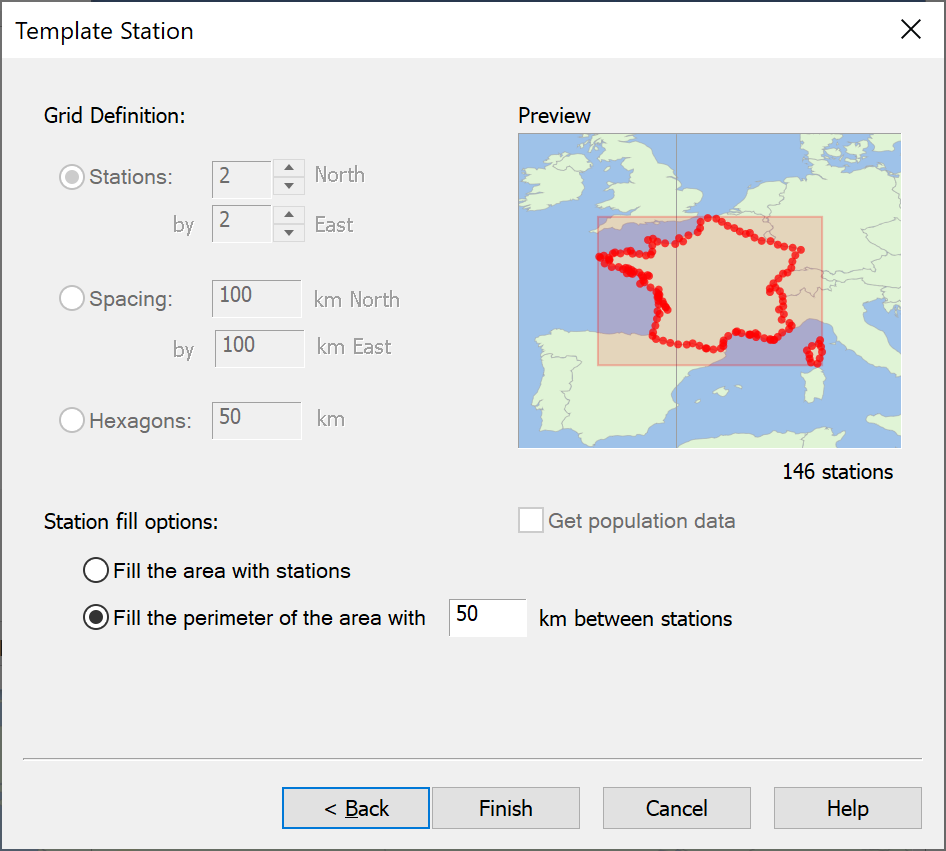
Service Area Defined by Locations
The next way of specifying an area is by using a text file to specify the (latitude, longitudes) of each station. To do this, select the “Location” option and then the file that contains the data, as in the figure below.
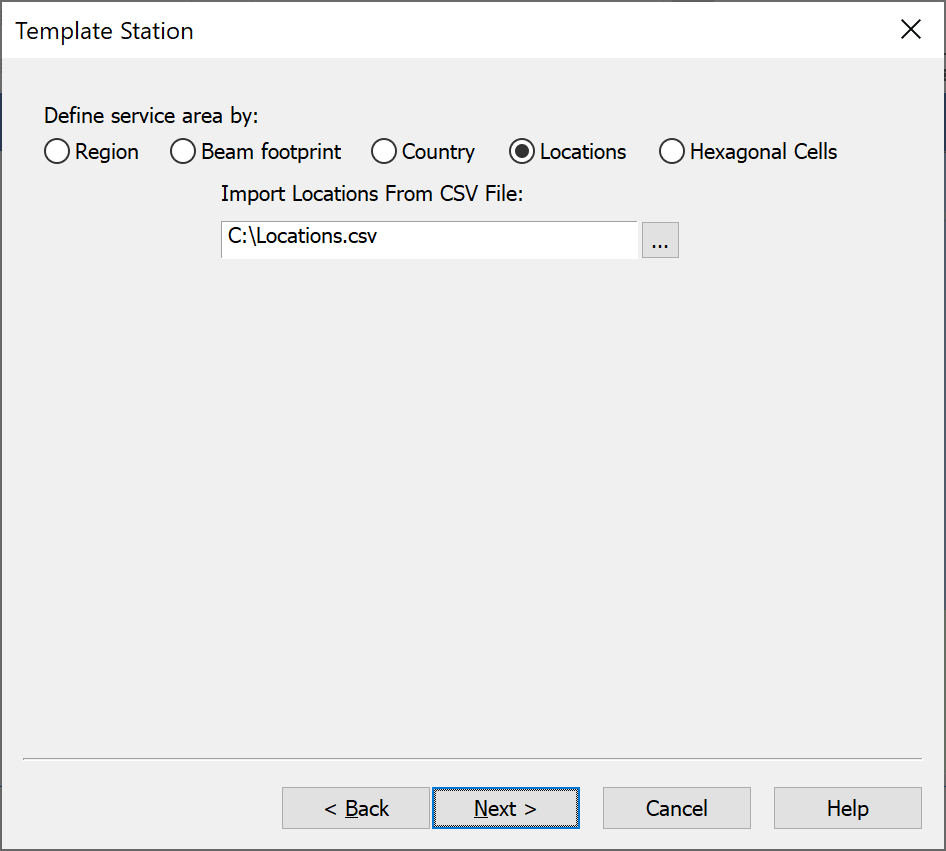
Having selected the appropriate file you can click next, and the wizard will display the latitude ad longitudes read in together with a preview on a map as in the figure below.

Service Area Defined by Hexagons
The final way to define the service area is through a deployment of stations in hexagonal pattern. To do this, select the “Hexagons” option and you will be prompted for the central latitude and longitude, e.g.
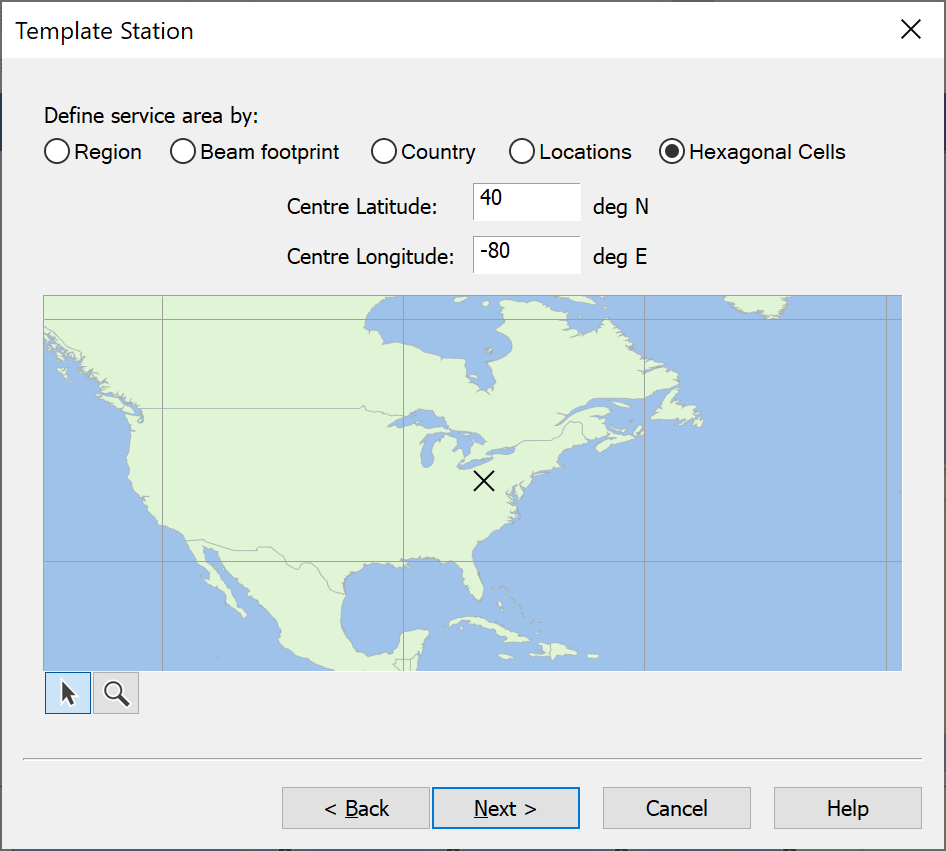
Again, the standard map zoom and pan controls can be used. If you click on “Next” you can then define the hexagonal pattern to use based upon rings or grid, as in the figures below.
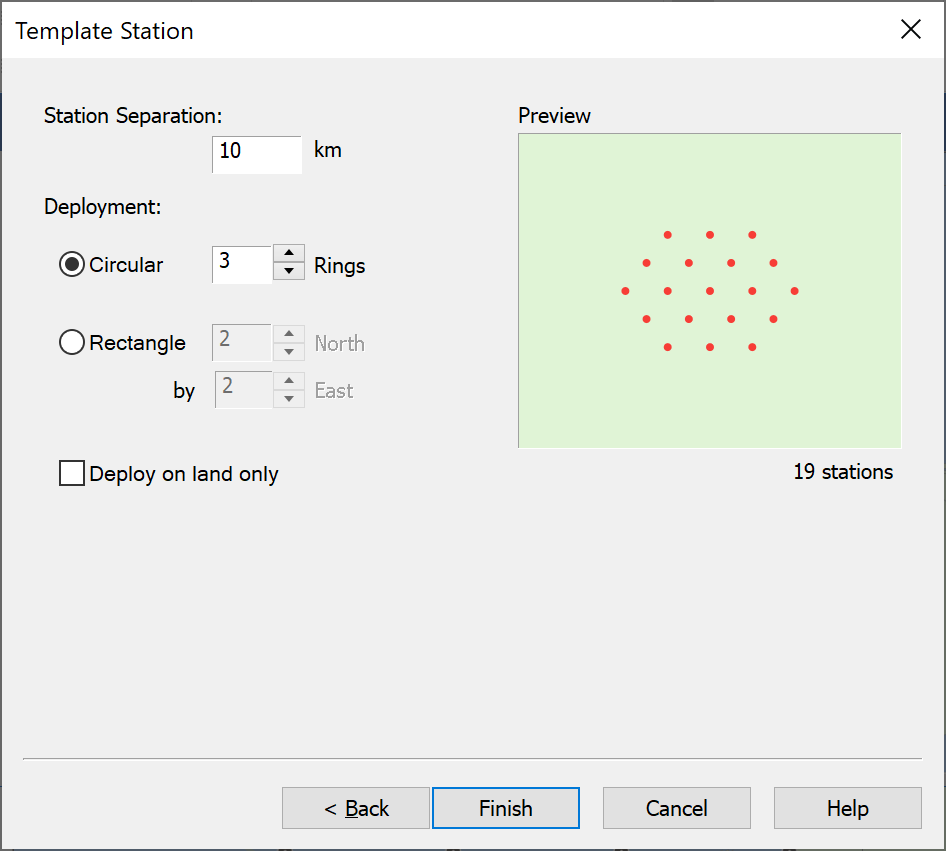
A key field to both is the separation distance between Stations.
HEO Wizard
The Visualyse HEO Wizard helps you define repeating ground track HEO constellations with varying numbers of ground track, orbit period and numbers of satellites per track.
The orbits that Visualyse defines are also sometimes referred to as QuasiGEO, Molniya or Tundra orbits.
Each satellite is, as usual, based on a single template station.
The HEO Wizard Dialog is shown below:
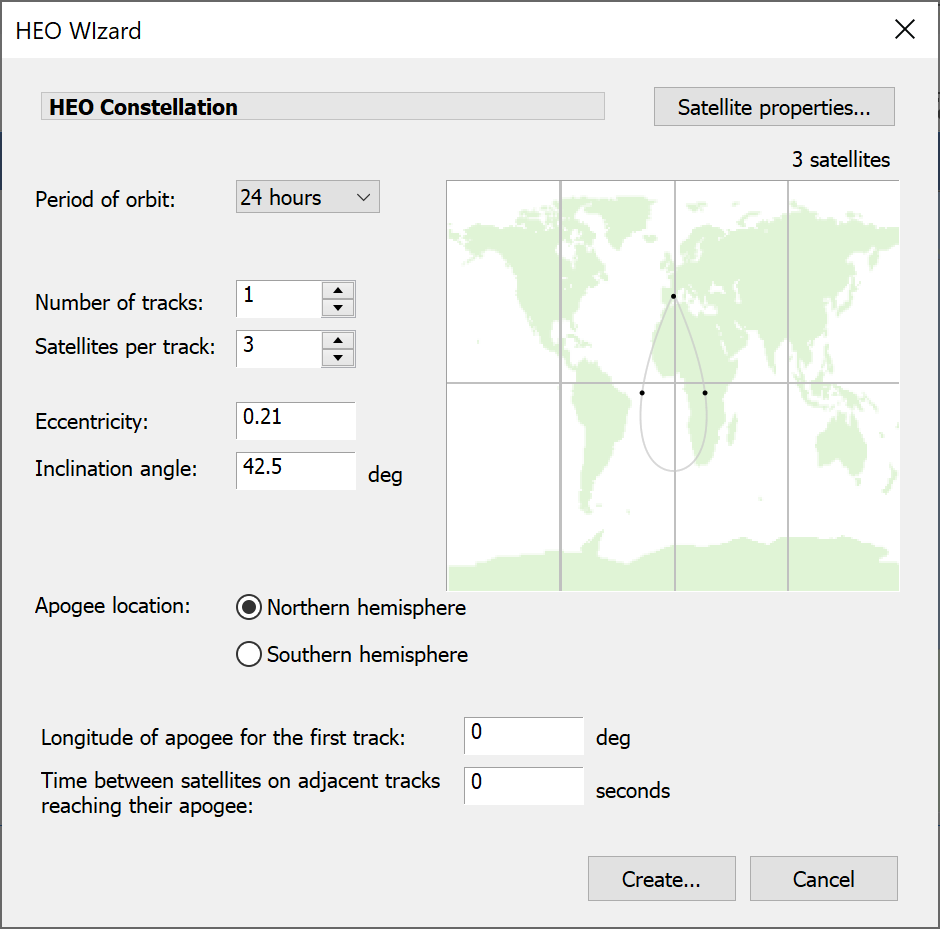
The parameters that are used to define the HEO constellation are:
- The period of the orbit
- The number of distinct ground track s
- The number of satellites per track
- The eccentricity of the orbit
- The orbital inclination angle
- The apogee location – the highest point of the orbit. The satellites move more slowly at higher altitude and so the apogee point is the location where they are often said to be QuasiGSO. For a system that will provide service to the Northern Hemisphere the apogee would be in the north.
- The longitude of the apogee of the first track – this defines the point on the earth above which the apogee will occur
- Time between satellites on adjacent track reaching their apogee. This parameter determines whether, in a multi-track system, satellites on adjacent plane are interleaved or whether they are at the same relative points in their orbits at the same time.
Having defined all these parameters Visualyse will create satellites with orbital elements that produce a single ground track for each plane – these elements are consistent with the point mass orbit propagation model.
Editing Groups
On the Model menu, select Station Groups. Select the Station Group you want to edit and click Edit. The Modify Group dialog (shown below) will be displayed.
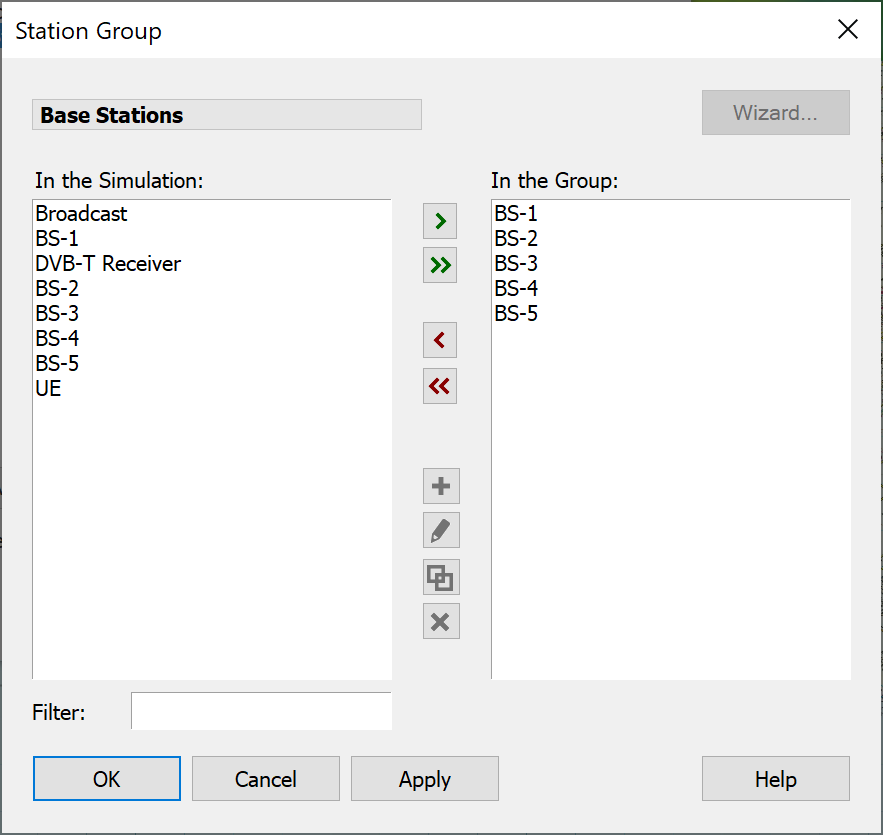
The dialog contains two lists - the Station List and a list of Stations in the currently selected Group. Options from this dialog are as follows:
- Add - creates a new Station
- Wizard - run the wizard (for groups created by a wizard)
- Include - includes a Station from the Station List on the left in the Group
- Edit - edits the selected Station
- Duplicate - makes a new Station which is an exact copy of the selected Station
- Remove - removes the selected Station from the group
- Delete - deletes the selected Station from the simulation
- Filter – filters the Station List on the left
Re-running Station Group Wizards
In most circumstances you can re-run a Station Wizard to modify the parameters of the Station Group. However, usually there are knock-on effects to other parts of the simulation, and you need to be aware of these.
The first thing that the Wizard does, if you re-run it, is to delete all the Stations currently in the Group. If you have already included those Stations in Link objects, then those Link objects will be affected and will need to be repaired.
In many cases, you will have Linked the Stations up using a Link Group Wizard, and you will be able to re-run the Link Group Wizard to fix up the Links.
Importing GSO and Non-GSO Satellite System
The first two options will allow you to import station information from the SRS database.
You need to have a compatible installation of the SRS and the GIMS database – Refdb.
To use the Import GSO facility you need to define the location of the SRS database.
Clicking the Import GSO button  or selecting Import GSO from the Model Menu, opens the GSO Systems Chooser dialog – the first part of which is shown below. If this is the first time you have used this feature you will need to click on the button ‘Click here to select a data source’.
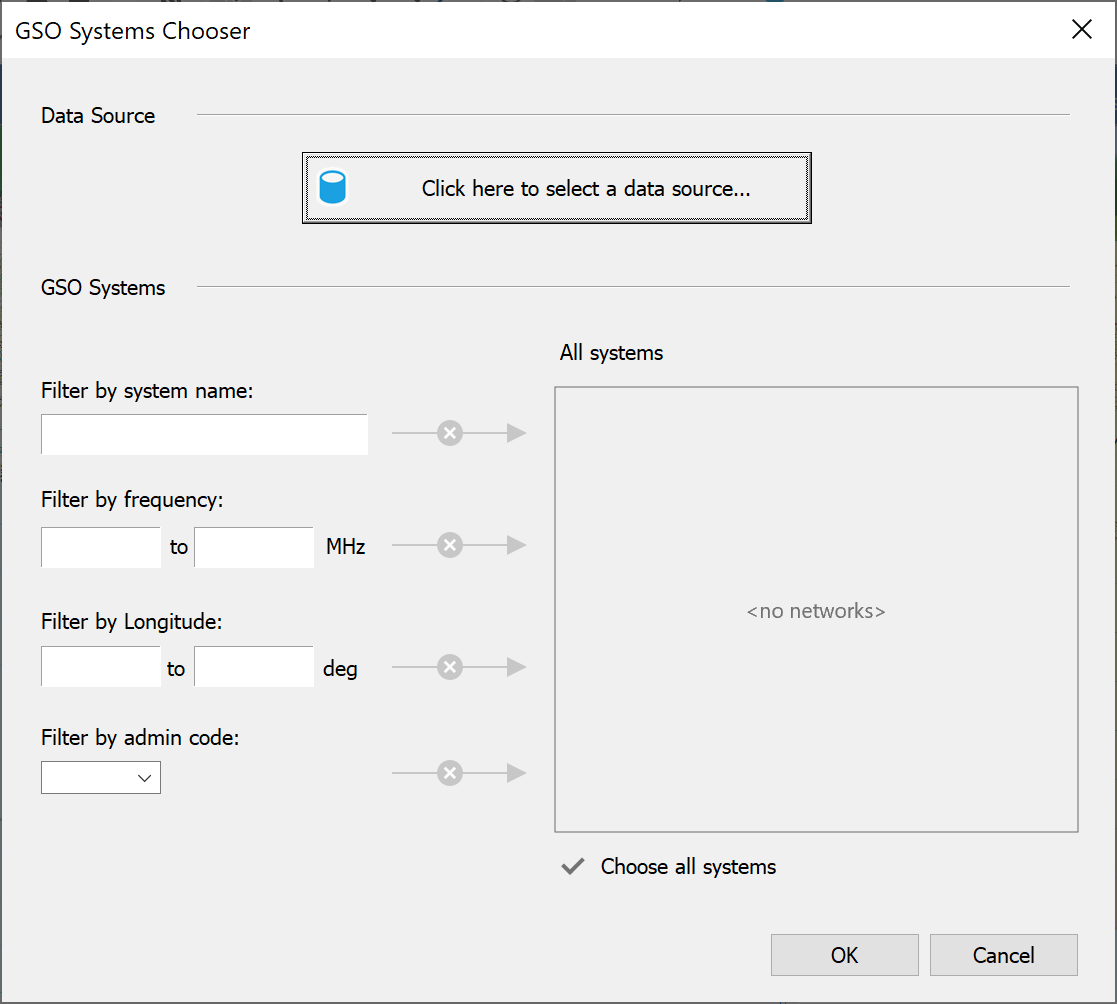
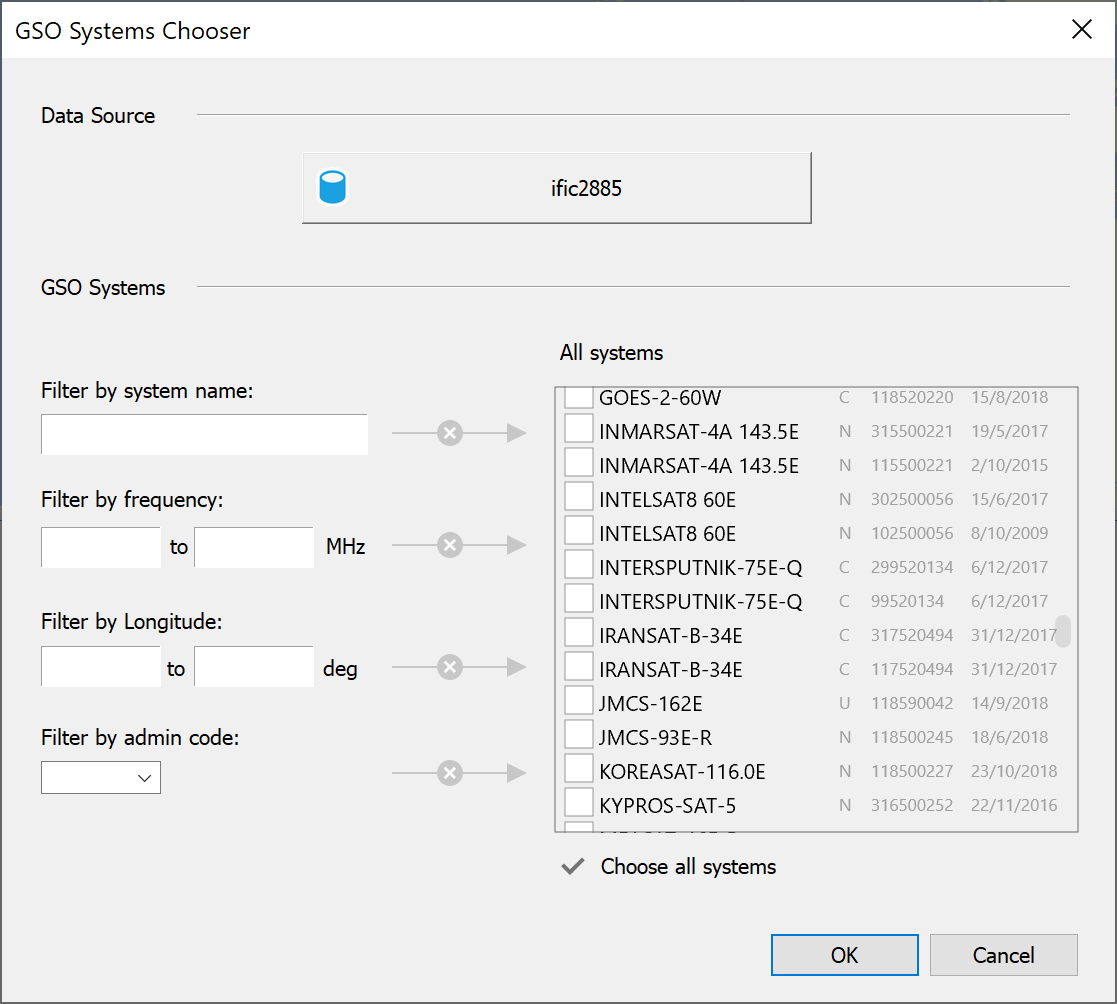
Once the database is loaded, the list of available stations will be populated.
You can apply a number of filters to the list:
- Filter by name
- Filter by frequency – show only networks with notified frequencies in the range specified
- Filter by longitude – show only networks with the specified longitude range
- Filter by Admin code – show only networks of a selected administration.
The network list will be adjusted according to the filters you set, and you can then select the network(s) you wish to import.
Some networks are shown in grey and some in black. Grey networks are API notices and have no antenna data associated. In these cases, the import will only give you an empty GSO Station object.
For networks in black bold text, Visualyse will retrieve all the antenna data from the GIMS database and create a Station object and an Antenna object representing each network.
For non-GSO systems, the process runs along similar lines. Clicking the Import non-GSO button  or selecting Import non-GSO from the Model Menu, opens the non-GSO Systems Chooser dialog
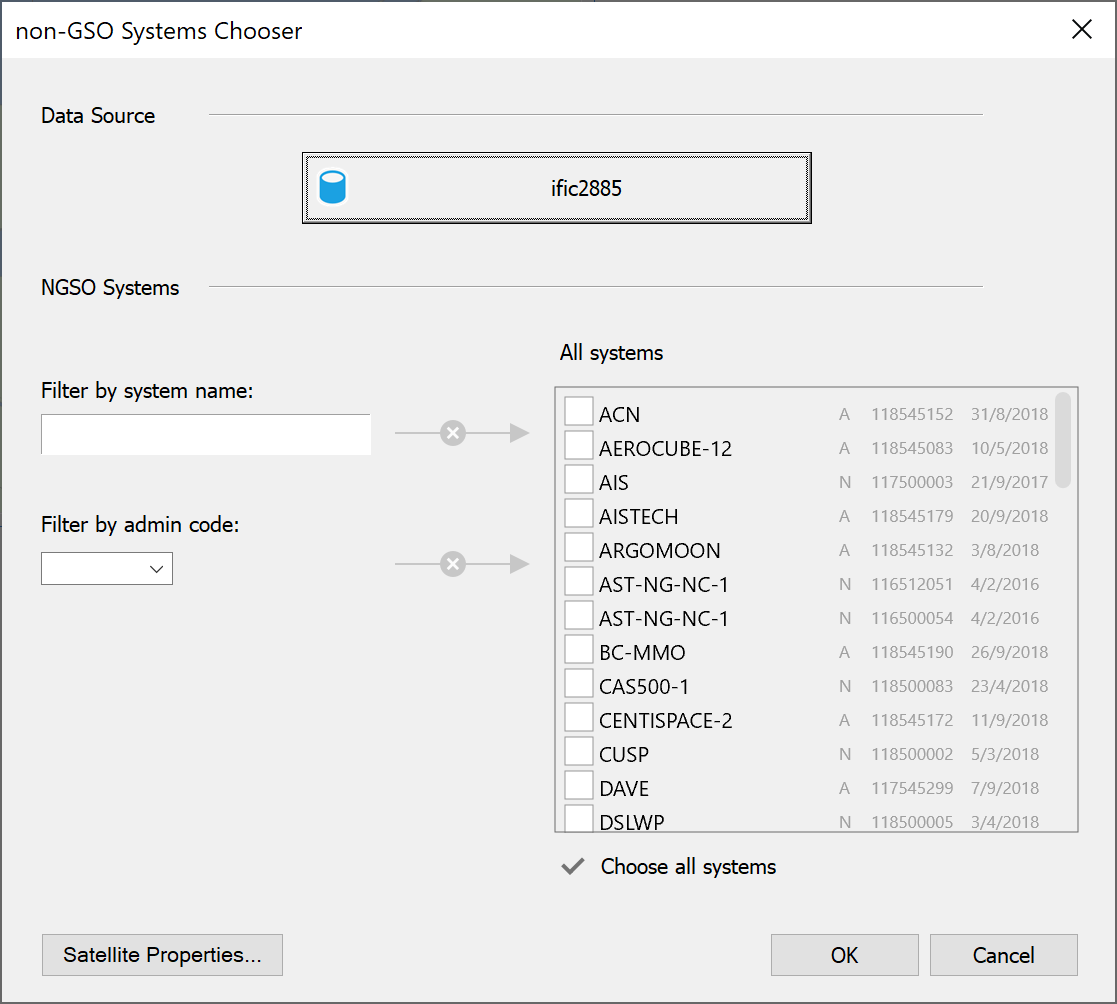
The filters are simpler because the longitude filter does not apply but you can filter by name and admin.
To define your template satellite, click on the ‘Satellite Properties’ button. This will bring up the non-GSO Satellite dialog. The orbit tab can be ignored, as this will be over-ridden by the constellation dynamics.
Set up the Antenna for your template satellite and the Wizard will create a constellation of identical satellites for you.
When you import a non-GSO system you get a Station Group that represents the constellation in the filing.
Import FS Systems
You can import large numbers of fixed service microwave links using the FS import facility.
Choose Import FS Systems from the Model menu to access this function of the software. Systems can be imported from text file. You can copy and paste data from other applications or enter the data directly into the software.
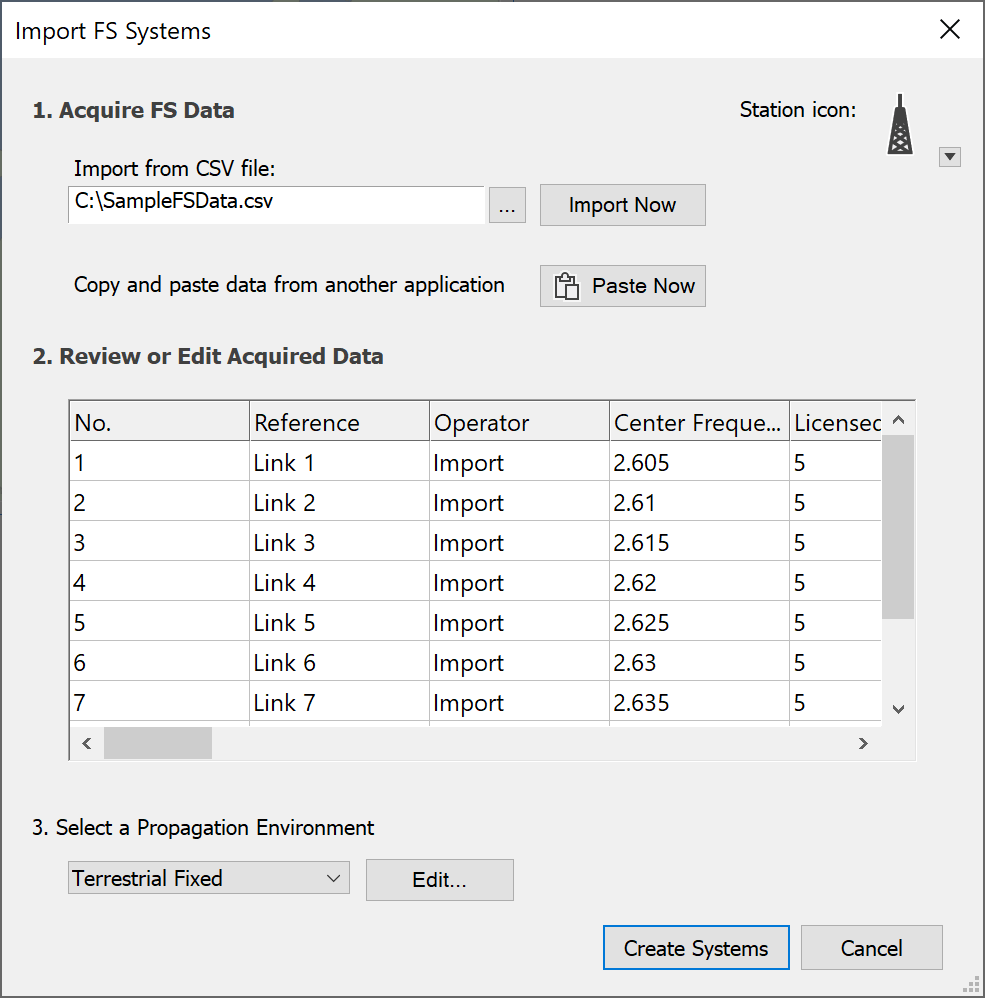
The figure above shows you the format required – full details are given in the Technical Annex.
Once your preview data seems to be correct, click the ‘Create Systems’ button and Visualyse creates multiple Station and Link objects which it places in Station and Link Groups.
Import from the Terrestrial IFIC
This feature interfaces directly to any database that has the structure of the Terrestrial IFIC.
Selecting the Import Terrestrial IFIC from the Model menu or clicking the terrestrial IFIC icon, starts up the dialog.
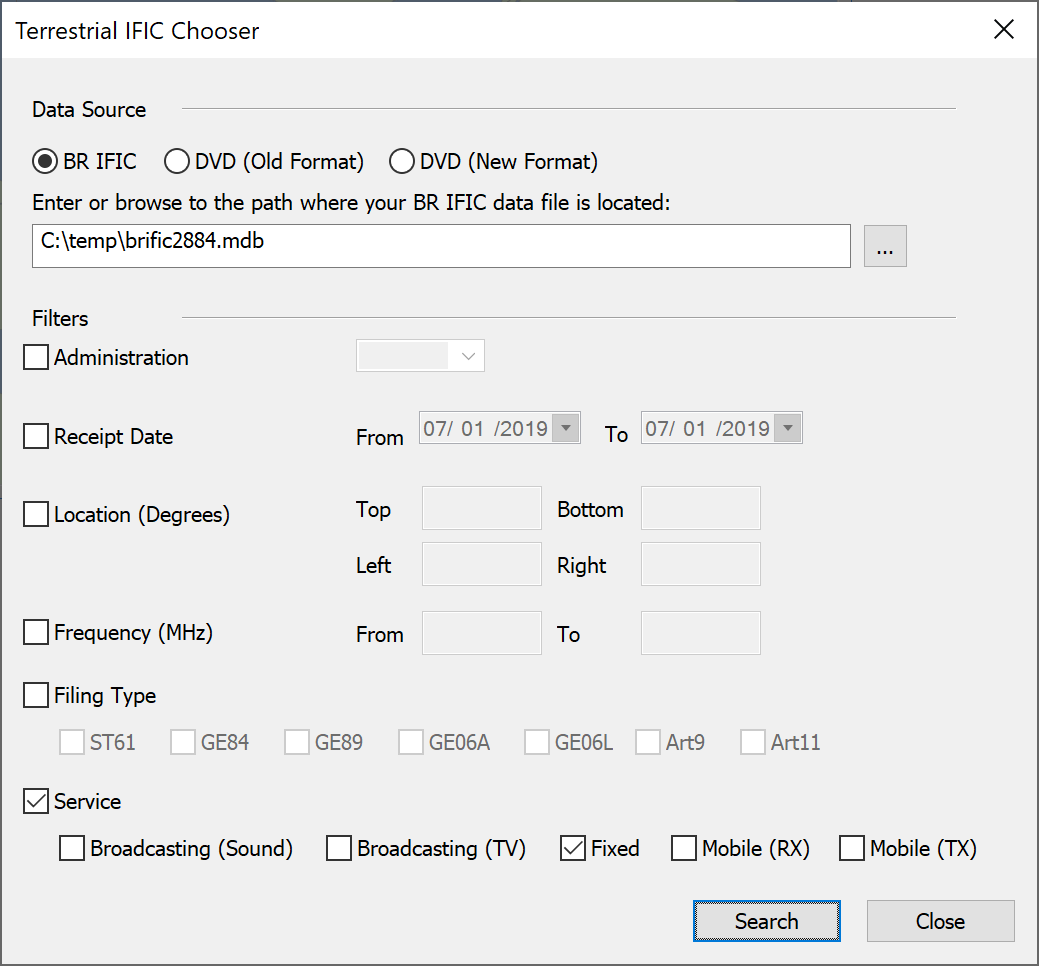
As for the other Import options, the first step is to define the location of your database. The database can be either a single .MDB file downloaded from the ITU website (BR IFIC option) or the collection of database files found on the Terrestrial IFIC DVD (DVD option).
Once this is defined there are number of filter options, which can be applied in combination:
-
Administration - import only filings from the specified administration
-
Receipt date - set a range of ‘receipt dates’ and only import systems filed within that range
-
Location - defined a box by latitude and longitude extremes and only import systems within that area
-
Filing type - import only systems of one or more given filing types
-
Service - import only systems of one or more given service types
Having selected the search criteria and clicked on “Search”, Visualyse Professional will search the Terrestrial IFIC for filings that meet the criteria.
Note that searches with very wide criteria can take a long time to complete – it is recommended to use filtering where ever feasible.
Having searched the IFIC, Visualyse Professional will count the number of records and display them in a dialog similar to this:
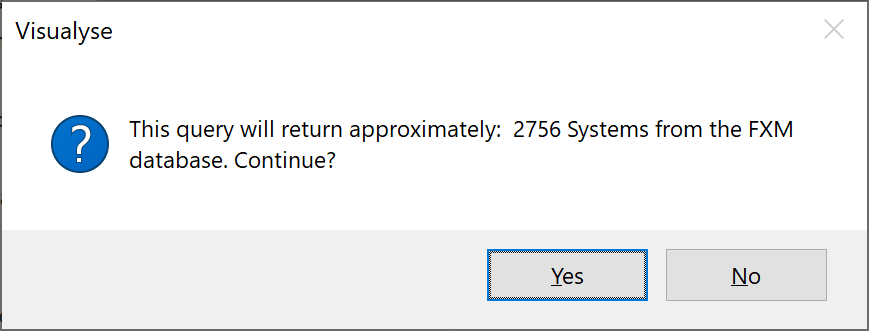
This stage allows you to assess if the number returned is as expected – for example the criteria might too stringent and no systems were found or too wide so that thousands of systems would be imported.
If you are happy with the results click on “Yes” and then Visualyse Professional will load a list of the systems that can then be selected. In addition it checks for duplicate filings – those that have the same parameters apart from one field that Visualyse Professional would not use. For example the same system could be filed for two different reasons, but only one record would be returned.
This list would look something like this:
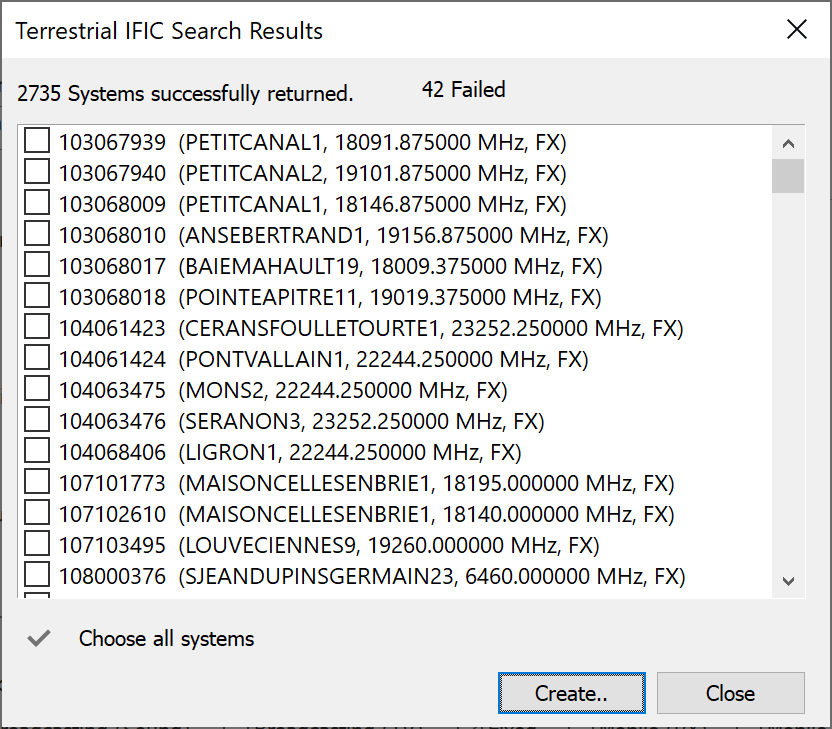
Sometimes the software is unable to load a system due to missing data. Clicking on the “xx Failed” text shows a dialog detailing why the systems failed to load the system.
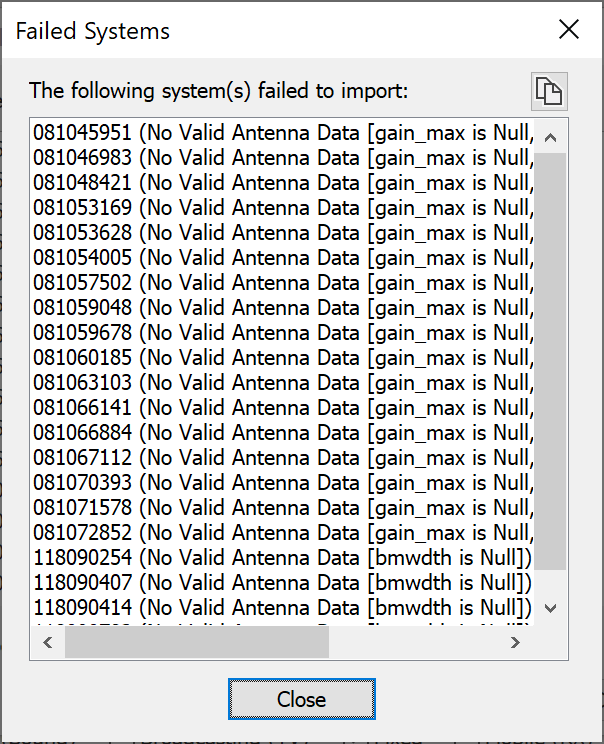
You can then select all systems or a sub-set of the systems to import into Visualyse Professional.
The Terrestrial IFIC import reads the database and populates the following objects:
- Antennas
- Stations
- Carriers
- Links
The figure below shows an example import and the model view is open to show all the objects created.
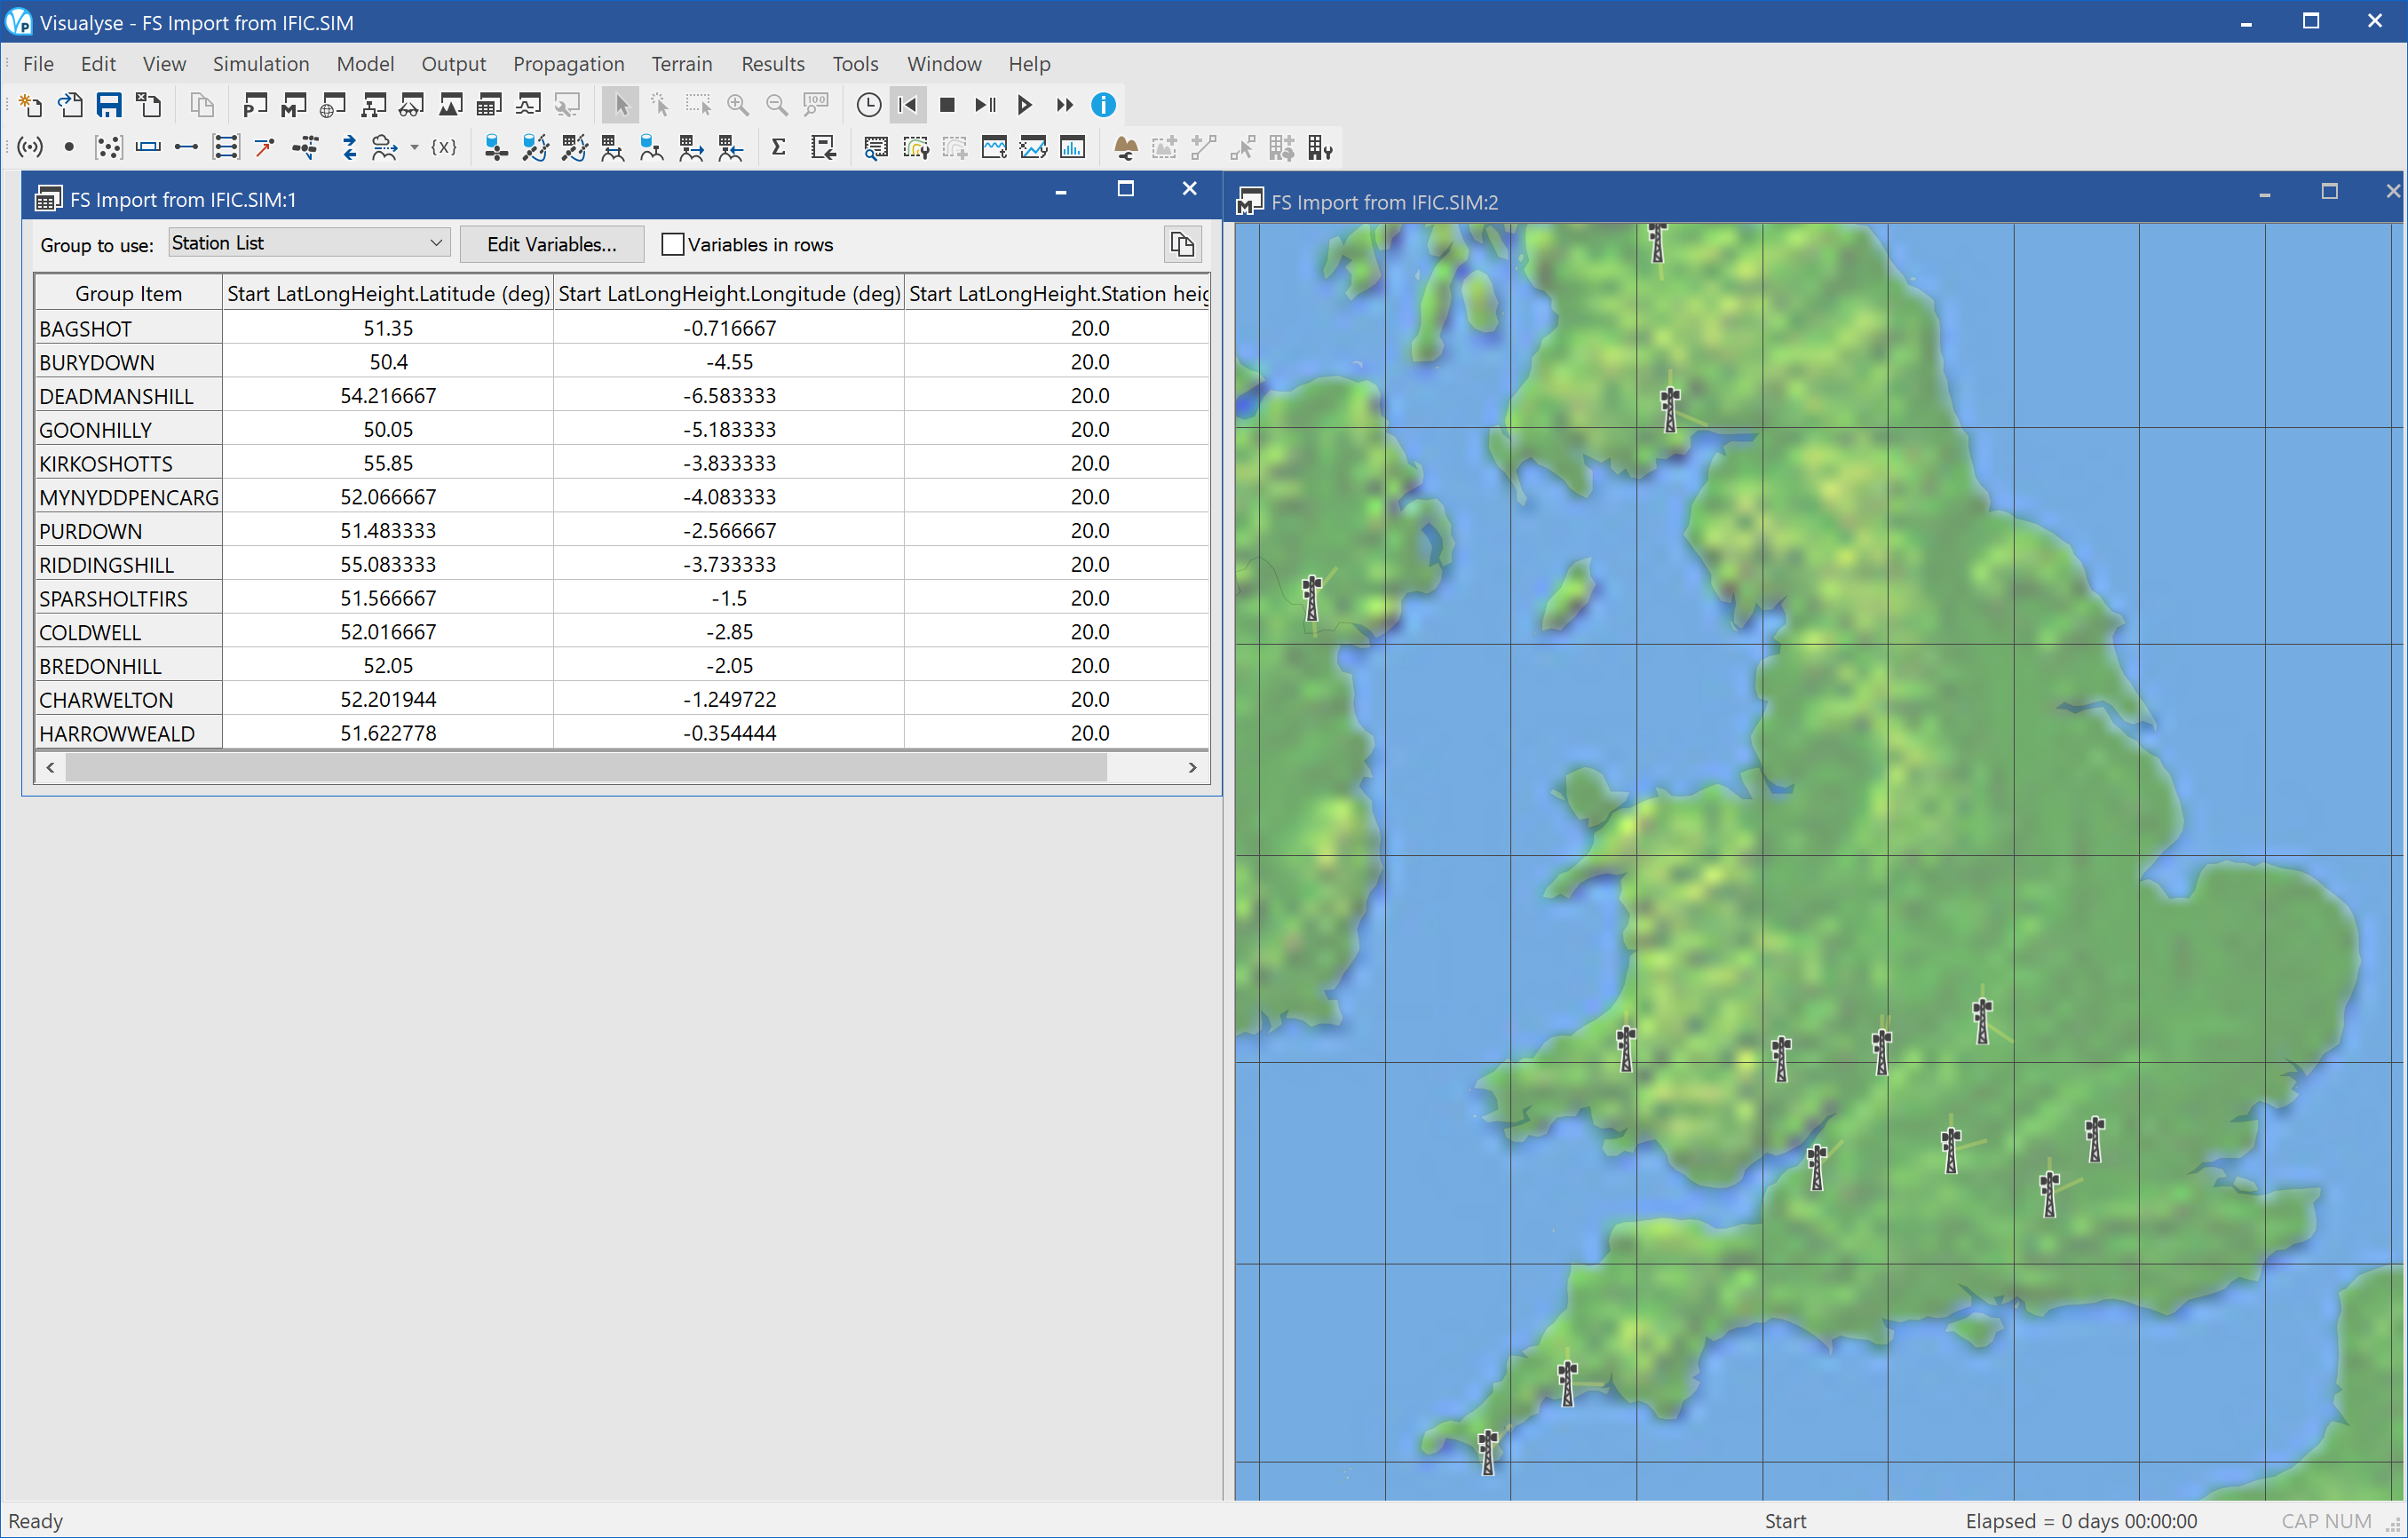
Tip: It is worth checking the data returned as there can be fields not defined. For example, in this example two of the stations had antenna height of zero metres – only one had a valid height.
Import Tx Systems
You can import large numbers of Transmit links using the Import Tx Systems facility.
Choose Import Tx Systems from the Model menu to access this function of the software. Systems can be imported from text file. You can copy and paste data from other applications or enter the data directly into the software.
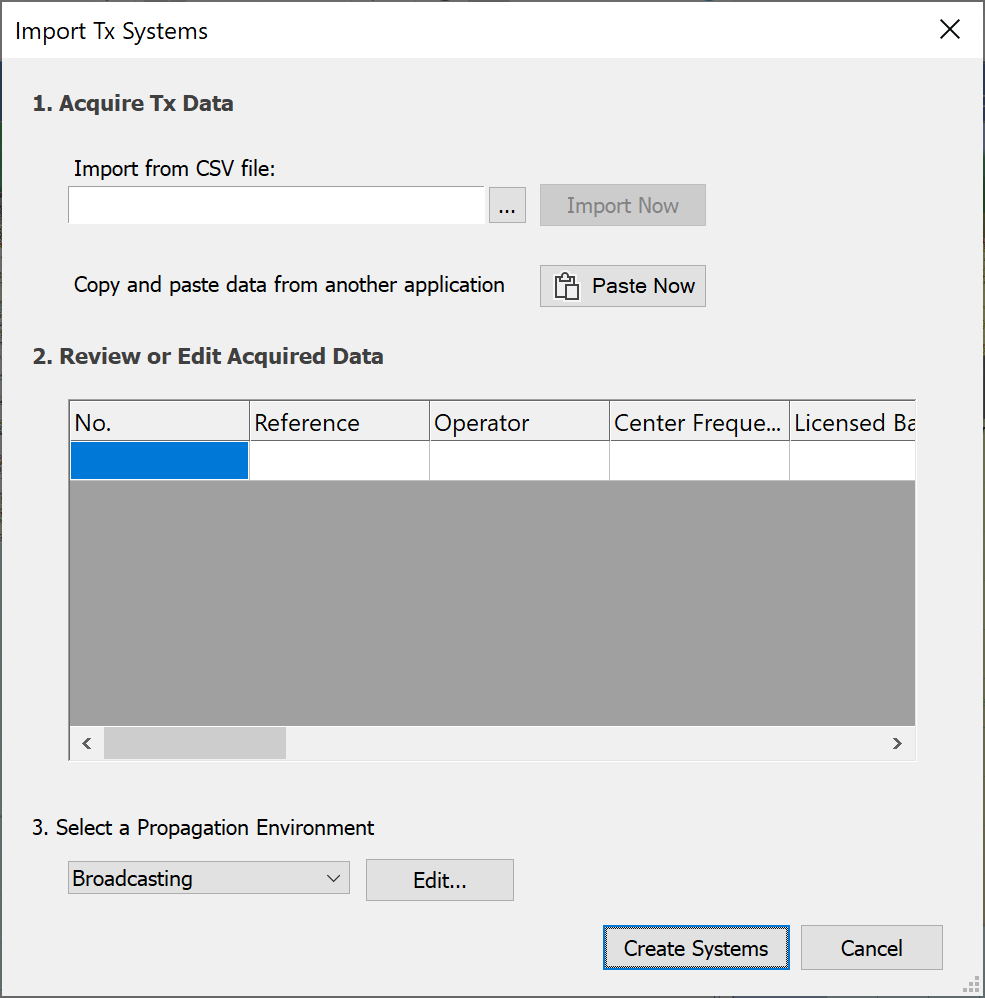
The figure above shows you the format required – full details are given in the Technical Annex.
Once your preview data seems to be correct, click the ‘Create Systems’ button and Visualyse creates multiple Station and Link objects which it places in Station and Link Groups.
Import Rx Systems
You can import large numbers of Receive links using the Import Rx Systems facility.
Choose Import Rx Systems from the Model menu to access this function of the software. Systems can be imported from text file. You can copy and paste data from other applications or enter the data directly into the software.
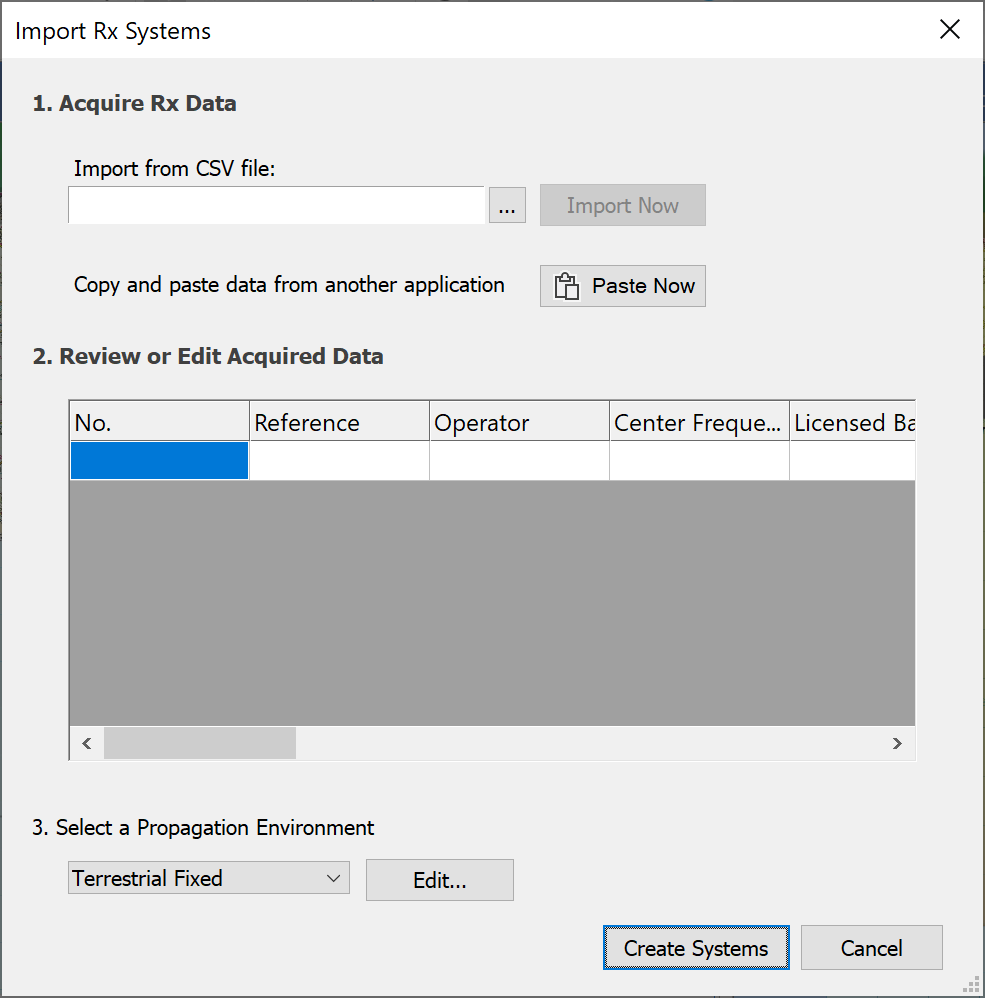
The figure above shows you the format required – full details are given in the Technical Annex.
Once your preview data seems to be correct, click the ‘Create Systems’ button and Visualyse creates multiple Station and Link objects which it places in Station and Link Groups.
Import Non-GSO Orbit Elements
You can import large numbers of Non-GSO satellites using the Import Non-GSO Orbit Elements facility.
Choose Import Non-GSO Orbit Elements from the Model menu to access this function of the software. Systems can be imported from text file. You can copy and paste data from other applications or enter the data directly into the software.
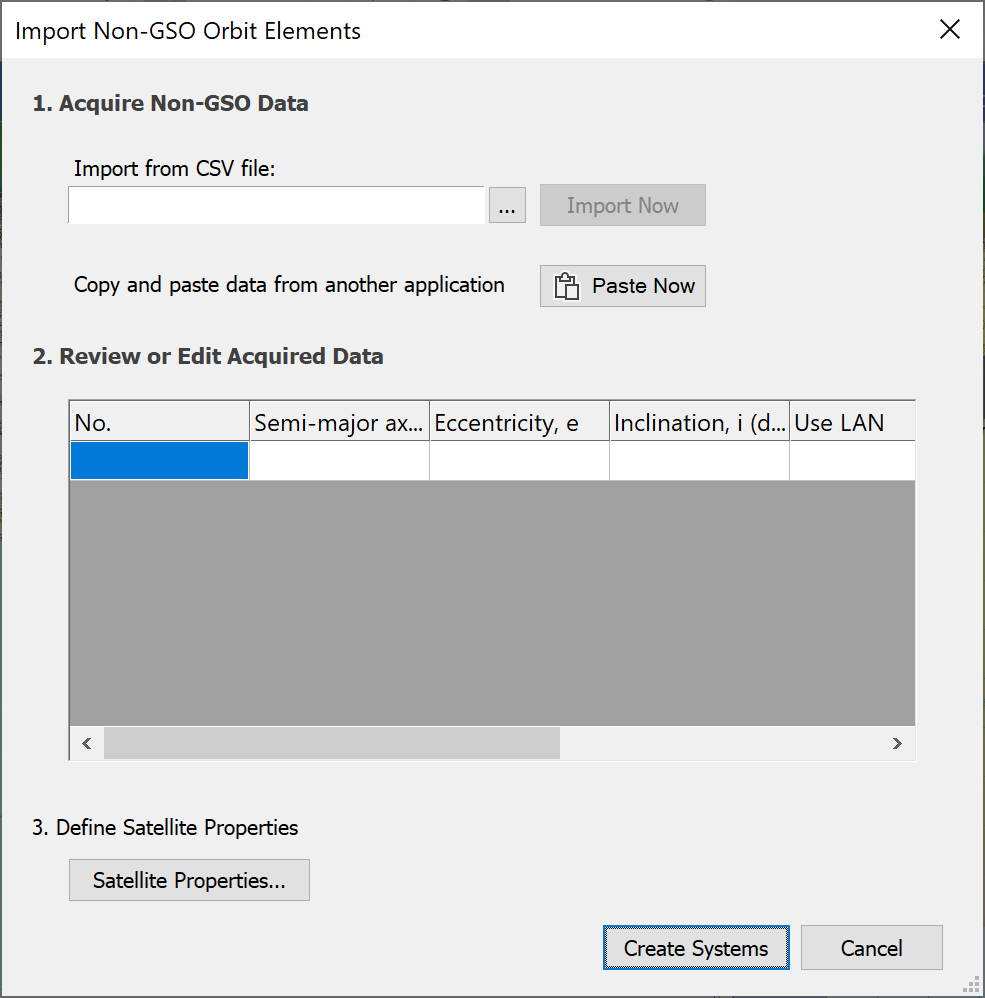
The figure above shows you the format required – full details are given in the Technical Annex.
Once your preview data seems to be correct, click the ‘Create Systems’ button and Visualyse creates multiple Station objects which it places in a Station Group.# Import Non-GSO Orbit Elements
Carriers
This section describes how carriers are modelled and defined in Visualyse.
Carriers are where you define bandwidths, polarisation, and other characteristics of the signal spectrum together with some aspects of the signal structure.
Things which are addressed in the carrier dialog are:
- Allocated bandwidth
- Occupied bandwidth
- Polarisation
- Receive and transmit masks
- Digital/analogue modulation
- Is the carrier a radar carrier
- Radar carrier parameters
The edit Carrier dialog is shown in the figure below.
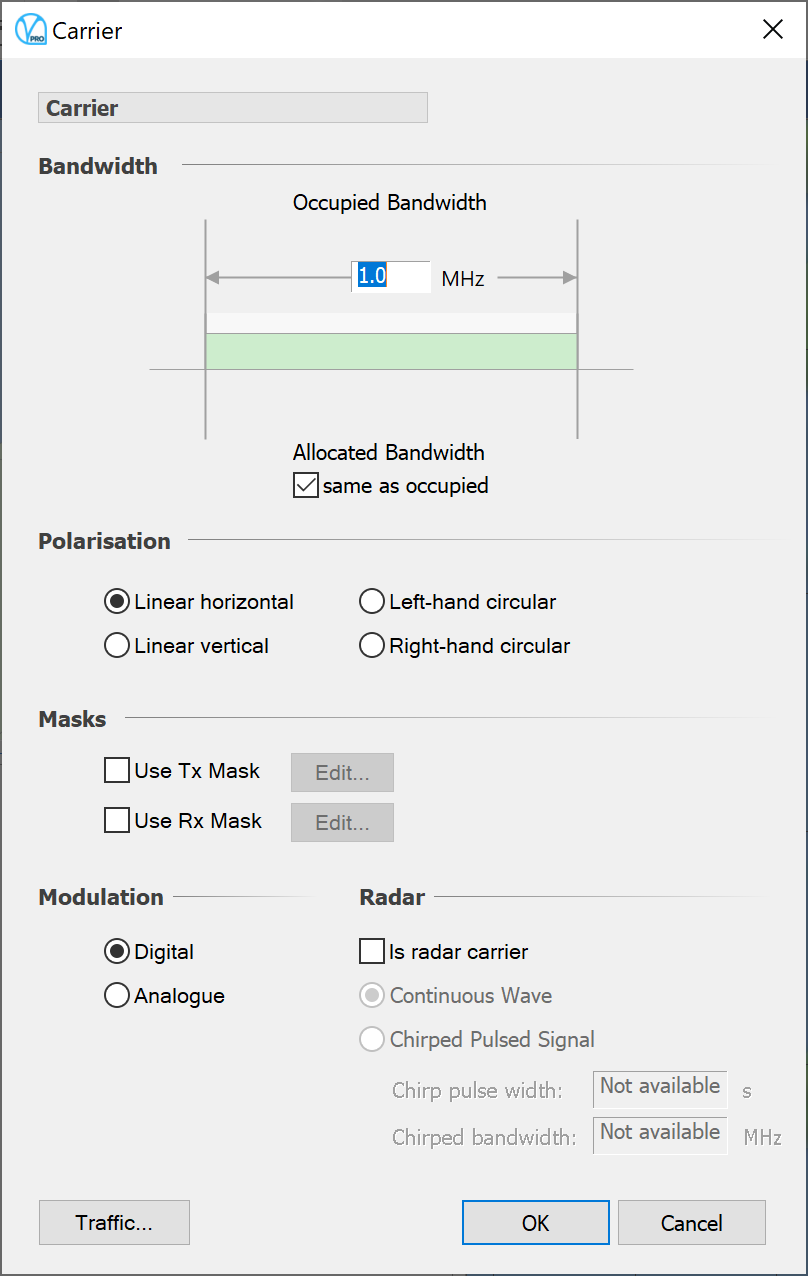
The dialog is made more complex by the fact that the effect of bandwidths and spectral masks varies depending on choices you will make later when you set up the interference. Put simply – you need to decide how to deal with interference in cases where bandwidths can be very different and also how to deal with the out of band emissions implied by non-trivial spectral masks. This is covered further in more on this in Interference Paths.
Spectrum Masks and Net Filter Discrimination
Version 7 introduced the TX and RX masks which together can be used to define a net filter discrimination (NFD). The details of the calculation are given in the Technical Annex, but the idea is that you define the data that represents the spectral mask for in band and out of band emission/response for this carrier when used in a transmitter or receiver.
Data are entered in a table that gives the relative level of the mask compared to the peak, at any number of frequency off-sets from the centre frequency.
Later, when you define a victim and an interferer, Visualyse will do a numerical convolution and work out the Net Filter Discrimination over the whole overlapping band. You can also get Visualyse Professional to use the bandwidth calculated from the transmit spectrum mask in the NFD calculations.
The carrier type can be specified as digital or analogue – if you are modelling multiple hop systems and looking at end-to-end performance this will have a significant effect. Noise on a series of analogue links is additive, whereas on digital regenerating links the noise in the system is determined by the worst single link.
The polarisation of the carrier can be defined as left or right circular, linear vertical or linear horizontal. This can be considered when calculating interference levels depending on choice made in setting up the Interference Path object (Interference Paths).
If you have the Visualyse Traffic Module then other carrier parameters, accessible via the Advanced button, will also be relevant. The significance of these parameters and the use of different load methods are described in the Module User Guide.
The radar parameters are used in the interference path to calculate the On Tune Rejection (OTR) according to ITU-R Rec. M.1461 “Procedures for determining the potential for interference between radars operating in the radiodetermination service and systems in other services”.
Propagation Modelling
Propagation modelling in Visualyse is dealt with at simulation level. This means you define a global propagation environment in terms of which loss models to apply to different types of Link, and Visualyse does the rest. The global environment can be over-ridden for each link individually.
Visualyse classifies Links into the following types:
- Terrestrial fixed
- Terrestrial mobile
- Space earth
- Space – space
- Broadcasting
- User defined (as many additional ones as you need)
For each Link type you define a set of propagation models to be applied. Different models to can be applied depending on whether the Link is victim or interferer.
We refer to the whole set of propagation models for the different Link types as the Propagation Environment.
In order the set your propagation environment begin with the Propagation menu (shown below).
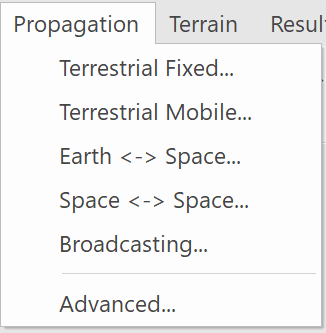
To change the models used by a particular Link type, simply select the Link type from the Propagation menu. The properties dialog for the selection will be displayed.
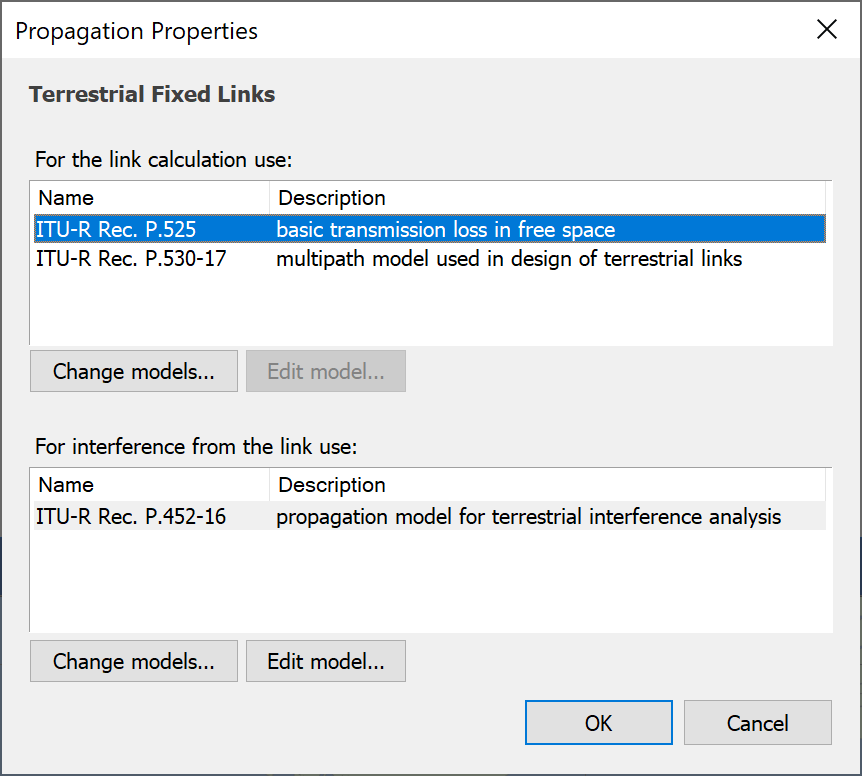
The dialog above shows the models that will be used for terrestrial fixed Links.
You may wish to treat propagation in a different way when considering wanted and interfering signal levels – this is normal practise if you are following ITU-R Recommendations. In Visualyse, a Link can be used as both a victim and interferer.
You can change the models used by clicking the appropriate ‘Change Models’ button. The Propagation models dialog will appear.

You can select any combination of the base propagation models plus any rain or atmospheric models. Visualyse does not restrict the combinations you choose but will generate a warning message (which you can ignore) if you choose two models, each of which has a free space element included in it. This helps prevent double counting of free space loss.
Propagation Model Parameters
Many of the propagation models have associated parameters. You can edit these by double clicking on the model or by selecting it and clicking the Model Parameters button. This will show the propagation parameter dialog for the model. An example is shown below.
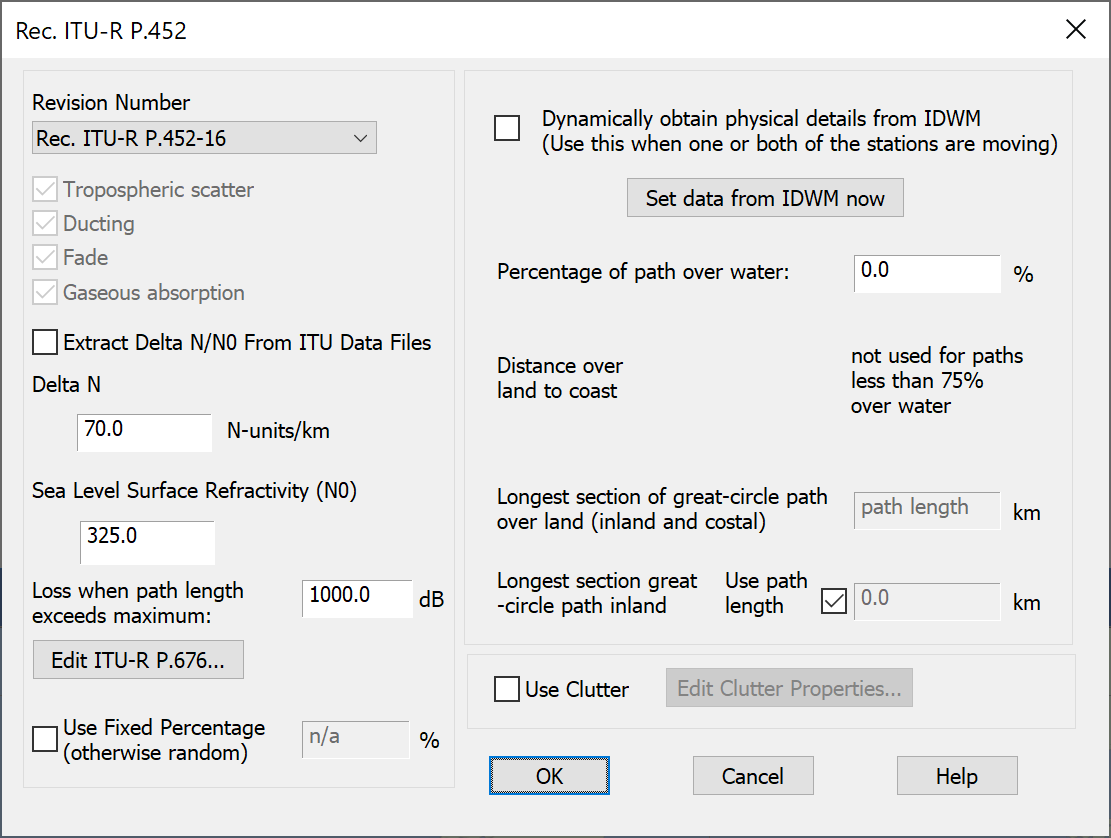
A description of the available propagation models is given in the Technical Annex.
Creating Your Own Propagation Link Types
You can create your own propagation Link types – an example application might be if you are modelling a mobile system with go and return links on widely different frequencies. In this case you may want to have ‘UHF Mobile’ and ‘VHF Mobile’ modelled as different Link Types.
To do this, select Advanced from the Propagation menu. The custom propagation Link types dialog will appear.
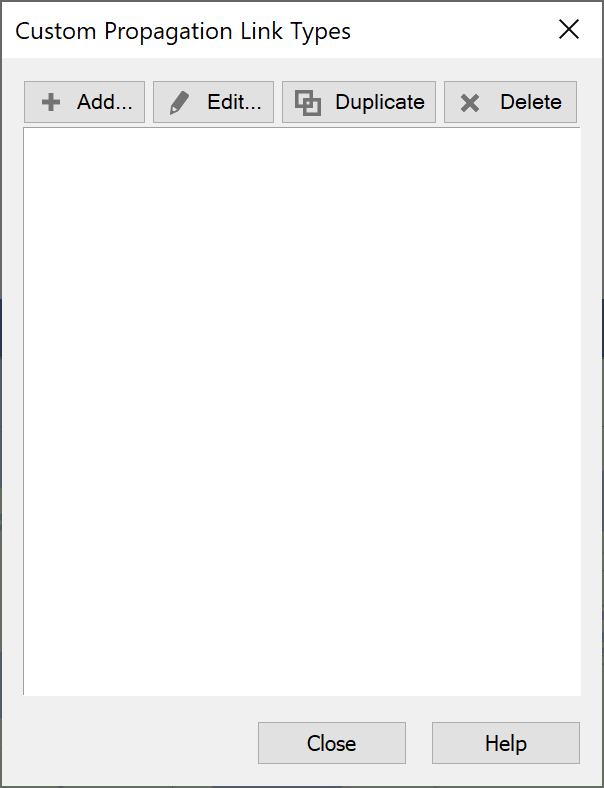
Click Add to add a new Propagation Link type. The edit dialog for the new Link type will appear. This is the same as the dialog for built in Link types, except that there is a field for the name at the top of the dialog.
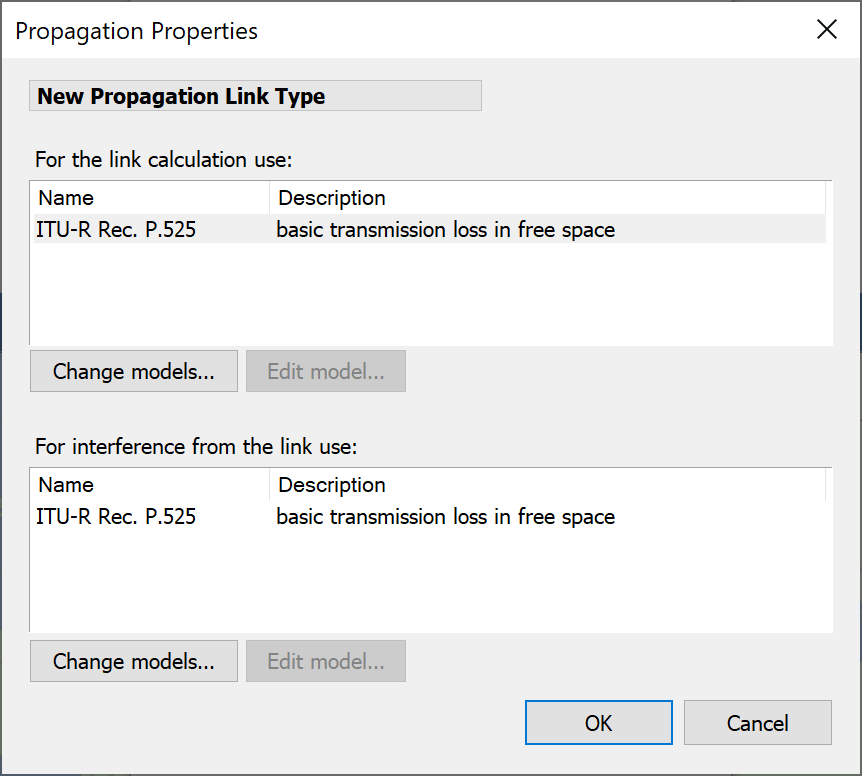
Make your changes and click ok. You will be returned to the previous dialog. Click Close and then click the Propagation menu again. You will see your new propagation Link type under the built in Link types.
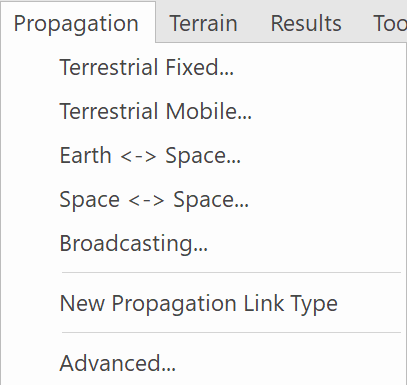
The Technical Annex contains a tutorial on propagation which is a useful introduction for the non-specialist on the selection and use of propagation models for interference analysis.
Links
Link objects are used in Visualyse to:
- Connect Stations together
- Define parameters related to the propagation of radio waves
- Set the criteria by which interference levels are judged
The Link is where Stations, Carriers, frequencies, propagation models, interference criteria and interference statistics gathering are combined to define a communications path.
The Links Dialog
The Links Dialog can be invoked in the normal ways, i.e.
- Via the toolbar icons
- Via the Model menu
- By right mouse click in the Model View
There are four types of Link that you can create, depending on what you want to do.
A Fixed Link has explicitly defined start and end Stations, which do not change during the simulation, but which are not necessarily fixed Stations. Many modelling scenarios call for the use of fixed links.
A Receive Link has an explicitly defined end Station, but no defined start Station. This type of Link could be used for earth observation satellites for example, or in any case where a fixed receive signal is known.
A Transmit Link has an explicitly defined start Station (or Group of Stations) but no defined end Station. This type of Link would be used for a broadcast system being considered only as an interferer. Receive Stations are not relevant to the scenario and can therefore be omitted.
The ‘source’ of a transmit Link multiple Stations, multiple beams and multiple Antennas. So, for example, if you have a Group of two Stations each with two Antennas which themselves have two beams there are various ways of specifying a transmit Link:
- Both Stations transmitting through both their Antennas using all beams, or:
- One Station transmitting through both Antennas using both beams, or:
- One Station transmitting through one Antenna using both beams, or:
- One Station transmitting through one Antenna using one beam.
In a Dynamic Link the start and/or end Station, are selected from a group according to one of several criteria that may vary through the simulation. For example, in the case of a nonGSO satellite constellation, the feeder Link Earth Stations will experience handover from satellite to satellite that will be dependent on elevation angle. This would be modelled as a Dynamic Link in Visualyse.
Fixed and Dynamic Links contain two Link Paths, one for the forward communication direction and one for the return direction. Forward and return directions are defined in relation to the start and end Stations, the forward path always running from the start Station to the end Station. Each direction can have separately defined powers and criteria.
A Receive Link has a single Link Path into the receive while a transmit Link has no Link Paths at all.
All Link dialogs have an option to change how Links are shown on the map and 3D views. This is done via a combination of the ‘Display’ button in the Link dialog and the Link display method in the configure option of the view menu.
The Link dialog also defines the powers, propagation characteristics and the interference criteria levels for the Links.
The dialog is in the form of tabbed sheets. Each tab is described in detail below. Tabs that are common to more than one Link type are described first.
Fixed Link
The dialog has five tabs (six if you have the Traffic Module enabled).
The first two tabs define the start and end points of the Link. The next two define the parameters associate with the link in the both directions, and the final tab is labelled ‘Advanced’.
Start & End Stations
The Start Tab of the Fixed Link dialog is shown below.
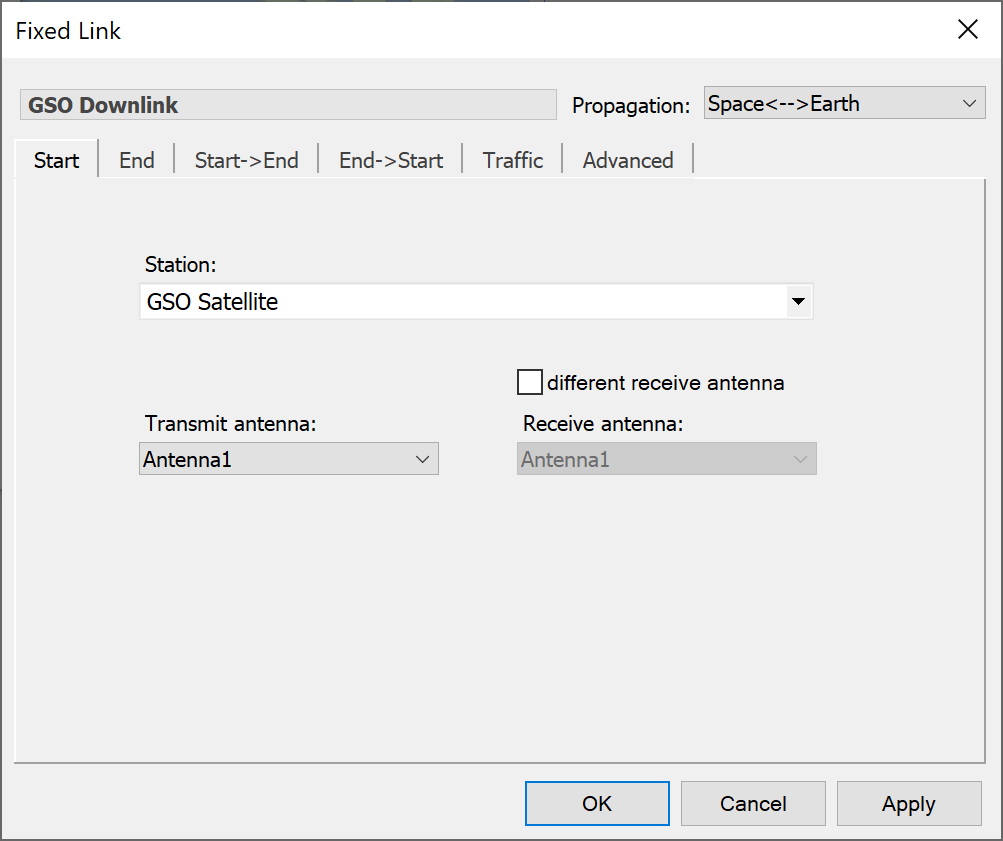
Select a Station to define the starting point of the Link from the drop-down list. If any Stations appear in Groups, the Groups will be shown, and you can expand each Group to show the Stations it contains.
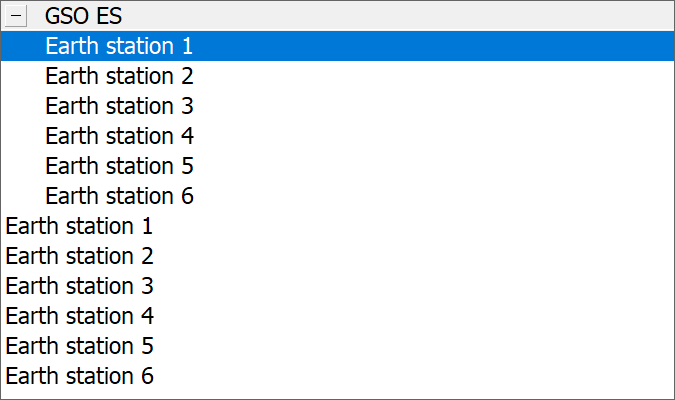
If the selected Station has multiple Antennas or Beams, you will need to select from these as well.
The end station tab is the same as the start station tab except for the antenna and beam labelling.
Link Paths
Each Link can have two associated Link Paths. These are associated with two possible directions of communications for each Link, allowing you for example to model up links and down links without too much input data duplication. The Link Paths are called:
- Start to End – in the direction start station to end station
- End to Start – in the direction end station to start station
The StartEnd tab is shown below.
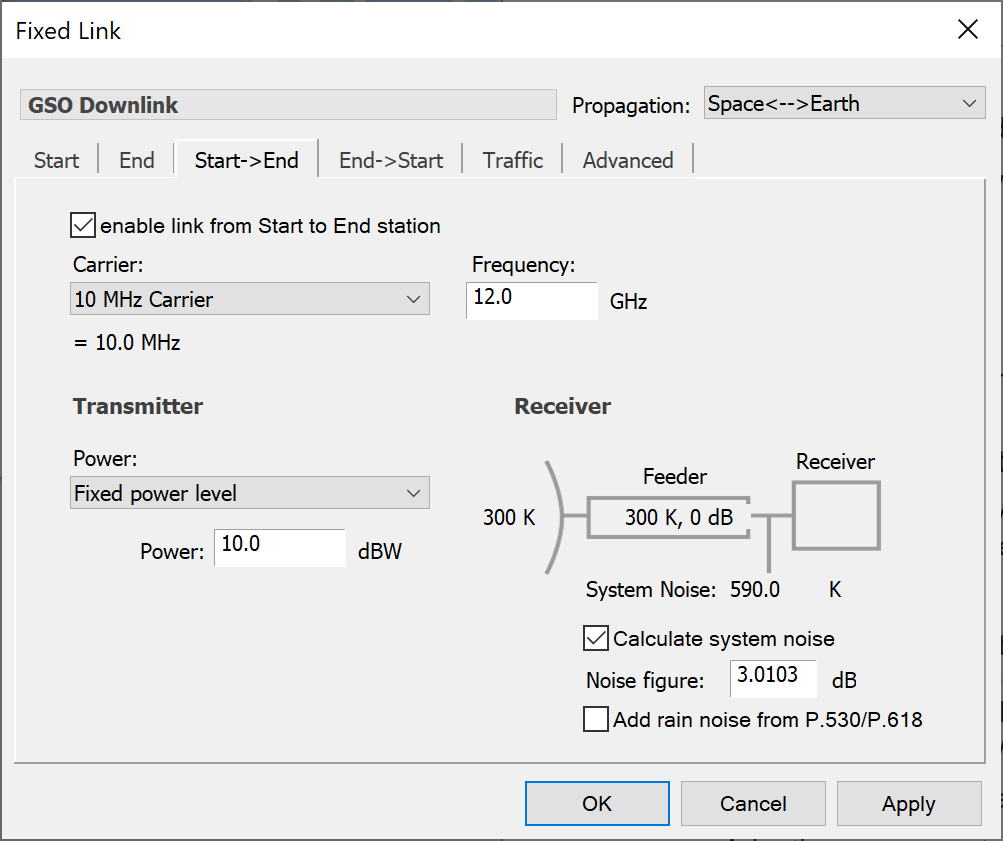
End to start and start to end tabs work in exactly the same way.
You can specify whether the link path is enabled or not using the check box at the top of the tab.
Frequency and Bandwidth of the Link
On each active Link Path you must select a Carrier (which defines the bandwidth) and a centre frequency.
Transmitter
For the start to end link path, this will be the start station. The main feature of the transmitter is its power. Power is made more compact by allowing you to say how you want to specify it before asking you for the relevant parameters. You can choose from the following options:
- Fixed power level: the power level is a fixed value
- Adaptive power control: the power level changes to achieve a target receive level
- PFD power control: the power level changes to achieve a target PFD
- Bandwidth control: the bandwidth changes rather than the transmit power
- Constant receive power: the receive level is fixed
- Random (specify limits): power is random between some user defined limits
- Random (limits from antenna): power is random between the limits defined in the antenna
- Fixed amplification: the transmit power is the receive signal of the previous link plus a constant
- Table amplification: the transmit power is the receive signal of the previous link plus and an amplification factor that depends upon the receive signal
For the return direction (EndStart) there are two additional power options:
- Radar reflection
- Listen before transmit
More information on how to use these two options is given in the Technical Annex.
A detailed description of all the options is given in the Technical Note: Transmit Power Options
Tip: Note that the transmit power is referenced at the input to the antenna. See the Technical Annex for more information about link reference points.
Receiver
For the start to end link path, the end station is a receiver.
The main feature of the receiver is the specification of system noise. This is shown diagrammatically in the bottom right of the dialog.
If the calculate system noise option is selected, the software will compute the system noise from the temperatures and losses at the antenna and feeder you have already provided in the Antenna and Station dialogs. These contributions are shown on the diagram. The receiver noise figure must be provided to complete the calculation.
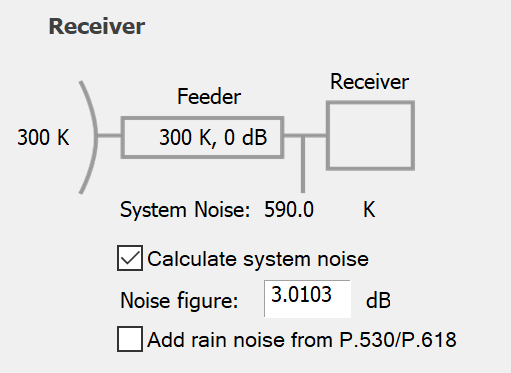
If the noise is not being calculated, the diagram is greyed out and a box is provided for the system noise figure.
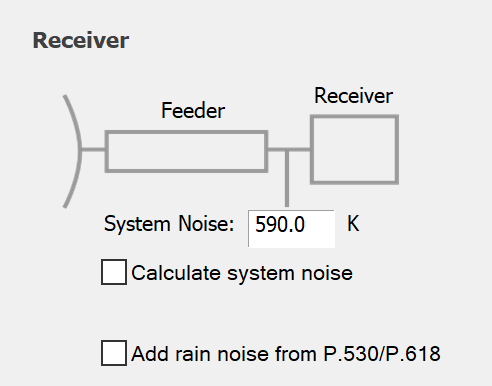
Note that the reference point is immediately after the antenna feed. The feeder loss is specified in the Station dialog (see Adding and Managing Antennas) for each Antenna. If you want to do your calculations at a reference point immediately after the antenna you should put zero in the for the feeder loss and specify the system noise directly.
If you have a rain model switched on (see Propagation Modelling) you can optionally include the increase in noise on a Link due to scattering by rain.
Advanced Options
The advanced tab allows you to override the propagation and statistics that are specified at simulation level. You can also set the link colour. This is shown below.
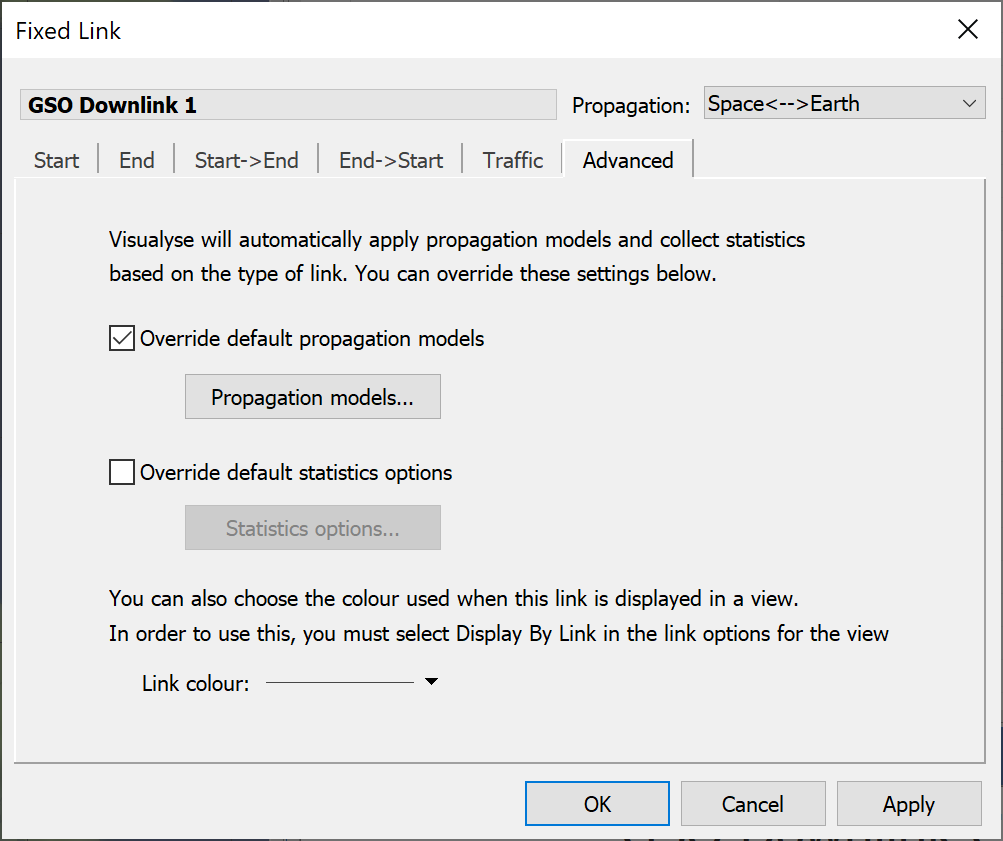
If you decide to override the default propagation models, click the Propagation models button. This will display the propagation options dialog.
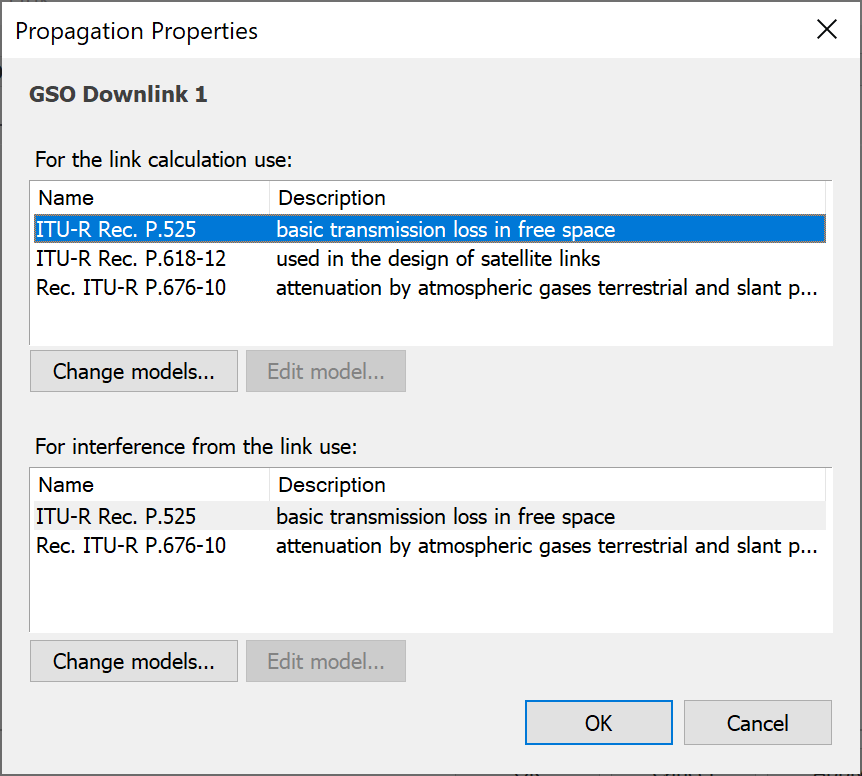
The default models for the link type will be displayed. Click “Change Models” to change the models that are used for this link. Double-click on a model or select it and click “Edit Parameters” to change the default parameters used for that model.
The statistics options work in the same way.
Traffic
As with Stations, the Traffic tab will not be shown unless the traffic module is enabled. If traffic is enabled, an extra tab called Traffic will appear.
You can decide whether to enable traffic modelling on the link and if so what traffic model to use. The Traffic modelling option is explained in the Module User Guide.
Receive Link
Receive links have no transmitting capabilities. They are used to set up receivers to use as test points for interference measurement. They are the simplest of all the links consisting of a single station and some receiver characteristics.
End tab
The End Tab defines the station, antenna and beam which will form the end point of this receive link. Receive antenna and Receive beam choices only need to be made when the selected station has multiple antennas and multiple beams.
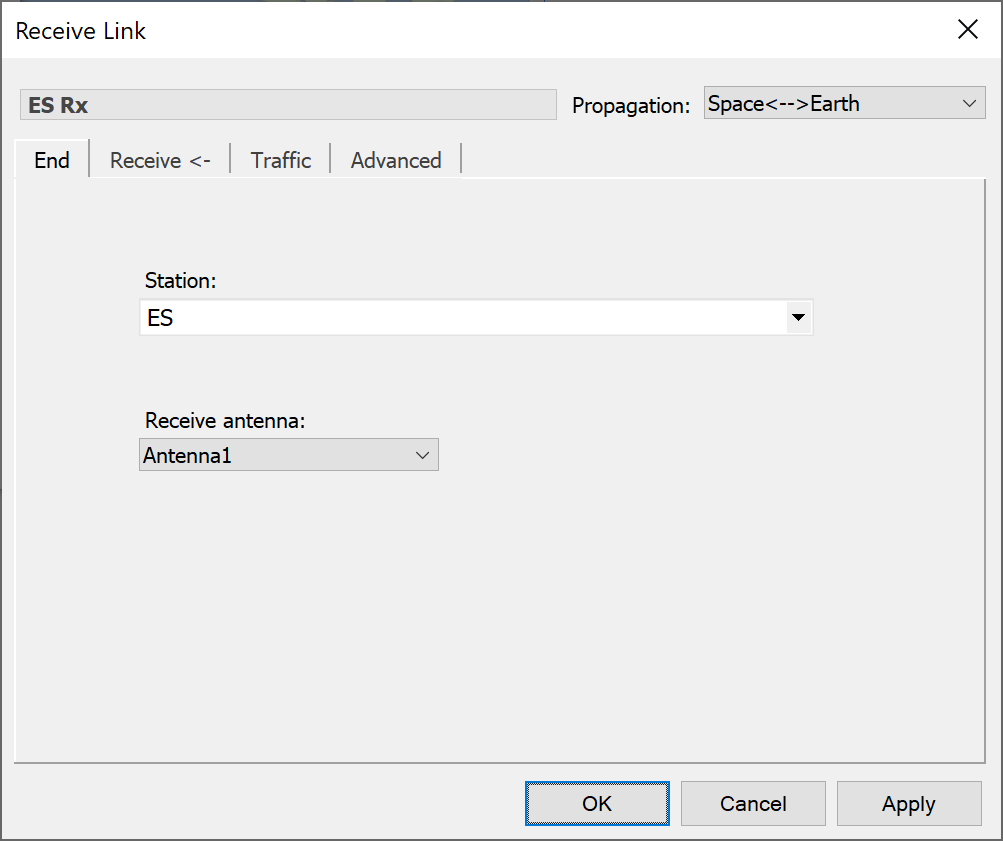
Receive tab
The Receive tab is where the Link parameters are defined: it is shown in the figure below.
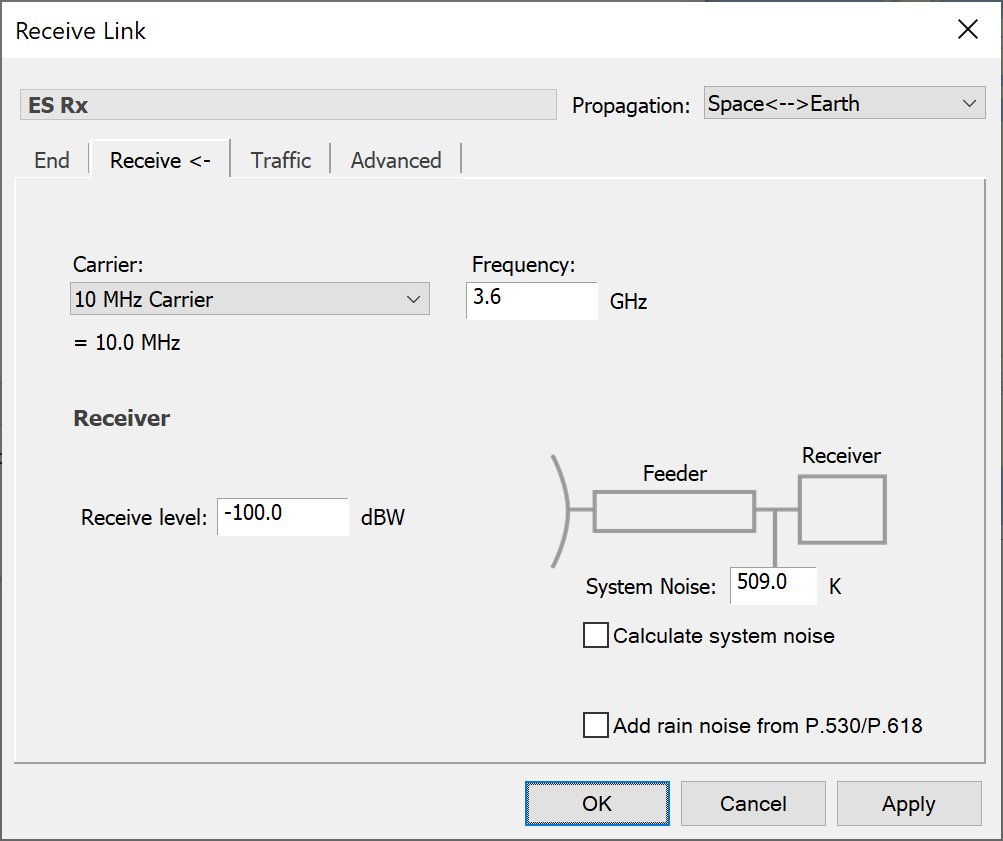
In this dialog you will need to:
- Select a Carrier and a frequency
- Define a nominal received level (note, only needed if you want to work with C/I or C/(N+I) criteria
- Define the link noise as per the Fixed Link dialog.
If the calculate system noise option is selected, the software will compute the system noise from the temperatures and losses at the antenna and feeder you have already provided in the Antenna and Station dialogs. These contributions are shown on the diagram. The receiver noise figure must be provided to complete the calculation.
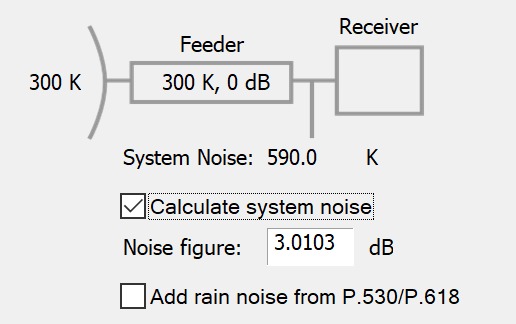
If the noise is not being calculated, the diagram is greyed out and a box is provided for the system noise figure.
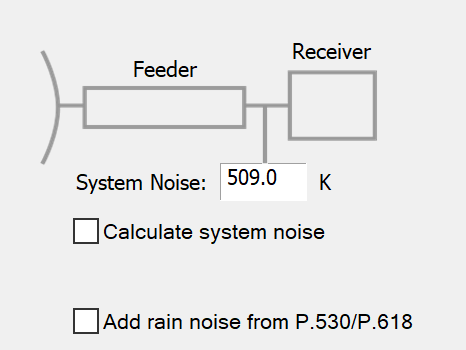
Note that the reference point is immediately after the antenna feed. The feeder loss is specified in the Station dialog (see Adding and Managing Antennas) for each Antenna. If you want to do your calculations at a reference point immediately after the antenna you should put zero in the for the feeder loss and specify the system noise directly.
If you have a rain model switched on (see Propagation Modelling) you can optionally include the increase in noise on a Link due to scattering by rain.
Transmit Link
A Transmit link contains only start Station(s). You can consider these simply as sources of interference and use them when you are not interested in the other end of the Link.
It contains a tab defining the Start Station, Antenna and Beam.
One important feature of a Transmit link is that the source can be defined as multiple beams, on multiple antennas and even multiple stations. In the Transmit link, you just switch on all stations and the interference is aggregated.
A tab called Transmit and the Advanced Tab as per the Fixed Link dialog
The Transmit Tab is shown below:
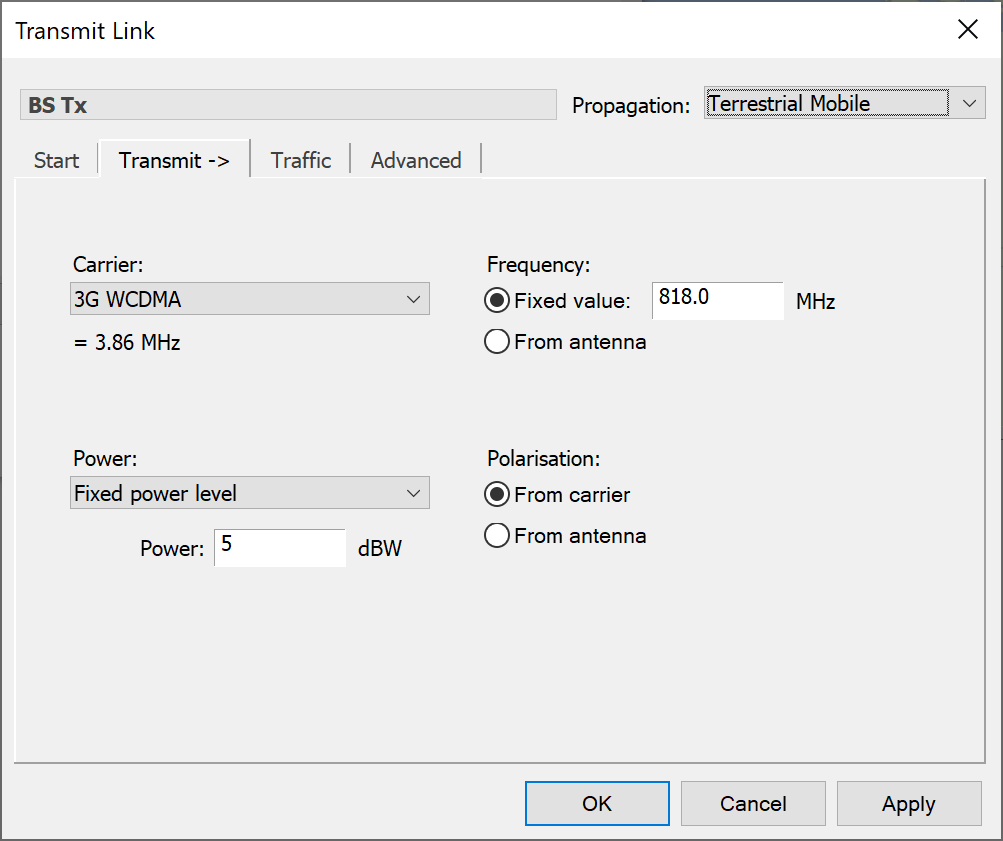
On this tab you need to define:
- The carrier – selected from a drop-down list of existing carriers
- The frequency – and whether you will use the antenna default frequency or a fixed value. This point is subtle, but if you have multiple sources in your transmit link, you can implement a sort of frequency re-use pattern by using a different antenna, with different default frequency, for each source.
- What is the power level and whether this is fixed or taken from the antenna defaults.
Dynamic Link
These differ from fixed links by the fact that the start and end stations can change as the simulation runs.
The start end, end start, Traffic and Advanced tabs are therefore the same as for Fixed Links. The only differences are the start and end station tabs.
Start Station
The start station tab is shown below.
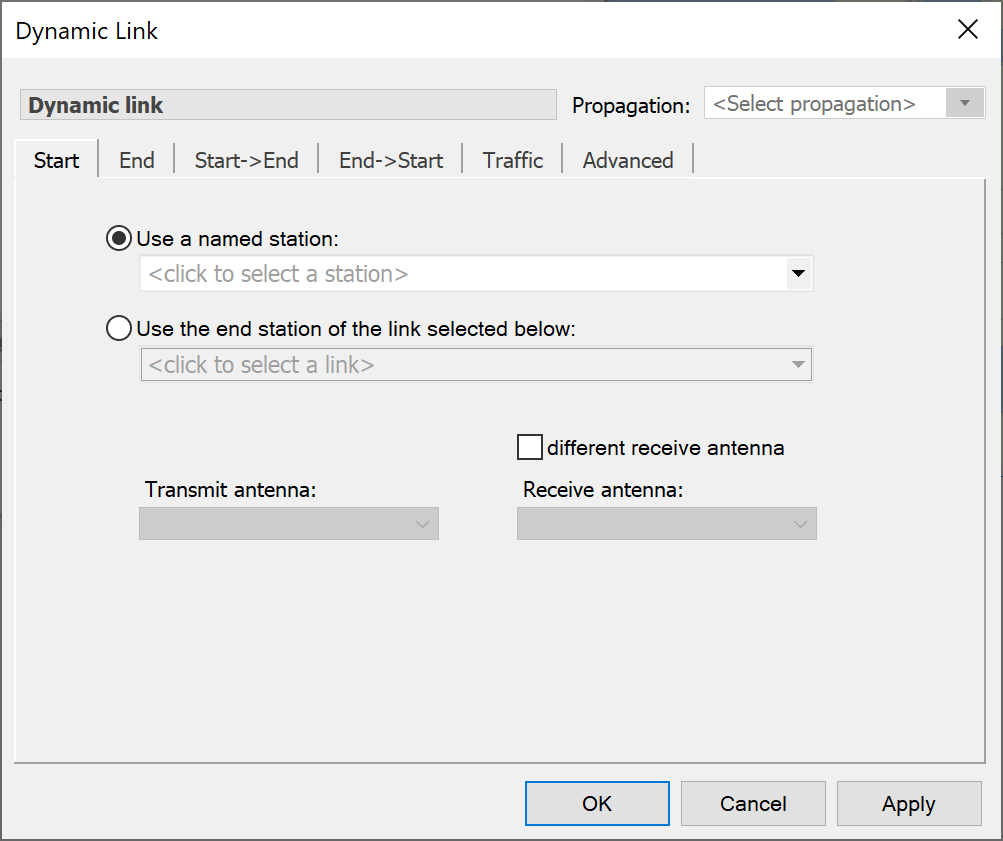
Two options are provided for the selection of start station use a named station (just like a fixed link) and use the end station of another link. The second option allows you to chain together Dynamic Links and therefore model, for example, the inter-satellite links in a non-GSO constellation.
You must also select the Antenna and Beam to start the Link on. Select either a named Antenna and Beam or pick any Antenna/Beam combination capable of tracking the end station. If you take the second option, Visualyse will manage the available resources and select the first available antenna.
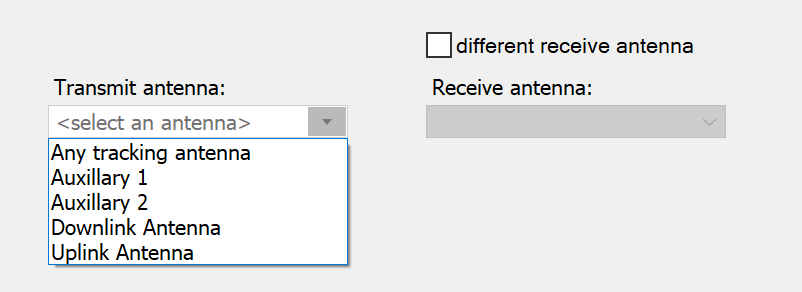
Select either ‘Any tracking antenna’ or an antenna from the list.
Beam selection is a little more complex. The options are shown below.
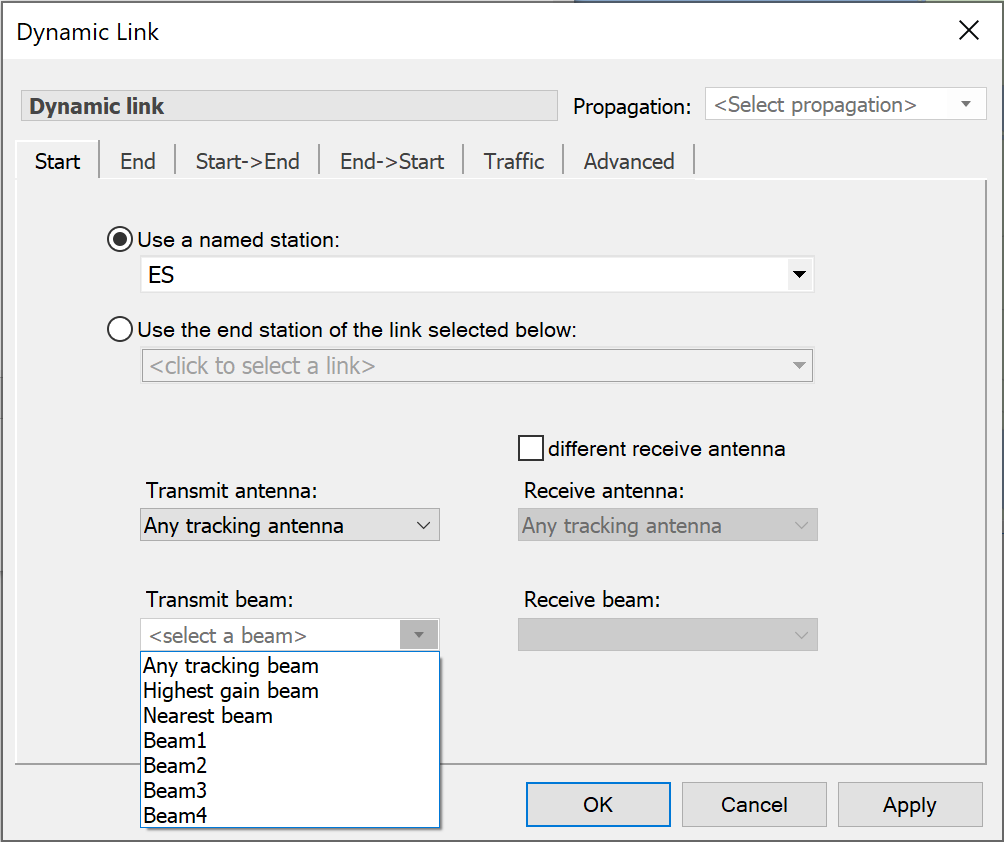
Beam selection options are:
- Any tracking beam – Visualyse will choose the first available steerable beam
- Highest gain beam – Visualyse will choose a beam from the selected antenna that has the highest gain
- Nearest beam – Visualyse will choose a beam from the selected antenna, whose boresight latitude and longitude are closest to the location of the End station.
End Station
The End tab for a Dynamic Link is shown below.
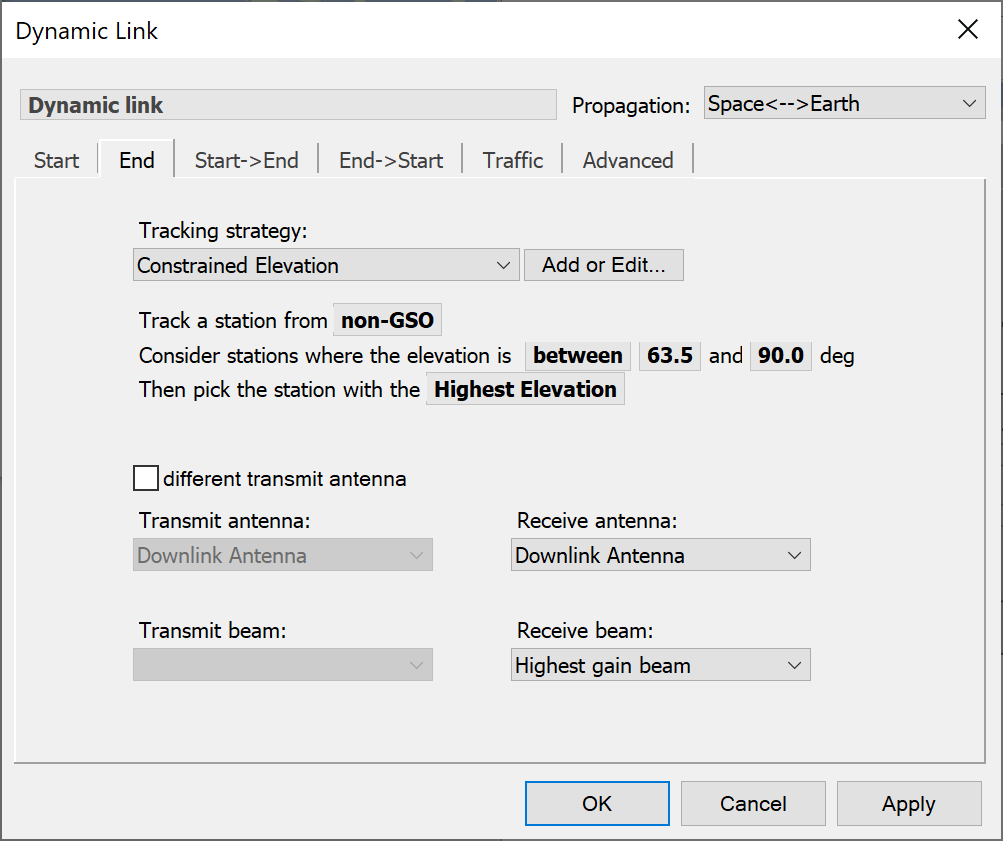
The unique feature of the End Station selection is the use of a ‘Tracking Strategy’.
Tracking Strategy
Select a Tracking Strategy from the drop-down list. You can choose either a built-in strategy or a strategy you can define yourself (see Tracking Strategies).
Each built in tracking strategy has a set of parameters needed to fully define it. Each strategy must be applied to a specific Group of Stations (see Station Groups) and this is selected by clicking on the highlighted text labelled “Track a Station from”.
As an example of other parameters needed, the tracking strategy we call ‘Constrained Elevation’ allows you to track a station that has the highest elevation but meets the constraint that the elevation is between two limits. This is shown below.

The parameters you can change are bold and highlighted. As you pass the mouse over them, the cursor will change. Click and you can edit them. Click away or press Return, and your changes are made.
For items that are not values, but items selected from a list e.g. the Station Group to be tracked, the operation is slightly different. The cursor changes to a hand when you pass over the item. Click and hold to produce a pop-up list, then drag to the item you want and release. The non-GSO and Highest elevation options in the example work in this way.
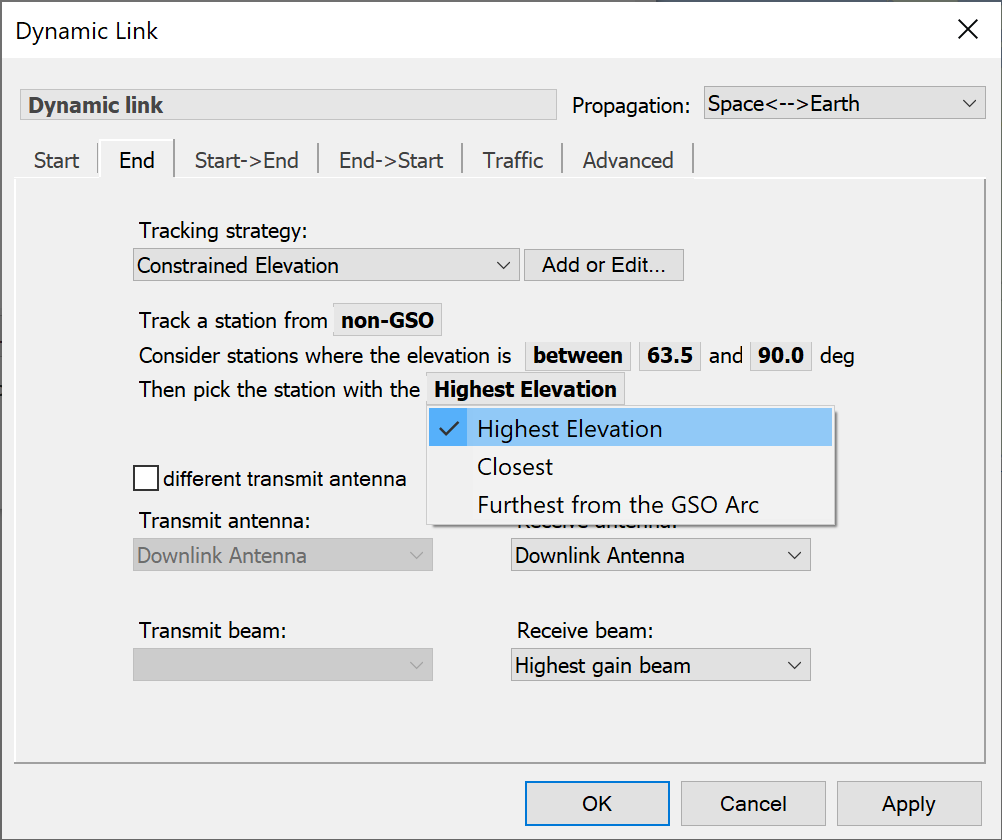
The following tracking strategies have been built into the simulation and can be selected directly on the End Station tab of the Dynamic Link
Track a Single Station
This tracking strategy isn’t really a tracking ‘strategy’ at all because it always tracks the same station.

Constrained Elevation
Several parameters need to be given to fully specify this tracking strategy:
- The Group (constellation) to select Stations from
- The elevation constraint type
- Up to two constraining angles (depending on the constraint type)
The selection criterion where more than one stations meets the constraints.

Constrained Distance
This is the same as Constrained Elevation, except that distance from the start station is the constraint.
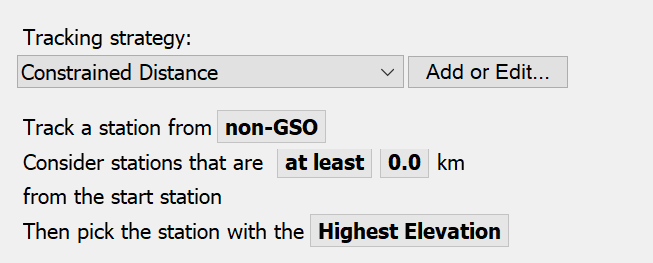
GSO Arc Avoidance
In this strategy the angle between the candidate station and the nearest point on the geostationary arc,
End stations are only considered if the angle between them, the start station and the GSO arc is above a minimum value. Once again, in the case where there are multiple candidates, the station with the highest elevation or longest hold time is selected.
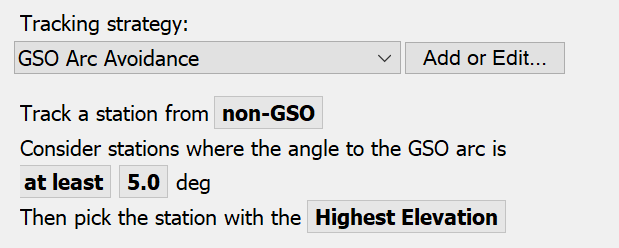
Avoid Constellation
This tracking strategy ensures that the end station chosen such that the angles between it, the start station and every other station in a given constellation are above a particular minimum value.
What we’re saying here is make sure that the start station doesn’t pick an end station that would have it pointing too close to any of the stations in another constellation.
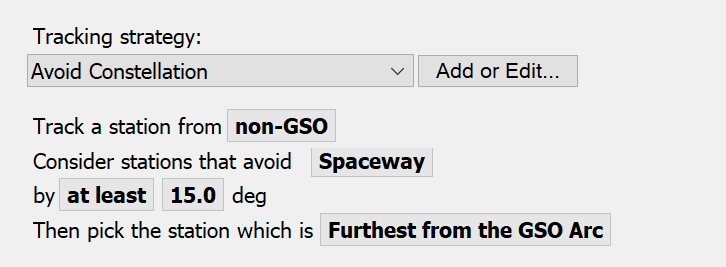
Nearest
This selects the nearest Station from the Group of possible Stations.

Longest Hold Time
This selects the Station from the Group of possible Stations that is heading towards the start Station and could be tracked for the longest possible time without requiring handover. This is done by calculating the dot product of relative position and velocity vectors.

Furthest from GSO Arc
This selects the Station that has largest angle as seen by the start Station towards the GSO Arc.
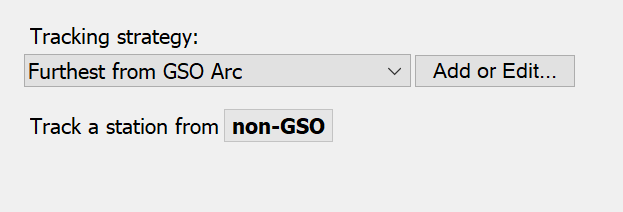
Highest Elevation
This tracking strategy selects the highest elevation Station as seen by the Start Station from the selected Group.

Antenna and Beam Options
Selection of the end station also requires that the Antenna and Beam be specified. For the Antenna you can select:
- Highest gain antenna
- Any tracking antenna
- Select an antenna by name.
Beam selection options are:
- Any tracking beam – Visualyse will choose the first available steerable beam
- Highest gain beam – Visualyse will choose a beam from the selected antenna that has the highest gain
- Nearest beam – Visualyse will choose a beam from the selected antenna, whose boresight latitude and longitude are closest to the location of the End station.
If this Link is to be bi-directional you can select a different Antenna and Beam for the EndStart path.
Link Groups
Links can be associated in Link Groups, which are useful in a number of cases. For example:
- To ease the analysis of systems that contain many Links
- For service area analysis
- Analysis of performance of FS Links operating various kinds of diversity
- Combining up and down Link performance for satellite systems.
Links can be in more than one Link Group at the same time. However, when defining Interference Paths that include Link Groups as sources of interference it would be easy to double count some Links if care is not taken in the assignment of Links to multiple Link Groups.
Three kinds of Link Groups can be created in Visualyse, as shown in the figure below.
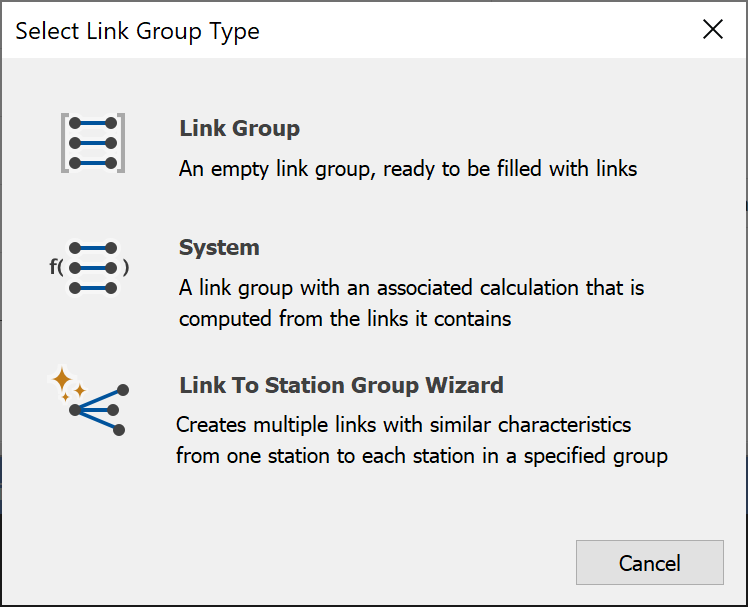
Link Group - Created Empty
Empty Link groups can be a useful way of managing many Links. An example use would be to look at the effect of a single new Link on many existing Links. One option in Visualyse is to create multiple Interference Paths, one for each existing Link. The second option is to put all the existing Links into a Link group and use that Link group as the Wanted Link.
System Link Group
This Link Group contains a set of Links plus a method for calculating the Link quality of the overall group and also defines how statistics will be collected for the Group.1
Link to Station Group Wizard
This sets up and manages Links to and from Station Groups. This may be used in service area analysis for example, where the worst point in a geographic area could be found by analysing Links to many test point Stations
Statistics can be calculated for:
- The current time step, based on statistics gathered from all Links in the Group
- The whole simulation run, based on statistics gathered from all Links in the Group
- The whole simulation run, based on a specific statistic which is calculated at each time step
Statistics for each Station over the whole run can be obtained from the individual Link to that Station.
The Wizards can be rerun again to set new values. However, this could require Interference Paths that use some Links in the Link Group to be redefined.
Each Link Group type is now explained in detail
-
The methods used to calculate overall Link group quality include Take Best Value for diversity analysis and Thermal Addition for analogue endtoend performance. ↩
Link Group Created Empty
Empty Link Groups are used as containers for Links. When there is a large number of Links in the simulation, it becomes easier to manage them using Link Groups. At the basic level, you can put all your victim links into one group and all your interferers into another.
To create an empty Link Group click ‘add’ in the Link Group List (accessible via the Model menu or via the Link Group icon in the toolbar). Then select the first option – Link Group.
A new Link Group, default name Basic Link Group will appear in the Link Group list.
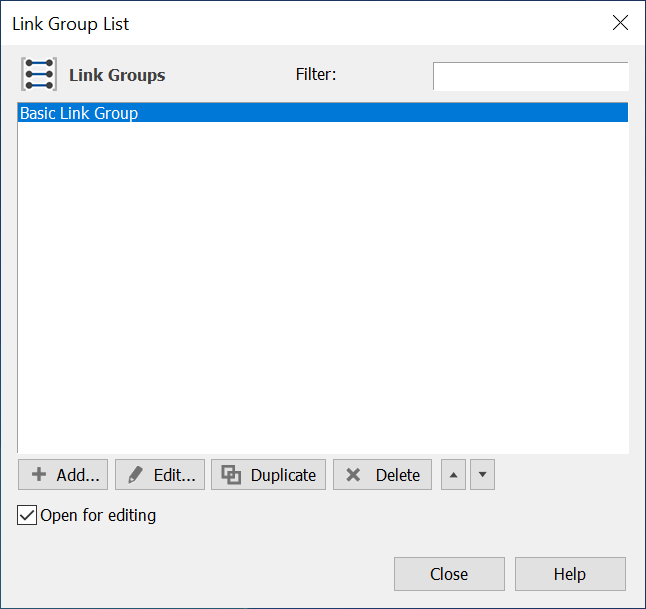
Double click on the Link Group or click the Edit button to edit the Link Group.
The edit dialog has two tabs:
- The Links Tab – add and remove Links from the Link group here.
- The Advanced tab – to override simulation defaults for statistics collection and Link graphical display characteristics here.
Above the tabs is the Link Group name – by default it will be Basic Link Group (or Basic Link Group 1, 2 etc). You can (should) change the name by click on it with the mouse.
The Links Tab
The Links tab is shown in the figure below. The function of this tab is to select Links from the simulation for inclusion into the Group and also for ordering the Links within the Group.
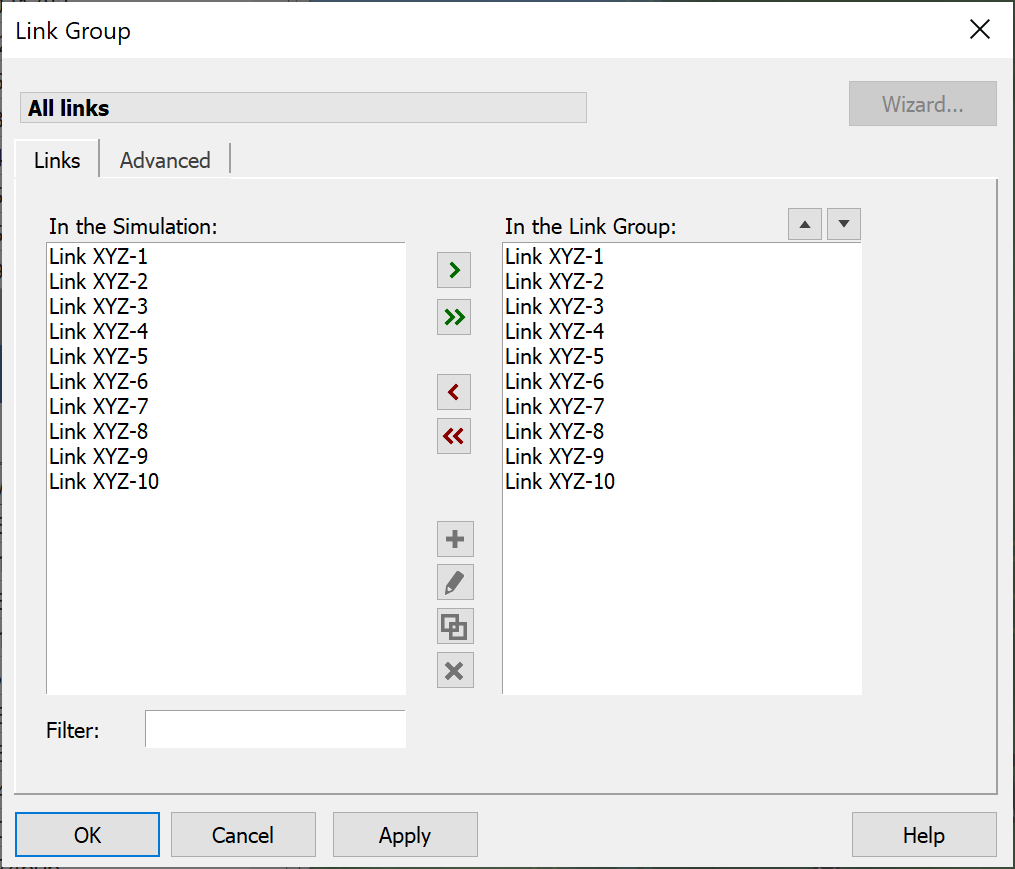
The left pane shows all the Links defined in the simulation and the right pane shows those that are included in the Link Group.
Transfers to and from the Group are via the  and
and  buttons.
Select the Links you want to transfer by highlighting and then press the  button to include or remove them from the Group. Alternatively, the
  button will include or remove all the stations.
Under certain circumstances, the order of Links within the Group can be important – for example, if the Links are Dynamic and ‘competing’ for resources such as Antennas and Beams, those at the top of the list will be processed first.
To promote or demote a Link within the list, select the Link in the right pane and click the  button to promote and the
  button to relegate.
Filter the left pane contents using the filter edit field.
The Advanced Tab
The Advanced tab is used to override simulation defaults for Link colours and for the statistics that are collected.
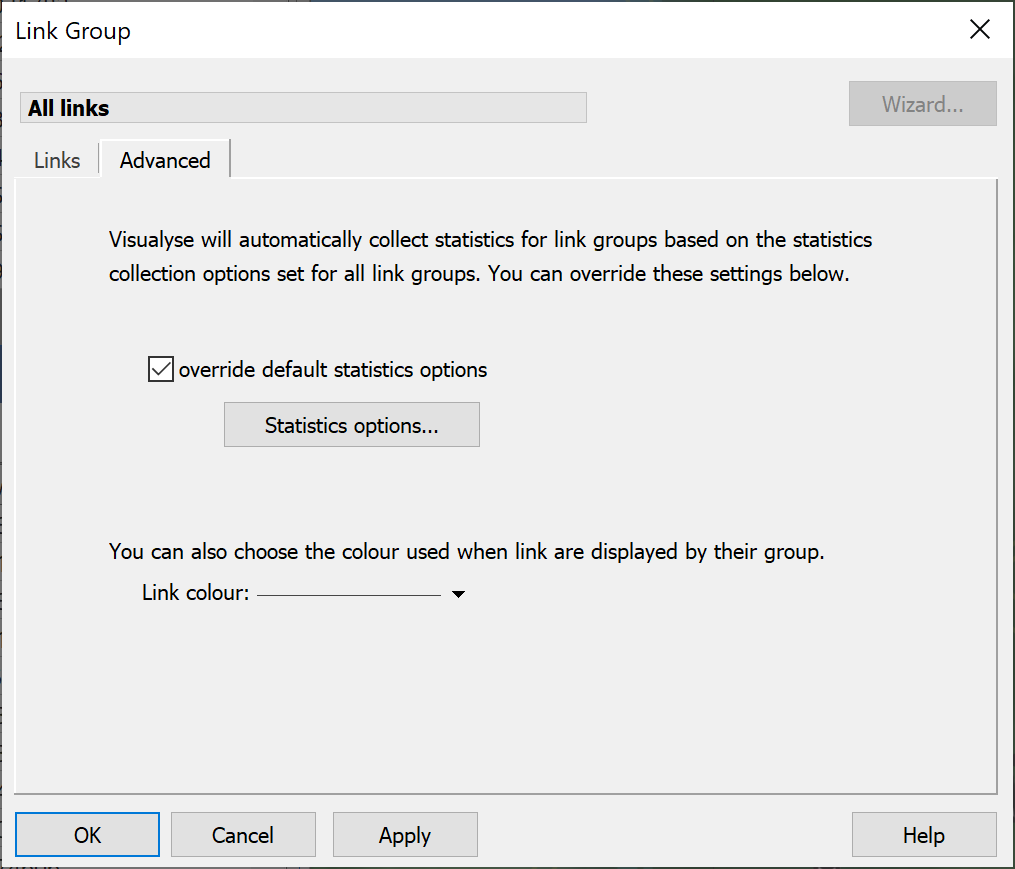
Statistics to be collected are defined for the simulation as a whole via the Output menu. This is where you tell Visualyse to collect and or all of C, N, I, C/N, C/N+I, I/N and PFD statistics, and where the threshold ratios are set. For each Link Group you can change the parameters collected and/or the thresholds.
To override the simulation settings, check the ‘Override default statistics options’ and click the statistics option button. You will see the Statistics Collection Options tab.
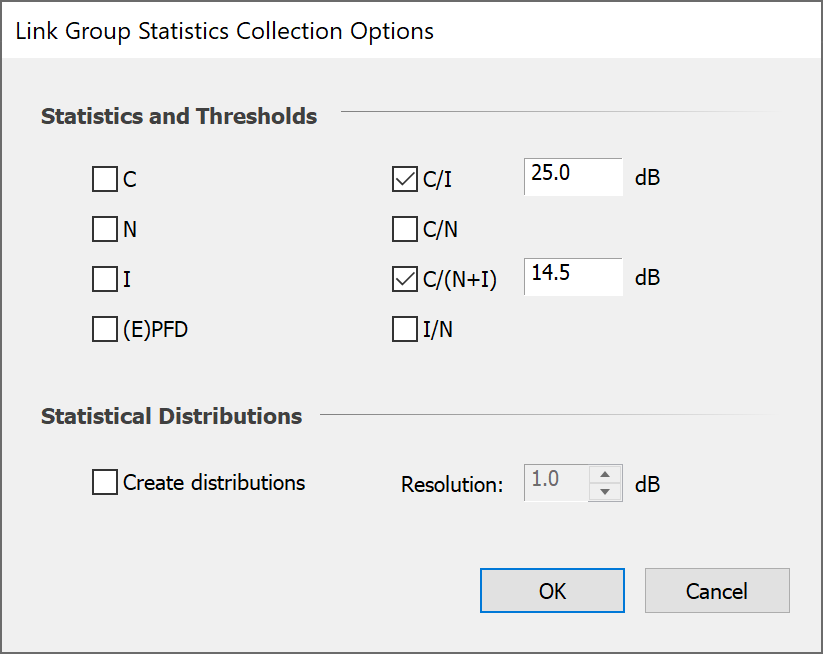
Parameters that are selected in the simulation defaults (see the Overview section of this User Guide) will be checked – if you don’t want statistics on those for this Link Group then uncheck them here. Check any additional parameters you want to analyse and set the threshold levels.
Decide whether you want to generate histograms and the bin size (resolution) for the histograms.
Links can be displayed on map and 3D views either according to the status of the Link (in terms of meeting threshold C/X levels) or according to display properties set here. Click the ‘Link Colour’ button and select the colours to use when displaying the Links in this group.
System Link Group
This type of Link allows Links of groups to be associated and the calculation of statistics across the group to be defined in various ways.
One application of this kind of Link Group is to look at the effects of diversity on the performance of a single hop system.
To create a System Link Group click ‘add’ in the Link Group List (accessible via the Model menu or via the Link Group icon in the toolbar). Then select the first option – System Link Group.
A new Link Group, default name System Link Group will appear in the Link Group list.
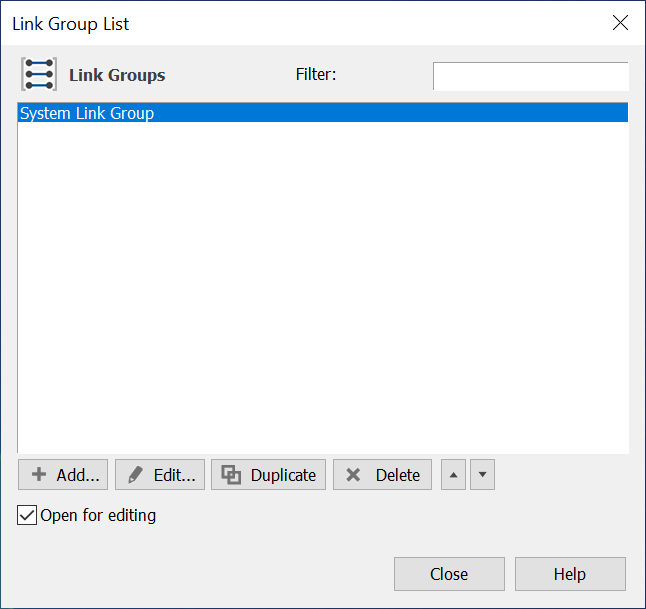
Double click on the Link Group or click the Edit button to edit the Link Group.
The edit dialog has three tabs:
- The Links Tab – add and remove Links from the Link group here.
- The Advanced tab – override simulation defaults for statistics collection and Link graphical display characteristics here.
- The Calculation tab – define how statistics over the whole group are calculated.
The first two tabs are the same as for the Created Empty Link Group: the System Link Group has in addition the “Calculation” tab.
The Calculation Tab is where you tell the software how to deal with the calculations across multiple links at each time step
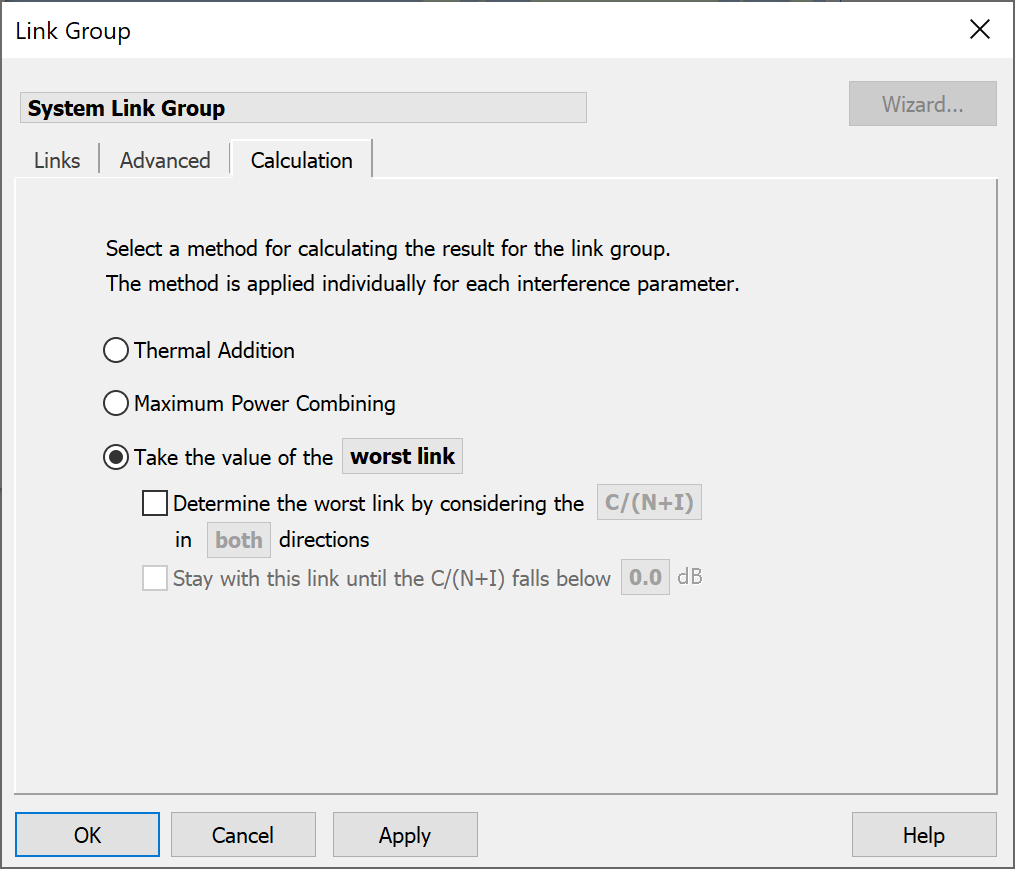
The effect of the various options is described in more detail in Link Group statistics.
Link to Station Group
A Group of Links can be defined to or from a Station Group. This type of Link group has an associated Wizard to help create it.
The Link to Station Group requires a template Link. This can either be selected from the Link list or defined within the Wizard by clicking the Edit button on the first Wizard sheet
All Link types except Transmit can be used as a template Link in this Wizard.
Having defined the Link to use, the next stage is to define the start and end points of the multiple Links. The Link components dialog is shown below.
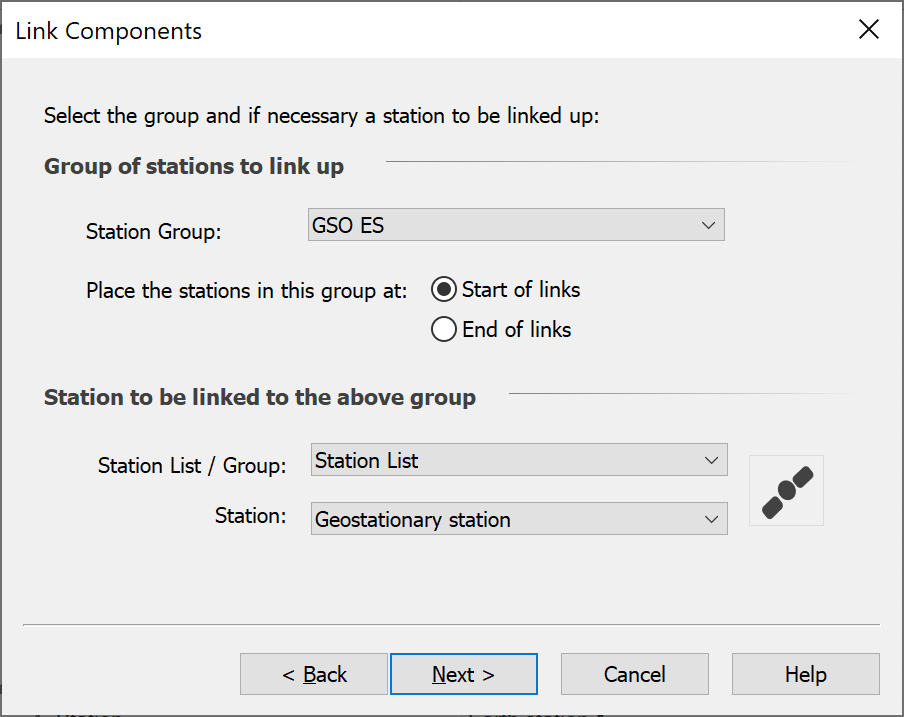
The Link Group can start or end at each Station of any Station Group in the simulation. The other end of each Link must be a Station named explicitly.
The next two screens (one if using a Receive Link as your template) define the elements to be used for the start and end of the Links. Note that the Stations in the Station Group must have at least one Antenna and beam name in common.
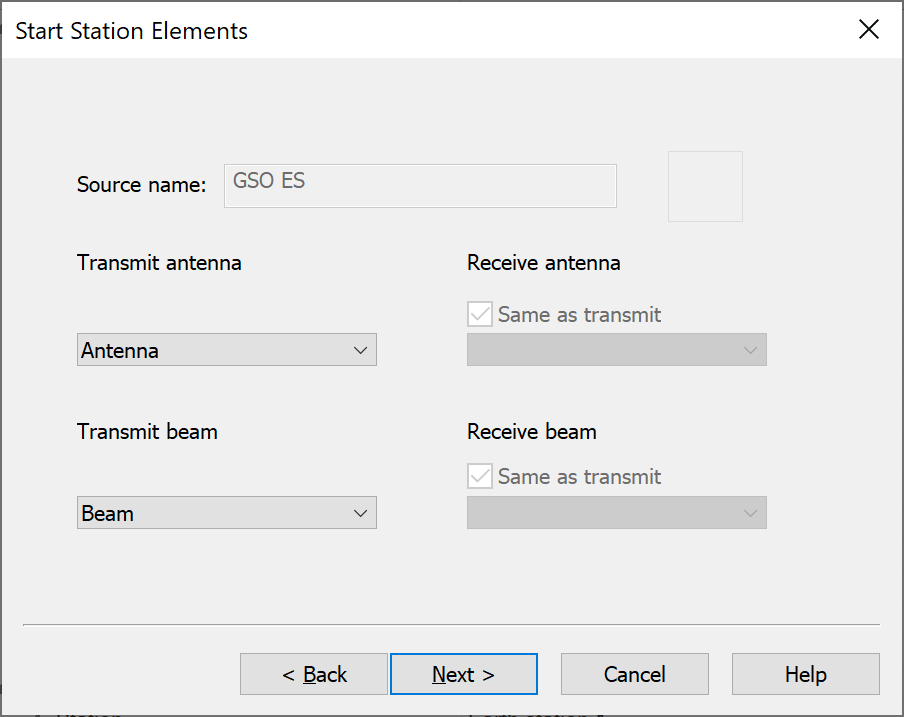
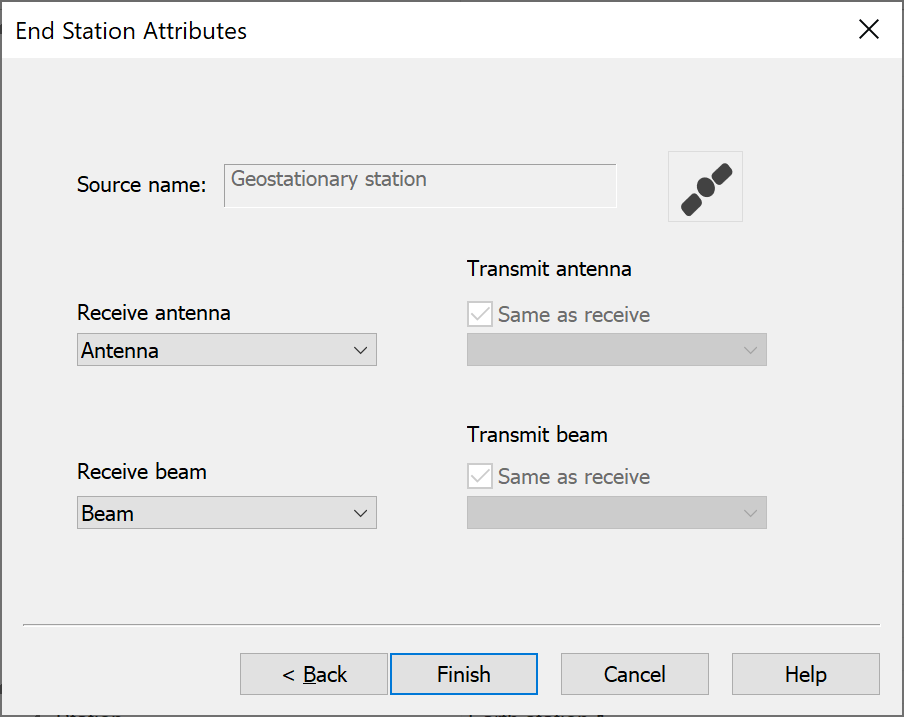
Once you have created this Link Group, you can edit the Group. Select it in the Link Group list and click edit.
There are two tabs, one defining the membership of the group and a second Advanced tab, similar to the two previous types of Link Group.
Link Group Statistics
When we have a group of Links it is possible to look at statistics in three ways:
- Current time step statistics derived from the values of parameters across all links at a single time step
- By aggregating all parameter values across all Links at many time steps
- By selecting one Link at each time step (according to some criterion), build up statistics over many time steps.
We refer to these options as Statistics Now, Statistics All and Calculation Statistics.
Calculation Statistics
Under Calculation Statistics there are several options for the selection criterion. These are:
- Thermal addition
- Maximum Power Combining
- Take Best/Worst Link.
Thermal Addition
Select this option if you have a Link Group that represents a series of hops in an analogue communications chain. Note that the ordering of the Links in the Link Group will represent the order of Links in the chain.
Under this option, the single value used in compiling statistics is the value on the final Link in the group, but noise is assumed to accumulate along the chain. So the noise in Link 3 has a contribution from the noise and interference on Link 2, for example.
The C/X value used is given by:
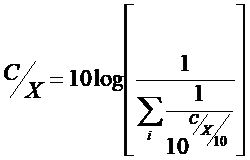
Maximum Power Combining
Select this option if your Links represent diversity paths between the same two points. In this case, the multiple carriers are combined in such a way that they remain in phase, and add in a maximal sense.
The single value at each time step is calculated in Visualyse in the following way (values in absolute, not dB).
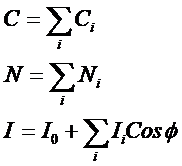
Where Φ is a random angle between 0 and 2π
Worst / Best
Here the contribution to the statistics is taken from worst or best link (according to some defined criterion) at each time step. This could give you the answer to the question ‘For what percentage of time is at least one link suffering interference?’
Choose the third option ‘Take the value of ….’. On this dialog as in others, the bold highlighted text implies a user selection is to be made. Here you can select worst link or best link.
By default, the calculated I statistics will be formed from those Links with the best (i.e. lowest) I and C statistics from the Link with the best C. However you can select the best Link based on any C/X criterion and calculate all statistics and further you can decide to keep with the this Link until the C/X falls below a threshold value.
Let’s look at an example to see why these features are present.
Consider a Gateway Station tracking a constellation of non-GSO satellites. You want to know the interference statistics into the downlink to that Gateway. At any one time, the Gateway may be tracking, say four satellites. The Satellite used for the communications Link will initially be the one with the best BER (or C/(N+I)), but this will be used until the BER rises above a certain value (or equivalently C/N+I falls).
To simulate this, set up four links in a System Link Group and choose best Link by C/(N+I) and stay with a Link until C/(N+I) falls below the threshold.
Example of the Three Types of Statistic
The following example illustrates how the different statistics are derived from all the possible values.
The table below shows the C/I for 3 Links over 4 time steps
| Link | t=0 | t=10 | t=20 | T= 30 |
|---|---|---|---|---|
| 1 | 25 | 21 | 15 | 17 |
| 2 | 27 | 18 | 8 | 14 |
| 3 | 22 | 23 | 22 | 24 |
Statistics Now would consider at each time step the distribution of C/I. So at t=20 this would be the three values C/I = {15, 8, 22}.
Statistics All would be the 12 values C/I = {25, 21, 15, 17, 27, 18, 8, 14, 22, 23, 22, 24}.
If Calculation statistics was using the worst case, then the worst value at each time step would be used, and the distribution would be the four values C/I = {22, 18, 8, 14}
Tracking Strategies
Overview of Tracking Strategies
Definition: A method applied by a single station, in the selection of a Station to communicate to from a Station Group.
In Visualyse, Tracking Strategy objects can be applied to the end station selection in Dynamic Links.
The method is based on a series of constraints on geometric parameters. The constraints are applied to the end station selection of a Dynamic Link (see End Station).
Visualyse has a number of built in strategies and also has a facility to allow you to create your own strategies.
The Tracking Strategies list dialog can be invoked in the normal ways, i.e.
- Via the toolbar icon

- Via the Model menu
- By right mouse click in the Model view
The first two brings up the Tracking Strategy list from where Tracking Strategies can be Added, Modified, Duplicated and Deleted.
The Selection Process
The concept of the Tracking Strategy is to select a preferred Station or Station(s) that could be used by a Dynamic or Load Link. They can be used in any situation where there is choice – most typically because in the dynamic simulation the relative positions of the various stations are changing.
Examples include:
- Terrestrial mobile network: a mobile selects the base station to use as it moves (for example along pre-defined route or with its location randomised)
- Non-GSO network: an Earth Station will use a different one as the satellites fly overhead
- Aeronautical telemetry: as the aircraft moves it will select a different control station to communicate with
- Maritime voice: as the ship moves it will switch to a different coastal station
A key factor here is there is one station that must select the end station of the Dynamic Link from a set of possible candidates. The Tracking Strategy is used to make that selection.
Consider the example simulation below:
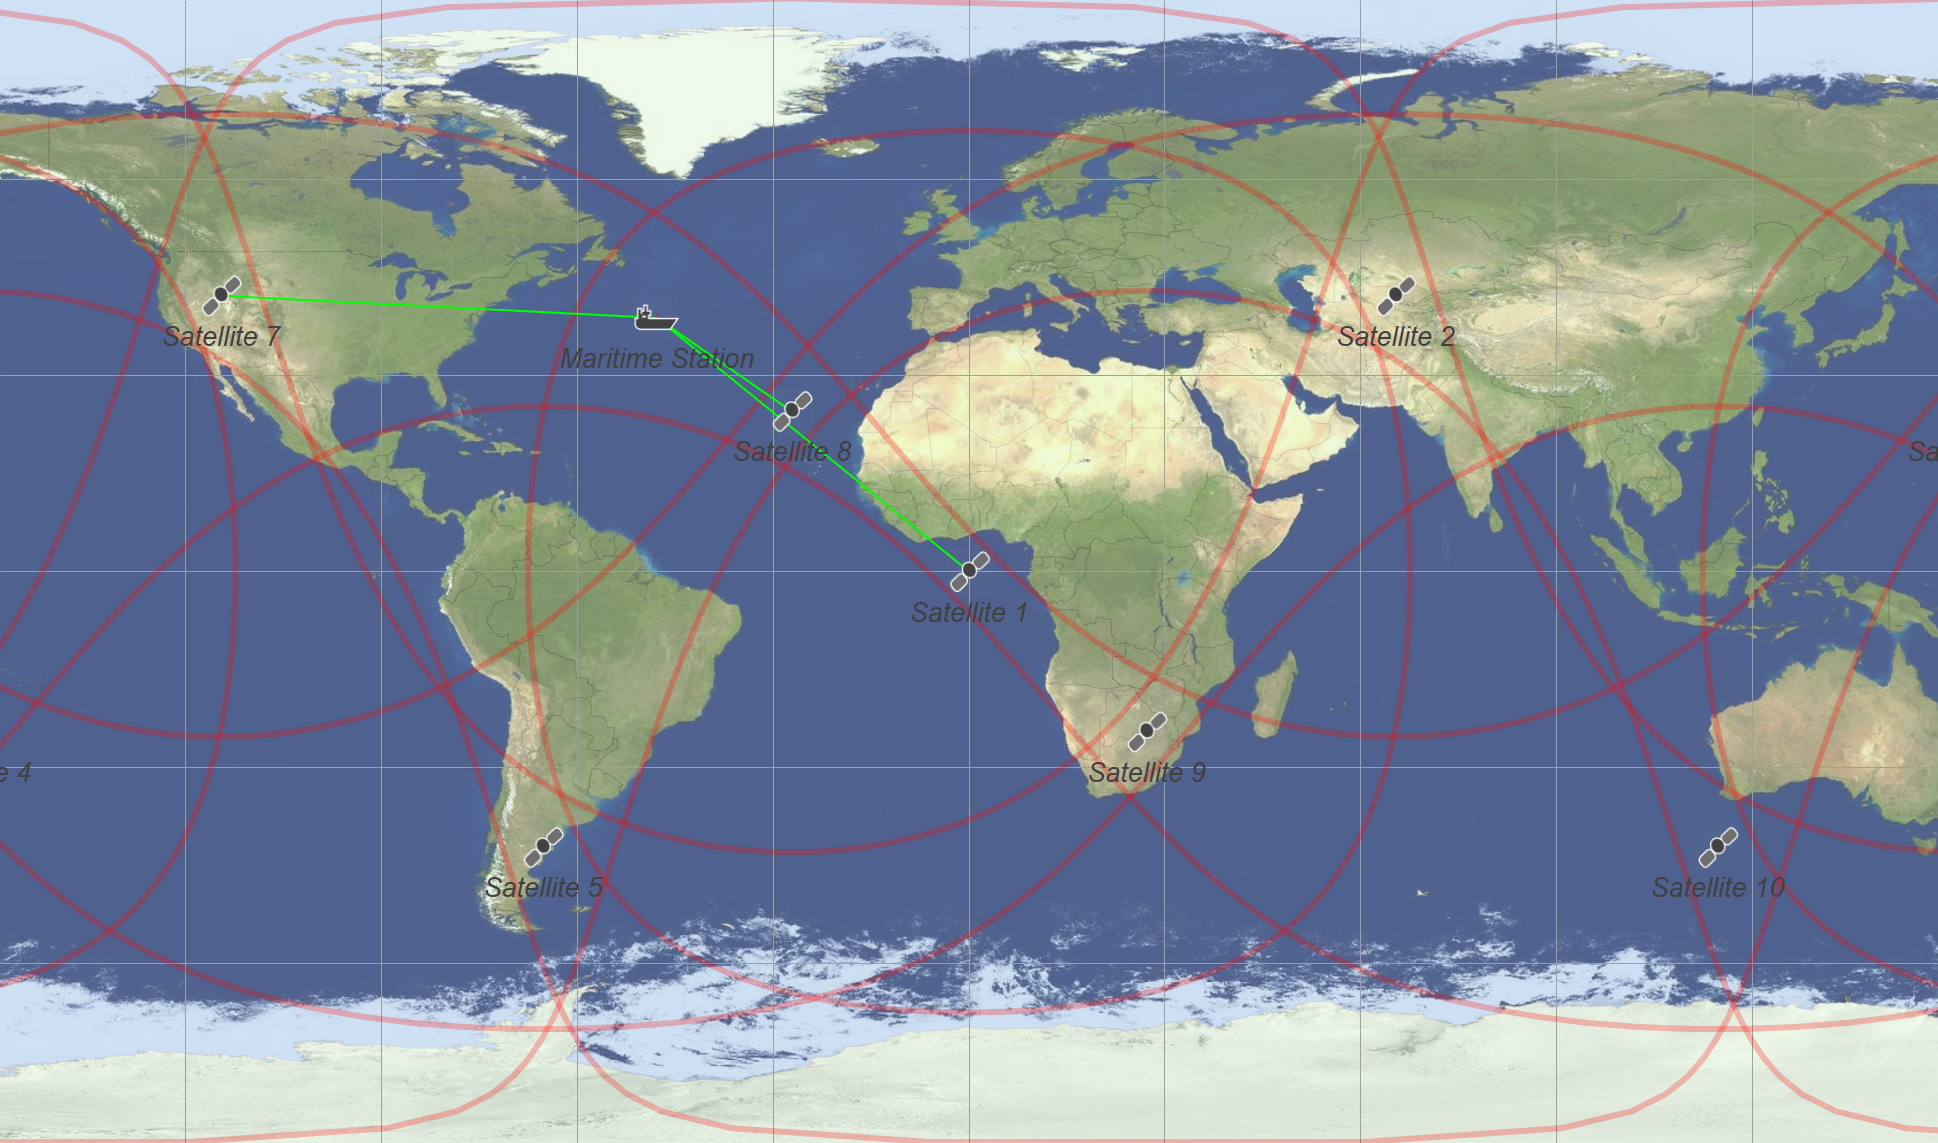
In this case a maritime station has a choice of ten possible satellites to communicate with. Some will be clearly unsuitable – such as those below the horizon as seen by the ship. Hence there are rules that can be geometric that can be used to identify unsuitable candidates. In this case a simple rule could be used:
Elevation angle of the satellite as seen by the ship should be at least 0
This is sufficient for this example as ships in open water can see down to very low elevations. In other circumstances the rules might have to be much more complicated.
In addition, there can be multiple candidates that all meet this minimal rule: in this case there are three satellites visible to the ship.
Hence the basic Tracking Strategy has two stages:
Reduction phase: select from all potential Stations a set of candidates that meet a defined set of criteria
Selection phase: from the Stations that meet the selection criteria, sort by preference and (typically) use the highest preference Station
An additional complication is that sometimes it is preferable to reduce the number of handovers and hence prefer to continue to use the end Station used in the previous time step while it continues to be acceptable (as defined by another set of criteria).
These two stages are reflected in the controls to configure Tracking Strategies as described in the following section.
Configuring Tracking Strategies
Tracking Strategies are configured via the following dialog:
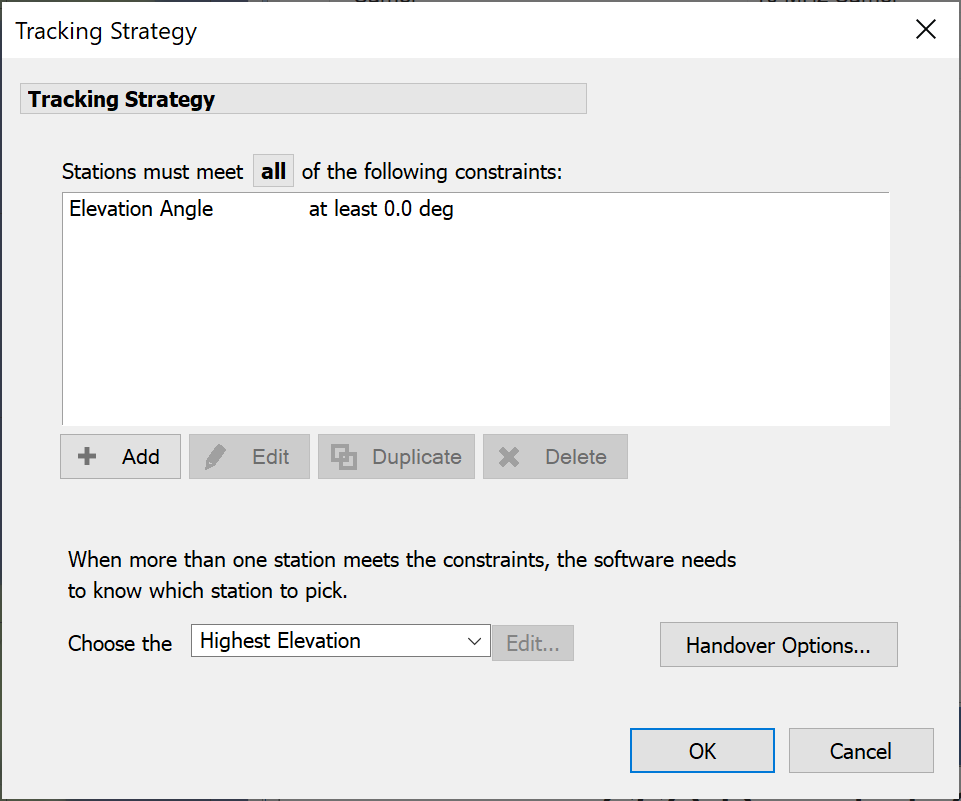
At the top is the name, as for all Visualyse Professional objects.
After the name, the dialog comprises separate sections for the various stages in the selection process:
“Stations must meet all/one of the following constraints”: this is used to define the Reduction Phase
“Choose the…Edit…”: this is used to define the Selection Phase
The “Handover Options” button can be used to give addition feature that can be used to keep tracking the Station used at the previous time step.
Each of these components are described in the following sections
Reduction Phase Controls
The reduction phase controls are shown below.
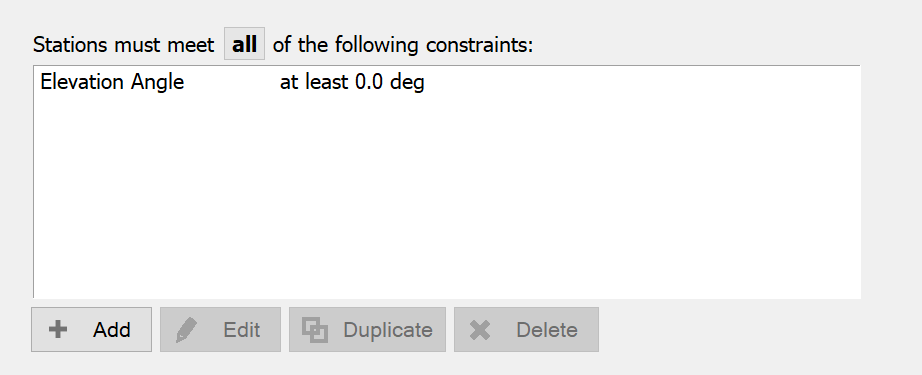
The reduction phase involves defining a number of criteria that are used to identify whether each of the possible Stations within a Group of Stations is suitable for further consideration (i.e. within the selection phase).
These criteria are geometric, using angles and distances and other geometric values derived at the start point of the Link (e.g. in the examples above, the mobile, aircraft or ship).
The first choice is whether they should all be met or whether it acceptable for the target to meet any one of them: that is done via the “All” or “One” option at the top.
There is then a list of criteria, with controls to add, edit, duplicate and delete. If you click on add you will get a dialog that identifies the types of criteria that can be used, namely:
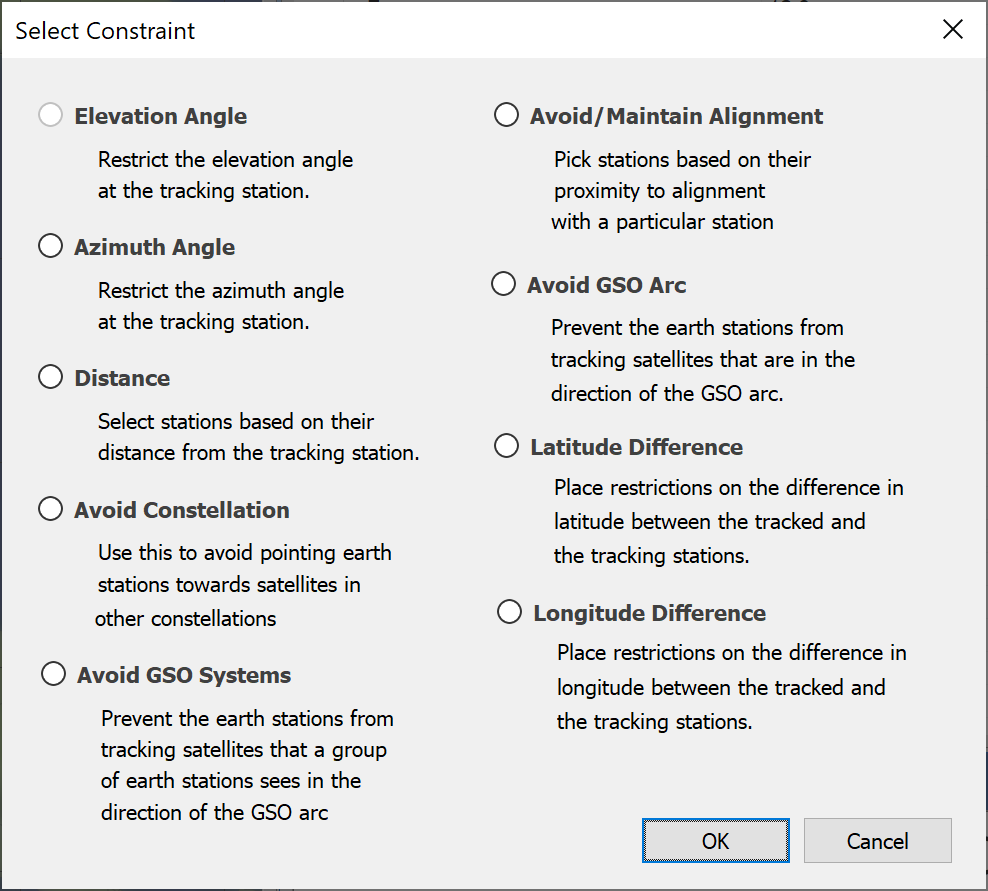
You can have as many of these constraints as you like in a Tracking Strategy. Each constraint can then be modified using the edit button, which gives options such as shown below.
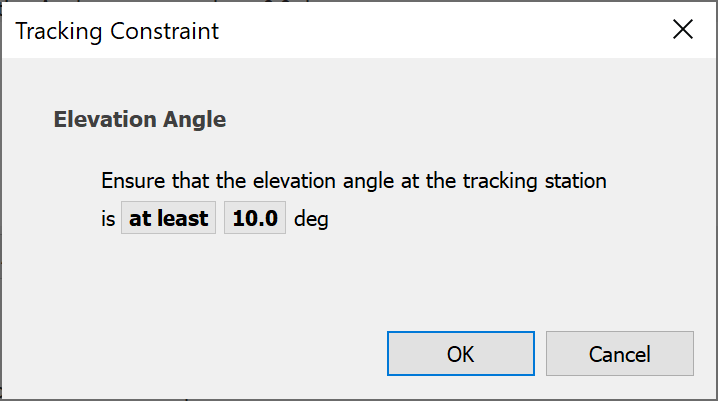
This can then be modified to change the criteria to use, which can be one of:
- Between: in which case it is necessary to enter the two extremes
- Not between: in this case it is also necessary to enter two extremes
- At least: in this case it is necessary to define the minimum acceptable value
- At most in this case it is necessary to define the maximum acceptable value
Hence in the dialog above the criteria is “at least” and the threshold is set to 10 degrees – in other words the constraint is that target Stations should have an elevation angle of at least 10.
Selection Phase Controls
The selection phase takes the sub-set of suitable end Stations from the reduction phase and orders them according to a criteria. The controls are shown below.

There are built in the following standard selection criteria:
- Highest elevation (useful for satellite selection)
- Longest hold time (based upon whether the target end Station is heading towards the tracking Station or away from it)
- Closest (useful for base station selection for terrestrial systems)
- Furthest from the GSO arc (e.g. to undertake EPFD studies under Article 22.2 of the Radio Regulations)
- Random station (this can be very useful to just use this part of the Tracking Strategy to undertake some forms of Monte Carlo analysis)
There is also an option to further customise the selection phase by clicking on “Advanced” and then defining using the following dialog:
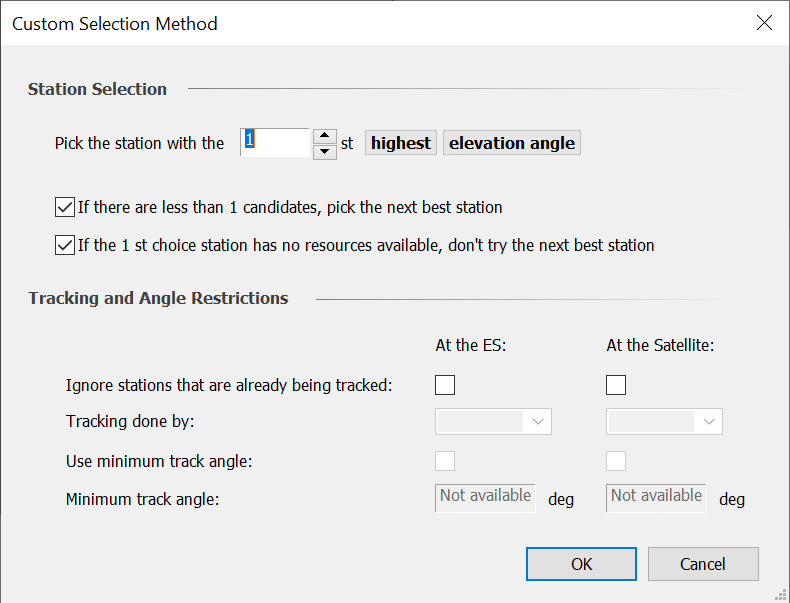
The starting point is the ordering criteria which can be one of:
- Elevation angle
- Azimuth angle
- Distance
- Difference in latitude
- Difference in longitude
Then there is the sort order which can be either highest first or lowest first, and with options to take the highest or lowest in absolute.
Finally, there is the preferred position on the list – i.e. the 1st, 2nd, 3rd etc highest on this sorted list
There are additional fields to manage this list sorting process:
- What to do if there are fewer Stations on the list than the preferred position? For example, if the preferred position is 3rd but there are only on 2 on the list. A field can be used to either select the next best or for the link to fail.
- What to do if the preferred Station has already been selected by an Antenna at the tracking Station? This would clearly be inefficient given Antennas are a limiting resource for the simulation. Hence the Tracking Strategy can check to avoid such duplication.
- The converse is what to do if there are no available resources (e.g. tracking Antennas or electronically steerable Beams) available on the preferred end Station? Should the Link fail or take the second best?
Note that the last of these effectively determines whether the Tracking Strategy returns a single Station (the preferred one) or a list of suitable ones, with the preferred one at the top.
Handover Options Controls
An option within Tracking Strategies is to once an end Station has been selected at one time step, to continue to track it while it meets a certain set of criteria. This is done by the “Handover Options” as in the following dialog:
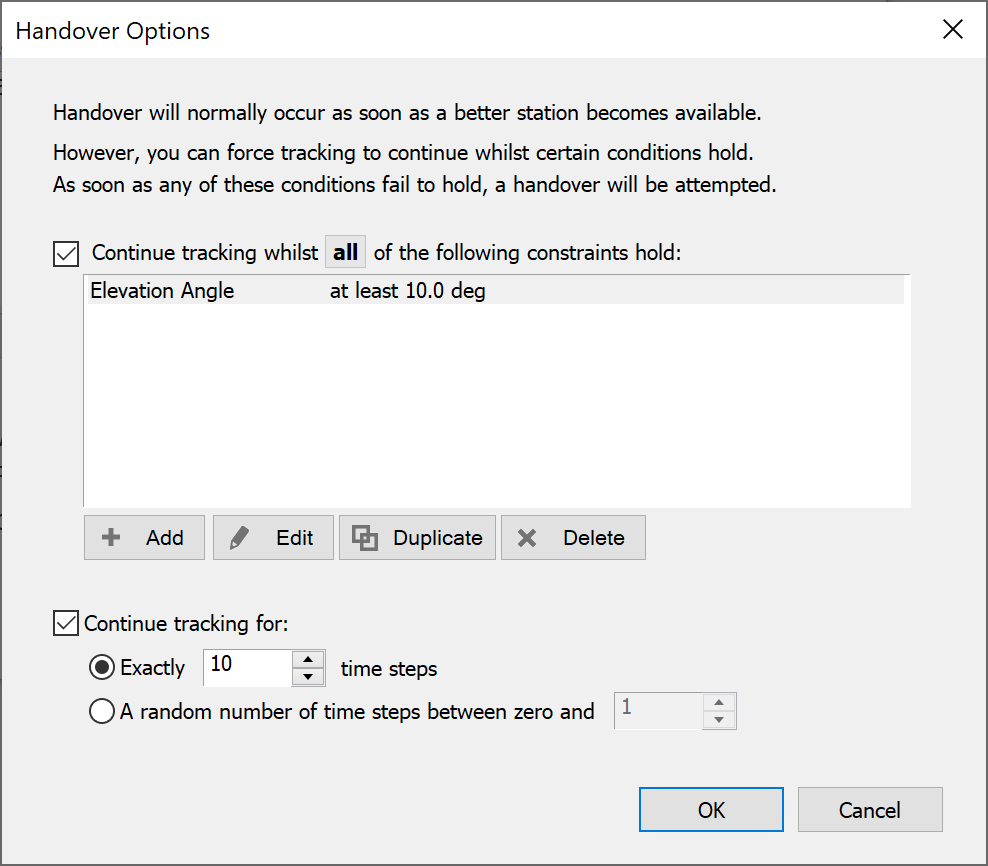
Note that these options are by default switched off so that the Tracking Strategy would at each time step start from scratch with the reduction and selection phases.
If activated it allows a set of criteria to be used to determine whether the current end Station is still suitable. These criteria are the same as those in the reduction phase described above in Reduction Phase Controls.
The handover process can also be re-set after a specified number of time steps: this can model systems that are designed to avoid handover during a call. There are therefore options to continue tracking for:
- Exactly a certain specified number of time steps
- A number of time steps selected at random with uniform density between zero and an entered value
Interference Paths
The interference scenario is defined in terms of any number of Interference Paths. An interference path consists of a wanted Link or Link Group and a number of interfering Links or Link Groups.
All Links defined in the simulation are available for selection as interferers.
Where multiple Links are defined as interferers, the aggregate interference power is automatically calculated.
The Interference Paths dialog can be invoked in the normal ways, i.e.
- Via the toolbar icon
- Via the Model menu
- By right mouse click in the Model view
There are three parts to the dialog:
- Select the Victim Links
- Select the Interfering Links
- An advanced tab where you define the interference calculation options
Select the Victim Link(s)
Select either a Link Group or a Link from the Link List. If you select a Link Group only, Interference paths will be set up for all Links in that group.
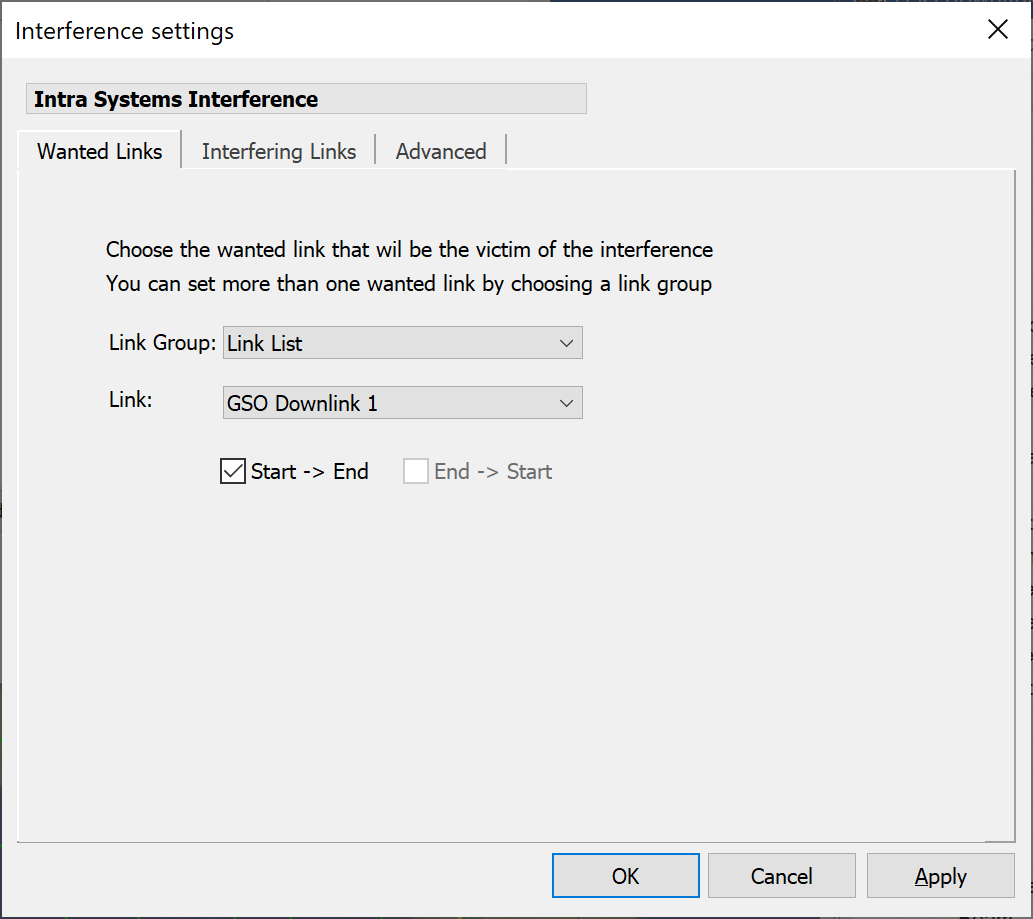
Select the Interfering Link(s)
On the interfering links tab, the list off all potential interferers is displayed in the left-hand pane. Any Links or Link Groups currently selected as interferers are shown in the right-hand pane.
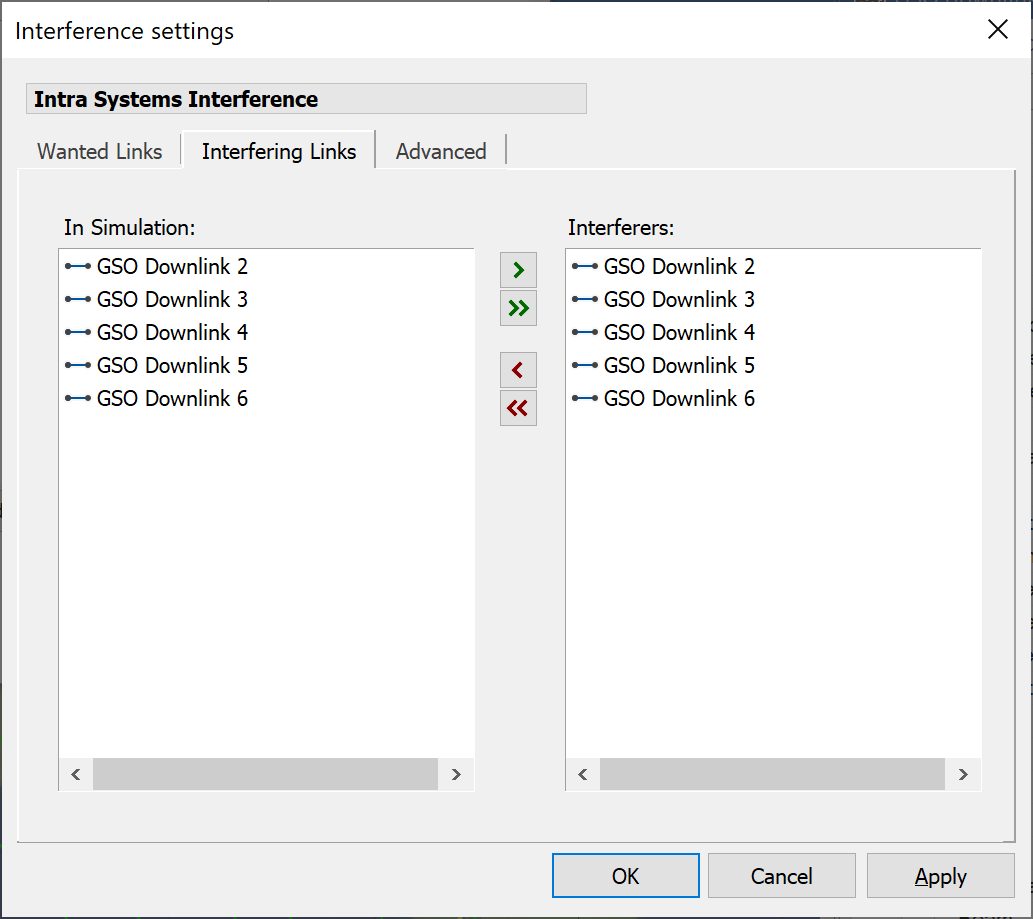
Where a Link or Link Group is bi-directional, both directions (start – end and end start) are given as options.
To include a Link Path as an interferer, move it to the right-hand pane using the arrow buttons.
Advanced Interference Path Options
The Advanced tab includes several parameters that have an effect on the interference calculation.
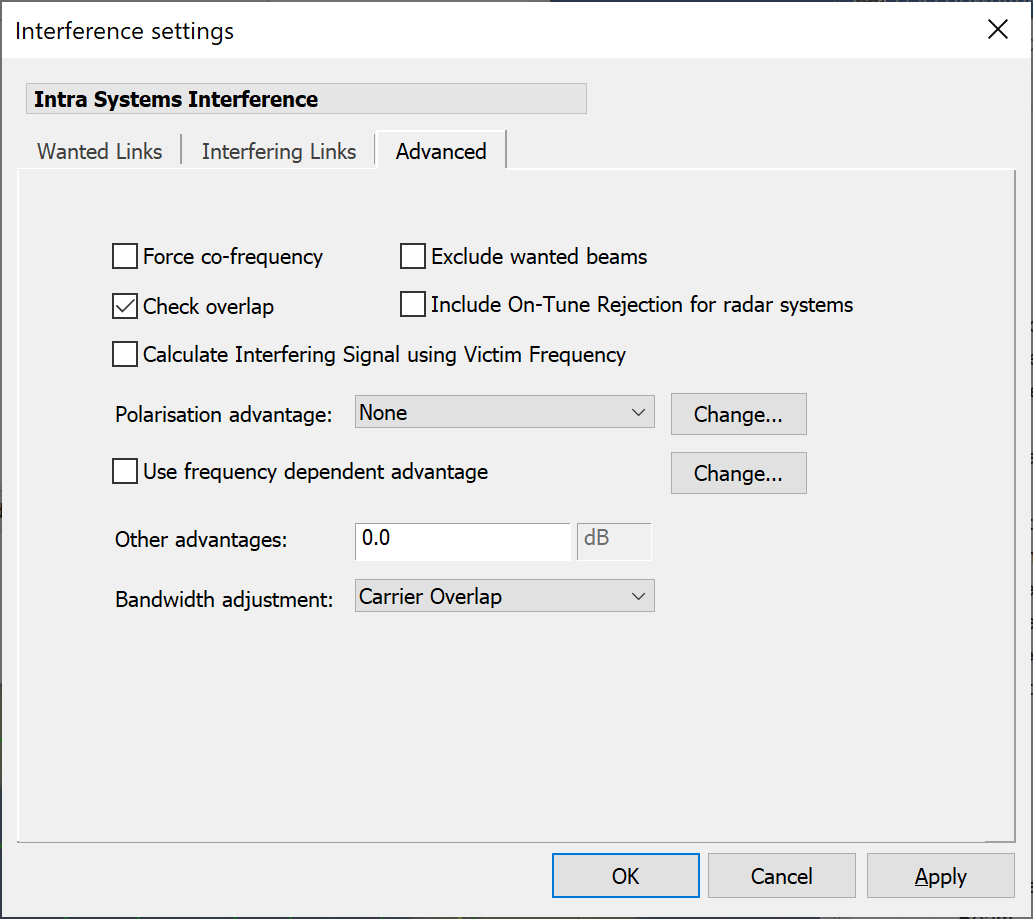
Each calculation option is described below
Force Co-frequency
Checking the “Force Co-Frequency” box forces all interfering Links to be co-frequency with the wanted Link, for this interference path only. This option is used for worst case analysis.
An example use of this option would be if many interfering Links have been entered with different frequencies according to some channel plan, and a worst-case analysis is required. The worst-case analysis may not include the channel plan. Forcing cofrequency would allow the existing Links to be used without losing the channel plan data.
This option should not really be used to scale systems from, say Cband to Kuband. The adjustment is only applied when the bandwidth overlap factor is calculated. Therefore, frequency Antenna characteristics and pathloss would not be accounted for correctly.
Check Overlap
Where out of band emissions are of interest, it may be that you want to include interferers that have no frequency overlap with the wanted carrier. In combination with frequency off-set advantage, the Check Overlap option can be used to model the effect of out of band or spurious emission.
If Check Overlap is set then all interferers must have overlap in their allocated bandwidths to be included in the interference calculation. If it is not set then interfering paths will be included whether or not they have overlap in bandwidth.
Exclude Wanted Beams
This option is useful when analysing intra-system interference and considering a Link Group as the wanted element in the interference path.
In this case the wanted Links would also be used as interferers i.e. you can select the same Link Group as the interfering element.
With the Exclude Wanted Beams option selected, interference into a particular wanted Link would be considered from all the other Links in the group, but not from any links using the transmit beam of the wanted Link.
Include On-Tune Rejection for Radar Systems
If this field is activated and the relevant Carriers have the radar fields defined, then the On Tune Rejection (OTR) will be calculated according to ITU-R Rec. M.1461 “Procedures for determining the potential for interference between radars operating in the radiodetermination service and systems in other services”
Calculate Interfering Signal using Victim Frequency
When using the IMT-MODEL gain pattern (e.g. for IMT-2020 or 5G studies) there can be a different gain pattern for co-frequency and non-co-frequency scenarios. The way to define this in the Antenna Type is described in IMT-Model Non-Co-Frequency Parameters.
By default the interfering signal is always calculated using the centre frequency of the interfering link. However to activate the non-co-frequency gain patterns it is necessary to use the centre frequency of the victim link.
This can be achieved by checking the option “Calculate Interfering Signal using Victim Frequency”.
If this is enabled then the interfering signal will be calculated using the victim centre frequency and hence allow the antenna type to identify if the path is co-frequency (to the IMT-MODEL antenna) or non-co-frequency.
Note that this will not affect other calculations, in particular the mask integration adjustment or NFD.
Polarisation Advantage
When polarisation advantage is included, the interfering power level may be reduced by a set amount.
The options available in the drop-down list are:
- None
- ITU Radio Regs
- User Defined
The table below shows the numerical ratios to be used for polarisation isolation between two carriers when the Radio Regulations option is selected.
When User Defined is selected, this table is available for editing via the dialog below. By default, the advantage is only applied when there is main beam to main beam coupling between the wanted receiver and the interfering transmitter. The same user defined table is used for all Links
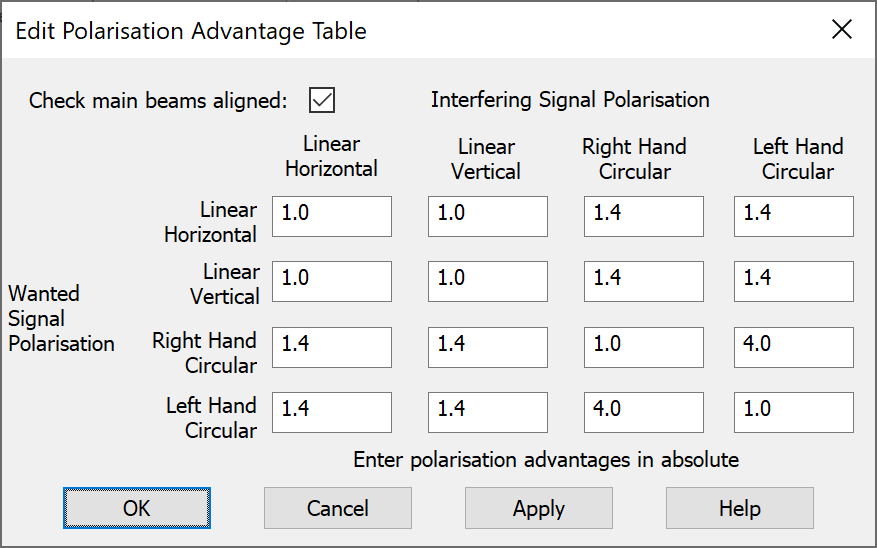
Frequency Offset Advantage
It is possible to define a dB advantage relating to the offset of the centre frequencies of the wanted and interfering carrier. The effect is to reduce the interfering carrier level or (equivalently the wanted receiver response) by a number of dBs at each defined frequency offset.
This could be used, for example, to model the out of band interference of a narrow band carrier into a wide band receiver with a known filter characteristic. The filter characteristic would be reflected in the off-set advantage.
Details of the effect on the interference calculation are given in the Technical Annex.
If multiple interferers are defined, they will all be affected by the frequency off-set advantage.
To use this advantage make sure the Use Frequency Dependent Advantage’ box is checked. The characteristic shape can be edited by clicking the Change button. The following table will then be available.
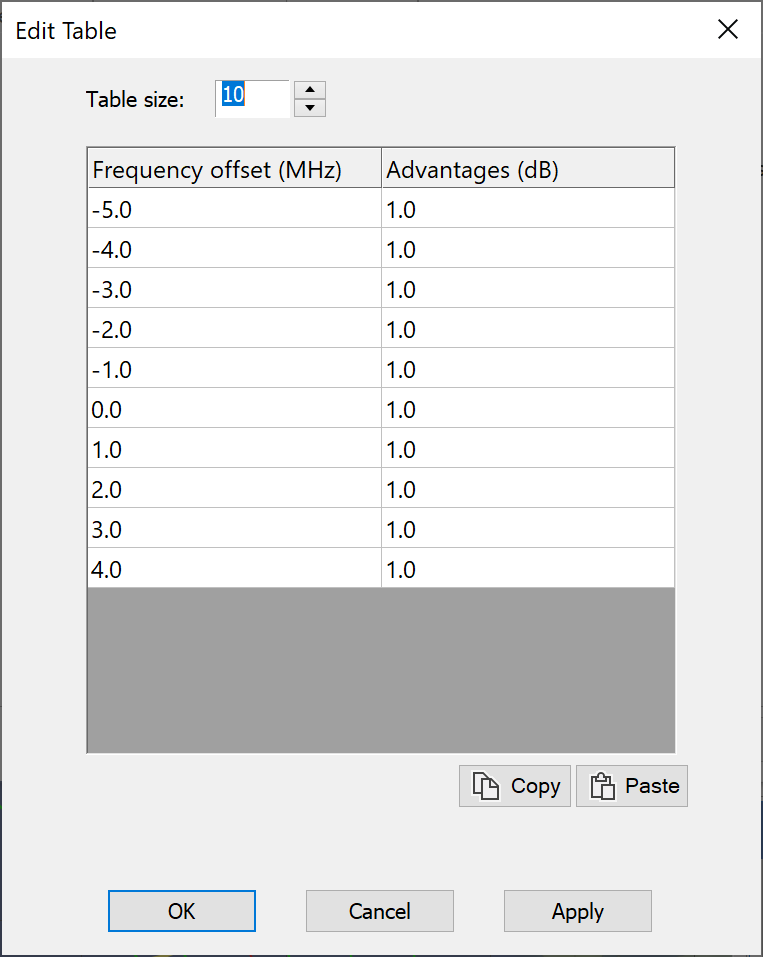
You edit the table directly or use Copy/paste of data from other applications.
Other Advantages
The Other Advantages field can be used to specify a dB value to be added or subtracted from each interfering signal. This may be used in a number of ways. For example, a real value for polarisation advantage might be known from Antenna performance data and from the polarisation plan definition. The polarisation isolation would be entered as a positive number in this field.
Alternatively, this factor could be used to model carrier fading (when C/I is being considered) by entering a negative number in this field. The negative number may be equal to the expected rain fade for example.
Bandwidth Adjustment Factor
The various possibilities for bandwidth adjustment factor determine how the overlap between the wanted and interfering carrier is taken into account.
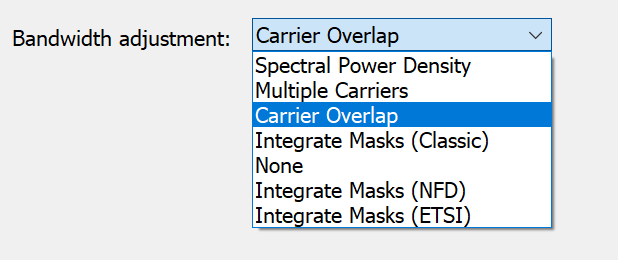
The options available are:
- Based on spectral density - ignoring bandwidth factors and taking the ratio of spectral densities as the C/I
- Assuming multiple interfering carriers - where the interferer has a narrower bandwidth than the wanted carrier, interferers are stacked into the wanted carrier bandwidth. If the interferer has a wider bandwidth than the wanted carrier then the overlap of the two is calculated.
- Based on overlap of a single carrier - this explicitly calculates the proportion of the interferer that falls into the wanted bandwidth
- Integrate masks – calculates the Net Filter Discrimination (NFD) based upon the TX and RX masks. There are a number of alternative NFD calculation methods as described in the Technical Annex.
- None - the ratio returned in this case is just the ratio of the total received powers of the wanted and interfering carrier at the wanted receiver.
Each option is described in detail in the Technical Annex.
Configure and Run Simulations
This section of the User Guide concerns the set-up and analysis of simulation runs, using elements and a scenario already created.
This section is structured in the following way.
Run Parameters describes how to set run parameters including duration, time step resolution.
View Properties gives details of how to change the properties of the map and 3D view windows to improve the graphical feedback you are getting from Visualyse.
Change Variable Wizard shows how to modify large groups of objects using the Change Variable wizard.
Run Parameters
This section describes the default options that can be defined in Visualyse, and also how the different views can be configured. Configuration of the graph views is described in Graphing .
Visualyse Default Parameters
A number of default settings will apply to all simulations opened on your PC. These settings are defined via the File menu item.
Selecting 'Visualyse Settings' from the File menu brings up the following dialog box.
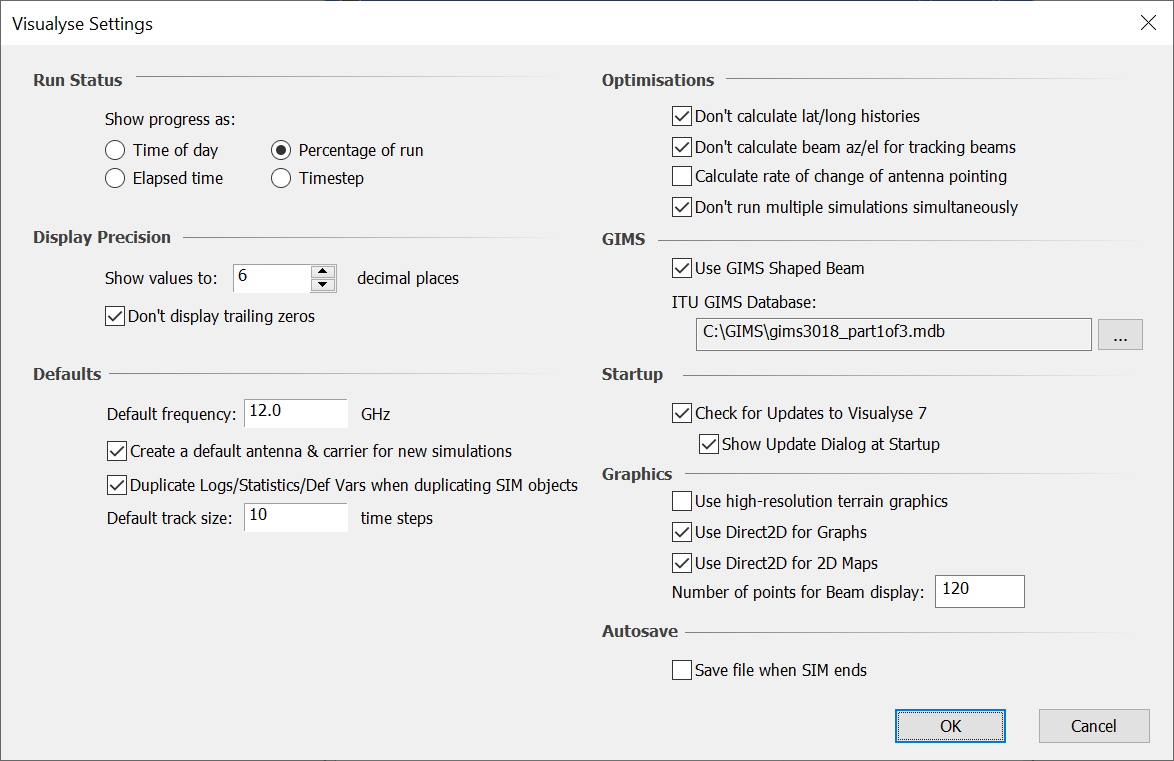
Run Status (shown in the bottom right of the can be displayed in one of four ways:
- Time of day – the current simulation day, hour, minute, second and millisecond is shown
- Percentage Run – based on the number of time steps specified and the number already executed, the percentage of the run completed is shown
- Elapsed time – shows the elapsed time simulated since the start of the simulation
- Time step – the number of time steps already executed is displayed.
Display Precision determines how many decimal places are shown in the calculated fields in Visualyse dialogs. You can also determine whether to trim all trailing zeroes.
Defaults – when objects are created in Visualyse they have an associated frequency. This can be edited in the object dialog, but initially will be simulation default value that is set here. You also decide whether an antenna and carrier are created by default in each new simulation and whether Logs/Statistics/Define Variables are duplicated when duplicating SIM objects. The final option is the default size of the ground track.
Optimisations may have some effect on the speed at which a simulation runs:
- Calculation of lat/long histories is needed if you are going to display ground tracks. If not they are simply an un-necessary overhead
- Calculation of beam az/el for tracking beams is needed if you are going to collect statistics or do some other analysis on these pointing angles. Within Visualyse geometry is calculated in our internal Cartesian co-ordinates and for beam that track, the simulation can work directly in these co-ordinates.
- Rate of change of antenna pointing: only enable this option if you are interested in it specifically.
GIMS – selecting the ‘Use GIMS Shaped Beams’ option means that when using contour beams, the interpolation to points between the contours will use the GIMS algorithm rather than any of the other options that you can define in the Antenna Dialog. It is important to note that if you do not have the latest GIMS DLLs installed on your PC, this function will not work and the software will default to linear interpolation, no error message will be generated when this happens.
You can also set the location of the ITU GIMS Database by clicking on the "..." button and selecting an appropriate database.
Startup – check for updates. You can get Visualyse Professional to by default check online for a new release. This might require you to change the settings on your firewall to give Visualyse Professional permission to access the internet.
Graphics
- Use high-resolution terrain graphics – You can set whether Visualyse Professional will use high-resolution graphics when drawing terrain data on the Map Views. Note: users with limited graphics card memory are advised to leave this unchecked (the default setting).
- Use Direct 2D for Graphs – Disable this setting on PCs where there are noticeable performance issues when displaying graphs with a lot of graphical elements. Note: this only tends to happen on low powered graphics cards.
- Use Direct 2D for 2D Maps – Disable this setting to use “classic” OpenGL. This may be beneficial in some scenarios.
Autosave – save when SIM end. You can set whether Visualyse Professional will automatically save the file when the SIM reaches the end.
Population Data Settings
Selecting “Population Data Settings” from the File menu allows you to set the directory that contains the population data files:

The population database is the NASA gridded population of the World (GPW). This gives the population in each 30 arc-second pixels over the Earth’s surface from 60S to 85N.
The data was downloaded from the Centre for International Earth Science Information Network (CIESIN) at Columbia University as described here:
http://sedac.ciesin.columbia.edu/data/set/gpw-v4-population-count-rev11
Note the recommended citation for use of this data is:
“Center for International Earth Science Information Network - CIESIN - Columbia University. 2018. Gridded Population of the World, Version 4 (GPWv4): Population Count, Revision 11. Palisades, New York: NASA Socioeconomic Data and Applications Center (SEDAC). https://doi.org/10.7927/H4JW8BX5”
The data was provided as 8 text format tiles of size 90° x 90° in (latitude, longitude), in total nearly 5 GB of data. To facilitate its use within Visualyse, this data was converted into just over a thousand binary files covering 5° x 5°, each just over a megabyte in size, then collected into a zip file.
Two versions of this data were processed, namely that for 2015 and 2020. These can be downloaded from the Transfinite website:
https://www.transfinite.com/content/population_data
Having downloaded the relevant zip file, the files it contains should be extracted into a directory on your PC, for example something like:
D:\5_deg_population_files_2015_gpw-v4-rev11
D:\5_deg_population_files_2020_gpw-v4-rev11
Note that Visualyse Professional checks the directory to ensure there are the required number of files and they all are the right size.
More information is available in the White Paper on using Population Data in Visualyse Professional.
Run Time Parameters and Simulation Control
Selecting Time Settings from the Simulation menu, brings up the following dialog box
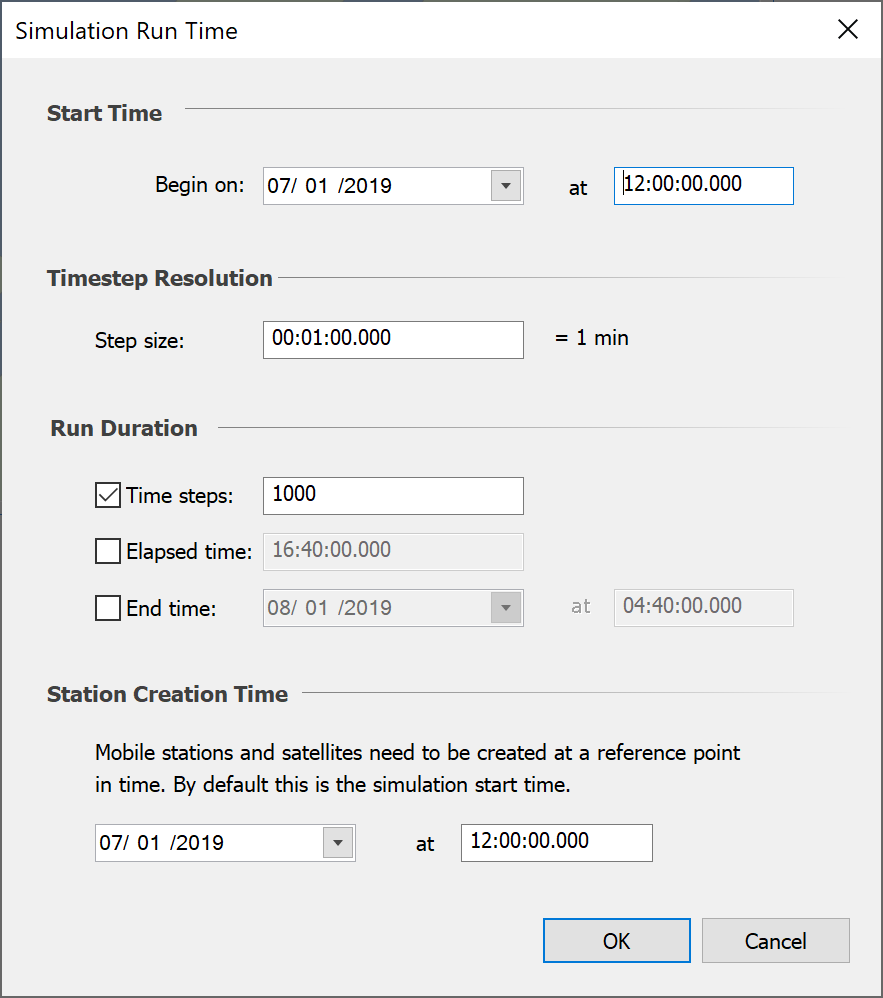
This is where the simulation start time, time step size and run duration parameters are defined.
Start Time
Selecting a date and then a time sets the simulation start time. Click on the date field and a popup calendar will appear. From here you can select a date.
The dates for the current month are shown. The currently selected date is highlighted in grey. Today’s date is shown with a red border around it. You can select another date in the current month by clicking on it. At that point the popup will disappear. You can automatically select today’s date by clicking the Today button.
The black arrows allow you to change forward and backwards through the months. If you click and hold where the month is displayed, a pop-up will appear. From there, you can select from months around the currently selected month. If you try and select beyond the range in the pop-up, the list will scroll.
You can also type directly into the date field. The software will recognise a number of different formats including all the standard abbreviations for months and years.
Once the date has been set, you can then move on to change the time. The time can be entered in the edit box.

Note that you can type in a time that includes seconds or milliseconds. When seconds are present, the time is shown in the “00:00:00” format. When milliseconds are present, the time is shown in the “00:00:00.000” format.
Time Step Size
The most important time related parameter in most dynamic simulations is the step size. To change the time size, simply change what is written in the box. The software will take care of any problems with formatting. You can type the elapsed time in a number of formats. All of the following are accepted:
| Typing | Interpreted as |
|---|---|
| 3:30 | three hours and thirty minutes |
| 2 days 45 mins | two days and forty-five minutes |
| 1 mth 2 hrs 45 secs | one month, two hours and forty-five seconds |
| 1:20:3.34 | one hour, twenty minutes, three seconds and 340 milliseconds |
Once you have finished typing, press the return key, or tab away from the control. The return key will not close the dialog under these circumstances.
Run Duration
Run duration can be specified in one of three ways:
- From the number of time steps
- By defining the total elapsed time
- Selecting picking an end time
You can select which of these options you want to use by clicking on the appropriate check button.
If you choose to specify a number of time steps, the elapsed time and end time will automatically be calculated and displayed. The equivalent applies for the other two. That way, all three are kept in synch.
To change the elapsed time, simply change what is written in the box – the formatting is the same as for the time step size above.
If the elapsed time or end time options are selected, the number of time steps will be recalculated.
Simulation Video Style Controls
The simulation can be controlled from the Simulation menu or by mouse clicks on the video controls
The video control buttons are shown below.

Each control is now described (working from left to right)
Reset
This resets the simulation to t = 0. All statistics collected are erased if the simulation is reset. Pressing this is equivalent to selecting reset from the Run menu.
Stop
This stops the simulation. This is equivalent to selecting Stop from the Run menu.
Pause/Step
The first time this button is pressed, the simulation is paused. Each subsequent time, the simulation is progressed by a single time step. This is equivalent to selecting Pause from the Run menu. The space bar can also be used to pause and step the simulation. However, the space bar only has this function when running in Interactive mode.
Run Interactive
This sets the simulation running, updating all views at each time step. This is equivalent to selecting Run Interactive from the run menu.
Run Non-Interactive
This sets the simulation running without updating any views. This gives optimum performance. Pressing this button is equivalent to selecting Run NonInteractive from the Run menu. The simulation can be run even faster by pressing the space bar whilst running in Non-Interactive mode. This switches off all updates including those to the status bar.
View Properties
Visualyse Professional includes a number of different types of View Window accessible from the Window menu or from the toolbar icon shown:
 Plate Carrée view – a plane projection view of the simulation
 Mercator view - a plane projection view of the simulation
 3D view – an orthomorphic perspective projection view of the simulation from a point in space
 Model view – a hierarchical view of the objects in the current simulation
 Watch window – select a number of variables to ‘watch’ in a window
 Table view – displays multiple parameters across multiple objects, e.g. look at the I/N of all victim Links within a Link Group
 Terrain profile
 Frequency view
Each of the different types of view window can be customised in various ways. This section looks at the properties of each of the views.
Map View
There are two forms of map view showing two types of projection, namely Plate Carrée and Mercator. For more information on these projections see:
http://en.wikipedia.org/wiki/Map_projections
These views can zoomed and panned using the move by:
- To move the map: click the left mouse button and while held down move the move
- To zoom the map in and out: use the mouse scroll wheel
There are a number of mouse “modes”, including:
 Default mode – mouse moves the map
 Station move mode – mouse used to move stations
 Zoom mode – mouse used to select area to zoom into
 Terrain mode – mouse used to select area to load terrain region (see Modules User Guide)
 Path profile mode – mouse used to create new path profile (see Modules User Guide)
 Move path profile mode – mouse used to move any of the path profile start or end points (see Modules User Guide)
 Land Use mode – mouse used to select area to land use terrain region (see Modules User Guide)
Selecting Properties from the View menu (with a Map window active) or  button from the toolbar brings up the Edit Map View dialog.
The properties dialog is also one of the options on the pop-up menu that can be accessed by right clicking on the map, as shown below:
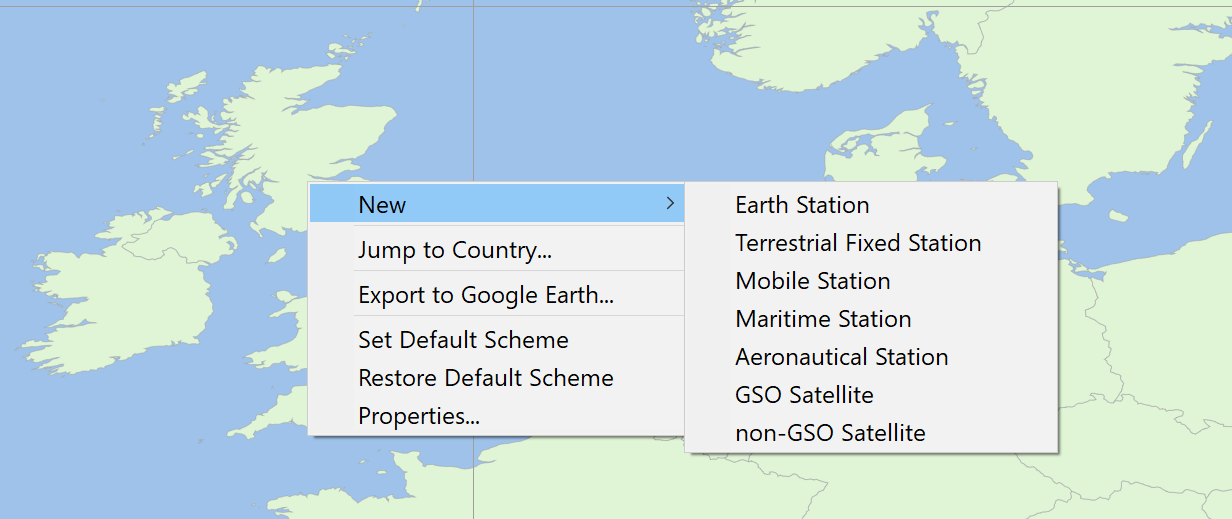
Note a slightly different menu will appear if you right click in locations where there is an Area Analysis, as discussed in Area Analysis Pop-Up Menu.
This menu can be used to:
- Create a new station at the position clicked
- Jump to a specific country as in the figure below:
- Export to Google Earth (as described in Interface to Google Earth)
- Set the current view configuration as the default one so that all new views of that type will open configured to look identical to the present one
- Restore Default Scheme: to change the configuration of the current view back to the default values
- Properties: this opens up the view properties dialog.
The view can be copied to clipboard using the Edit menu option or toolbar icon ![]() .
.
The map view properties dialog consists of five tabs:
- Features – the most regularly used features are presented in this tab
- Adornments – grids, titles and tick marks are defined here
- Overlays – here you can add Area Analyses, Terrain colours, Land use data and user defined bitmaps to enhance your output.
- Path Profiles
- Countries – schemes for colouring the map by country groups are defined here.
Each tab is described in the following sub-sections.
Features Tab
The General tab is shown below.
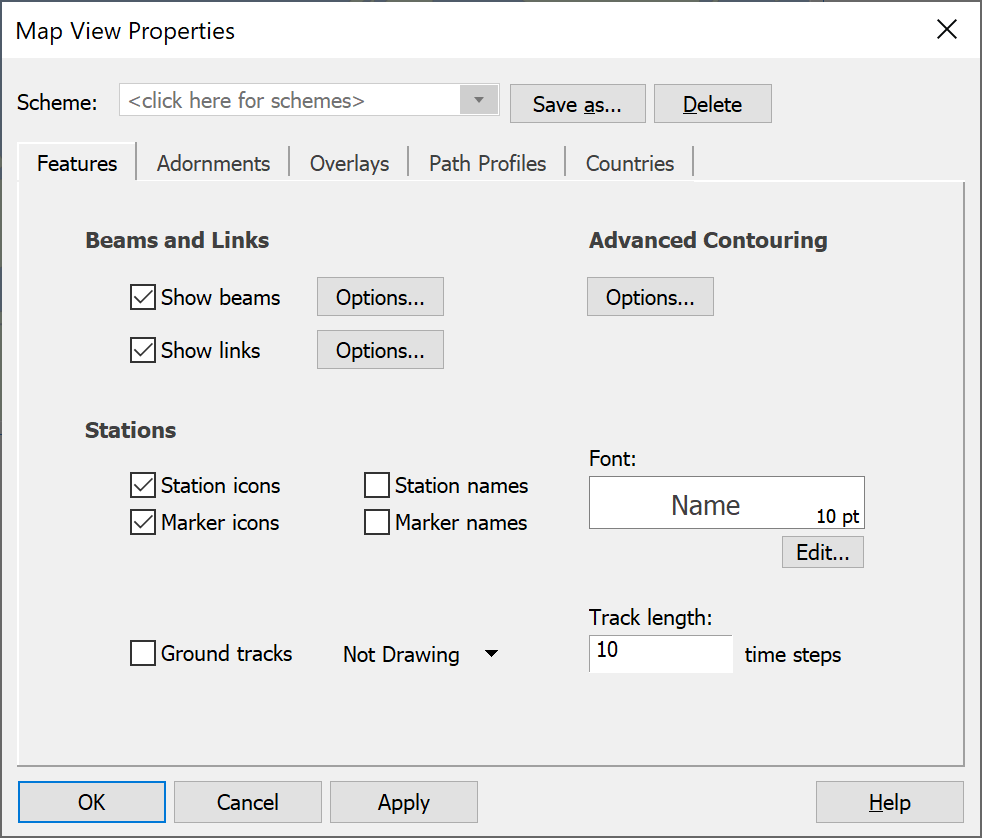
Switch the beam footprint and the Links on and off by checking or unchecking the boxes. The options buttons allow you to change the display properties.
Beam Options
To change the beam display options, click the options button next to “Show beams”. This will bring up the beam display options dialog (shown below).
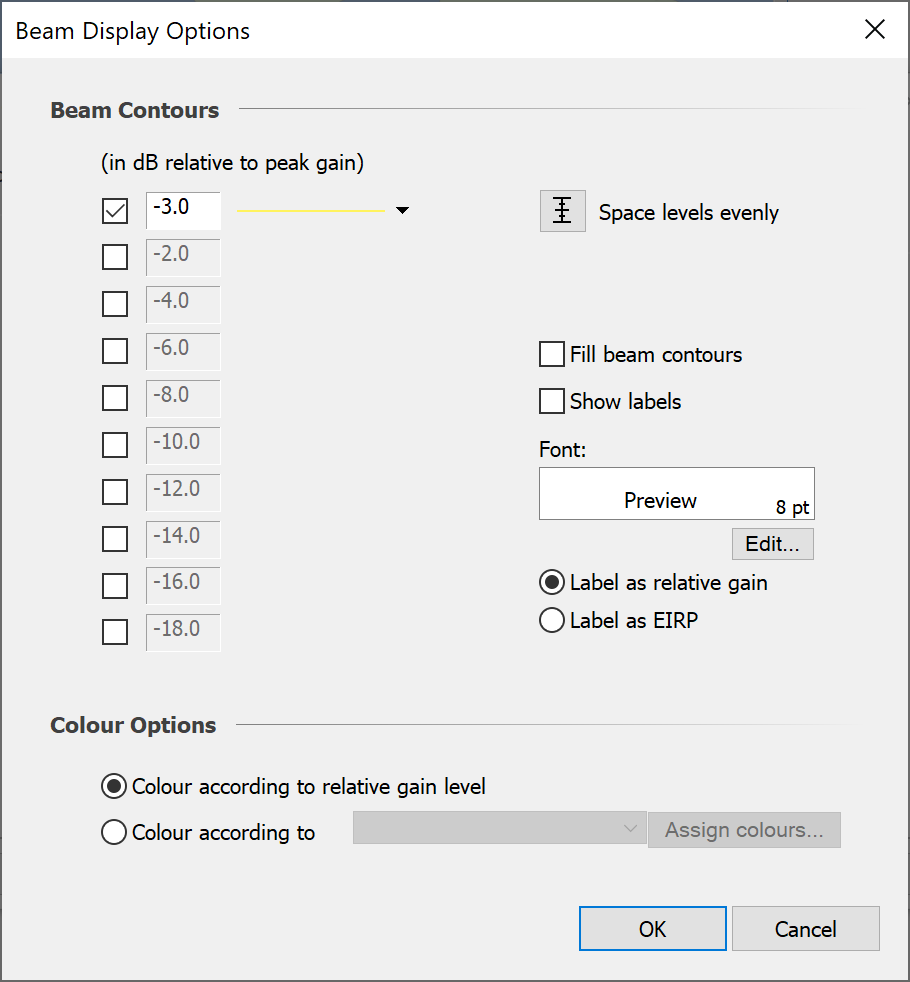
The dialog is split into two sections. The first section allows you to specify the footprints you want to display and their relative gain levels. Line styles can be selected for each beam contour that is being displayed.
If you want to display several footprints between two relative gain levels, set the top and bottom contour levels to the extreme values and click “Space Levels Evenly” to automatically set the levels for the footprints in between.
There is an option for filling the beam footprints with the line colour. Label display and formatting is also user definable.
The “Colour Options” section allows you to choose how the beam footprints are coloured when displayed on the map view.
The default option allows you to colour each footprint according to its relative gain level. Clicking next to the box where the level is set, sets the colour and line style.
The other option is to colour beams according to the Station Group, Station, or Antenna that they belong to.
To choose which one of these you want to colour by, select the ‘Colour according to’ radio button and click on the drop-down box activated next to the button.
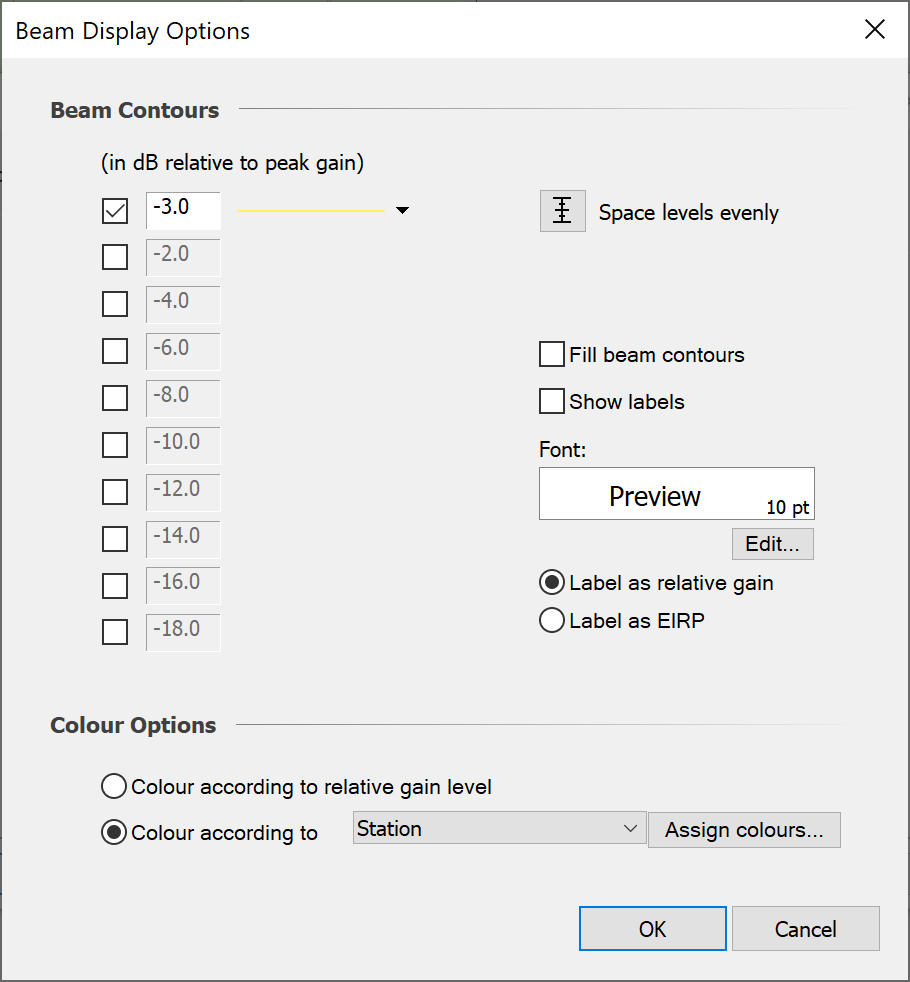
The levels are still set at the top of the dialog. However, the colours are assigned according to the Group / Station / Antenna / Antenna Type.
To change the colours associated with each Station Group, Station, Antenna, Antenna type, click Assign Colours. This will open the Assign Beam Colours dialog.
This dialog allows you to navigate to the objects you have chosen to colour by and select a colour and line style to apply to the beams.
Link Display Options
To change the link display options, click the Options button next to Show links. This will bring up the Link Display Options dialog (shown below).
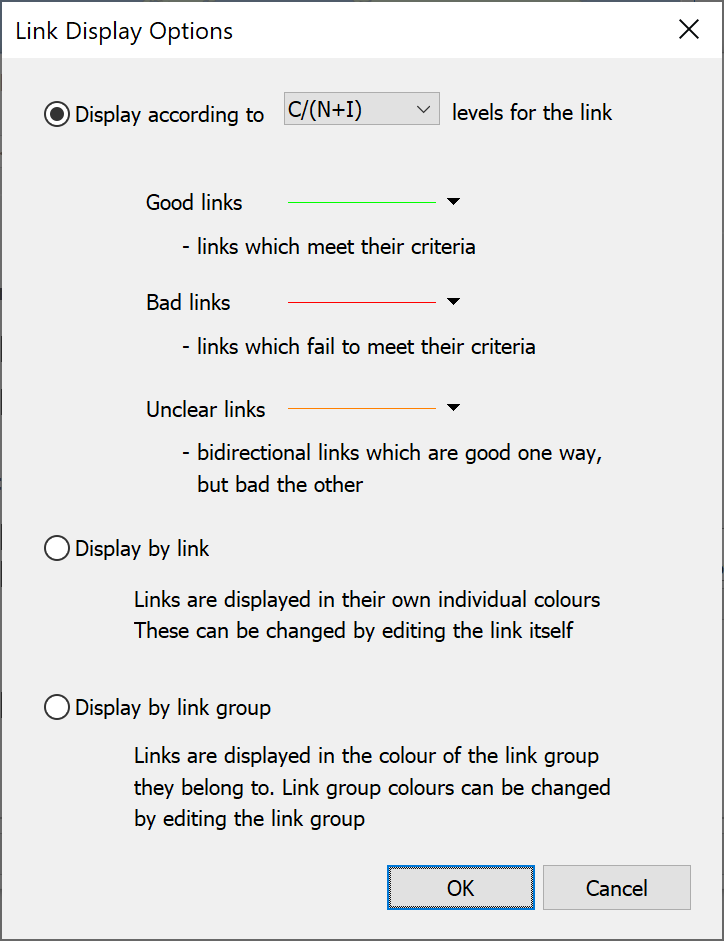
There are three options. You can display links according to one of the interference parameters (I, I/N, C/(N+I) etc.). The interference parameter is chosen from the drop-down list. You can then choose the colours for good, bad and unclear links.
The other two options allow you to display the links in their own colours or in the colours of the link group. These colours are set by editing the individual Links and Link Groups themselves.
Station Options
Station names can be switched on and off for normal stations and for marker stations. The font can be set as well. All fonts will now be displayed at the font size you choose.
Station ground track length can now be set on the dialog – note that this track length is applied to all map and 3D views. Colour and line style are set using the new line style control.
Advanced Contouring
This option can be used to produce contours that show how link and station variables change over an area. For example it could show contours of where the interfering signal strength reaches a certain level.
As this is similar to the Area Analysis it is described further in Advanced Contouring using Groups.
Adornments
Adornments can be added to the view to explain what is being displayed or to enhance its appearance. The dialog is shown below.
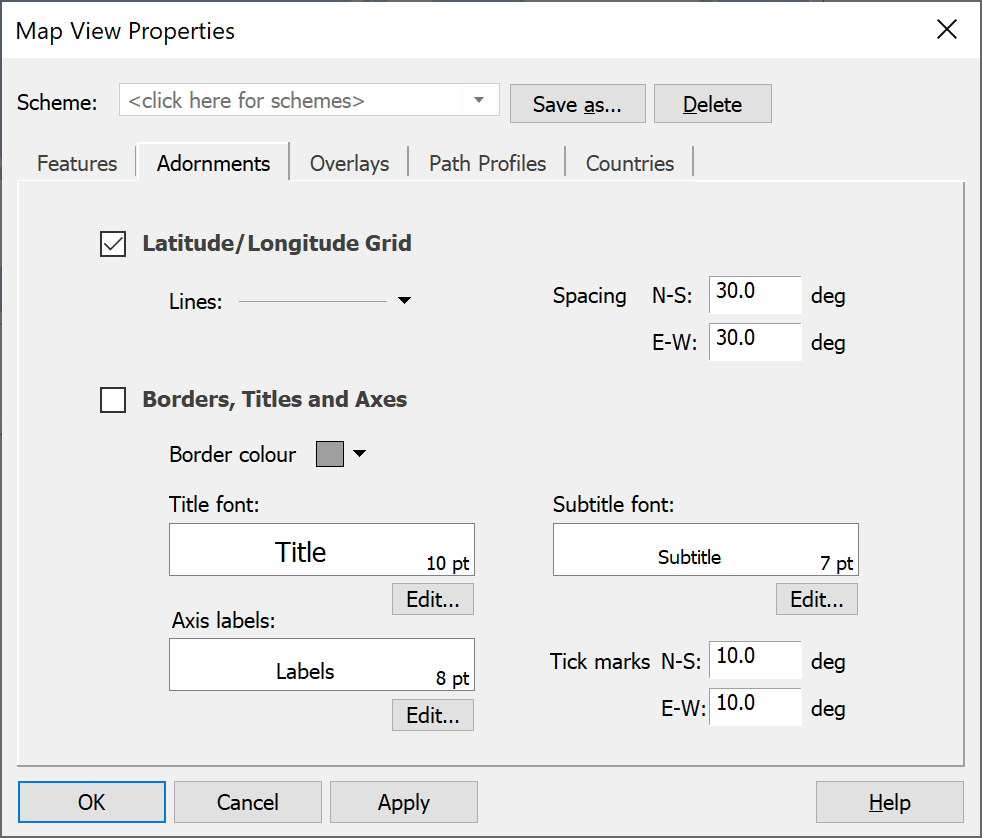
There are two sections to the adornments tab. The first deals with the latitude/longitude grid and the second deals with borers titles and axes.
Latitude/Longitude Grid
You can show or hide the latitude/longitude grid by ticking the check box at the top left of this tab. You can also set the line style for the grid lines. The grid size is defined by latitude and longitude spacing – type the number of degrees you want between each grid line in the boxes on the right-hand side of the dialog
Border, Title and Axes
If you switch this option on, a border will appear around the map area. You can change the colour of the border by clicking in the colour box.
The view title and subtitle are displayed in the centre of the top part of the border. Labels are shown along the latitude and longitude axes. You can set the spacing for tick marks on these axes. The fonts for all these can be adjusted.
When all the adornment options are switched on, the view will look something like the one below.
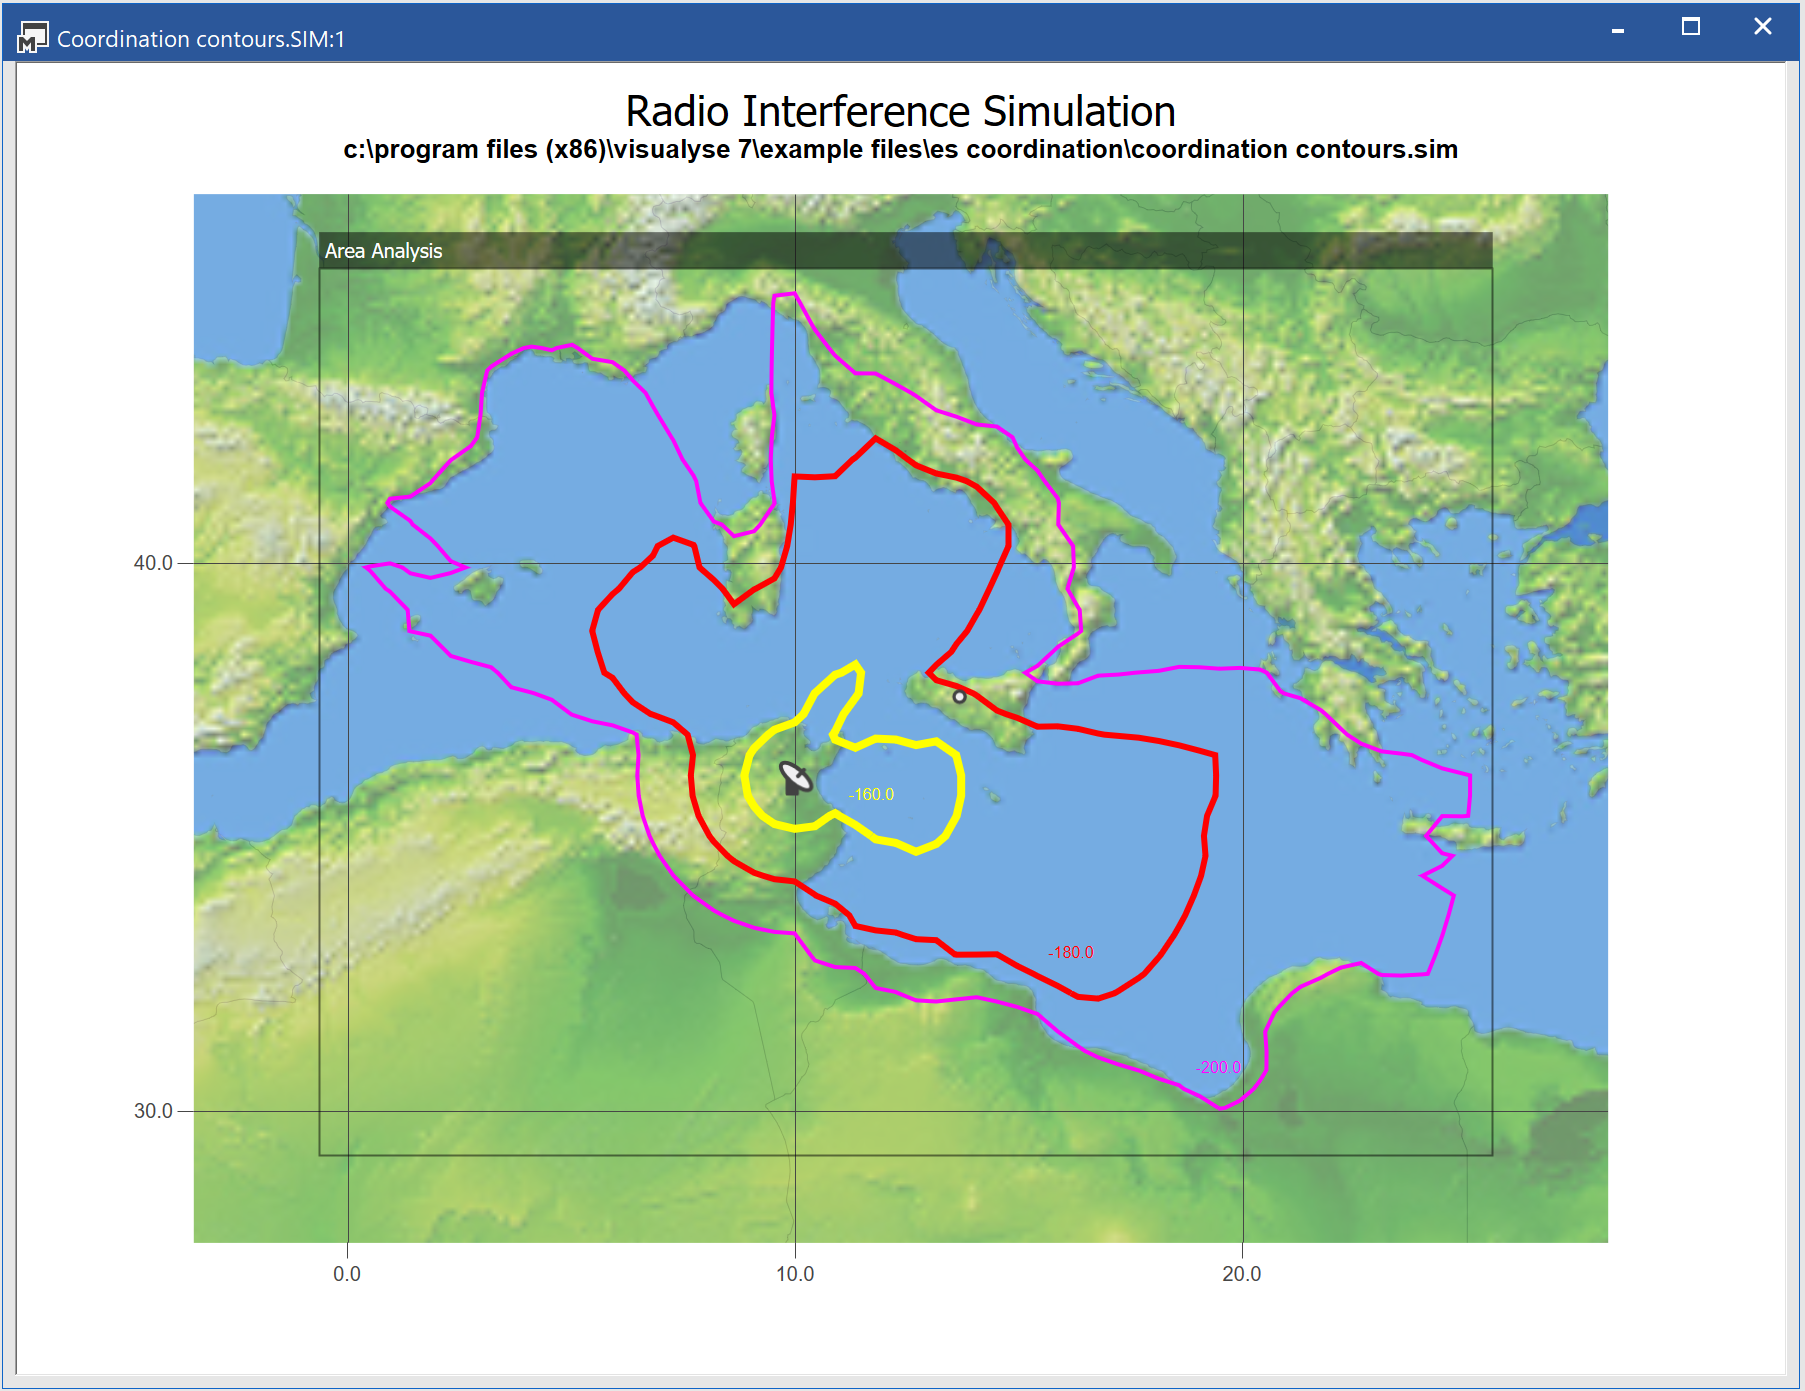
Overlays
The overlays tab allows you to add features to a map which will enhance your output aesthetically and can also add a large amount of easily digestible information.
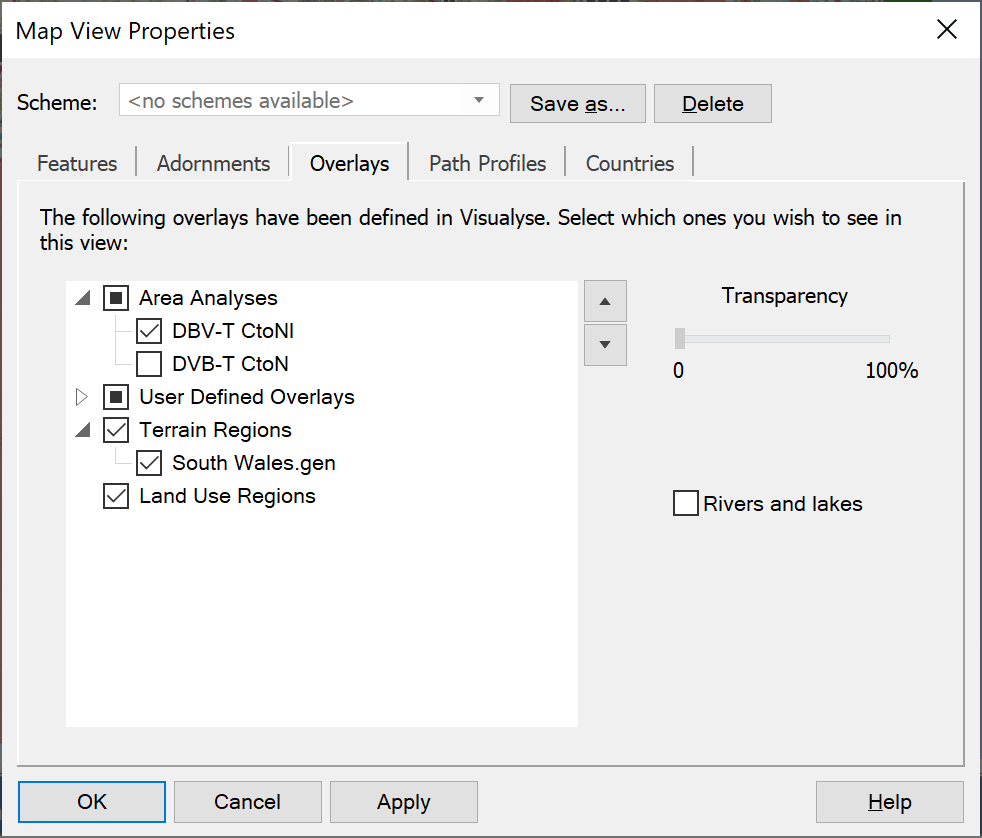
Overlays fall into four categories:
- Area Analysis – any analyses produced so far in the simulation can be overlaid on all views
- Terrain regions – if terrain data are included they can be selectively displayed as a colour coded overlay
- Land Use Regions – used in the determination of clutter loss, Land Use data can also be displayed as colour coded overlays.
- User Defined Overlays – allows you to add additional information onto the view including point, vector, and raster data, as explained below
There are four types of User Defined Overlays, namely: point, vector, drawing objects and raster data. The required file formats for all overlays are described in the Technical Annex.
Point data allows specific locations to be marked and given a label. An example of point data is the User Defined Overlay “Capital Cities of the World”, as in the figure below:
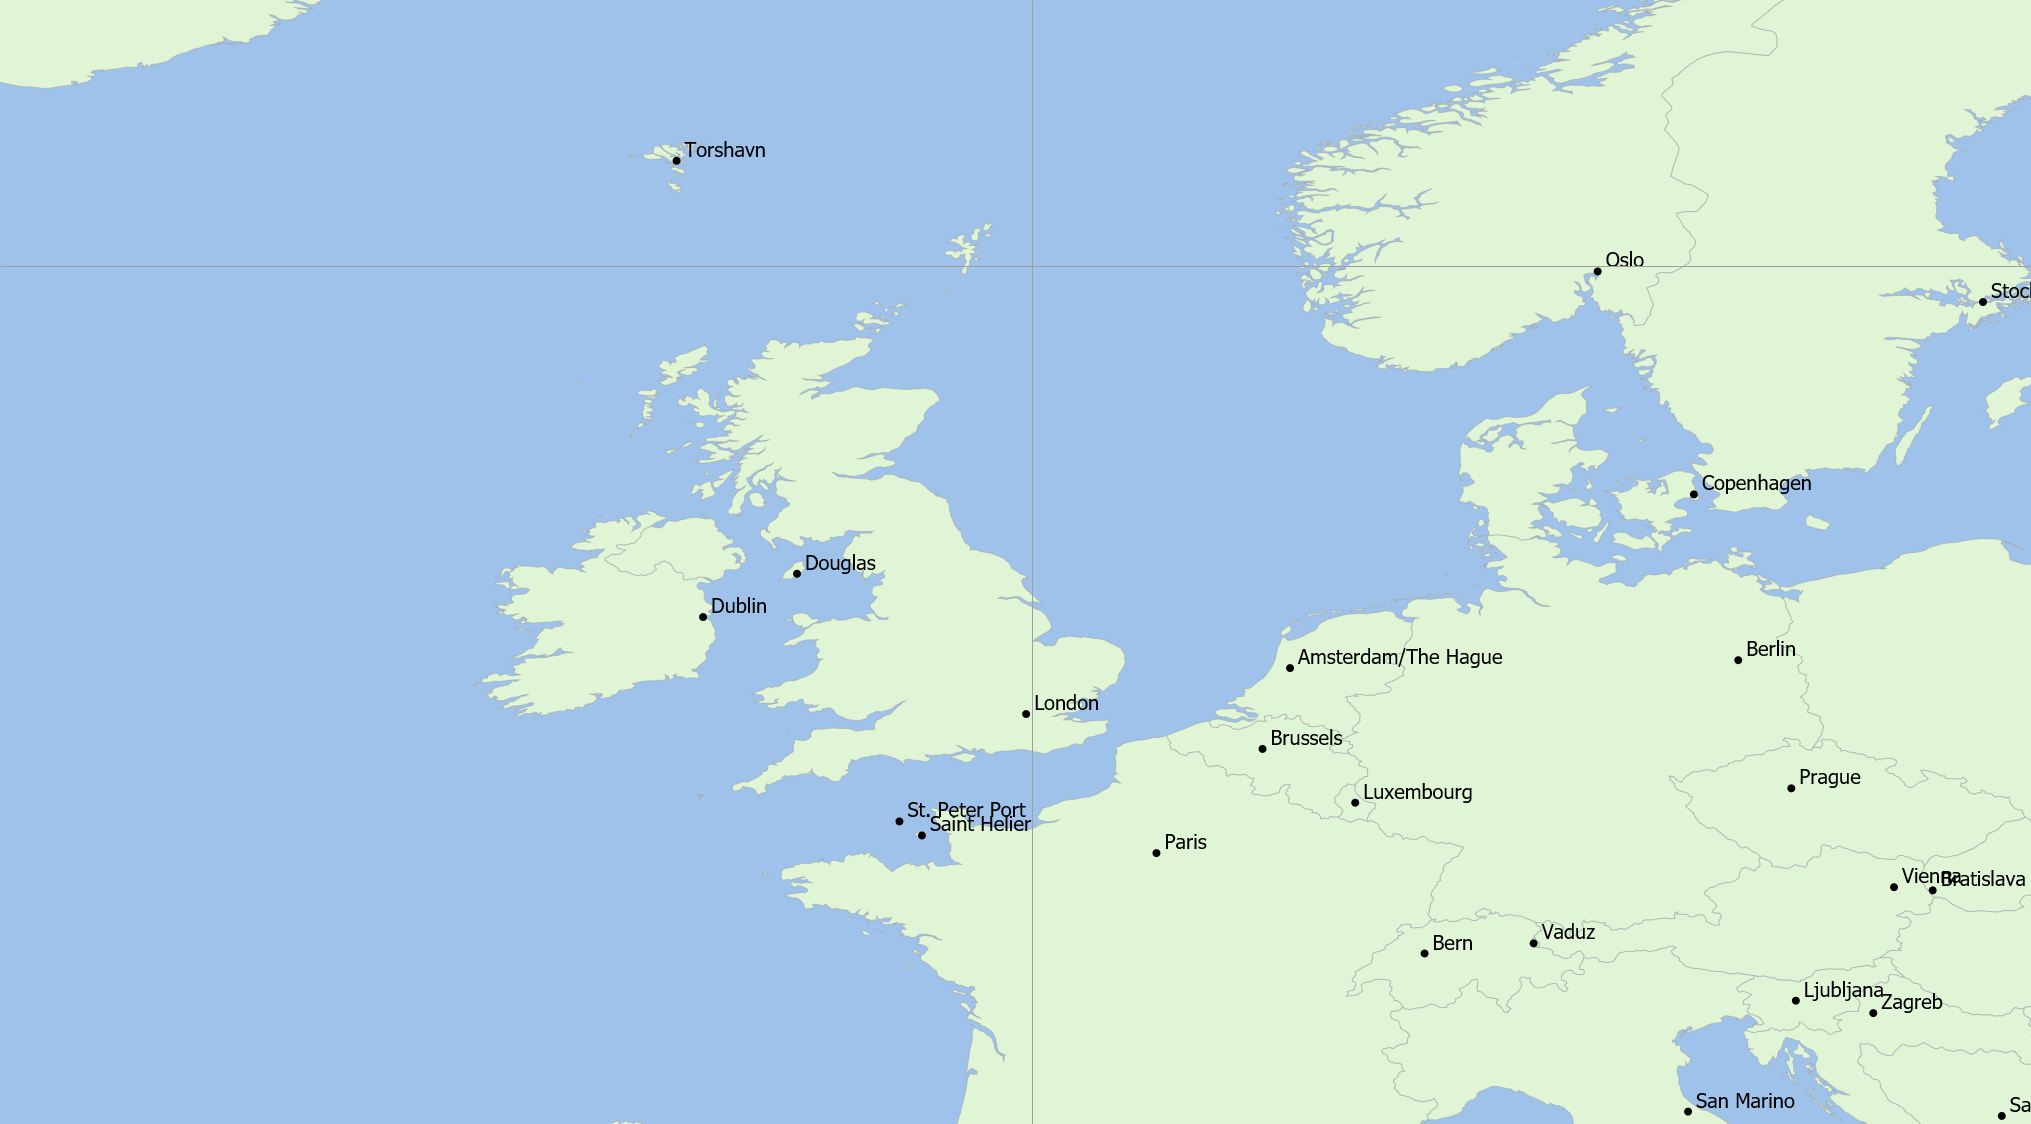
Vector data allows lines to be drawn at specific locations: this could be to show roads, railways, or borders. An example of vector data is the boundary of the Washington BEA licence as shown in the figure below.
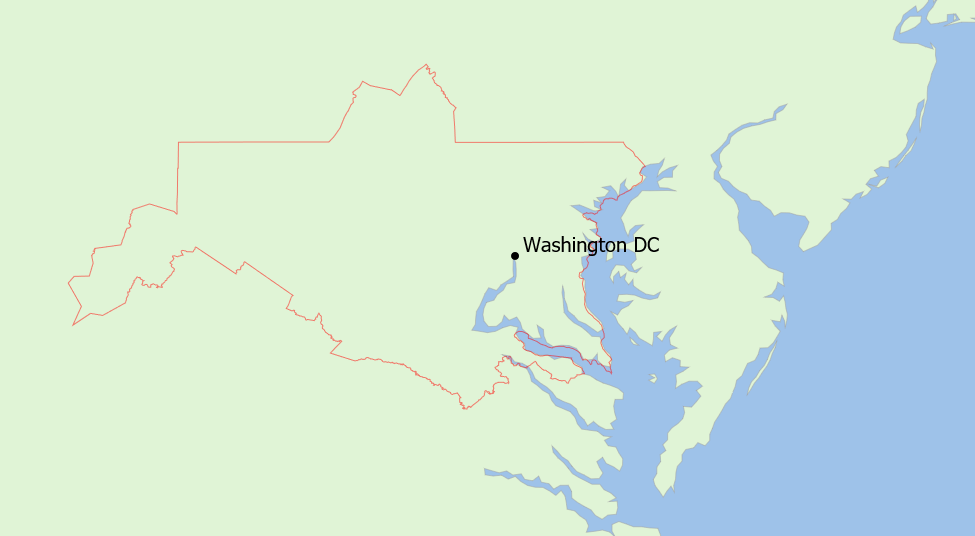
Drawing objects allows simple shapes (rectangles, ellipses and grids) to be drawn at specific locations.
Raster data is graphical data such as maps but could include images of (say) population density or other information. These can cover the entire Earth or just a small part, defined using a rectangle. The example below shows a map from the Ordnance Survey (OS) in the UK overlaid on the Mercator view:
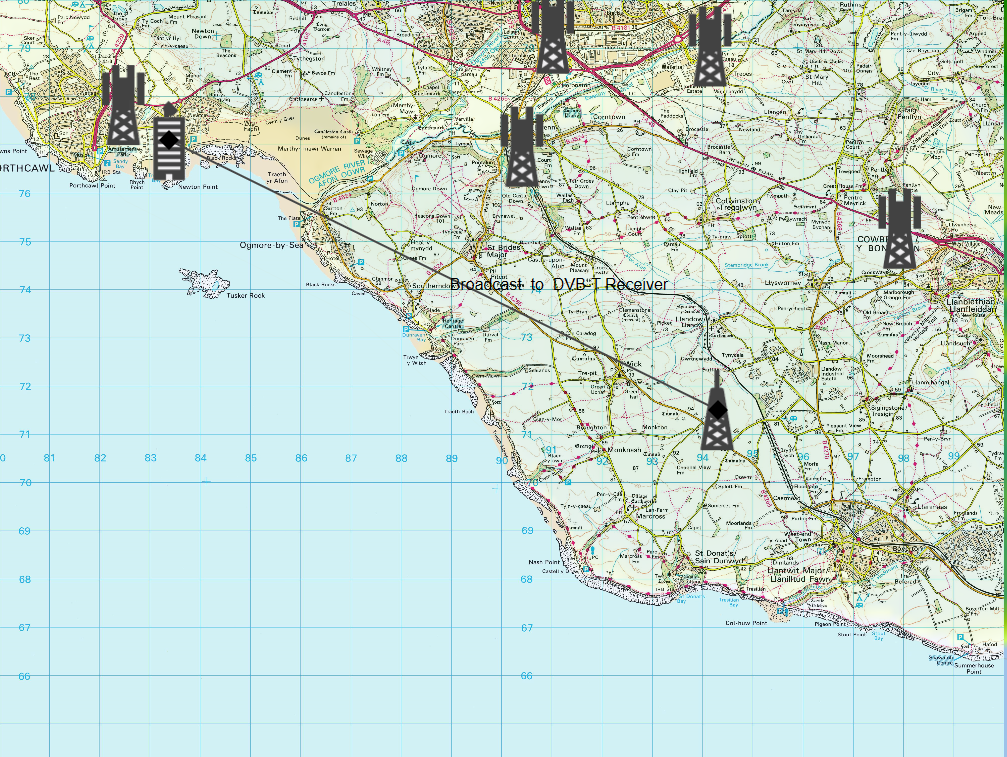
Note that raster data will have been generated assuming a specific projection and therefore care should be taken when displaying on either the Plate Carrée or Mercator view to ensure it is appropriate. The 3D view works like a Plate Carrée at large scale (i.e. the whole Earth) and Mercator and small scale (zoomed far in). Vector and point user defined overlays will work in any projection.
These four user defined overlays, together with the Area Analysis, terrain and land use overlays, mean that there is a lot of information that could be displayed on either of the map views or the 3D view. Indeed typically the key issue is how to select and configure what is shown.
A number of controls can be used to manage what is shown on the views, including:
- Check boxes to show or hide each of the items
- Controls to change the order in which each layer is display
- Controls to change the degree of transparency from one layer to the layers below
The final image is built up by adding each layer on top of the other with the degree of transparency as requested.
The result of combining these three layers is a composite in which the graphics are merged so that lower layer information can be seen due to the transparency of the higher layers.
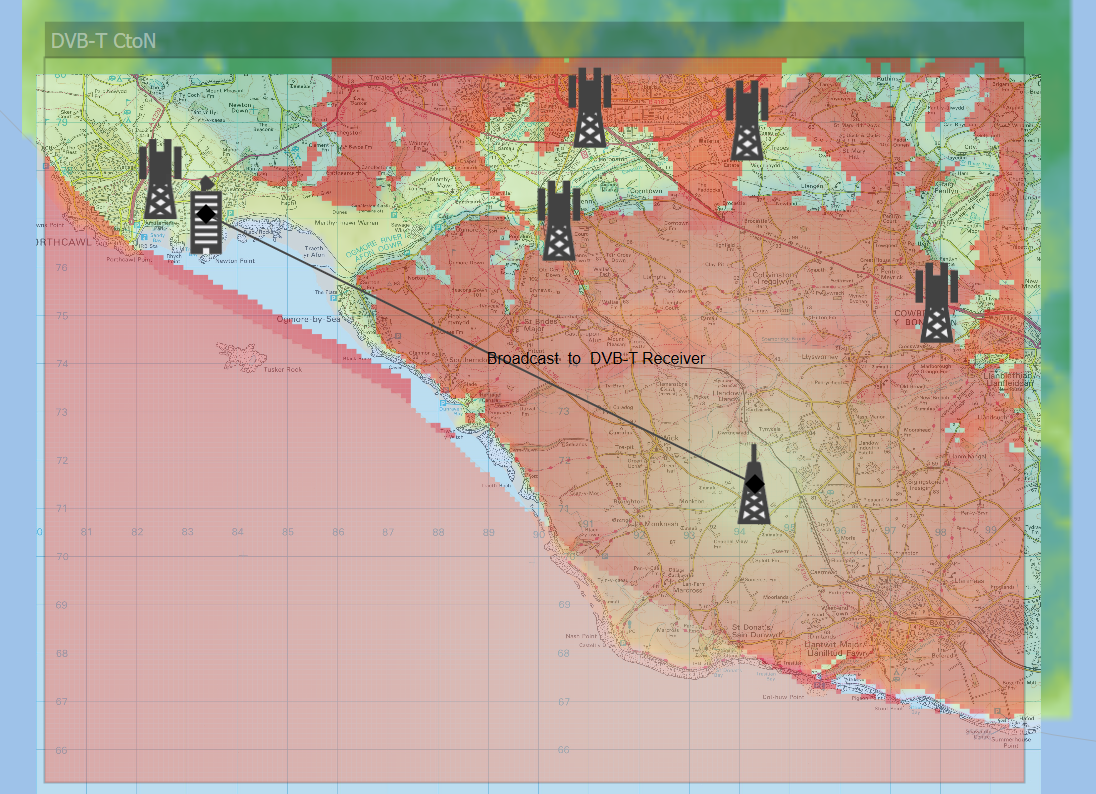
The arrow keys on the View Properties Overlay’s tab can be used to move the position of:
- An overlay category (e.g. Area Analysis, Terrain, Clutter, User Defined) with respect to another overlay category
- An overlay with respect to other overlays within that particular overlay category
Select the item of interest (category or overlay) then click on the up or down arrow as required.
To change the level of opacity (and hence its transparency) of an overlay, select it and then click on the Transparency control, as in the figure below.
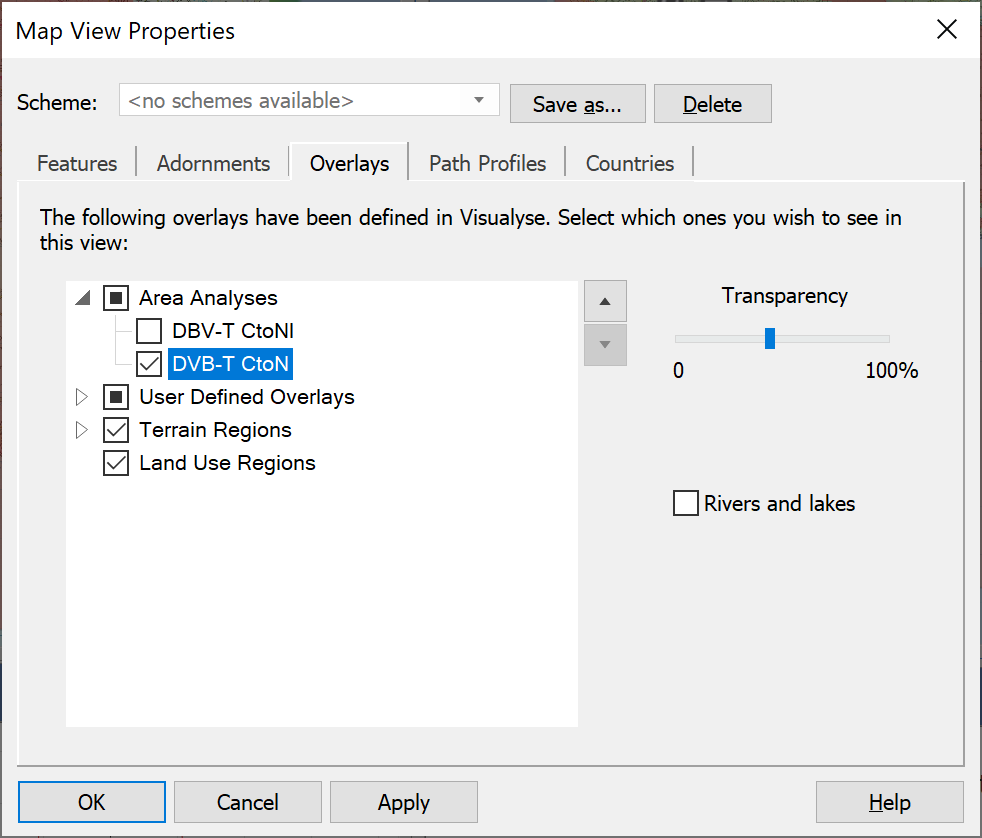
The following should be noted:
- It is easy to overload the view with too many overlays: select the ones you want and hide others
- The most important overlays should be highest on the list and less important ones lower down
- The level of transparency of each overlay can be used to show more or less of the lower layers
Tip: Colours of terrain and land use pixels can be selected to avoid clashing with other overlays. For example if an area analysis of coverage from a base station uses green and yellow to plot signal strength, select different colours to show the terrain heights or land use codes.
Path Profiles
Where terrain path profile views have been created, they are indicated on map views as a coloured line. The Path Profiles dialog lets you control how that line, and any text associated with it, is displayed.
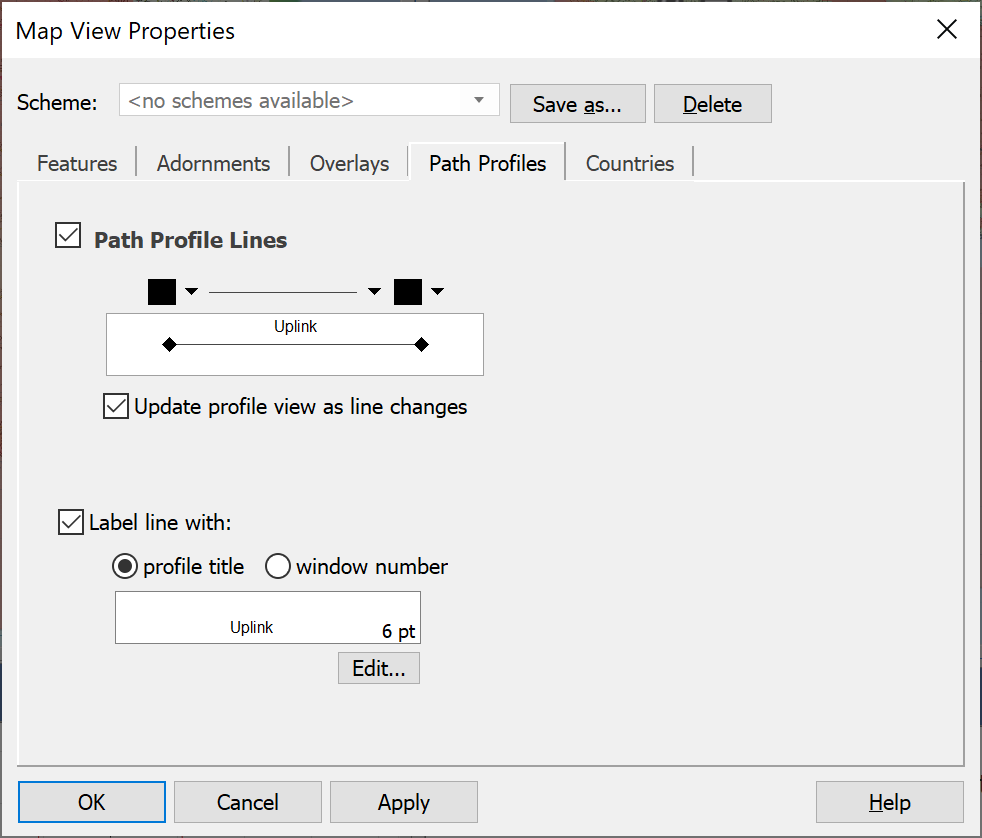
Countries
The final tab on the Map View Properties dialog is the Countries tab. This allows you to set the display options for the country polygons in the map.
The main function of this tab is to allow you to set the colours and outlines of the countries on the map. A list of all the countries is displayed on the left-hand side of the dialog. Each country has a coloured square next to it. This represents the colour and outline that will be used to display that country.
To change a country’s colour, first select it in the list. At the top of the list are two controls one to select the colour and one to set the outline.
When you change the colour or line-style, these will be set for the selected country. If you want to set these colours for another country, first select the new country. Now all you need to do is click the colour or outline button itself (not the drop-down) and that colour or style will be applied.
You can change more than one country at once by applying colours and styles to a multiple selection. You can also click the Colour All button to apply the current colours to all the countries in the list.
At the bottom of the list is a drop-down that allows you to show only certain groups of countries. Examples are - All countries, Continents and ITU regions. Having selected a group, you could apply colours to all countries in the group.
As well as country colours, you can select whether to show US state borders or rivers and lakes. You can also choose the sea colour.
Choose whether you want to show country names. The font can be set for these as before. However, fonts will now be displayed at their actual point size.
3D View
The 3D view display properties are almost identical to the map view properties. There are however a few small differences.
On the features tab, in addition to ground tracks, an option to display space tracks is provided.
It isn’t possible to use the border feature and the countries cannot be displayed individually. Instead on the Adornments tab there are options to set a single, general, country border and sky colours.
On the beam display options dialog, there is an option to display the beam cones.
The biggest difference between the two dialogs is the addition of an extra tab called Viewpoint. This is only applicable to the 3D view where the view point can be changed. In the map view this is fixed.
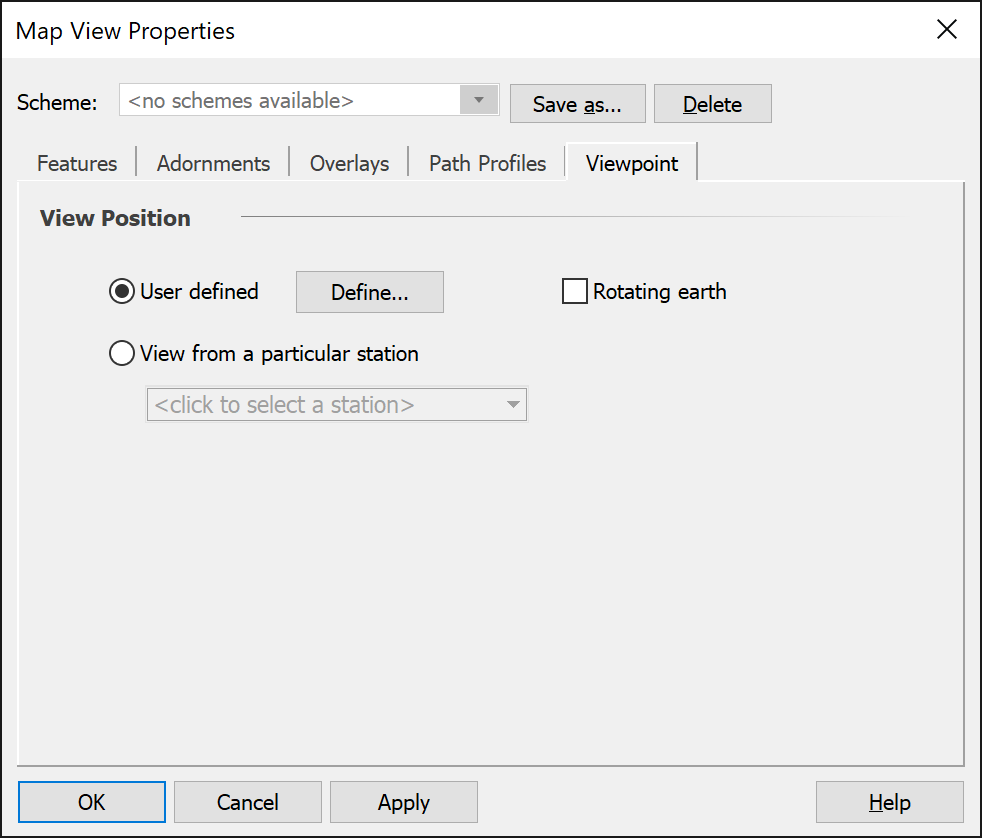
This tab allows you to set the view position itself. The default option is user defined. This allows you to:
- Set a specific lat/long/height to view from
- Change the view position interactively dragging the globe in the view window.
With the user defined option, you can choose whether you want the earth to rotate in the view when the simulation is running.
The other option allows you to view from a particular station. This allows you to sit on a satellite say and see what the world looks like from there – a useful way to understand many aspects of the geometry and dynamics of, for example, a non-GSO scenario.
The direction of view is always towards the centre of the earth.
Schemes for Map and 3D Views
A feature of both property dialogs is the option to use schemes. These are simply groups of view settings that can be instantly called up. To select a scheme, click on the drop-down box at the top of the dialog. The scheme contains settings for all the tabs.
You can create your own schemes. To do this, simply click Save as. You will be asked to provide a name for the scheme. Click OK and the scheme will be added to the list. You can delete schemes that you have created if you make a mistake or you no longer need them.
Model View
An example of the Model View is shown below.
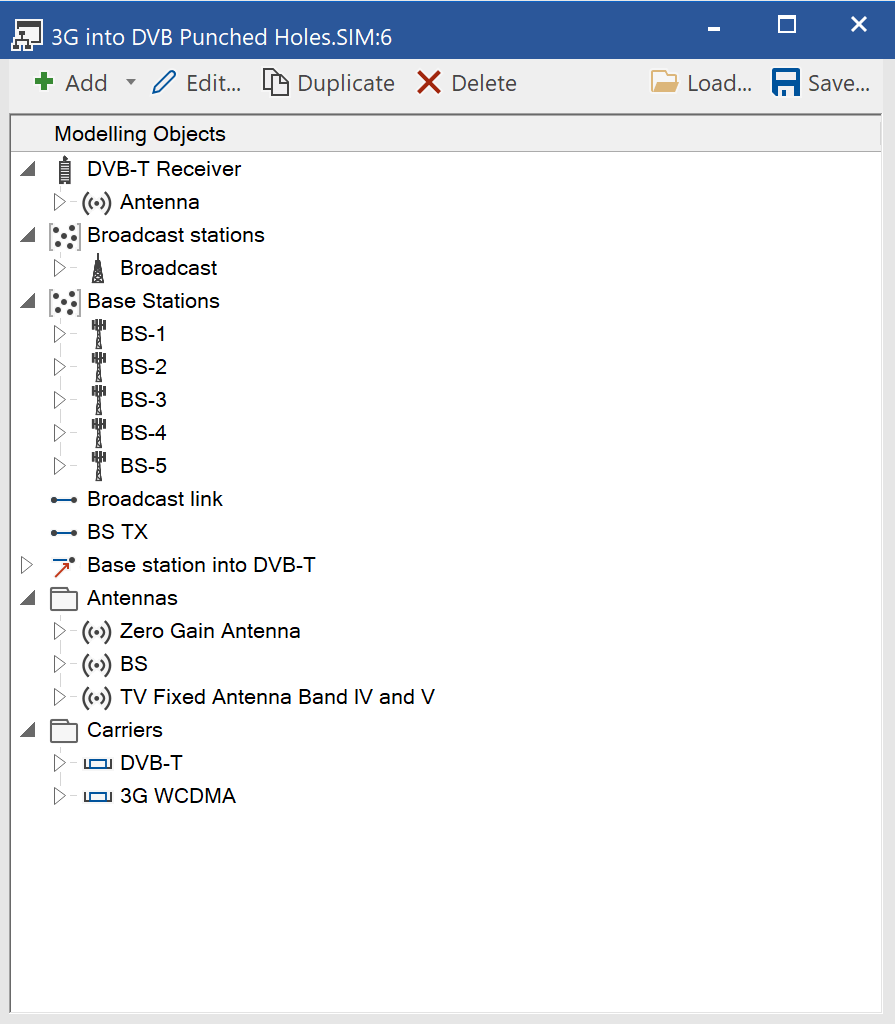
This view has several functions:
- To show you the structure of the scenario you have created. The view allows you to see, browse and edit the objects that already exist
- To create new objects – the view acts as an alternative to the menu bar and icon. Clicking the ‘Add’ button (top left) allows you to create new objects.
- Duplicate and delete buttons allow you to duplicate and delete selected objects
- Load and Save – this allows you to save objects to a location outside the simulation as a text file. You can then edit the text file and re-load or load the same object into a new simulation.
Watch Window
The watch window is a way of monitoring the evolution of selected simulation variables. Select and order a list of variables and watch as they are interactively updated as the simulation runs.
You can pick Carrier Station, Station Group, Link and Link Group parameters.
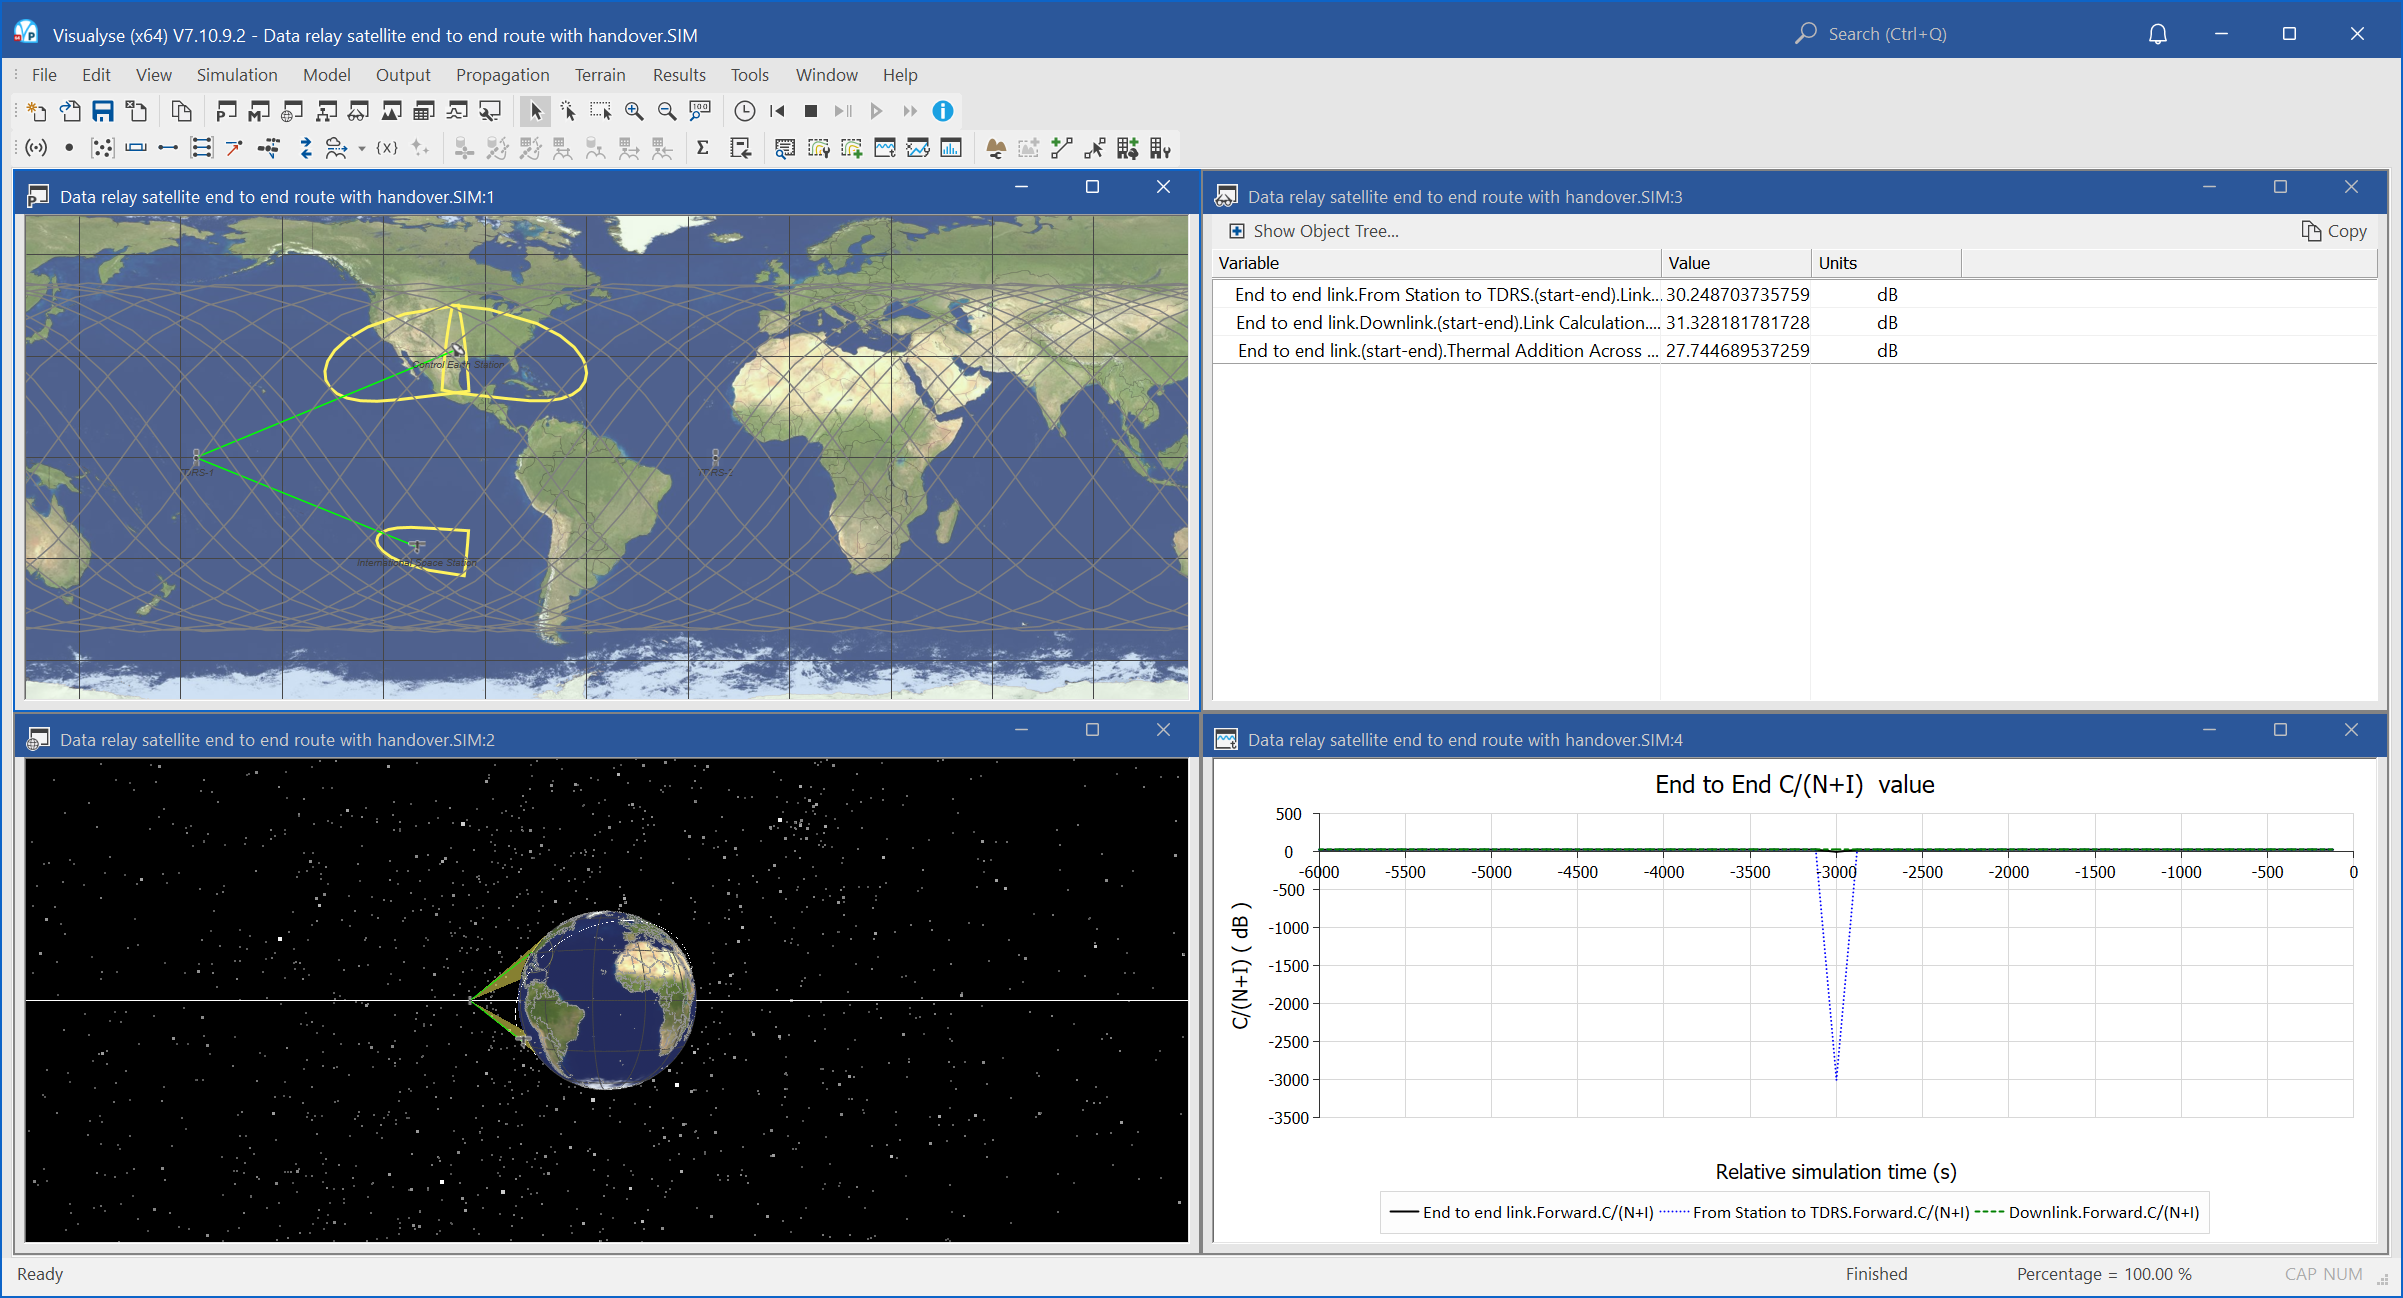
In the example above a Watch Window has been set up to show intersatellite C/N and downlink C/N (Link attributes) and the end-to-end C/N (a Link Group attribute). The scenario is the downlinking of information from the International Space Station to an Earth Station via one of two TDRS satellites
To create a new Watch Window select New from the Window menu, then pick Watch Window from the list. A blank Watch Window (shown below) will be created.
To add a variable to click the ‘Show Object Tree...’, button in the top left. This reveals the objects from which you select the variable of interest.
In the figure below you can see the Carriers, Links, Stations and Link Groups in the simulation. The small arrow to the left of each object indicates that there is structure contained within the object. Click the arrow to reveal the parameters that can be watched.
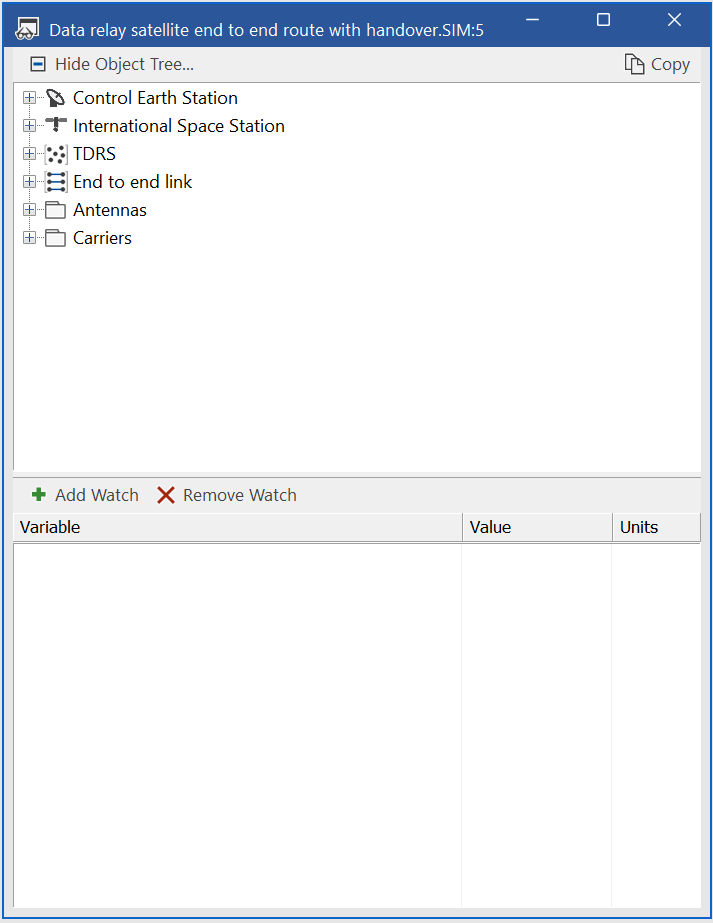
The data in the watch window can be copied at any time using the copy button at the top right. The copied data can be pasted into other applications in a tab delimited form.
Tip: It is a very good idea to use the watch window to look at the wanted and (where applicable) worst single interferer link budgets. This allows you to get a good idea of what the main issues are, and sanity check the results.
If you are unsure about why the results are as they are this is a good place to start!
Table View
Table View allows you to view multiple parameters across a Group of Links or Stations, or from the full Link or Station list in a single Window.
The example below shows the method for selecting which variables from a group of stations to display
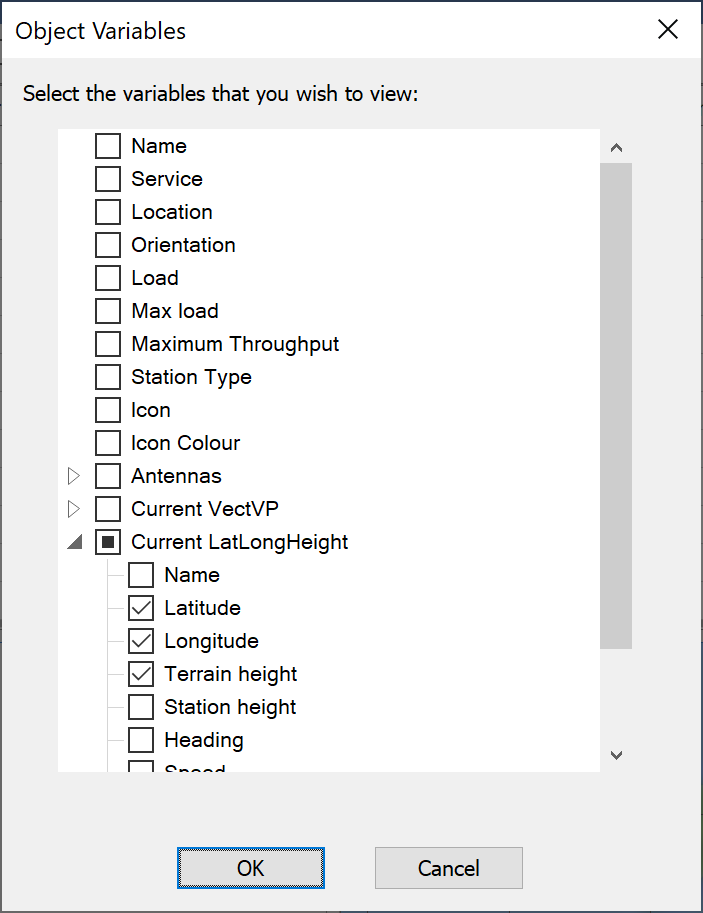
Once the variables are selected, they can be displayed in rows or columns for each station. The figure below shows the latitude, longitude and height for 19 stations in a hexagonal deployment in Europe.
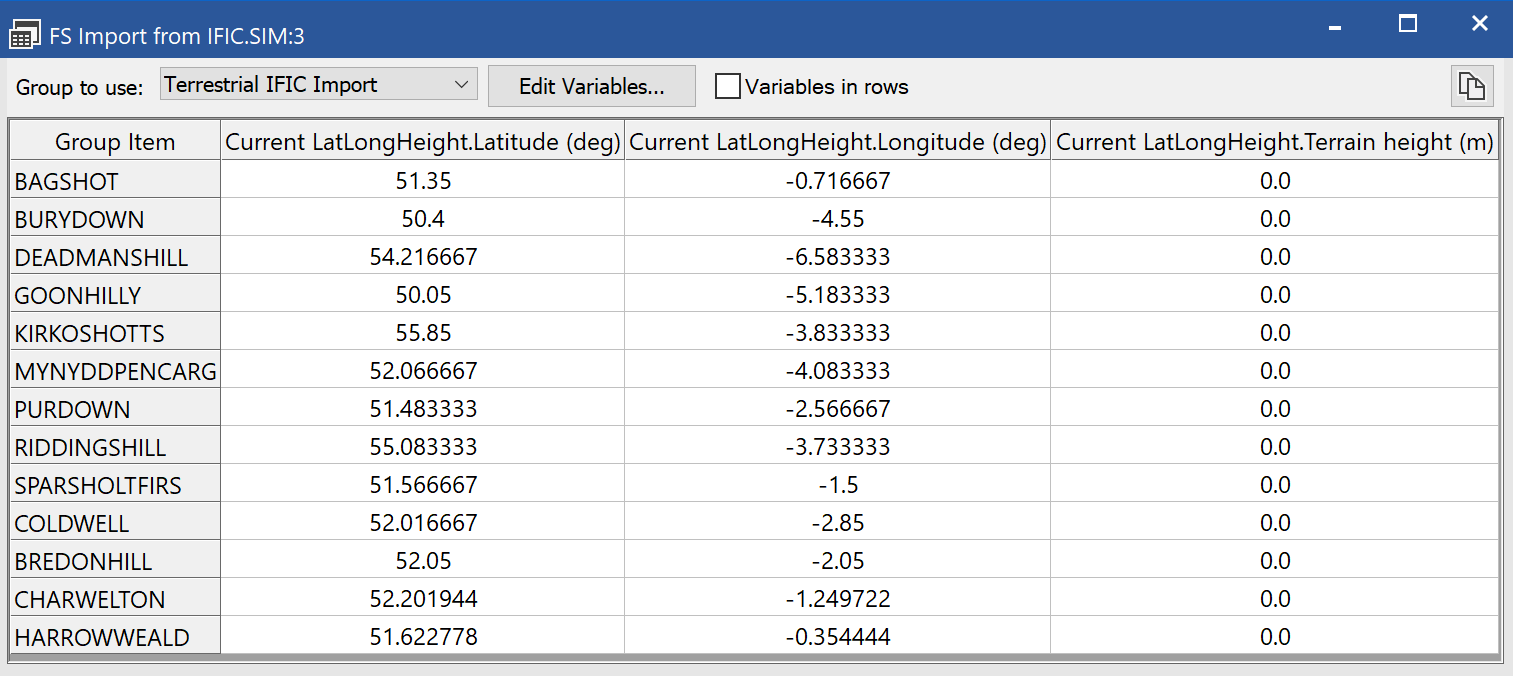
Terrain Profile
This view gives a spot height profile between any two points on the surface of the earth – it is described in the Modules User Guide
Frequency View
The frequency view can be used to show graphically the spectrum mask of transmitters and the receive filter characteristics, together with the frequency offset between them.
An example is shown in the figure below, taken from the “Digital Dividend” example file “3G into DVB Punched Holes.sim”.
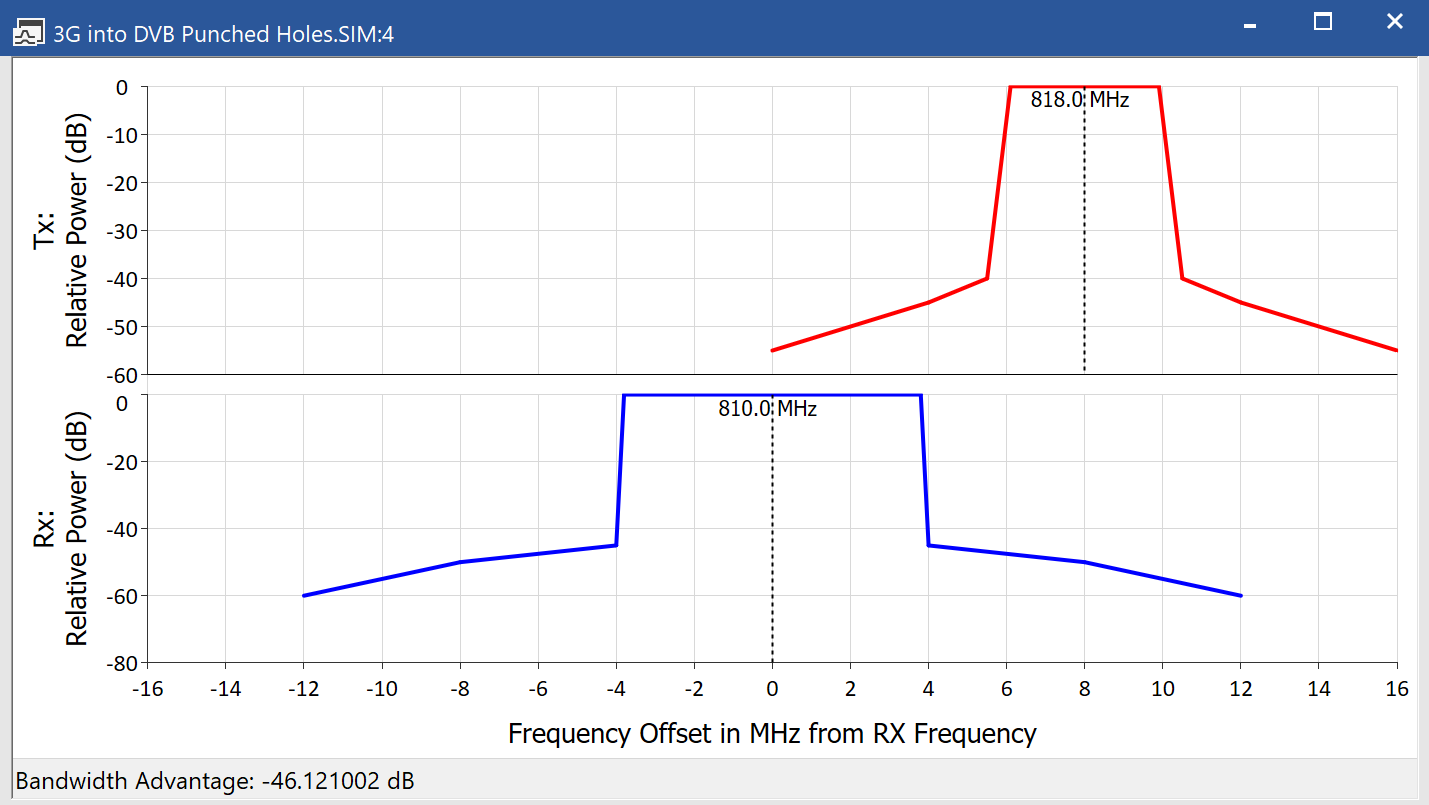
The frequency view shows in the top half the transmit mask in terms of relative power in dB against frequency offset from carrier centre frequency. In the bottom half, using the same frequency scale, is the attenuation of the receiver in dB – again with respect to frequency offset from carrier centre frequency.
The two frequency scales are aligned to show to scale the relative frequency offset of the two links. In addition the central frequencies of the two links are displayed above each mask.
You can open a new frequency view by selecting menu option “Window | New | Frequency view” or clicking on the icon ![]()
Having done that you can configure it by right clicking within the view to open the following dialog:
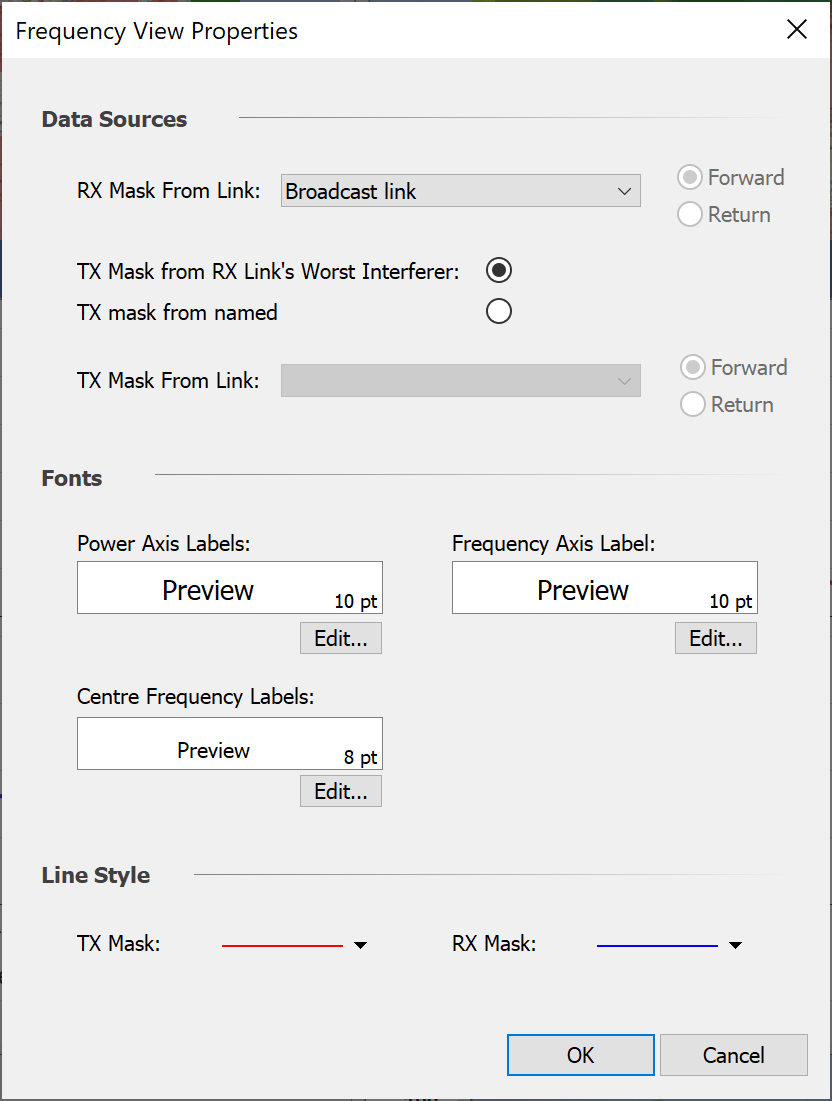
The first step to configure the view is to select the receiver of interest: the RX mask shown will use taken from the carrier for this link. The frequency axis of the view will have its zero frequency offset defined by this link’s centre frequency.
Then the transmit mask can be defined by one of two ways:
- From the carrier of the worst single interfering link into the selected victim link
- From the carrier of a specific link
In both the RX mask and TX mask cases if the link is bi-directional it will be necessary to select the direction as there could be different carriers and / or different frequency offsets between forward / return directions.
If the TX mask is taken from the RX link’s worst interferer, and the interference path has the “Bandwidth adjustment” option set to “Integrate masks” then the calculated Bandwidth Advantage will be shown in the view’s bottom left corner.
The view can be copied into the clipboard for pasting into other applications by clicking on the copy icon or selecting menu option “Edit | Copy”.
Note that this view updates during the simulation, so that if a frequency hopping system is used it will show the frequency offsets for the current time step – see the “Short Range” example file “WiFi and BT.SIM”
Change Variable Wizard
The final item under the Model menu is the Change Variable Wizard.
This allows any parameters of a group of stations or links to be changed to a new value, to take random values in a given range, or to vary linearly across the group between two values.
The Change Variable Wizard is accessed via the Edit menu. The first screen in the Wizard is shown below.
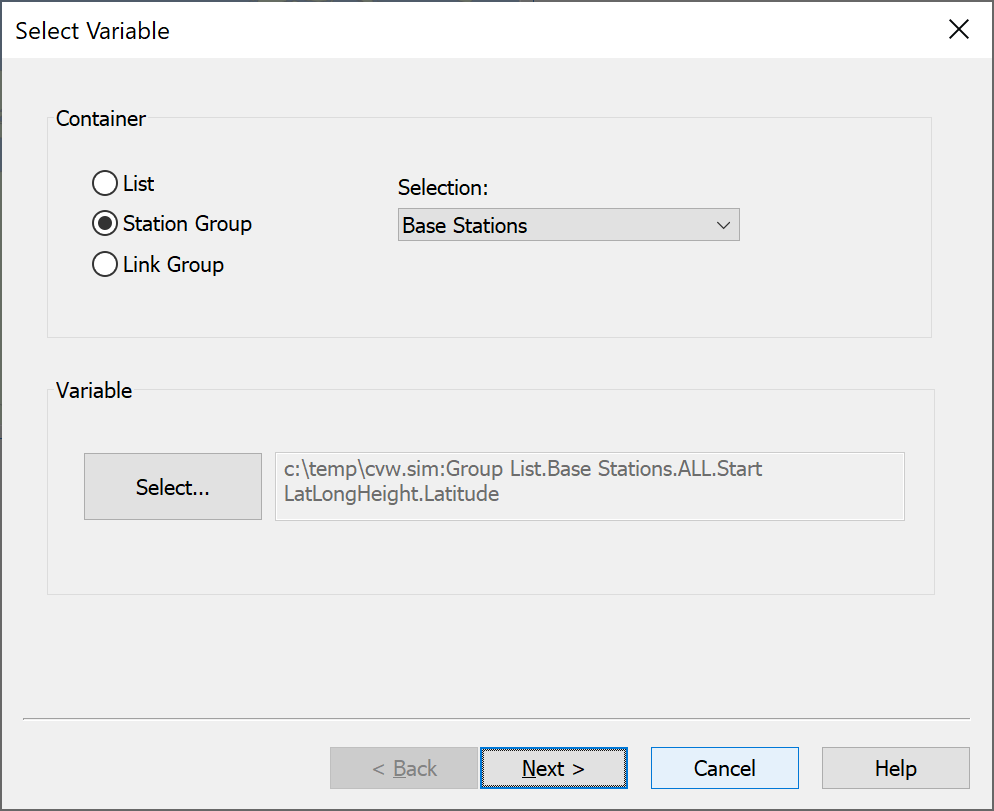
The two parameter groups on this screen are ‘Container’ and ‘Variable’. The ‘Container’ defines the object which contains the variable to be changed. This object can be chosen from any of the object lists (Station, Link, Beam Type etc,) or from any Station Group or Link Group.
The ‘Variable’ group is used to define the variable to be changed. In the example above, the antenna height of all the stations in the Group ‘Constellation’ will be varied.
The second screen is shown below.
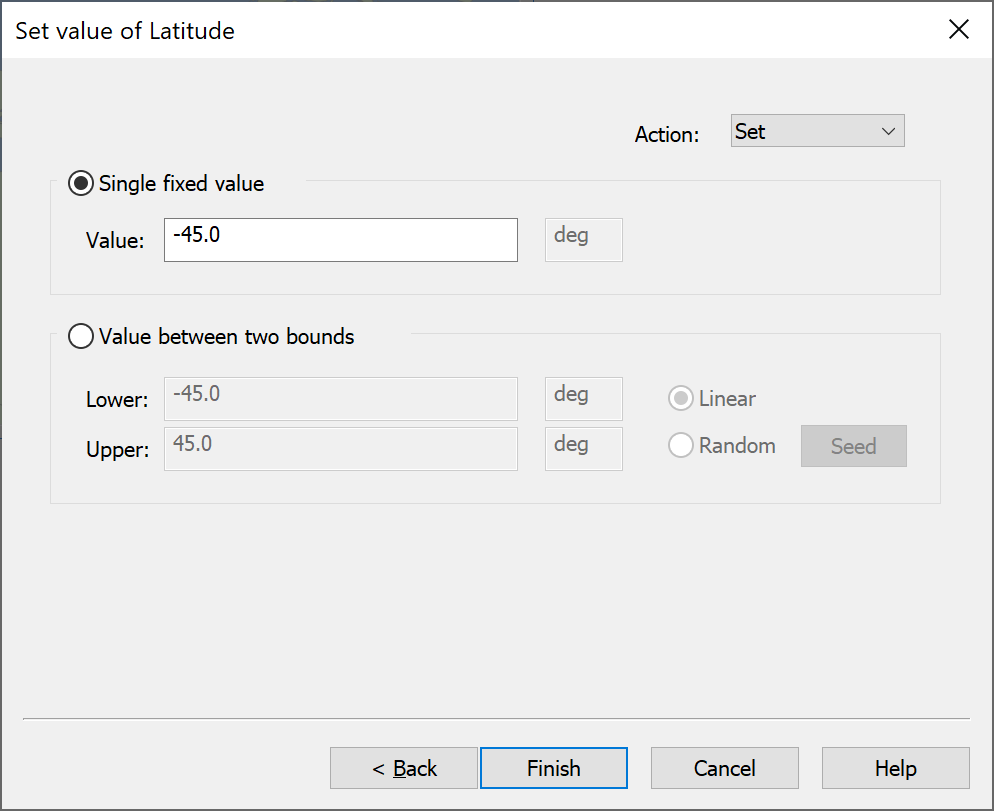
The options in this screen are:
- Set all the variables to the same (user defined) value.
- Spread the variable between two defined bounds - variability can be linear, starting at the lower bound for the first variable on the list, or it can be random.
If random is selected then a set of random numbers will be used. For repeatability the same set of random numbers will be used each time the change variable wizard is run: hence if you want a different set of random numbers you must click on the “Seed” button.
If you do not there will be correlation between sequences, such as in the example below where the latitudes and longitudes have been randomized from the same seed:
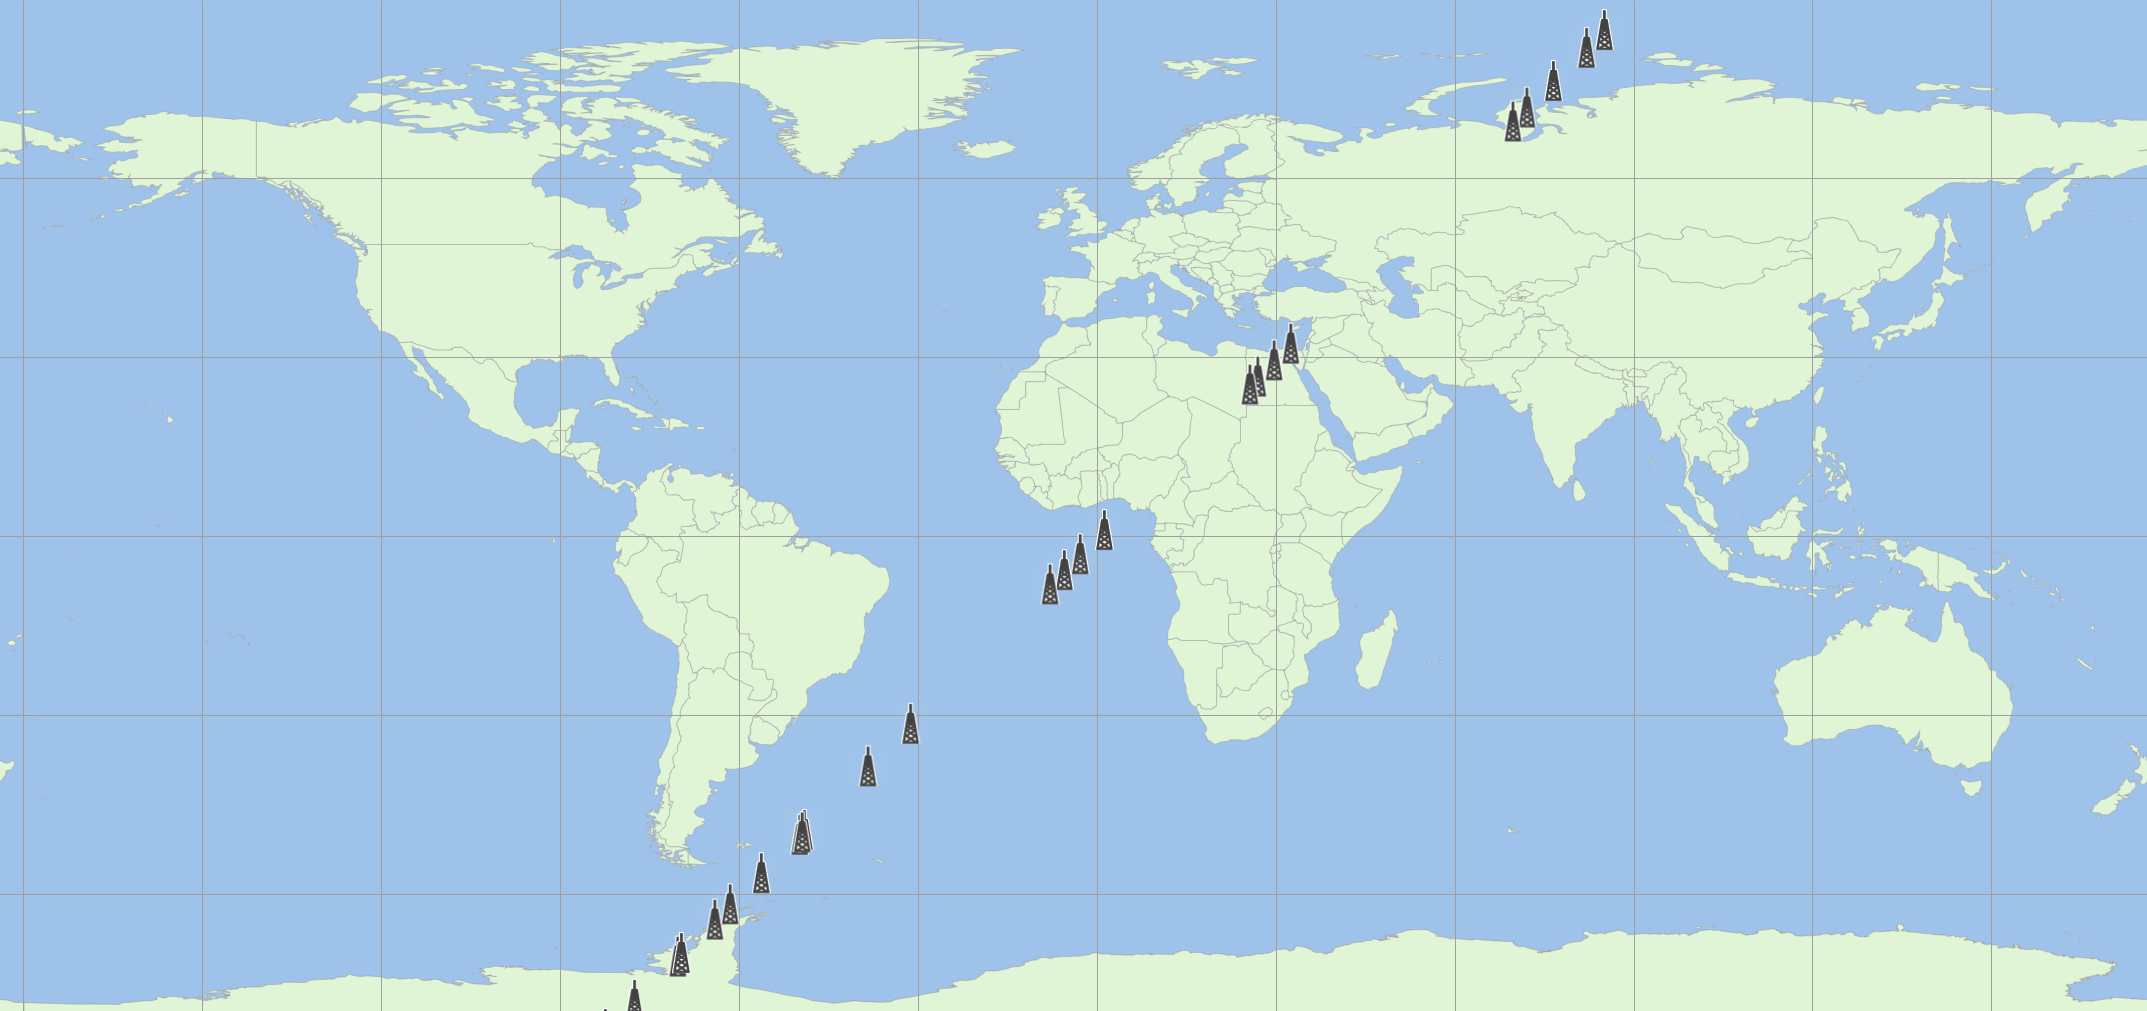
The options under ‘Action’ (click the arrow to the right of the button) apply when a ‘Single Fixed value’ is selected. The options, which determine how the parameter placed in the Value field is used, are:
- Set – this option sets all the parameters to the value input by the user.
- Add – takes the value input and adds it to the current value. This could be used to shift a group of stations in Longitude, maintaining the relative positions of the Group
- Multiply – take the value input and multiplies the current value.
Selecting next will finish the Change Variable Wizard and change all the selected variables.
Example applications of the Change Variable Wizard are:
- Randomise the antenna heights in a Group of terrestrial Stations, between defined limits.
- Change the power on multiple Links in a Link Group.
- Change the Antenna Type on all the Stations in a large Group.
- Randomise Earth station latitudes and longitudes or antenna azimuths and elevations.
Data Analysis
- Visualyse Statistics Collection
- The Visualyse Log File
- The View Results Dialog
- Graphing
- Area Analysis
- Interface to Google Earth
Visualyse Statistics Collection
The following parameters are gathered:
- Worst data value and simulation time of worst data value
- Average data value (this is a mean value)
- Standard deviation of range of data values
- Number of events
- Longest event length and time of longest event
- Average event length
- Probability distribution of data values
The probability distribution is created using an array of bins using the bin size specified. Visualyse puts values in the bin by rounding down: hence if the bin size is 1 dB and the C/N = 18.3 dB this will be placed in the 18 – 19 dB bin which is labelled as 18 dB.
Where appropriate, Visualyse will calculate statistics in dBs or in absolute value. In some cases, the parameter values may be mathematically undefined if they are collected and calculated in dB. Visualyse will return values for these statistics based on default dB values – for example of there is no signal level (0 watts) Visualyse defaults to a value of -3000 dBW.
Link Interference Statistics Collection
Interference statistics collection is specified at simulation level. You choose what interference statistics you want to collect and whether these statistics should apply to just wanted Links and Link groups or all the Links and Link groups.
To allow for special cases, can override the document level settings in any Link or Link Group object.
To specify the statistics you wish to collect, select Statistics Collection from the Output menu. This will display the Statistics Collection Options dialog.
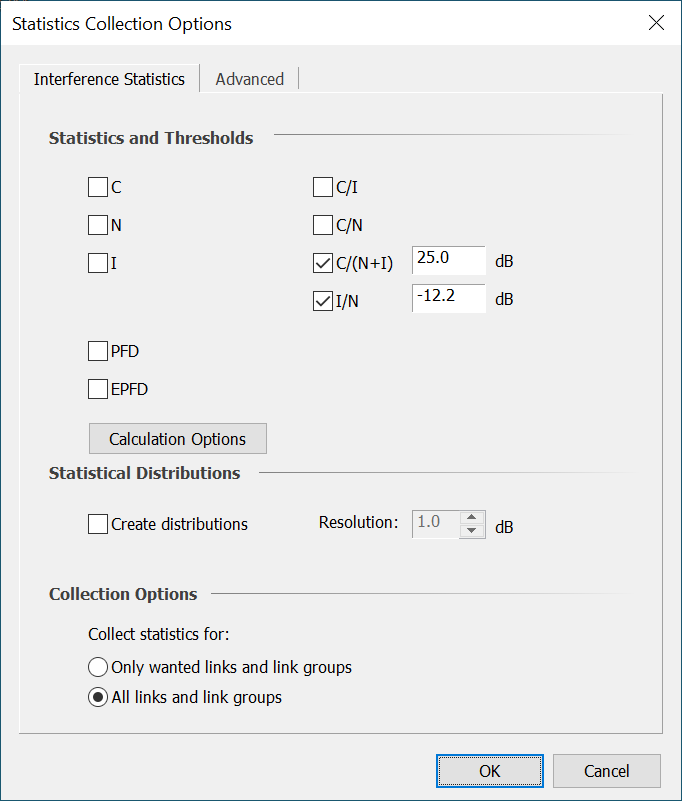
The dialog has two tabs. The first of these is the Link Statistics tab. This allows you to choose which Link and Link Group interference parameters you want to look at.
To choose an interference parameter simply check the appropriate box. A threshold can then be specified for this parameter. The threshold is used by Visualyse to define an interference event when calculating percent time interference is seen or the number and length of interference events.
For PFD and EPFD there are additional options for specifying the reference bandwidth. Note that PFD and EPFD cannot be selected at the same time. If you switch one on, the other will automatically switch off.


A separate option allows you to say whether you want to generate histograms (probability distribution functions). If this option is chosen, a histogram is created for each of the selected interference parameters. The size of the bins (the resolution) of these histograms can also be specified.
Finally, you can choose whether the statistics are collected for all Links and Link Groups or just for wanted Links and Link Groups.
Statistic Calculation Options
The “Calculation Options” button allows you to define whether the statistics for each of the standard link metrics are calculated in dB or absolute. For example, when calculating the “mean I/N” is it the mean of the I/N in dB or the I/N in absolute?
The Statistics rounding option relates to creation of histograms and cumulative distribution functions (CDF). Given a value of say -155.5 dB, should this be referenced to the -155 dB bin or the -156 dB bin? The choice could relate on whether the value is better high (i.e. a wanted signal) or better low (as in an interfering signal). This option allows the bin rounding direction to be chosen.
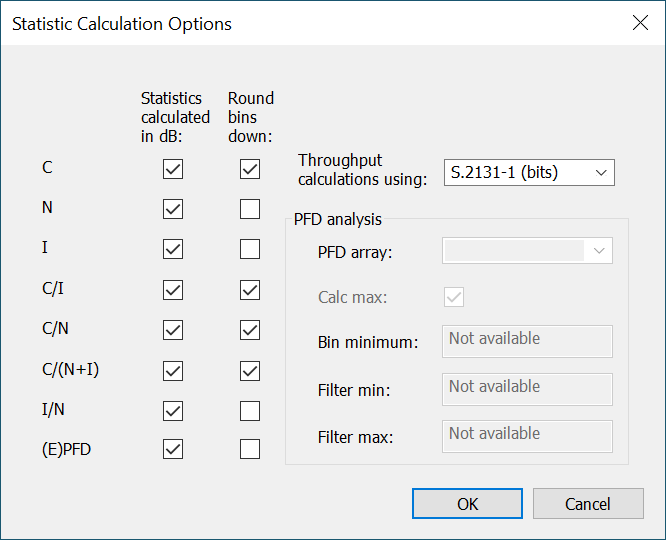
The Throughput options are described in full in the technical note: Spectrum Efficiency and Throughput Calculations
The PFD analysis options are described in full in the technical note: PFD Analysis Features
User Defined Statistics
There is a second tab labelled the Advanced tab.
From this tab you can choose any parameter in the simulation and collect statistics on that.
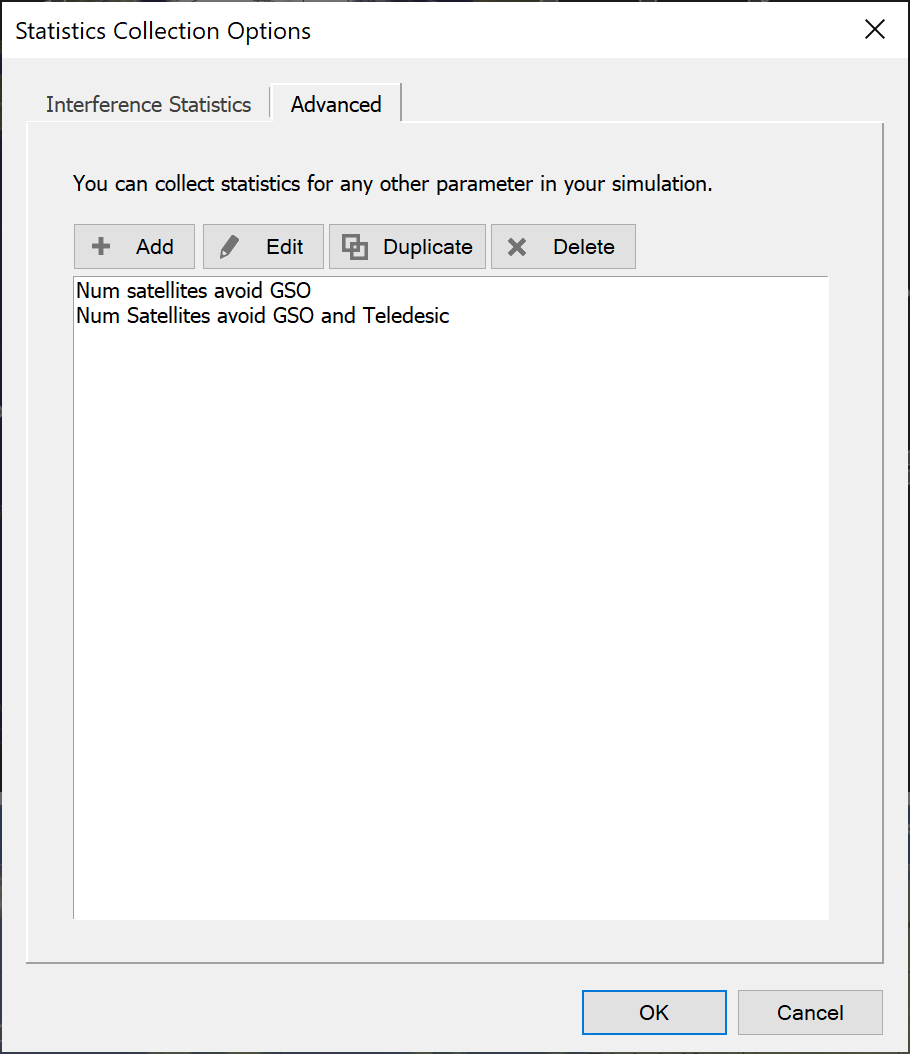
Click the Add button to add a new variable to the list. This will bring up the Statistics dialog.
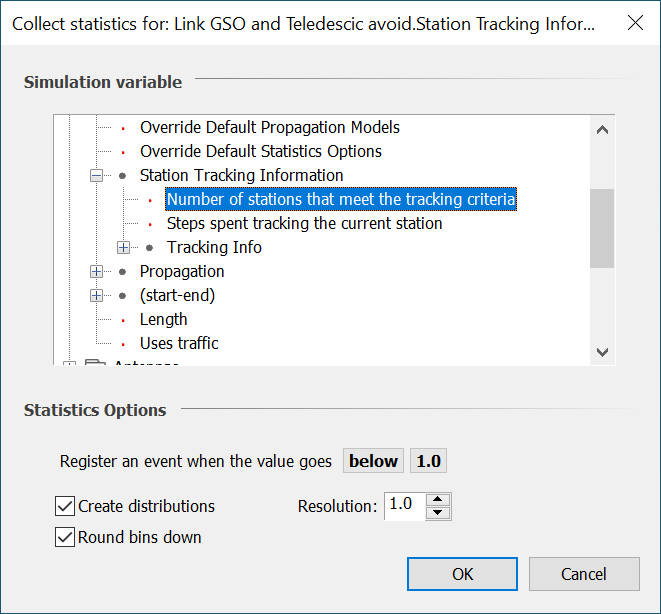
The Variable is selected from the Object Tree, a Criterion Level is set and the resolution of a probability distribution (if being collected) is defined.
The Criterion value can be either a maximum or minimum above or below which Visualyse will record an event.
The Visualyse Log File
The values of any number of variables can be saved to a Log file at time intervals that are user definable. The log file has the same name as the simulation file and is in the same directory. Variables can be added to the file at the start of each run by selecting ‘Log Data’ from the analysis menu
A list of currently selected log variables is shown. To add a new variable press ‘Add’ then the data to be logged can then be selected by navigating the Object Tree, to point to the required variable. Note: it is possible to add multiple variables at the same time by holding the “Ctrl” key when clicking.
Data can be logged at each time step or every n time steps, where n is any integer. The logging interval is set via the Configure item of the Run menu.
The resulting log file will contain the values of all the defined variables at each required time interval. The log file can be edited using any text editor. The data in the file is tab delimited and can be imported into other Windows applications such as spreadsheets and word processors.
The example text below is copied from a log file containing two variables, the received power and the antenna elevation at an earth station tracking a non-GSO constellation
| Log data from run:c:\my documents\itu-br\example1.log | ||
|---|---|---|
| Number of logs: | 2 | |
| Time steps between logs: | 1 | |
| Time since start | Link List.SA Link Group Link-1.ForwardPath.SingleLinkCalc.[C] | Station List.Earth station4.Antennas.Antenna.Current Azelr.[Elevation] |
| Elapsed time | SingleLinkCalc [C] | Current Azelr[Elevation] |
| s | dBW | Deg |
| t = 0 days 00:00:00 | -102.99907 | 48.23921 |
| t = 0 days 00:01:00 | -103.879809 | 58.590806 |
| t = 0 days 00:02:00 | -103.968563 | 67.765593 |
| t = 0 days 00:03:00 | -102.859516 | 69.32031 |
| t = 0 days 00:04:00 | -101.75365 | 61.507881 |
| t = 0 days 00:05:00 | -100.763455 | 51.107161 |
| t = 0 days 00:06:00 | -100.071869 | 41.47703 |
| t = 0 days 00:07:00 | -99.874292 | 33.291435 |
| t = 0 days 00:08:00 | -100.239387 | 30.502836 |
| t = 0 days 00:09:00 | -101.045052 | 37.194378 |
| t = 0 days 00:10:00 | -102.087193 | 44.272388 |
| t = 0 days 00:11:00 | -103.20285 | 50.625994 |
The View Results Dialog
The Results dialog provides a way to look at what Visualyse has calculated numerically (see Graphing for details on examining results graphically).
The Results dialog allows you to look at snapshot link budgets at a specific time and also at statistical results collected over the course of a dynamic simulation.
Results seen in the dialog can be copied and pasted, exported or plotted immediately at the press of a button.
Results are presented in terms of Links, Link Groups and Other User Defined Statistics. By default, the results list shows all the results available in the simulation.
The list can be filtered to show just Link Results, Link Group Results or User Defined Statistics results – simply select the option you require in the top left of the dialog (as shown below).
To view a result, select the object of interest and click the View Results button (or double click on the object in the list).
The example below shows what the results may look like for a single link.
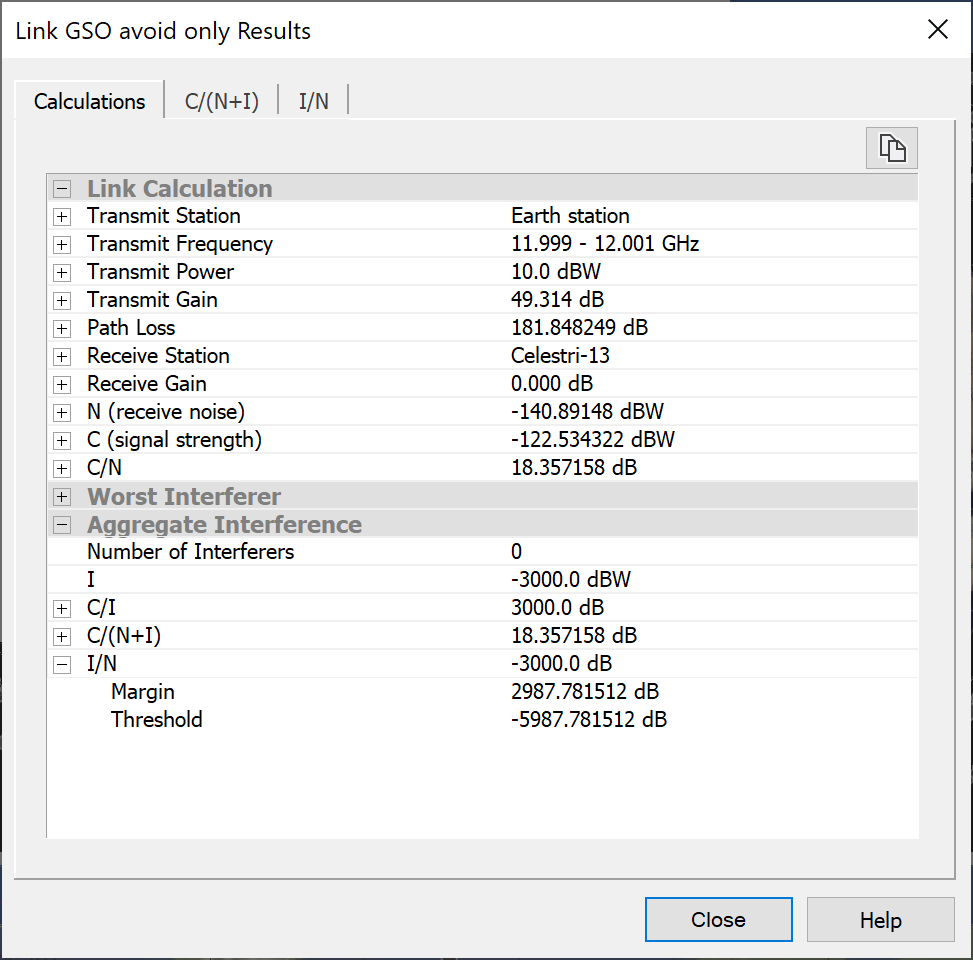
The results show the current Calculations on the first page. Details of the Link Budget and any interference are shown. For the Link Budget, details of the route (transmit/receive station antenna and beam), frequency, EIRP, losses and gains are list.
The small cross to the left of any entry in the Calculations page indicates substructure and clicking the cross will expand the item.
The dialog will also include a tab for each type of statistic being collected. The tab will show current statistical information on the parameter named at the top of the tab.
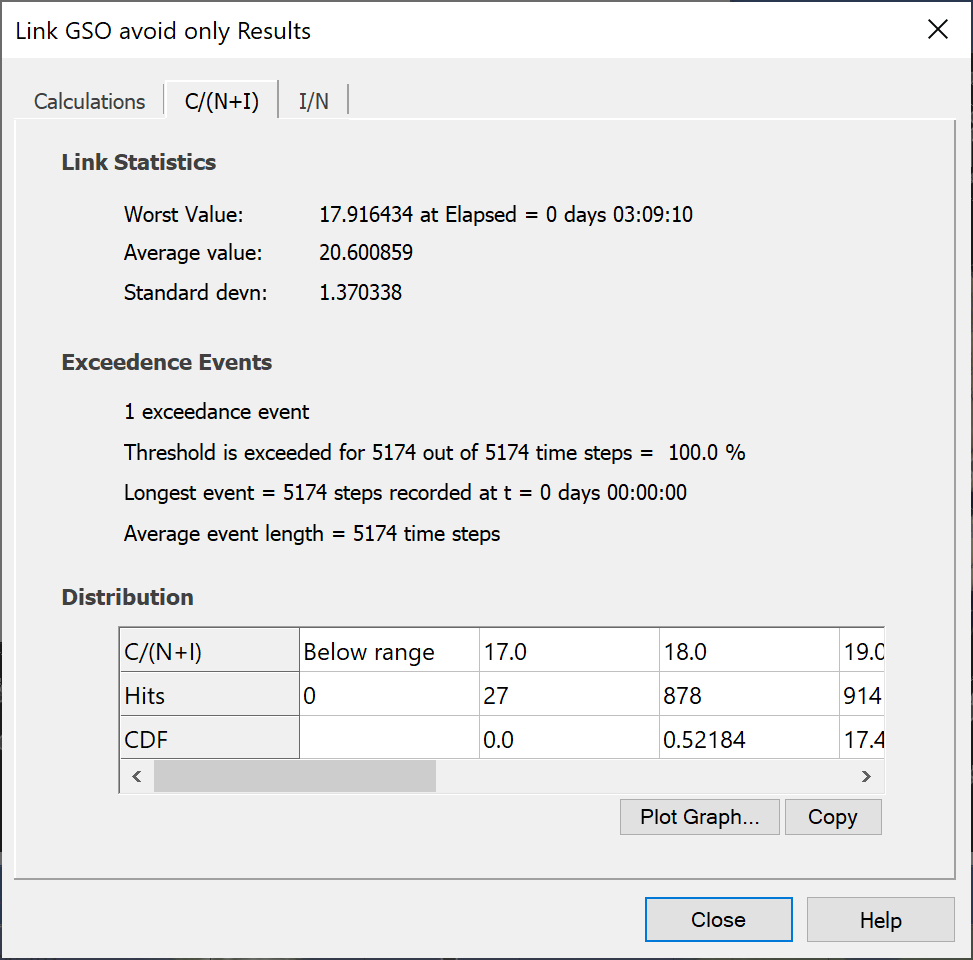
Statistical values given are:
- The worst value
- The average value
- The standard deviation
If some of the values show interference in excess of the defined criterion, the dialog will also show:
- The number of exceedance events
- The % time that the threshold was exceeded
- The longest single event
- The average event length
The probability distribution of the statistics is shown in a grid at the bottom of the dialog. You can copy this grid for further processing and you can plot a cumulative distribution (on an Analysis Graph) by just pressing the plot button at the bottom right.
Graphing
There are three types of graph available in Visualyse:
- Data vs. Time Graph - time stepped interactive plot of a variable against time
- Data vs. Data Graph - the display of any two variables on an XY scatter plot.
- Distribution Graph - the display of probability distributions, and cumulative distributions for interference and user defined statistics.
Graphs are created from the Results menu or from the toolbar icons:

All graphs can be configured via the Chart Settings dialog, invoked by a right mouse click on the graph area, or from the 'Properties' option of the View menu item
Data vs. Time
A Data vs. Time graph allows up to six variables in the simulation to be watched as they evolve with time. The Data vs. Time graph dialog can be invoked by selecting the Data vs. Time graph item from the Analysis Menu, or by a mouse click on the Data vs. Time graph icon, ![]() , on the main toolbar.
, on the main toolbar.
The Data vs. Time graph definition dialog is shown below.
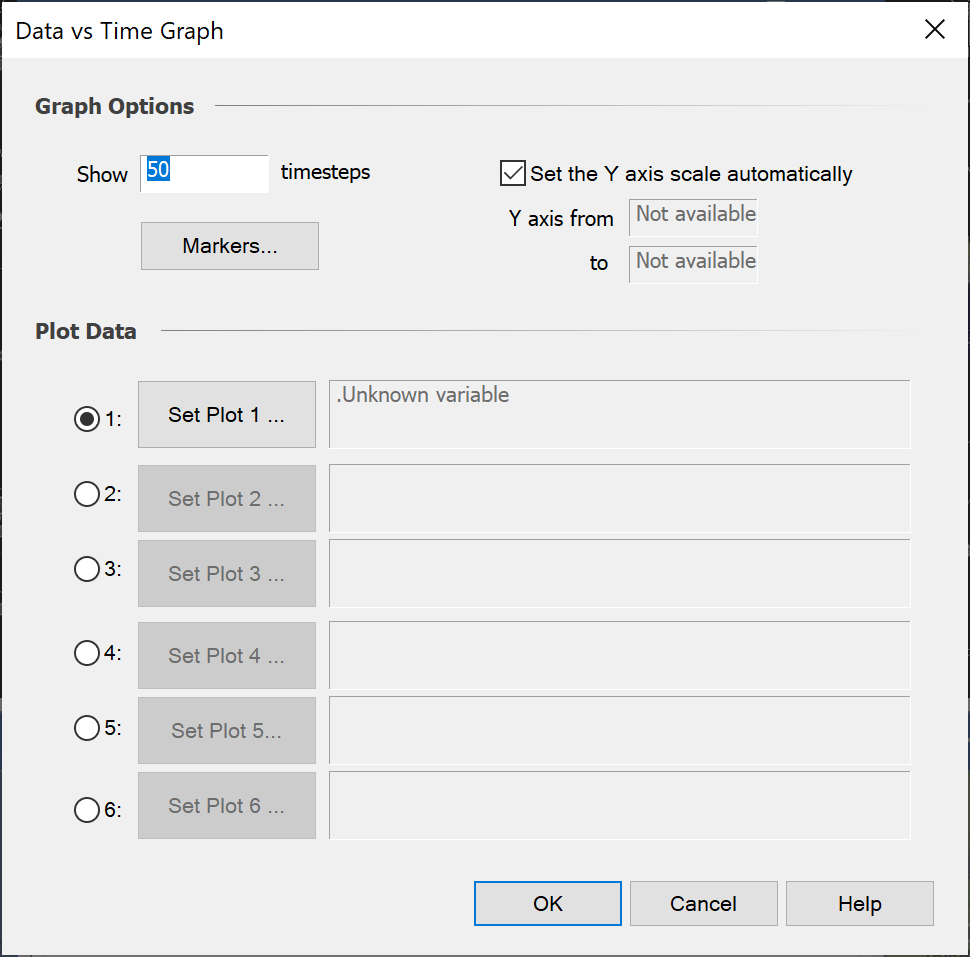
The number of time steps to be displayed can be changed in the top left of the dialog. The default is 50; the upper limit imposed by Visualyse is 1000.
An option to automatically scale the Y-axis can be selected at the top right of the dialog. This will continually adjust the Y axis range, based on the range of data values in the plotted data set.
If the automatic axis scaling option is not chosen, the minimum and maximum expected values must be specified. These default to values that depend on the type of variable to be plotted and on the current value of that variable. For example, in the case of C/I 60 dB is considered to be a reasonable range. If Data vs. Time graph is invoked when the value is 25 dB, the default maximum and minimum expected values will be 55 B and -5 dB.
The best option here is for the user to define maximum and minimum expected values based on experience or an understanding of the problem.
The ‘Set Markers’ button allows markers or lines to be added to graphs at defined fixed points. On a Data vs. Time graph this can be used to add a line at a reference, threshold value, as shown in the example below.
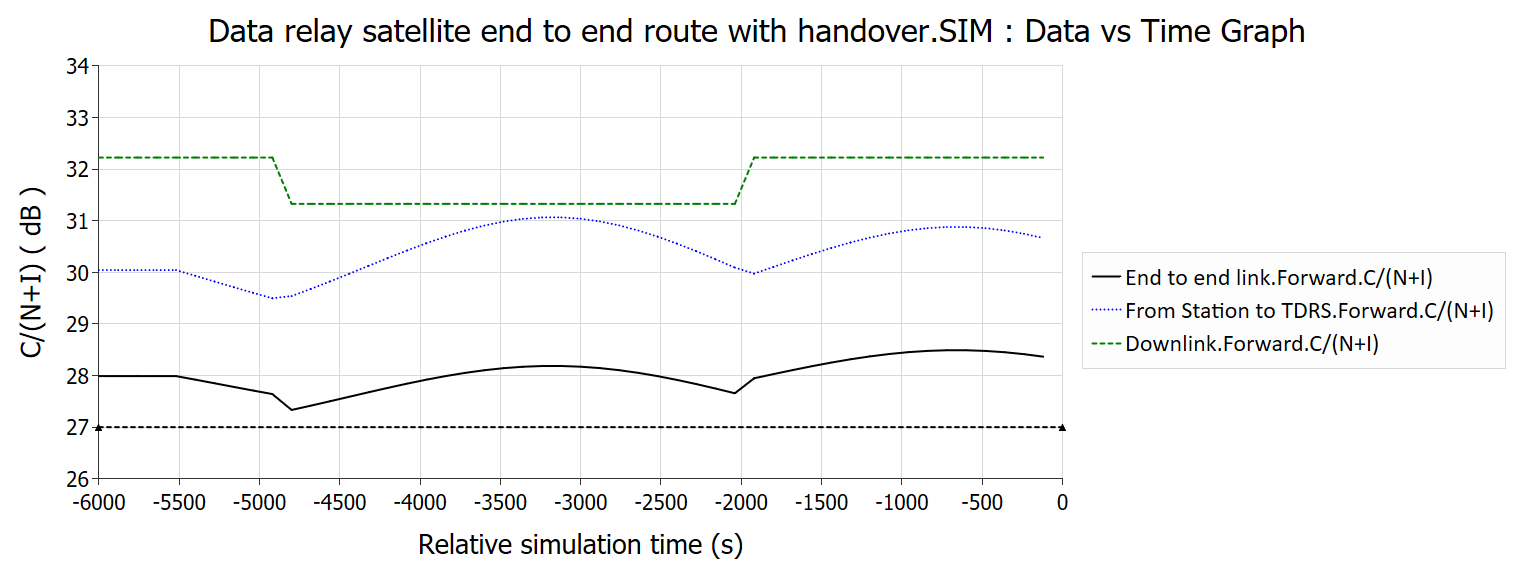
Up to six variables can be simultaneously plotted. Select the number of plots required then set the variable for each plot via the ‘Set Plot n’ button.
To select the variable to be plotted, click the ‘Set Plot’ button. You can then choose to plot Link parameters, or any other variable selected from the simulation object tree.
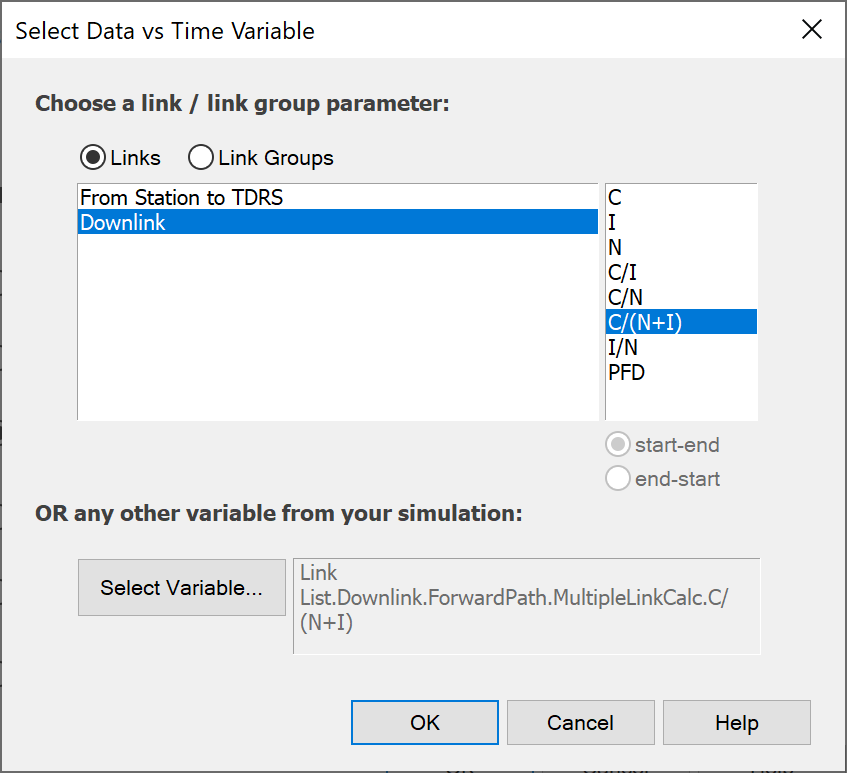
Interference parameters (C, I, N, C/I etc.) can be chosen for each defined Link (or Link Group), by highlighting the Link (or Link Group) name in the list on the left, and double clicking the variable on the right.
Other parameters can be chosen by clicking the ‘Select Variable’ button using the standard variable selection dialog.
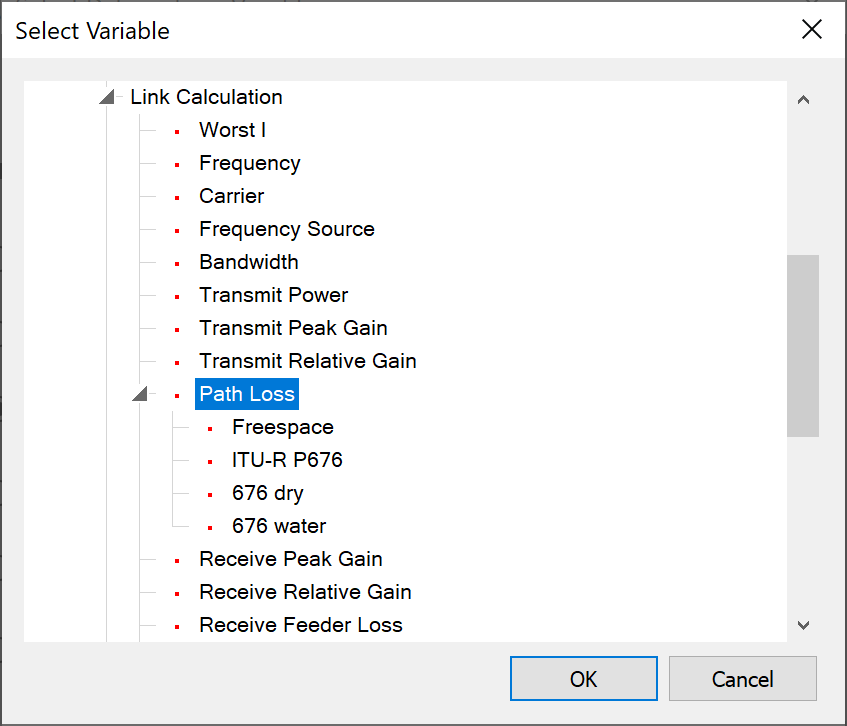
See Configuring Graphs for details of how to set the display properties of the Data vs. Time graph.
Data vs. Data Graph
The Data vs. Data graph can be used to display up to three pairs of variables on a scatter plot. An example would be to plot an antenna azimuth and elevation on the same graph for a tracking antenna. Handover of the Link to another station would appear as a discontinuity on the plot.
The Data vs. Data graph dialog is invoked by selecting Data vs. Data graph from the Analysis menu, or clicking the Data vs. Data graph icon, ![]() , on the toolbar.
, on the toolbar.
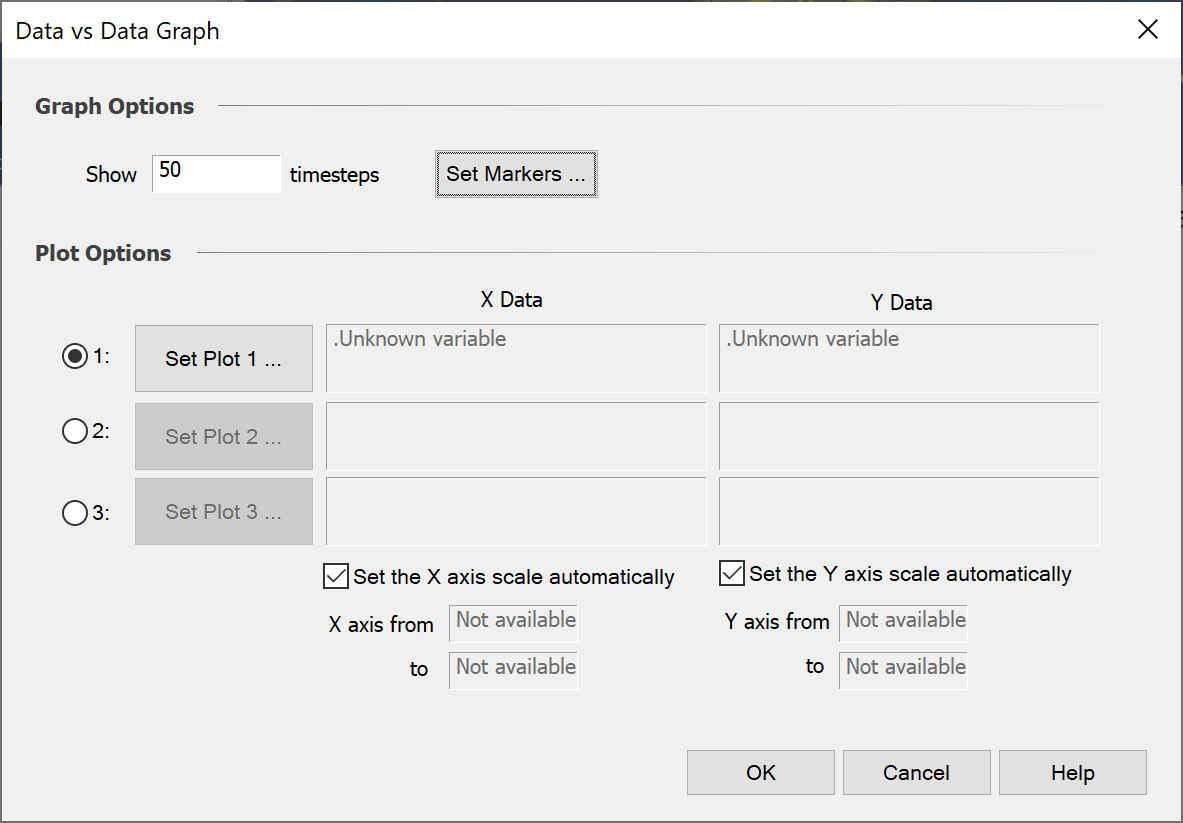
The ‘Number of time steps’ to plot and the ranges to use for each axis are inputs. The axes ranges can be automatically selected based on the range of values in the data set at each time step. If the Auto Scale option is not chosen the maximum and minimum required values need to be specified
Parameters of each plot are selected via the ‘Set Plot’ button. This brings up the Select Variable box (below)
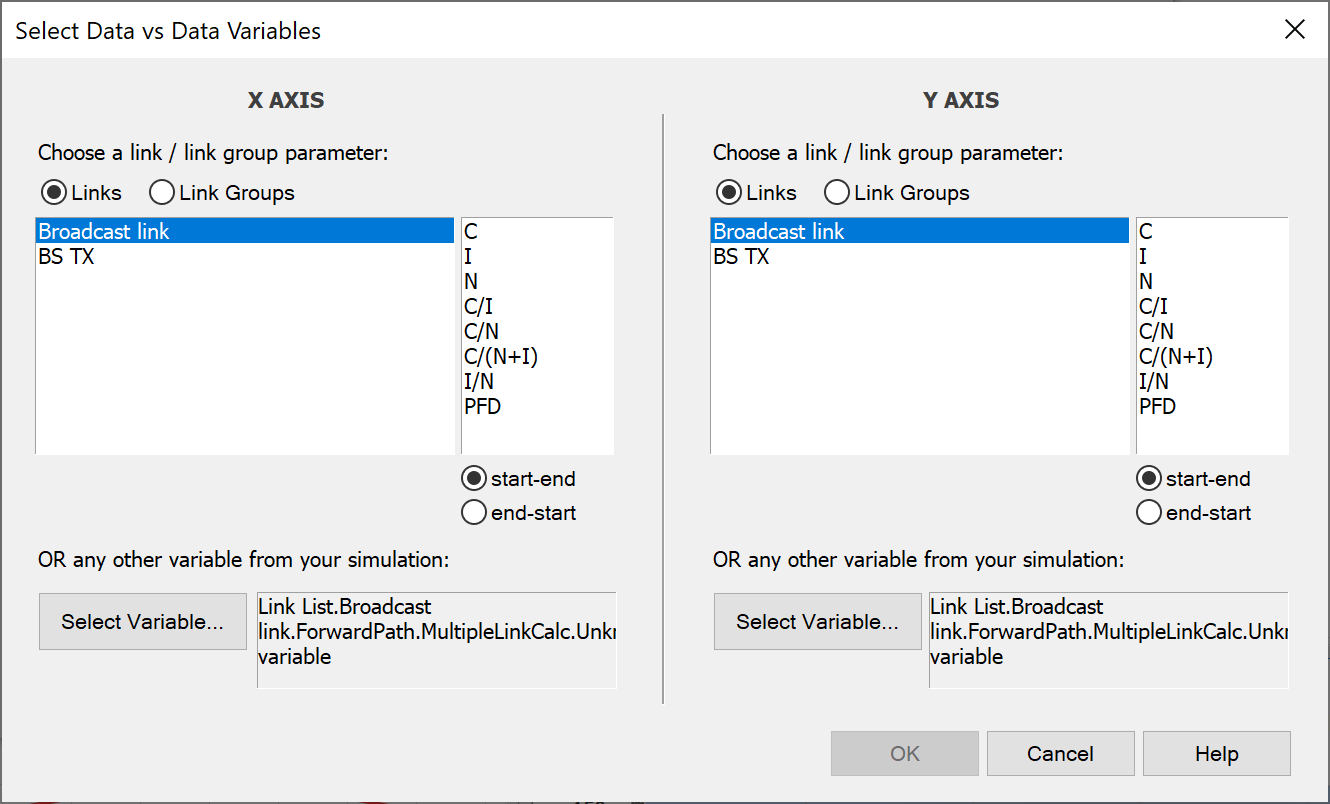
Interference parameters (C, I, N, C/I etc.) can be chosen for each defined link (or link group), by highlighting the link (or link group) name in the list on the left, and double clicking the variable on the right. Other parameters can be chosen via the ‘Select Variable’ button, which brings up the object tree.
Distribution Chart
The Distribution chart option is used to plot probability distributions and cumulative distribution functions for up to six interference parameters or user defined statistics for which histogram bin data is being calculated.
The Distribution option is invoked by selecting Distribution from the Analysis menu or by clicking the Distribution icon ![]() on the toolbar.
on the toolbar.
The dialog allows any defined statistical variable to be selected.
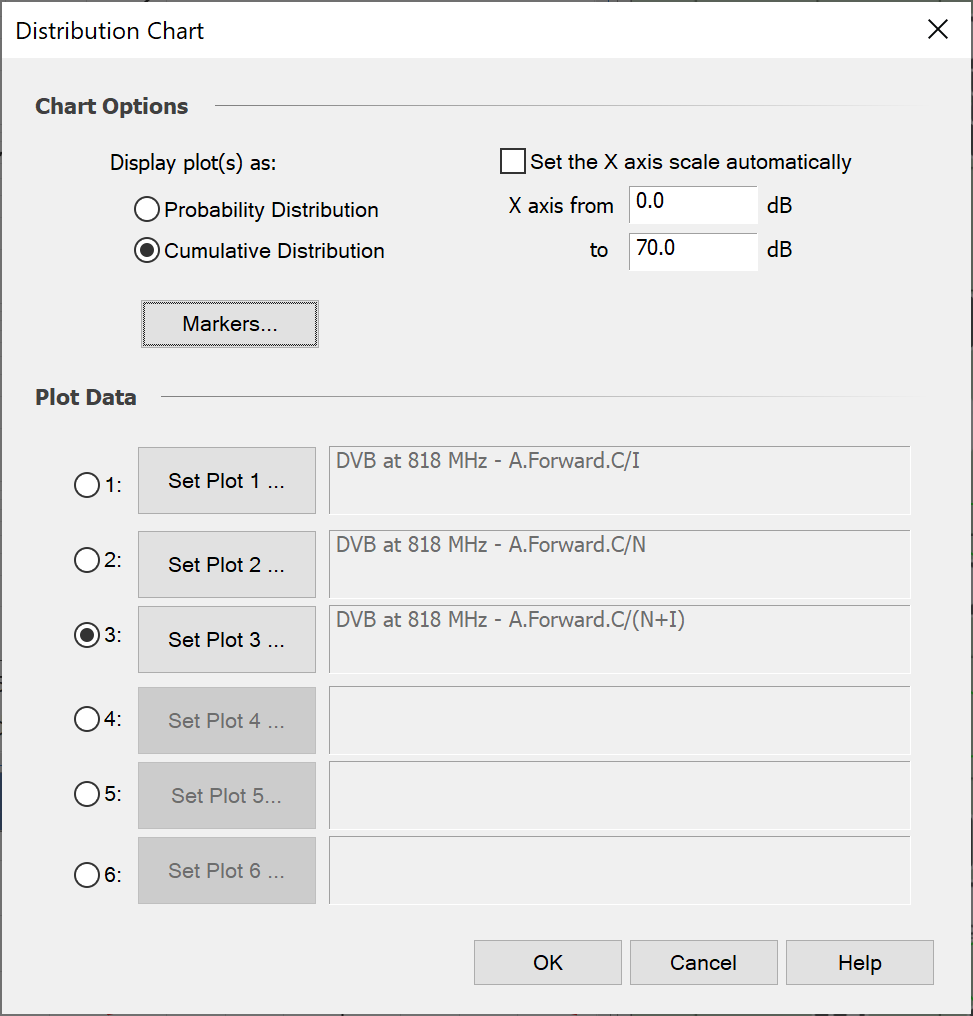
Select either ‘Probability Distribution Function’ or Cumulative Distribution Function’ in the top left of the dialog, depending on the graph type you want. The default CDF shows the cumulative distribution as a line graph.
Further plots can be selected at this stage. Up to six variables can be simultaneously plotted. Select the number of plots required, then set the variable for each plot via the ‘Set Plot n’ button.
Markers can also be added using the Set Markers button.
The example below shows three curves of C/I, C/N and C/N+I.
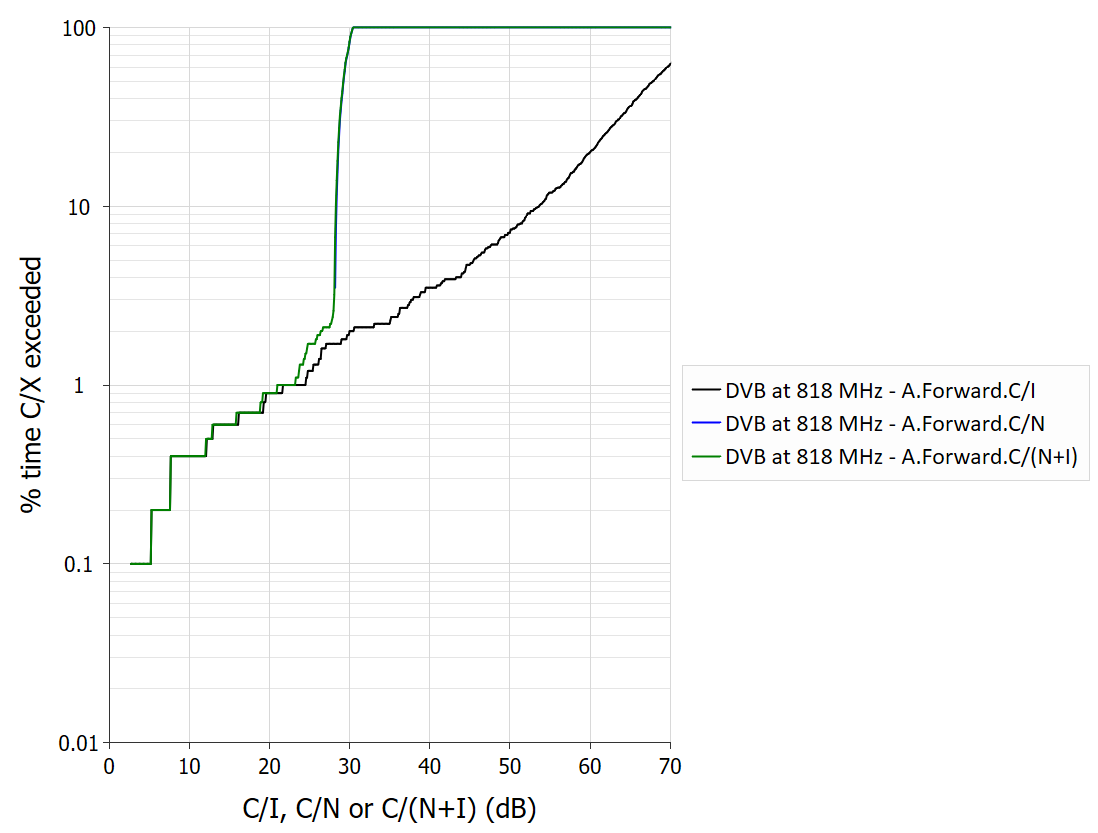
Example Distribution Chart
The Select Statistics dialog is shown below. Interference parameters (C, I, N, C/I etc.) can be chosen for each defined Link (or Link Group), by highlighting the Link (or Link Group) name in the list on the left, and double clicking the variable on the right. Other variables are chosen from the list of user defined statistics on the right.
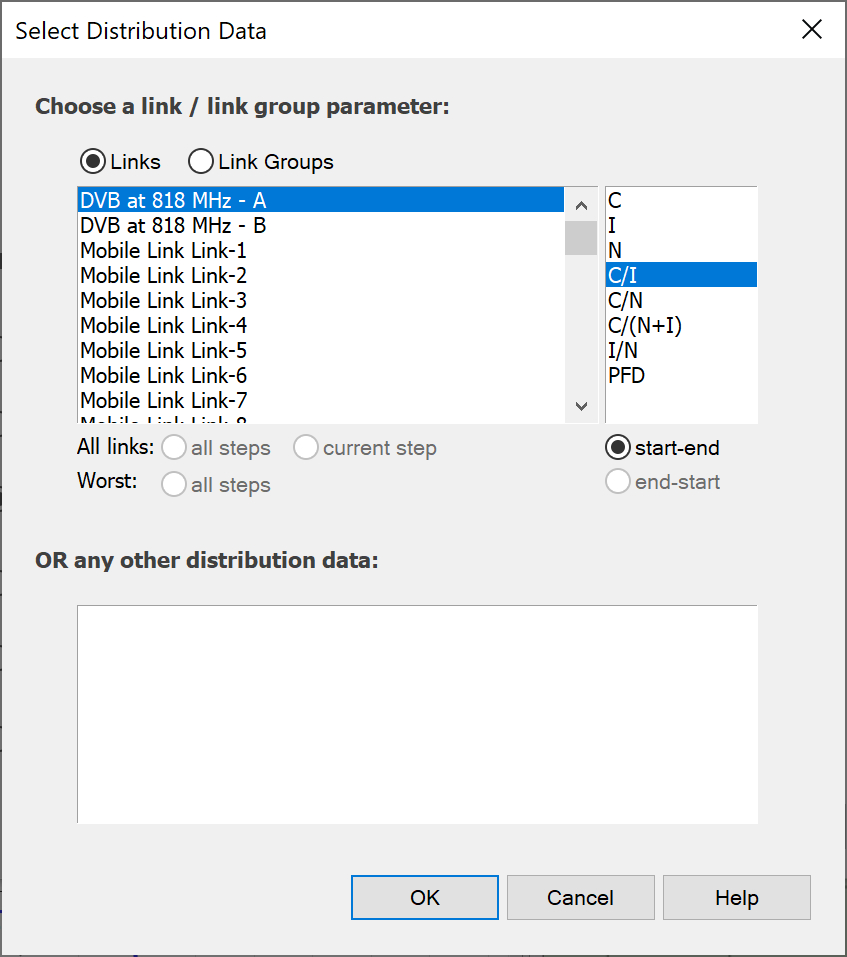
Configuring Graphs
If after creating a graph you want to change the data set used, then you can change it by selecting menu option Edit | Plot data.
All graphs can be configured via the Chart Settings dialog, invoked by a right mouse click on the graph area, or from the 'Properties' option of the View menu item. This tabbed dialog is used to configure and customise graph styles, titles, data markers etc.
The options available on each tab are briefly explained.
Titles
The colour and font styles can be set for the graph title, and X-Axis and Y-Axis labels.
The legend can also be configured on/off and have its position defined.
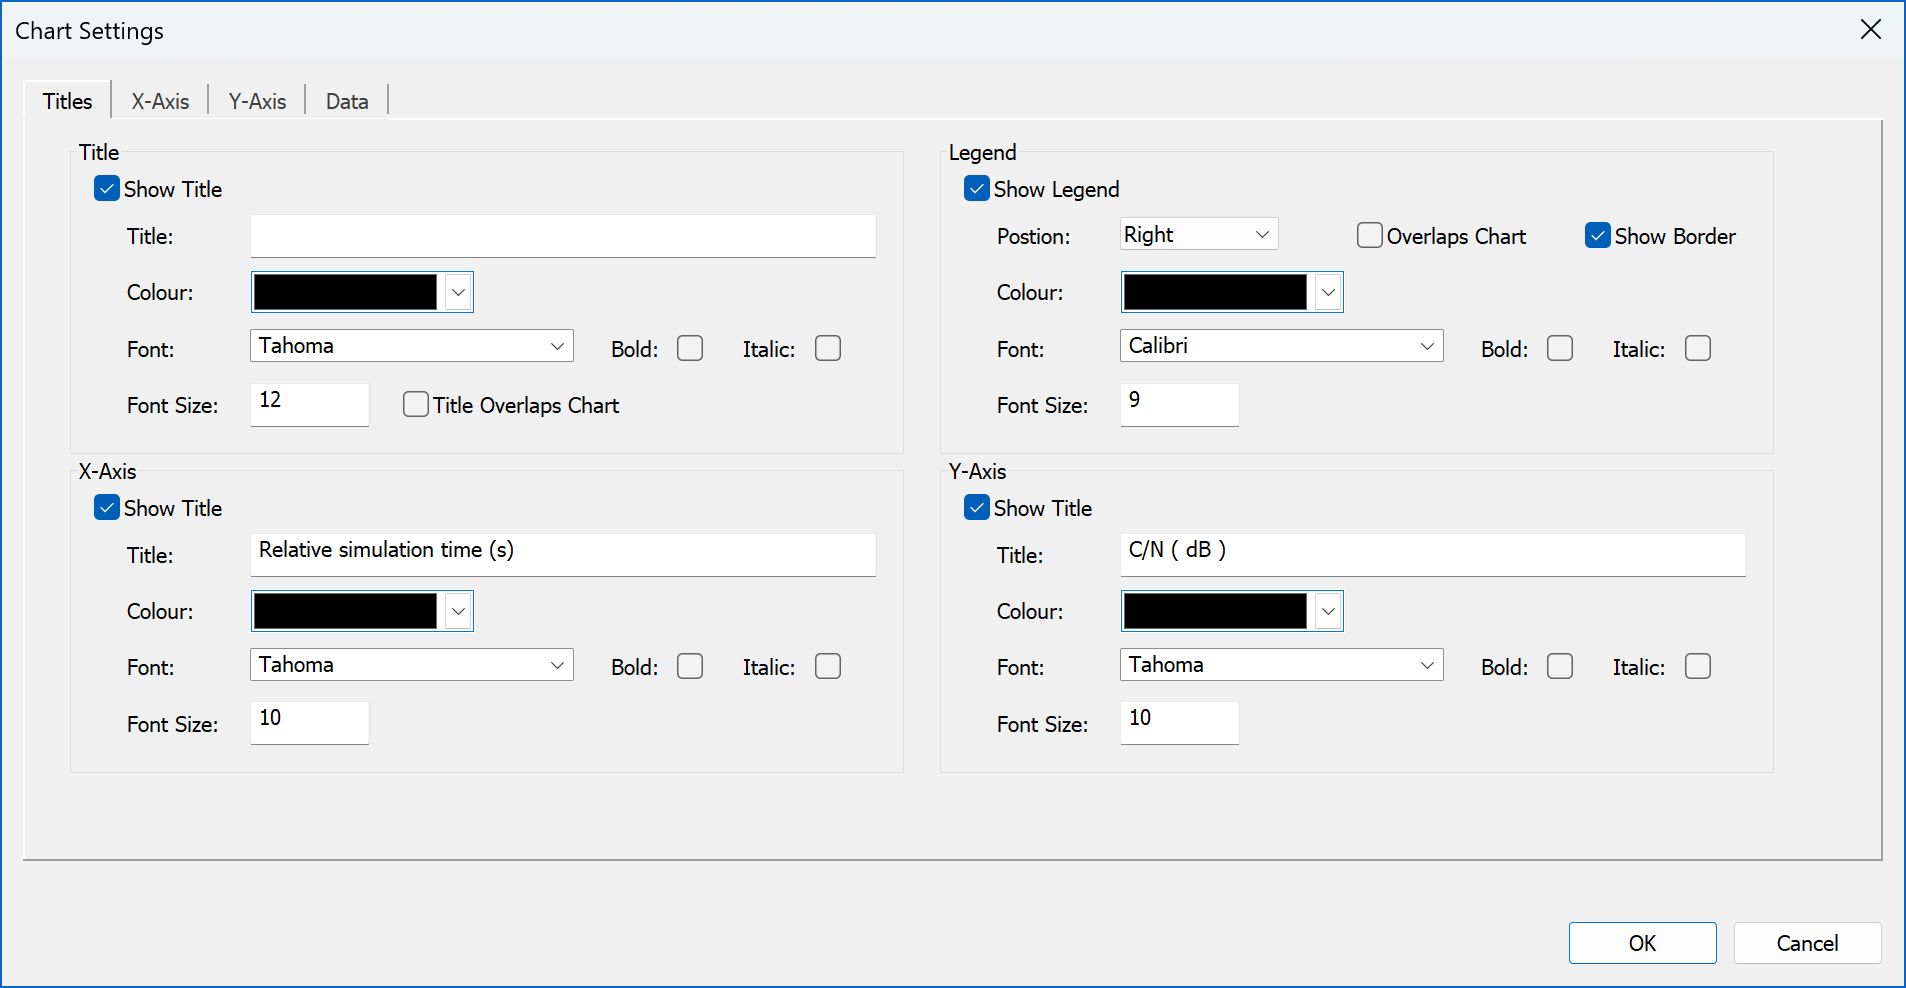
X-Axis
X-Axis properties, colours, styles and tick marks are defined here.
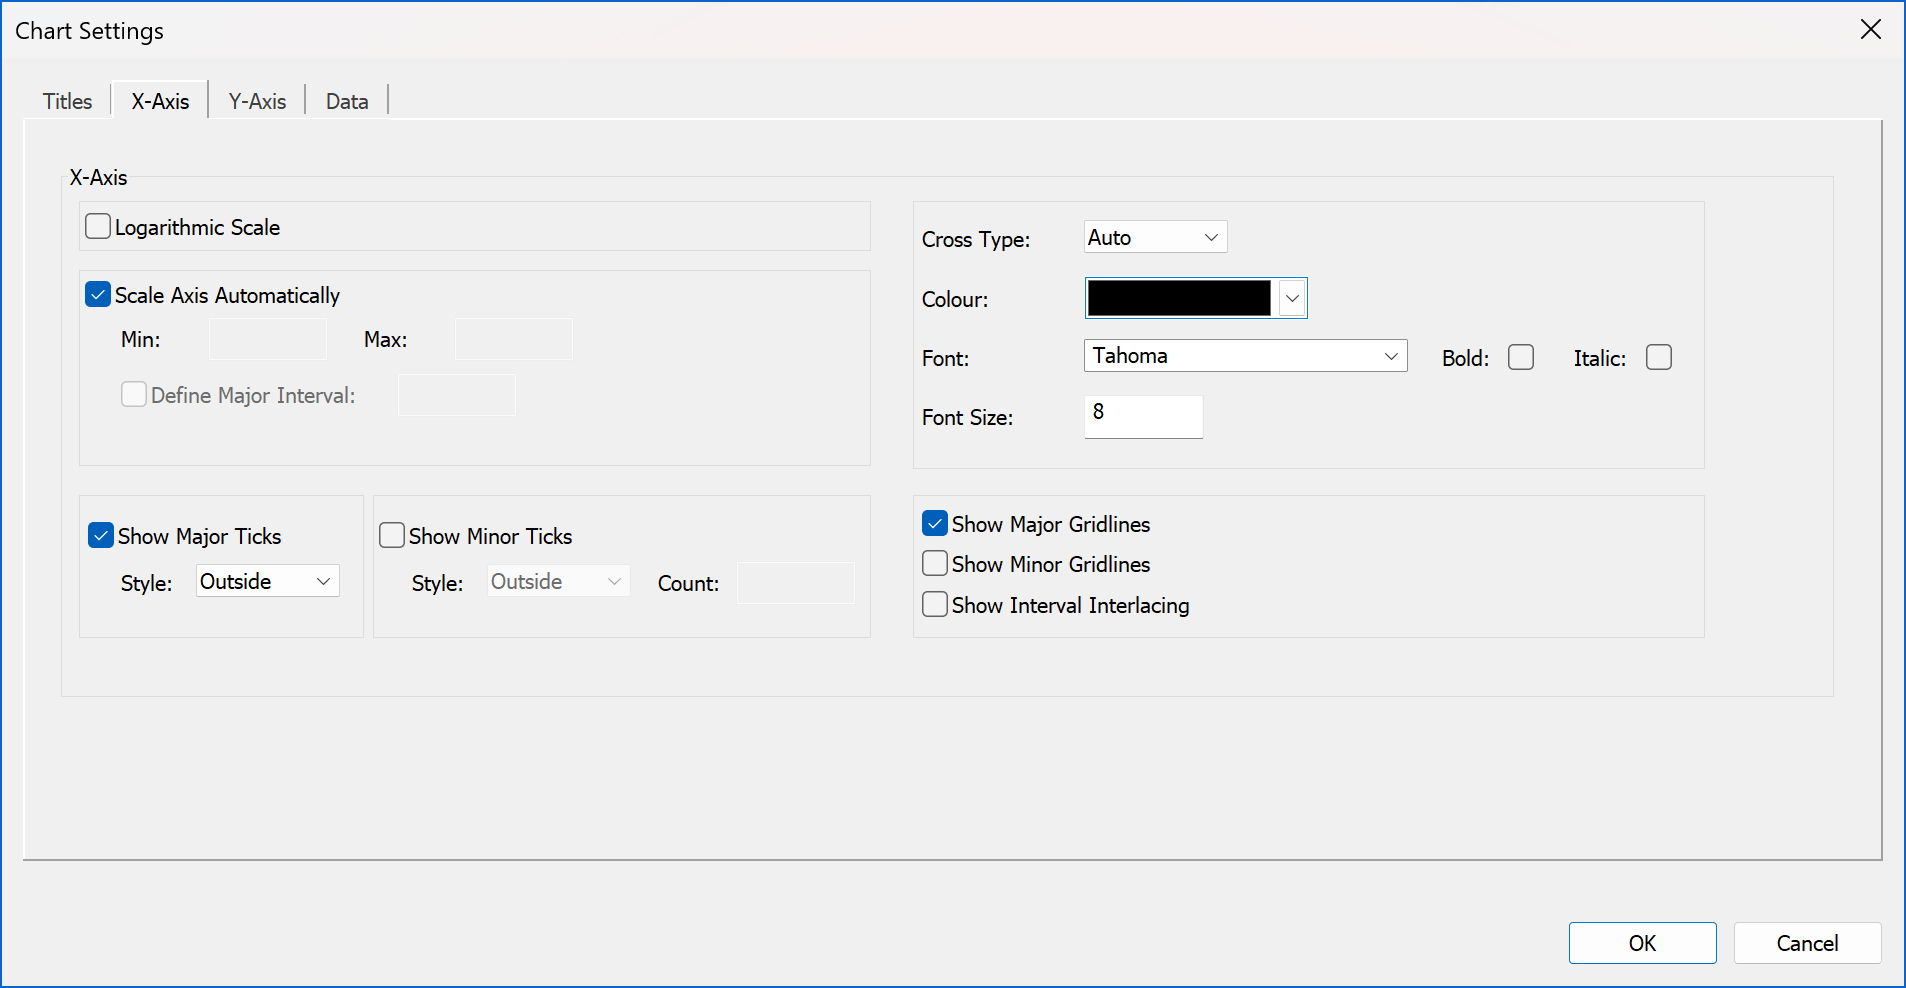
Y-Axis
Y-Axis properties, colours, styles and tick marks are defined here.
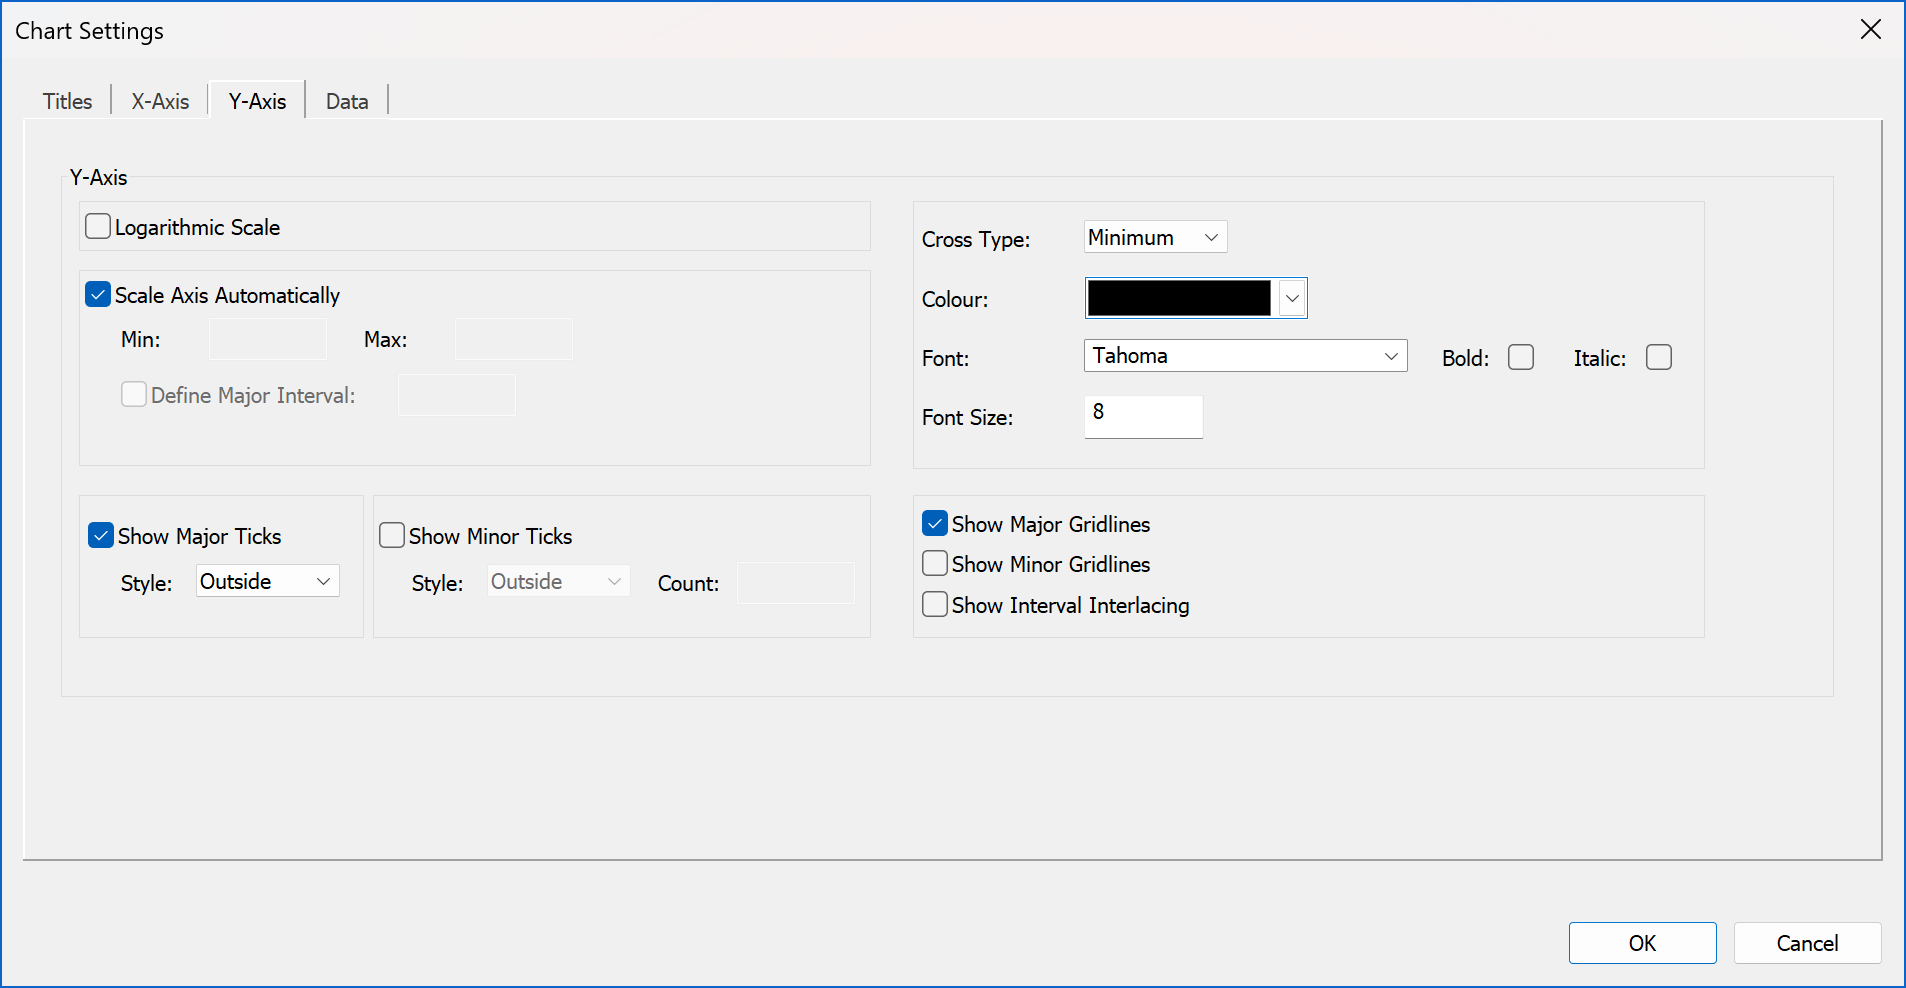
Data
This page allows the data being plotted to be changed.
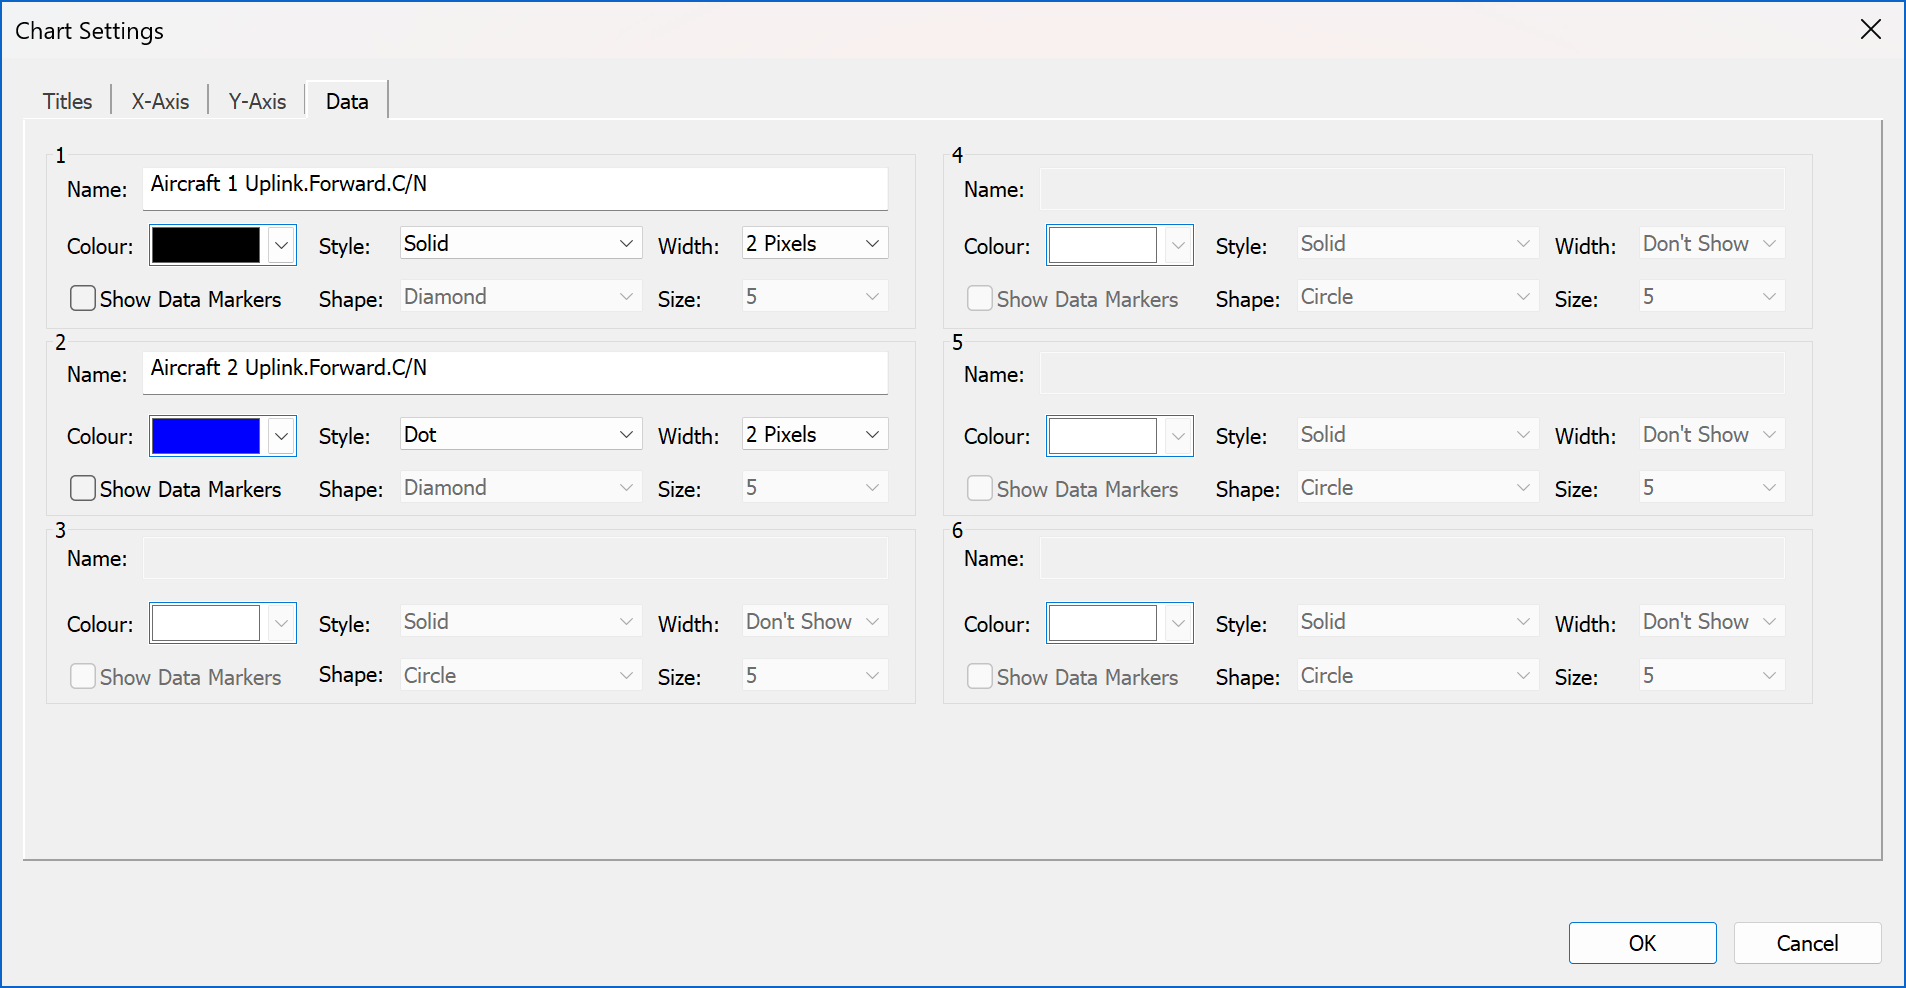
Copying Graphs and Data
Like most views you can copy the graph to paste into other applications like Microsoft Word and Excel. Note it might be necessary to use those application’s Paste | Special option to select the format that is most suitable.
In addition, it is possible to export the raw data using the menu option “File | Export plot data”.
Area Analysis
Visualyse includes a powerful feature for area analysis that is both quick and simple to use.
Area Analysis allows you to produce colour coded block plot or contours of Link or Station parameters and of the statistics of these parameters.
In outline, you simply define the area you are interested in and Visualyse will ask for a template Link (or Station) to use as a test probe at every point (down to a user defined resolution) within the area to work out the parameter you want to analyse.
There is also an alternative method called “Advanced Contouring” to produce contours using groups of stations and links as described in the last sub-section.
- Creating the Analysis
- Area Analysis Plot Options
- Display Settings
- Area Analysis Pop-Up Menu
- Area Analysis Management and Display
- Advanced Contouring using Groups
Creating the Analysis
Area analysis is started by selecting ‘Create and Area Analysis’ from the Results menu or clicking the ![]() icon on the toolbar, or by selecting the Area Analysis Manager from the Results menu.
icon on the toolbar, or by selecting the Area Analysis Manager from the Results menu.
The simplest way to create a new Area Analysis is to click the icon - you can then draw out the area on the map using the mouse. Drag the mouse from the top left to the bottom right of the area of interest.
When you release the mouse you will be prompted to select a Link to use as your template, and will have to select the parameter to analyse, as in the figure below.
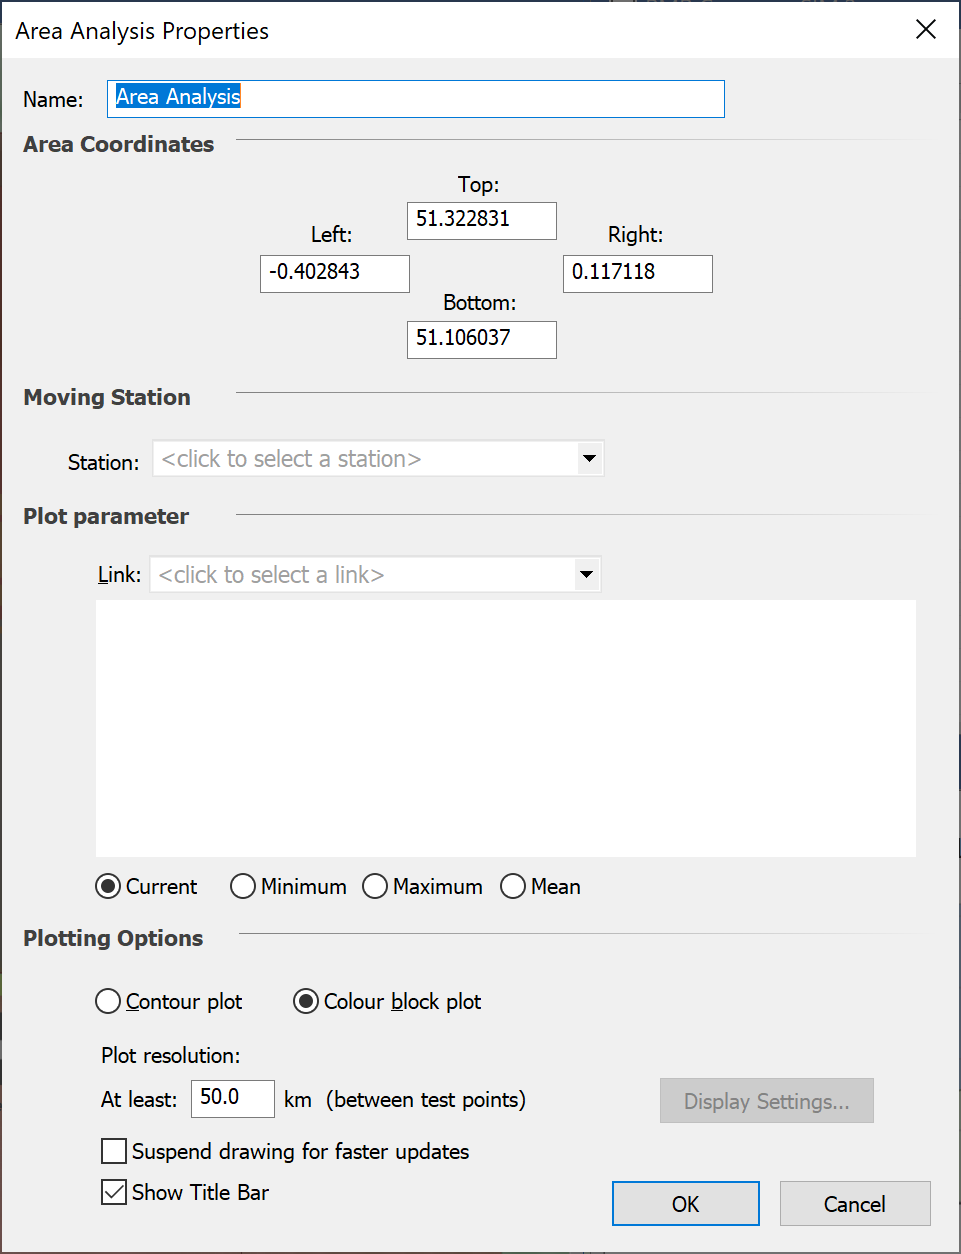
The Area Analysis properties page has the following parameters:
- Name
- Coordinates – if you have defined the area by drag and drop, the coordinates of the corners will be shown here and can be edited
- Moving station – one station must move in over the defined area. If you are looking at something like coverage analysis, this Station will be the receive station. If you are looking at interference levels it would be victim station. If you are looking at exclusion zones, it would probably be the interfering station.
- Plot parameter – select here the variable to be displayed in the Area Analysis for each location of the moving station
- Adjustment during run – this allows the field to display to take account of the simulation run, so that either the value for the current time step at each time step is shown or the min / max / mean over all time steps at each point is shown.
- Plotting options – as described in the following section
- Control to suspend drawing at each simulation update (including time step) to improve performance
- Control to suspend drawing of the Area Analysis title bar.
You can re-size the Area Analysis by clicking on the “Select Mode” icon on the toolbar and then dragging and dropping one of the corners or edges of the Area Analysis Rectangle.
Area Analysis Plot Options
You can plot the area analysis as a grid of coloured blocks (block plot) or as a series of contours (contour plot). Examples of these are shown below.
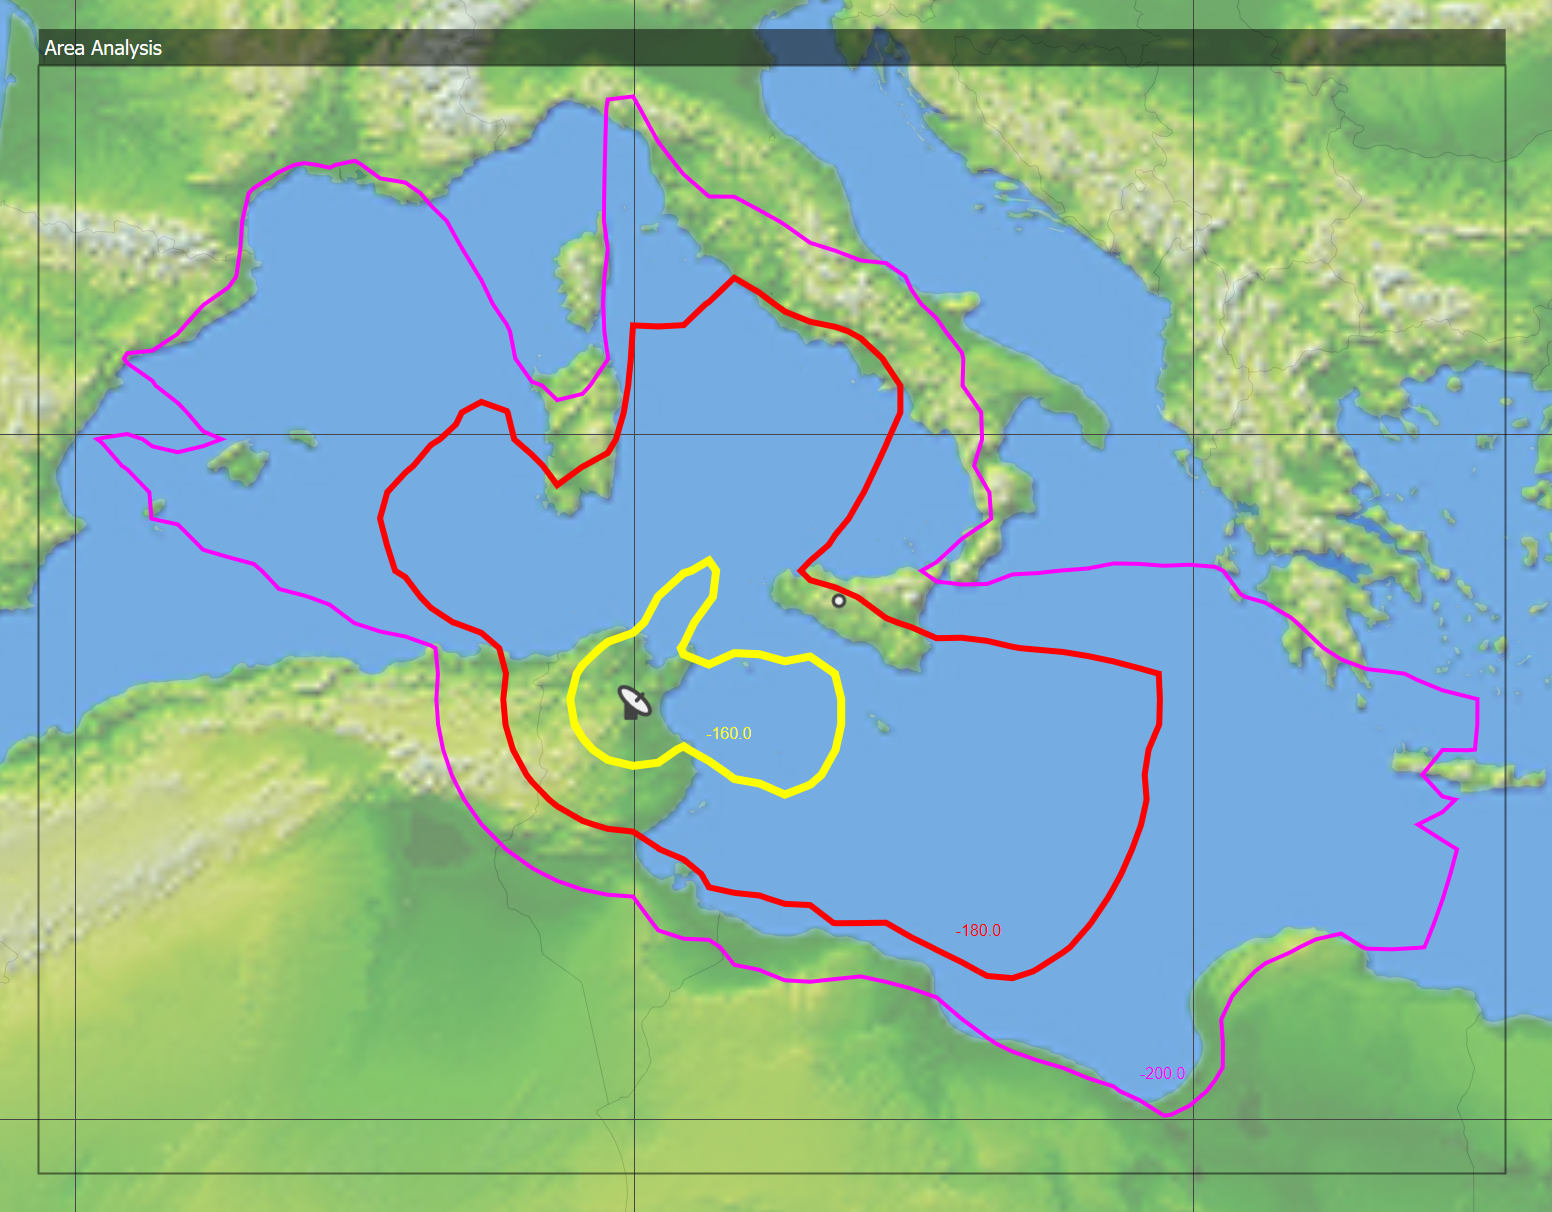
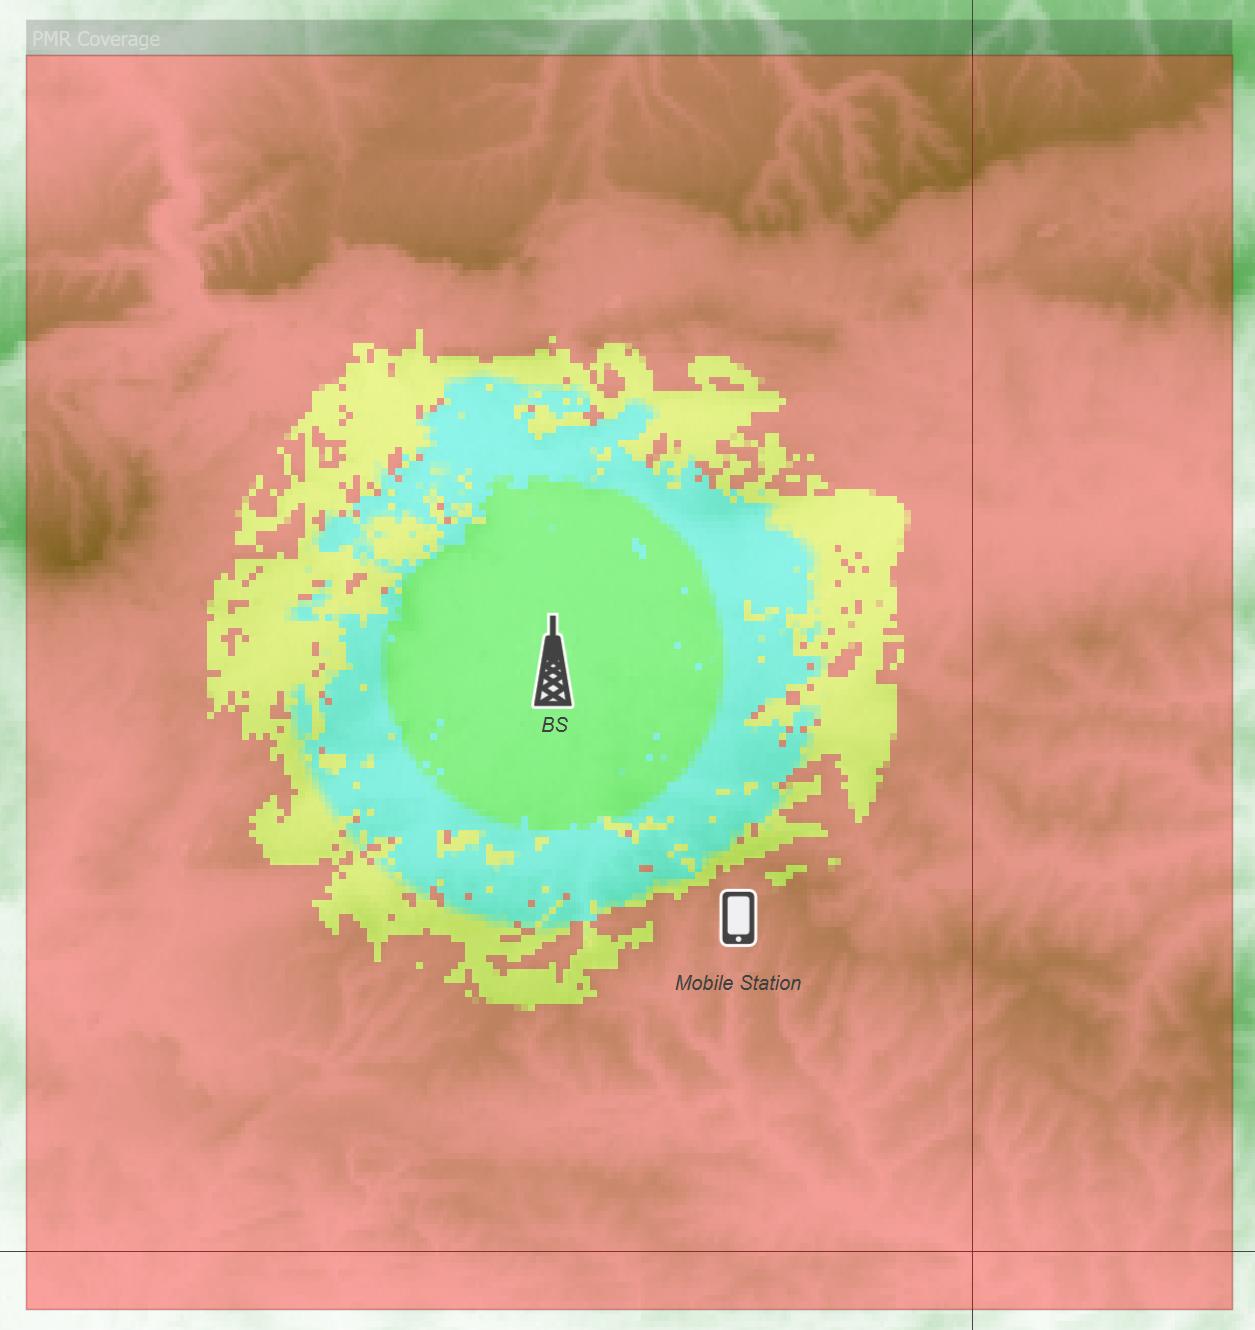
The number of kilometres between test points defines the resolution of the analysis. You can set this from the dialog.
Display Settings
The display settings depend on the type of plot you select.
Block Plot Display Settings
A block plot shows the variation in the chosen link parameter by plotting a block of colour at each test point. The display settings allow you to determine how the blocks are coloured, what ranges to plot and how the plot is rendered. The Display Settings dialog is shown below.
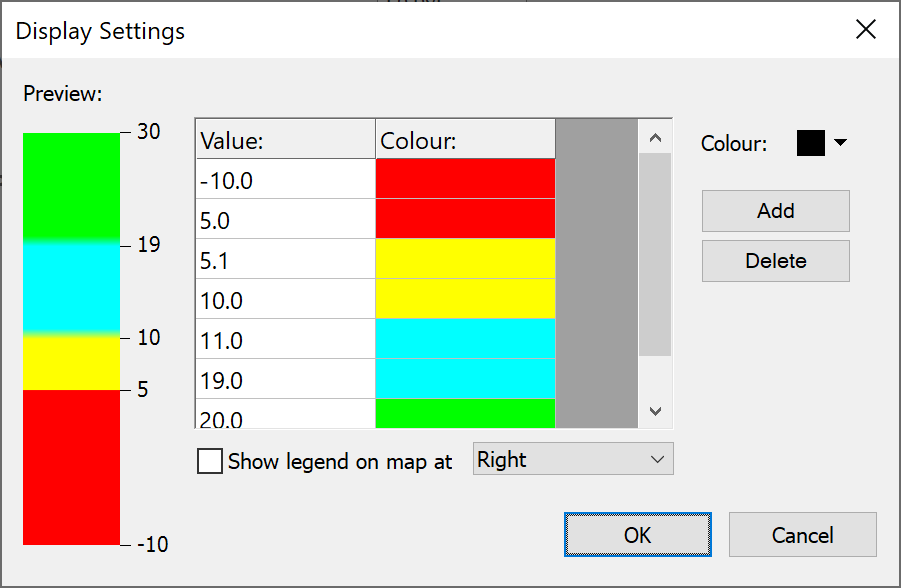
You can press the ‘Add’ button to add new levels and then:
- Type in the value in the first column
- Select the colour from the colour select control at the top right.
The left side of the dialog shows a preview of how the colours will appear on your plot. Calculated results between value entries in the table will result in a colour blended between the nearest two colour entries.
There is also a field to enable display of a legend on the map offset to one side of the Area Analysis, as in the figure below showing example file “PMR Coverage” from the “Network Coverage” example files.
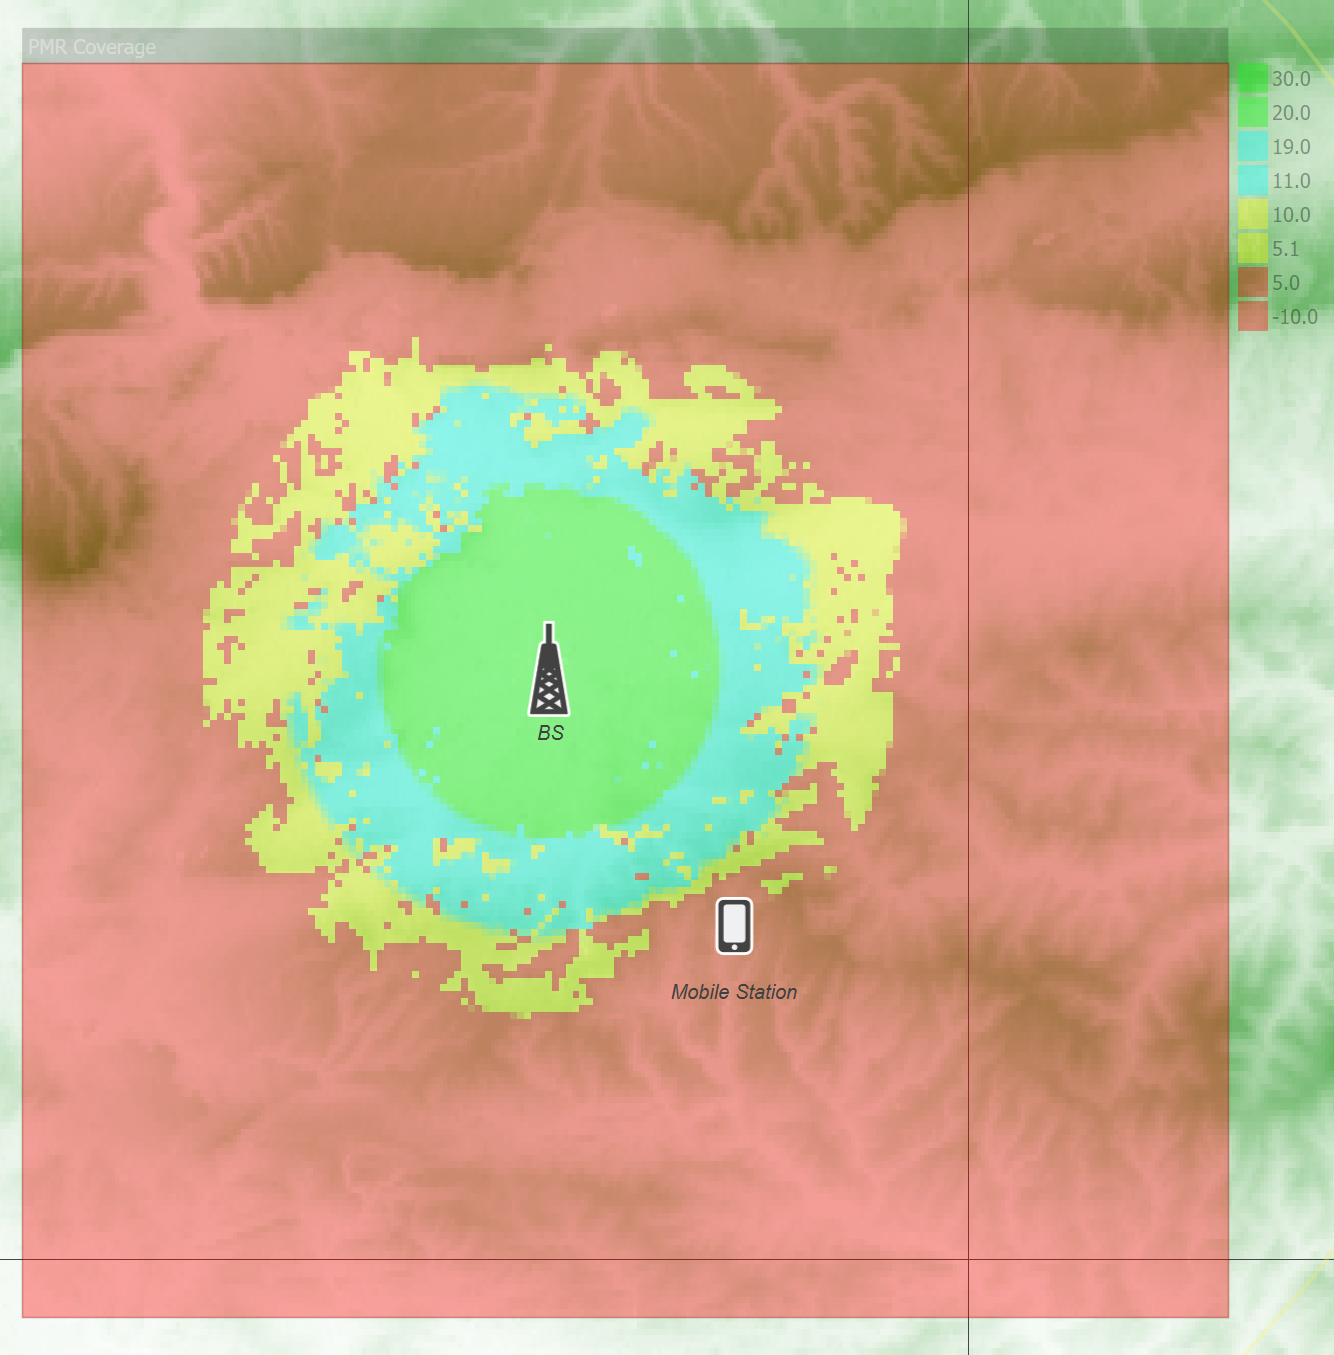
Colour Selection Tip 1: to create a map from ranges of values to a single colour, include two entries, one for the start and end of the required range. So in the example above yellow is used for C/Ns between 5 and 10. The first is offset slightly to 5.1 so it is greater than the end of the previous range, which is that C/Ns between -10 and 5 should be in red.
Colour Selection Tip 2: it is possible, and often useful, to set colour as “Don’t draw”. This can be useful to show in colour where criteria such as coverage is met and no colour where there is no coverage.
Contour Display Settings
Contour plots show the variation of the link parameter across the area as a set of contours. Because there are only a discrete number of contours, you can set their levels and colours individually. The display settings dialog for contour plots is shown below.
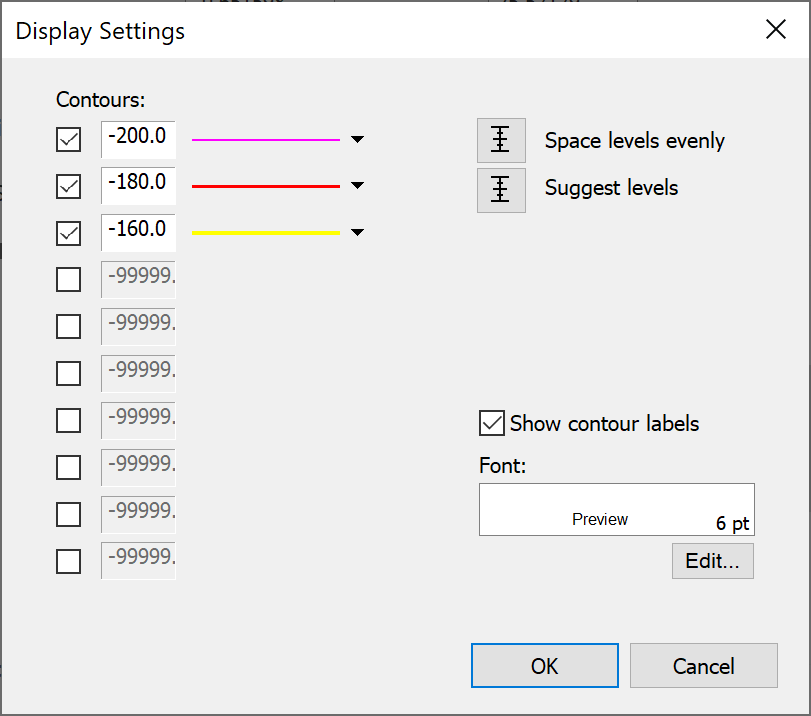
You can show up to ten different contour levels on your plot. These are shown on the left of the dialog. To set the level for a particular contour, simply enter a value for it in the appropriate box.
To change the line style or colour of a particular contour, click on the line style control.
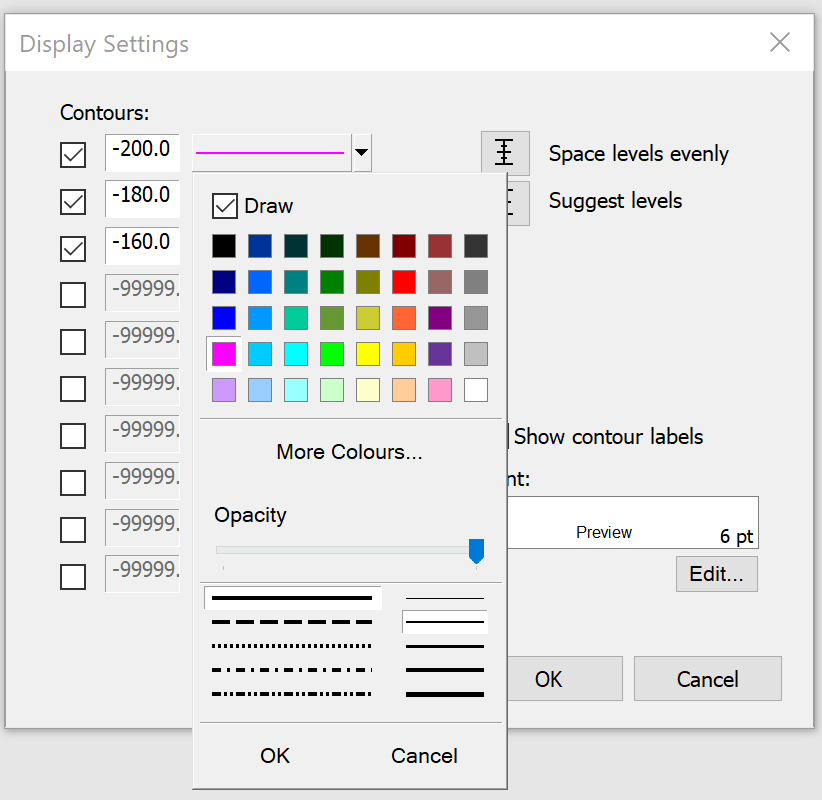
You can switch off contours by clicking on the appropriate check boxes.
If you want to display several contours between two levels, set the top and bottom contour levels to the extreme values and click “Space levels evenly” to automatically set the levels for the contours in between.
If you are not sure what the likely range of values will be in your plot, click “Suggest levels”. This will establish the likely range of values and fill in the contour levels with suitable values.
You can choose whether to show a label for each contour. The font for the contour labels can also be changed.
You can save your contour settings as schemes for use another time. A number of schemes are supplied with the software. The values at the levels are not saved as these are highly dependent on the individual plot.
Area Analysis Pop-Up Menu
There are additional controls in a pop-up menu: to activate this right click on the Area Analysis.
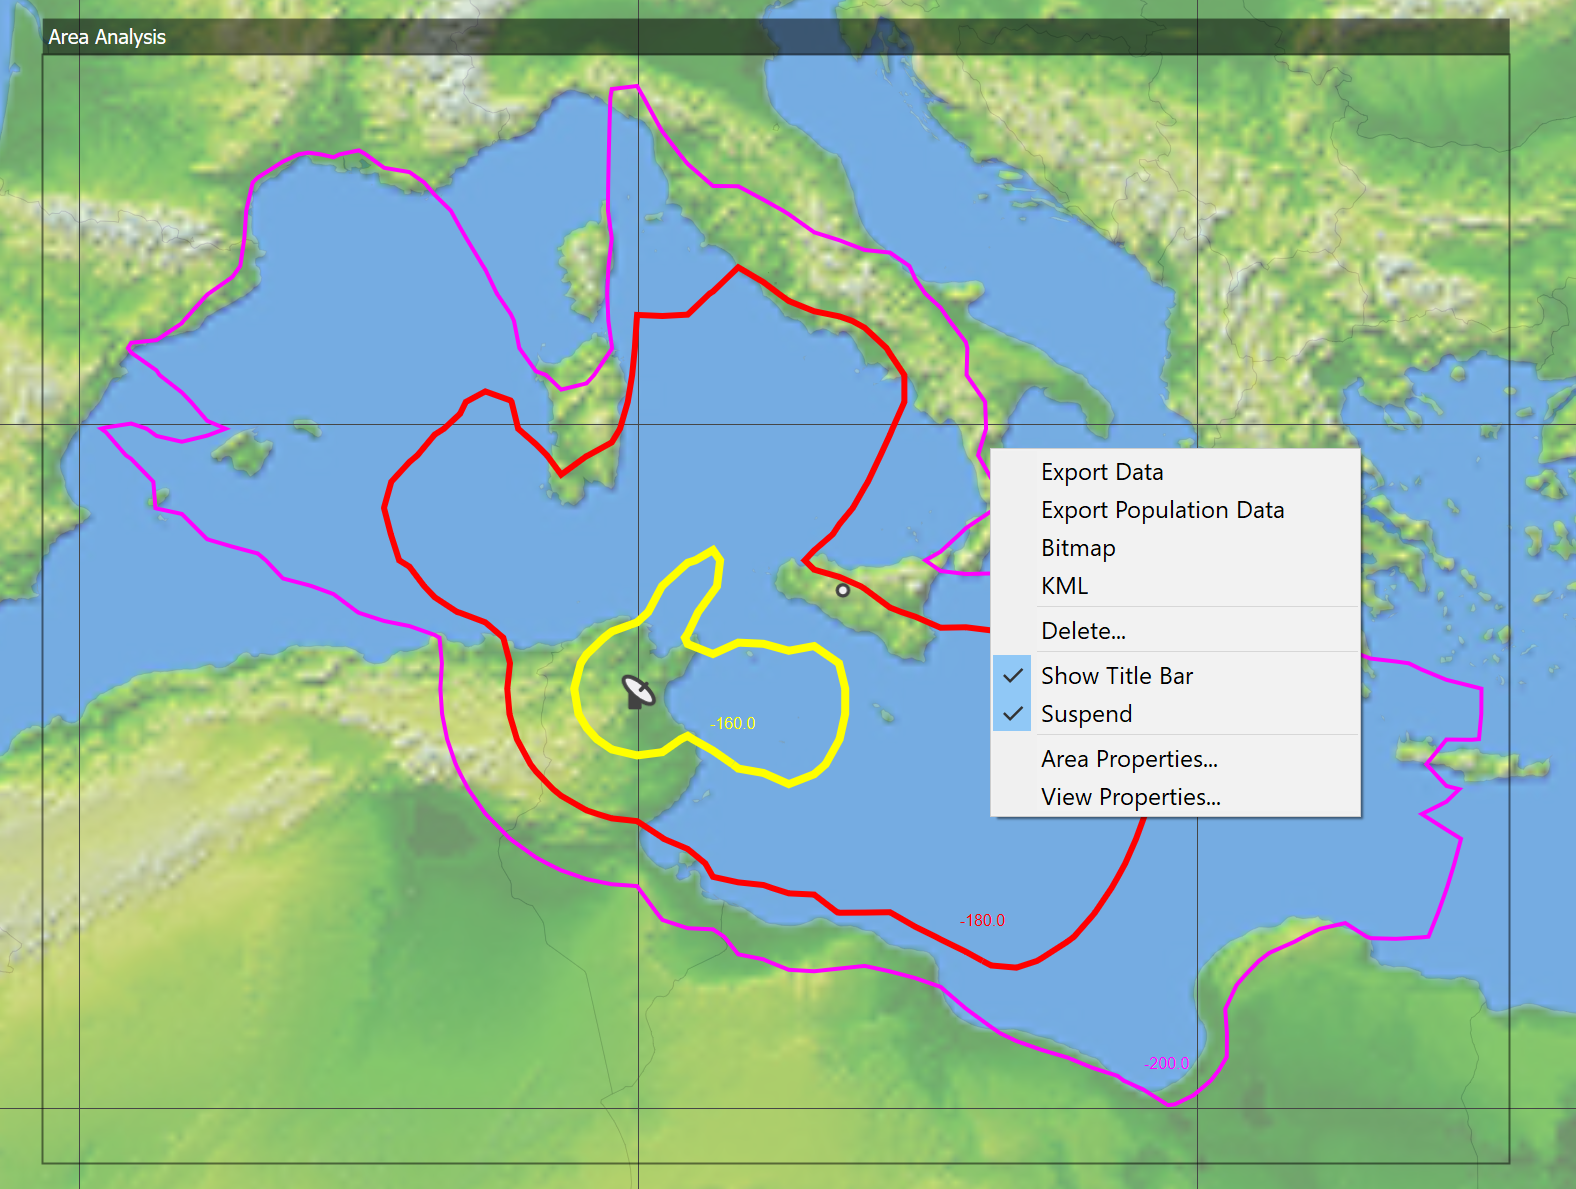
This gives additional options for the Area Analysis including:
- Export data: save the data as a comma separated values (CSV) text file for additional analysis
- Export population data: save in CSV format the population associated with each of the contour or threshold levels defined under Area Properties. This requires the population data directory be set as in Population Data Settings
- Bitmap: saves the image produced by the Area Analysis as a bitmap
- KML: exports data from the simulation including the Area Analysis to be displayed in Google Earth (see Interface to Google Earth)
- Delete: deletes the selected Area Analysis
- Suspend on/off: stops re-calculation of the Area Analysis every time the simulation is updated. This is useful for calculations that take a long time to complete. Remember to un-suspend to show the results!
- Area Properties: opens the Area Analysis configuration dialog as described in Creating the Analysis
- View Properties: opens the view configuration dialog as described in Map View
Tip: It is often useful to create Area Analysis that do not completely overlap so that it is possible to right click on each to open this list of options. However remember the Area Analysis Manager (see following section) can be used to open the properties of any Area Analysis – even those covered by others.
Area Analysis Management and Display
All the Area Analysis defined for the current simulation can be accessed via the Area Analysis list, accessed via the Results menu option “Area Analysis Manager”.
The dialog allows control on the Area Analysis, including buttons to:
- Add
- Edit
- Delete
- Duplicate
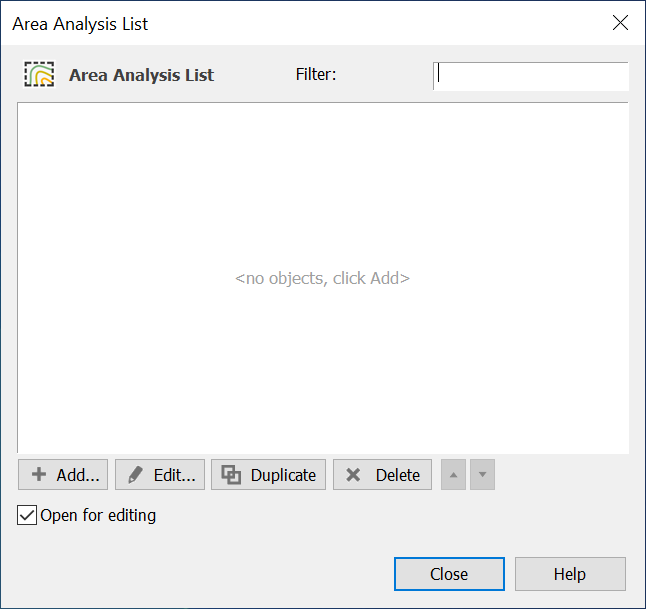
Any of the Area Analysis can be shown on any map or 3D view where they are controlled via the overlays tab on the view properties: see Overlays for more information.
Advanced Contouring using Groups
This section describes an alternative way to generate contours using a grid of stations and associated links.
It is accessed via the properties dialog of:
- Map Views (Mercator or Plate Carrée)
- 3D View
On the view properties dialog on the first or “Features” tab there is an “Options” button under “Advanced Contouring”. If you click on this you will be able to configure the contours using the following two pages:
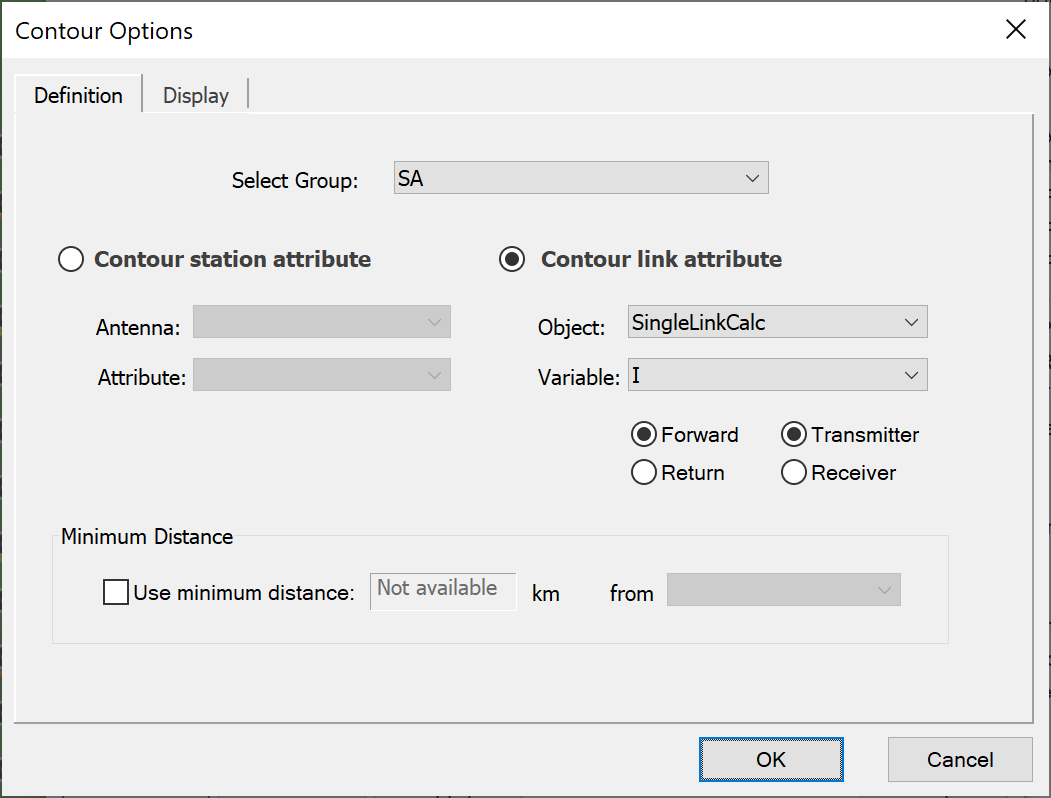
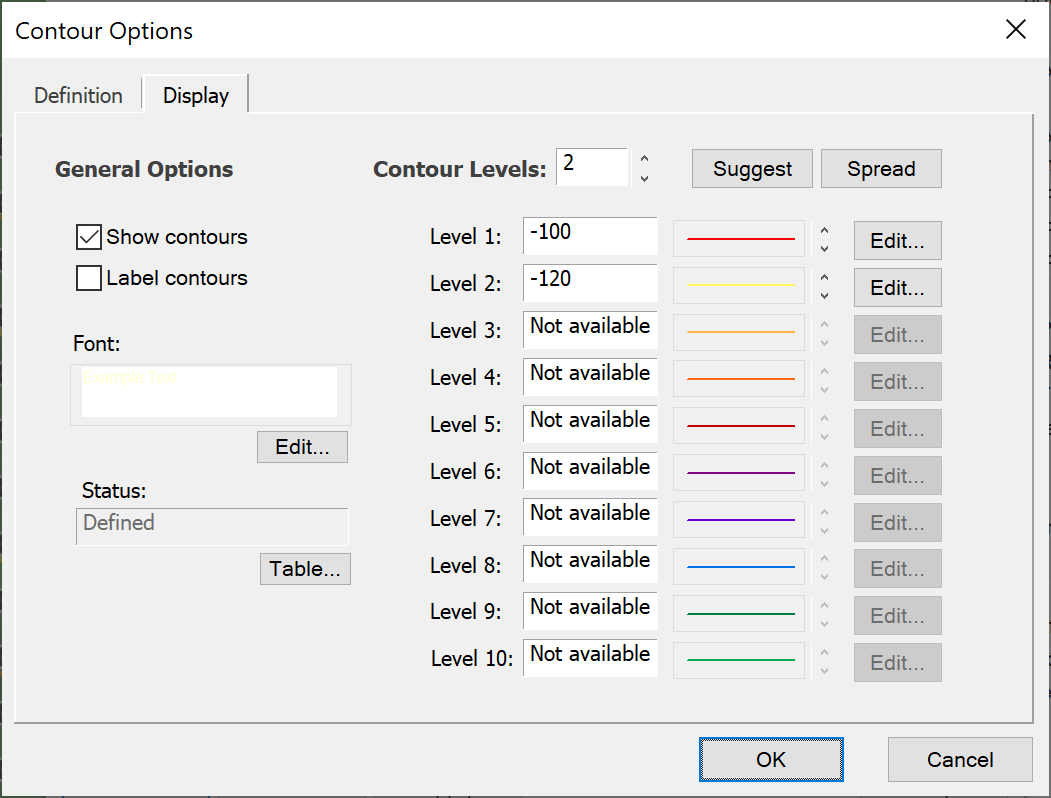
To make this form of contouring work you must:
- Create a grid of test points using the Station Group Service Area Wizard. This can define the service area by {Region, Beam footprint, or Country} but not {Locations or Hexagonal Cells}. On the final page the option selected must be to fill the area with stations in a grid defined by a number (North, East).
- For each of these stations create a link using the “Link to Station Group” Wizard. Often this is a Receive Link but it could be Fixed Link or even under some circumstances a Dynamic Link. However, it cannot be a Transmit Link.
- Configure the rest of the simulation including any other stations, links and interference paths.
Having done these three steps there will be a Link Group which has an associated station (either the start or end station) which is one of a grid of test points. It is therefore possible to associate a value from any of the link calculated values for each point on that grid and then contour it.
It is often useful to check that the values are as expected for one or two links using the standard Watch window.
When the simulation has been configured, it is possible to define the contours to display using the two dialogs above. This is done in two stages:
-
Define the Data to Contour
The data to contour is defined using the “Contour Definition” dialog shown in the figure above, and consists of:
- Select of group to use: this is usually a link group which have stations at one end that are in a regular grid
- Select whether to display a Station attribute (such as elevation or azimuth angles) or Link attribute (many of them, including C, I, C/I, C/(N+I), I/N etc)
- Select the object and variable from it to display: this is similar to the selection of a variable in the Watch window.
- Select the link direction (either Forward = Start to End or Return = End to Start) and then whether the grid of test points is the transmitter or receive station for the selected link direction.
It is also possible to define a minimum distance: this feature could, for example, be used to define a minimum coordination distance for Mode 1 or Mode 2 contours derived using RR Appendix S.7.
-
Define how the Data is to be Displayed
The contour levels and labelling is selected using the “Contour Display” dialog shown in the figure above.
This dialog is similar to the controls used to select beam or link levels on the view properties dialog.
Area Analysis vs Advanced Contouring
In general the Area Analysis tool is much more flexible and results in smaller simulation files that are quicker to load.
There are a few cases where it can be more useful to use the Advanced Contouring option. One is shown in the figure below, where by the grid of test points are all within the area defined by a polygon (in this case France) rather than a square that could include other countries or the sea.
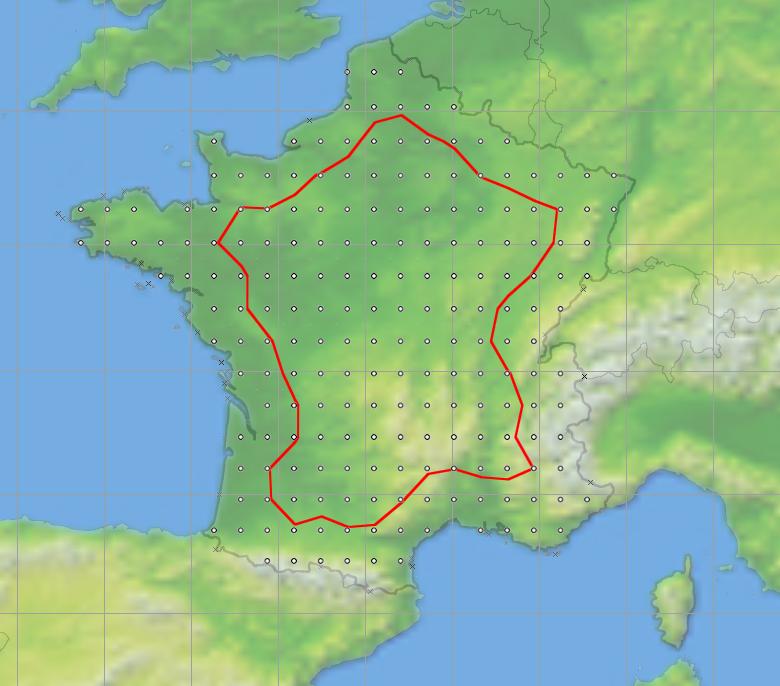
In this example a grid of test points with France has been used to generate a contour of locations where a 50 dBW transmitter at a height of 100 m would just meet a PFD threshold on the sea or land boundaries of France.
Interface to Google Earth
There are two places in Visualyse where provides an interface to Google Earth. The first is on the File menu, the second is via the pop-up menu you get if you right click on any of the map or 3D views.
Export items using File Menu Option
When a 2D or 3D map views is active, the File menu gives you the option to ‘Export to Google Earth …’.
Click on this option and the following dialog appears:
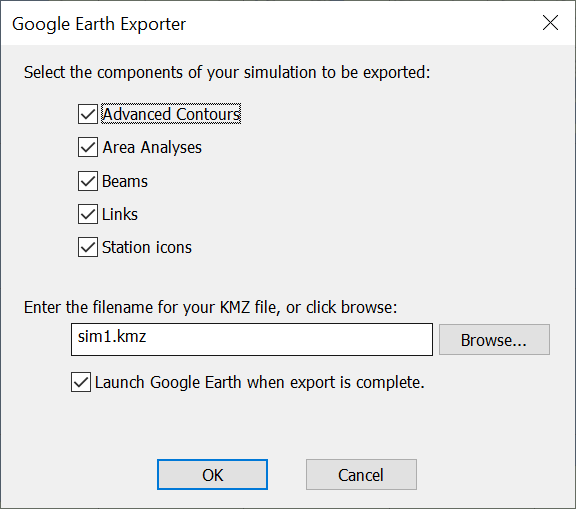
You can selective export all the Advanced Contours, Area Analyses, Beams, Links and Station Icons (together with their locations) from the current simulation.
Define the file location and Visualyse produces a .KMZ file: by default this will be in the same location as the sim file.
If the final box is checked, Google Earth will be launched automatically when the file export is complete (assuming it has been installed).
Export items using Pop-up Menu
If you right click on either of the map views or the 3D view outside of an Area Analysis, you will get a pop-up menu as shown below:
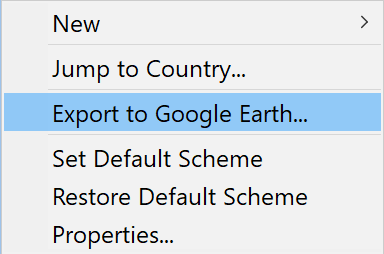
If you select “Export to Google Earth…” you will get the same dialog as above, and can use that to create a KMZ file and start Google Earth automatically.
If you right click on either of the map views or the 3D view inside of an Area Analysis, you will get a pop-up menu as shown below:
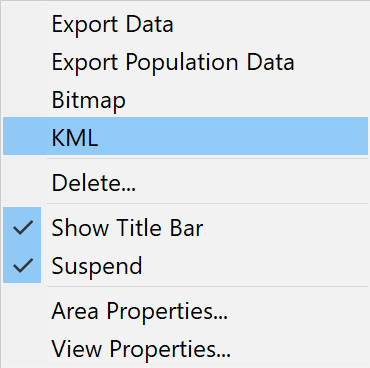
There is an option here, “KML”, that allows you to generate the KML file that can be used later by Google Earth.
Managing Data within Google Earth
Google Earth allows you to view your data in 3D overlaid upon standard geographical information including satellite photos, roads, railways etc.
For example if you export the demonstration file “PMR Coverage.sim” from the “Network coverage” directory, Visualyse will export:
- Two stations, the base station and the mobile station
- One Area Analysis, showing the predicted C/N
These are grouped together in a tree, and each item can be shown or hidden within Google Earth by clicking on the check box, as in the figure below:
Google Earth can then display the required images, such as:
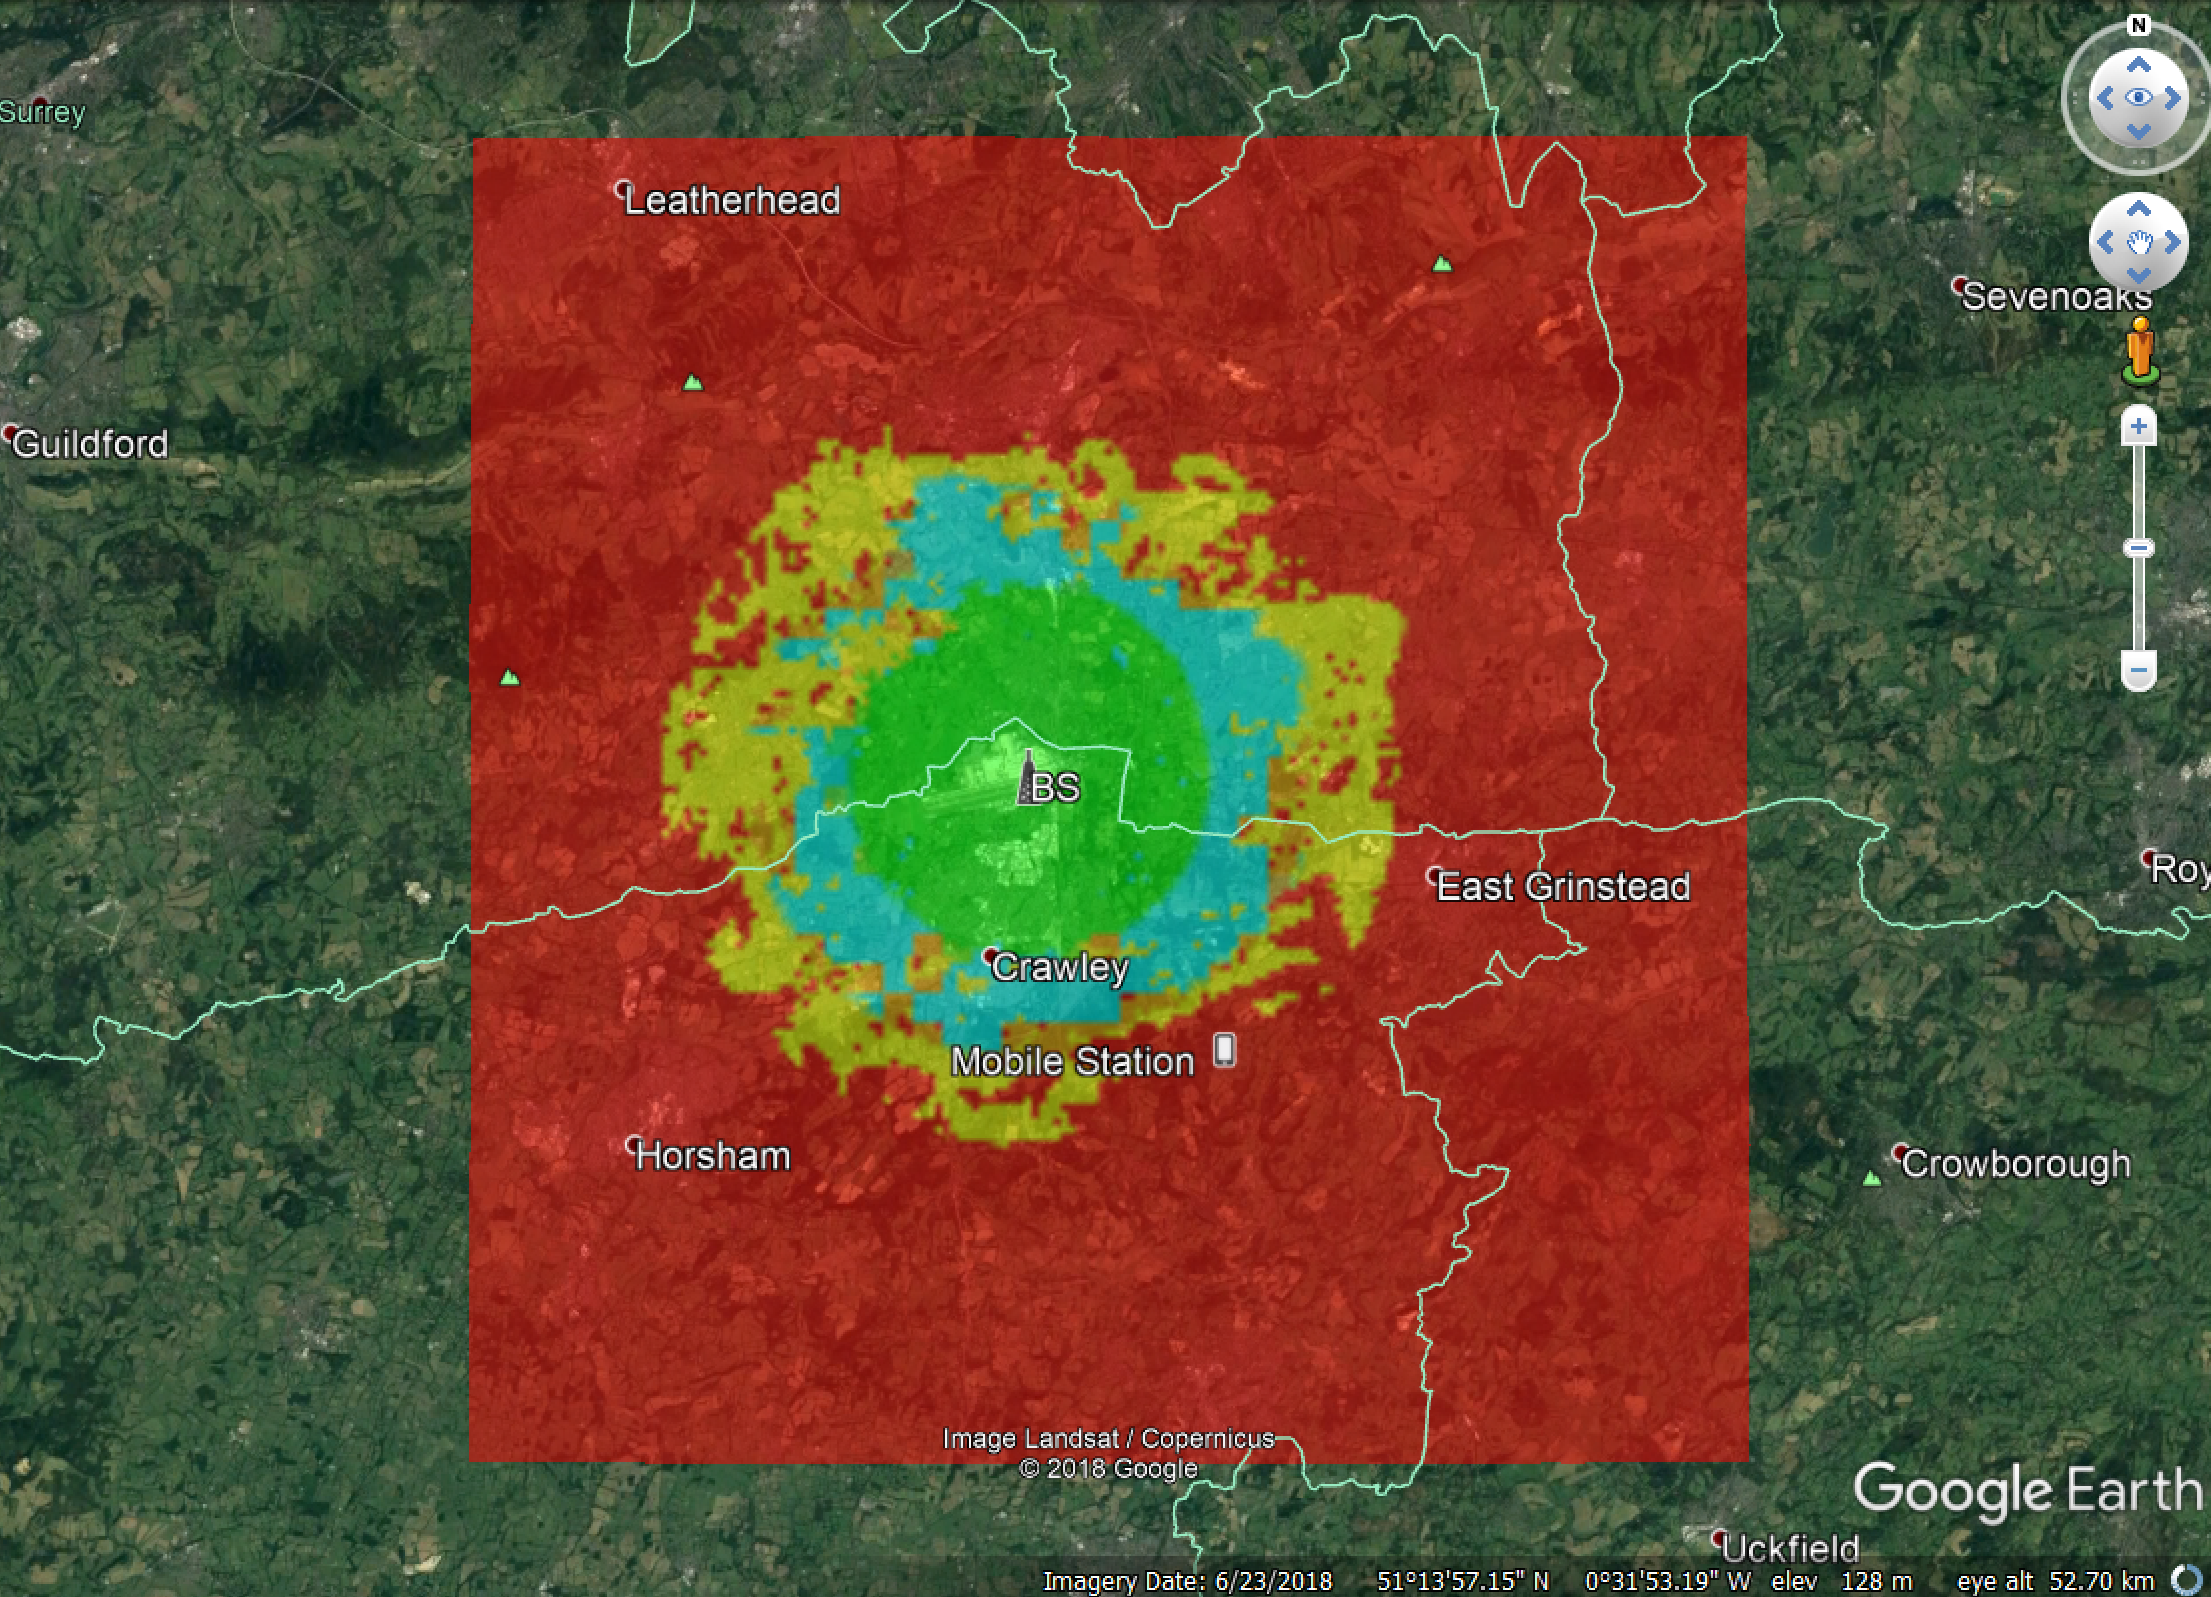
Background on Google Earth
More information about the features and background to Google Earth including downloads can be found at:
A number of versions are available which at time of press included one free to use for non-commercial usage and another requiring minor fee for commercial use.
Note that the functionality and licensing of Google Earth could be modified by Google in the future.
Question: Why are Google Earth files called KMZ?
Answer: The program is based upon tools used to view images generated by the Keyhole satellite program, and a Markup languages was created to add overlays. In addition the files are Zipped to reduce their size.
Acronyms and Abbreviations
| Acronym / Abbreviation | Description |
|---|---|
| AMS | Annual Maintenance and Support |
| API | Advanced Publication Information |
| BER | Bit Error Rate |
| CSV | Comma Separated Values |
| EIRP | Equivalent Isotropic Radiated Power |
| EPFD | Equivalent Power Flux Density |
| ETSI | European Telecommunications Standards Institute |
| FS | Fixed Service |
| GIMS | Graphical Interference Management System |
| GSO | Geostationary Orbit |
| HEO | Highly Eccentric Orbit |
| IDWM | ITU Digitised World Map |
| IFIC | International Frequency Information Circular |
| ITU | International Telecommunications Union |
| KML | Keyhole Markup Language |
| KMZ | Keyhole Markup (Language) - Zipped |
| NFD | Net Filter Discrimination |
| OTR | On Tune Rejection |
| PFD | Power Flux Density |
| RX | Receive |
| SRS | Space Radiocommunications Stations |
| TLE | Two Line Element |
| TX | Transmit |
| UHF | Ultra High Frequency |
| VHF | Very High Frequency |
Introduction
The aim of this section is to give users of Visualyse Professional a better idea of the algorithm it uses and hence a deeper understanding of the results generated and which options should be selected.
It covers key elements of how Visualyse Professional works, including:
- Update sequence
- Coordination systems
- Link budget calculations
- Gain patterns
- Propagation models
- File formats
- VisTools calculations
- Acronyms and Abbreviations
This section should be read in conjunction with the other guides provided, in particular the:
- User Guide: this describes how to use the product including all the dialogs
- Tutorial: this gives a walk-through of the steps required to create an example simulation
- Maintenance History: this gives information on changes released under the Annual Maintenance and Support (AMS) service
- Demonstration Files: this describes the example files shipped with Visualyse Professional version 7 and gives an indication of the types of simulations it can generate
Additional Technical Notes and White Papers can be found on our web site at:
https://www.transfinite.com/papers
Note: In places the description of the algorithm used has been simplified to make it clearer and to protect elements of Transfinite’s Intellectual Property Rights (IPR)
Update Sequence
This section describes the series of steps Visualyse Professional uses to update the simulation at each time step. This well-defined procedure ensures the results generated by Visualyse Professional are always consistent with the input parameters selected.
The process is as follows:
- Update the current time using time step information
- Set the random number seed for this time step
- Update all the define variables
- Update all the positions of the stations
- Update the pointing of each antenna (except if pointing by link)
- Update all links including:
- Calculating the traffic profile for this link for this time step
- Selecting the station, antenna, beam to use for dynamic links
- Updating the pointing of any antenna that uses pointing by link
- Calculating the wanted signal level
- Updating the wanted signal calculation if using power control
- Updating all interference paths
- Updating all link groups
- Update all statistics
- Updating all views and outputting to file any information requested to be logged
Coordination Systems
This section defines the coordinate systems used for each type of station and within antennas and beams.
- ECI Vectors
- Terrestrial Stations
- Satellite Orbits
- Station Coordinate Systems
- Station, Antenna and Beam Coordinate Systems
- Slice Angle
ECI Vectors
All stations in Visualyse Professional are located in Earth Centred Inertial (ECI) coordinate system using position and velocity vectors of the form:
The co-ordinate system is defined as follows:
X axis: aligned with the vernal equinox as described further below
Z axis: aligned with the North Pole
Y axis: at right angles to the X and Z axes, using right handed co-ordinate system
The X axis of the ECI system is oriented in relation to the earth using the first point of Aries at the following epoch:
At: 00:00 hours on the 1st January 1970
This is shown in the figure below:
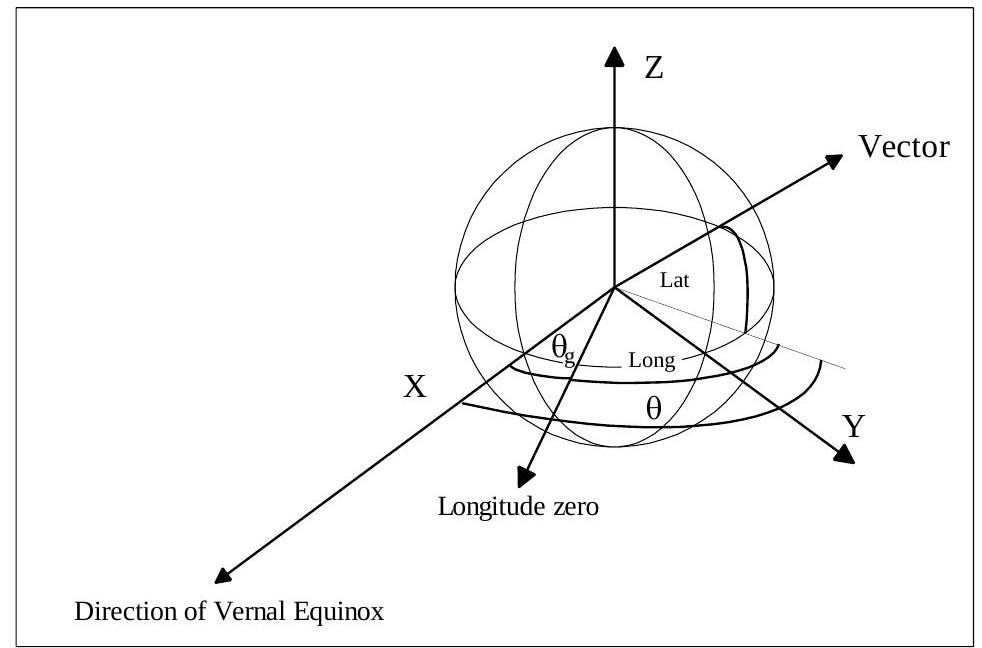
The frame of reference of the earth rotates at the following rate:
Where:
is the angular rotation rate of earth in radians / second
is time in seconds since reference time
Terrestrial Stations
Stations on the surface of the Earth are defined via their (latitude, longitude, height) which is converted into an ECl vector using:
Where:
Radius of the Earth height of station above smooth Earth (h)
Lat Latitude of the station
the conversion of the longitude in the rotating Earth frame to angle with respect to the axis.
Stations with non-zero speed will have their (latitude, longitude, heights) updated assuming they take great circle paths over a spherical Earth.
Satellite Orbits
Orbit Parameters
Within Visualyse Professional a standardised set of orbital elements are used, namely:
| a | semi-major axis |
| e | eccentricity |
| i | inclination |
| Ω | longitude of ascending node |
| w | argument of periapsis |
| ν | true anomaly |
These parameters are shown in the figures below.
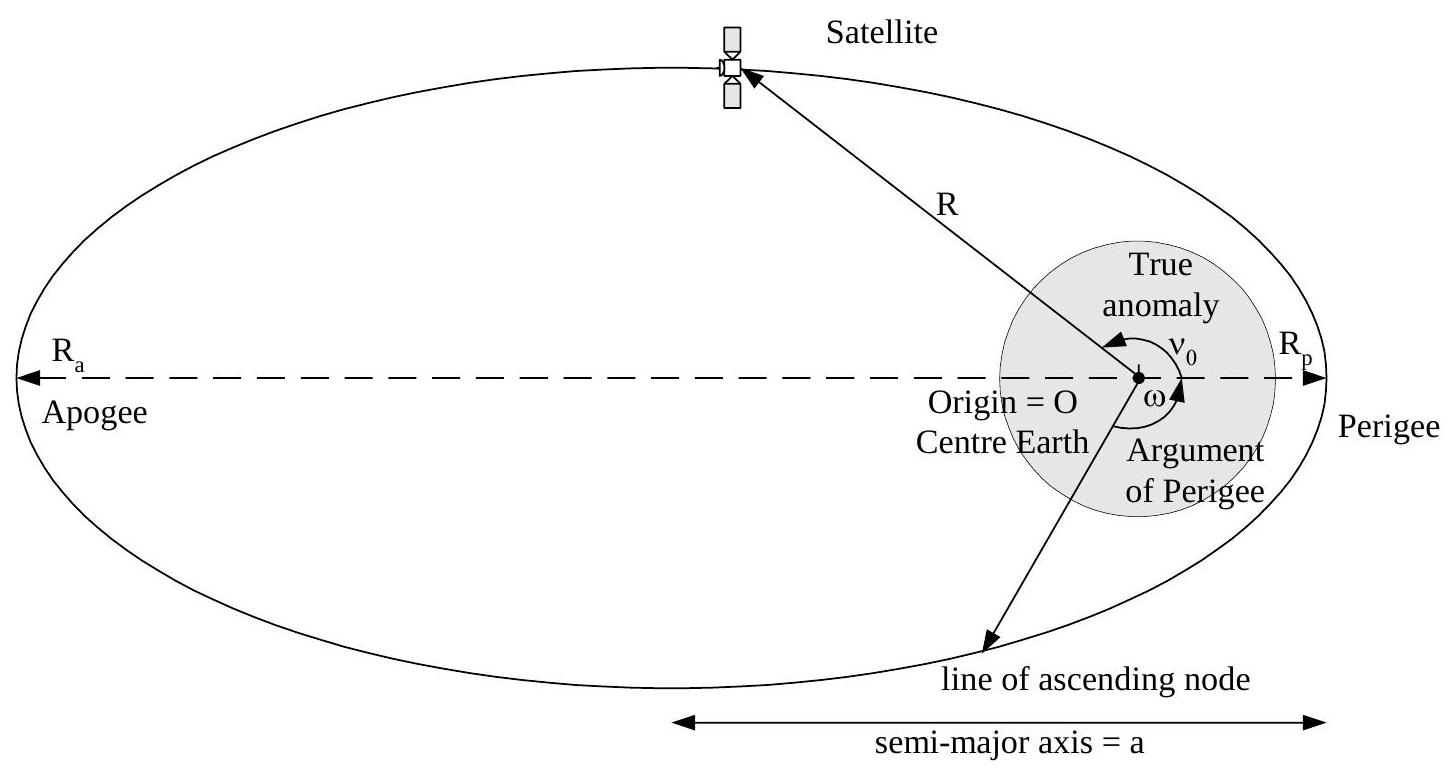
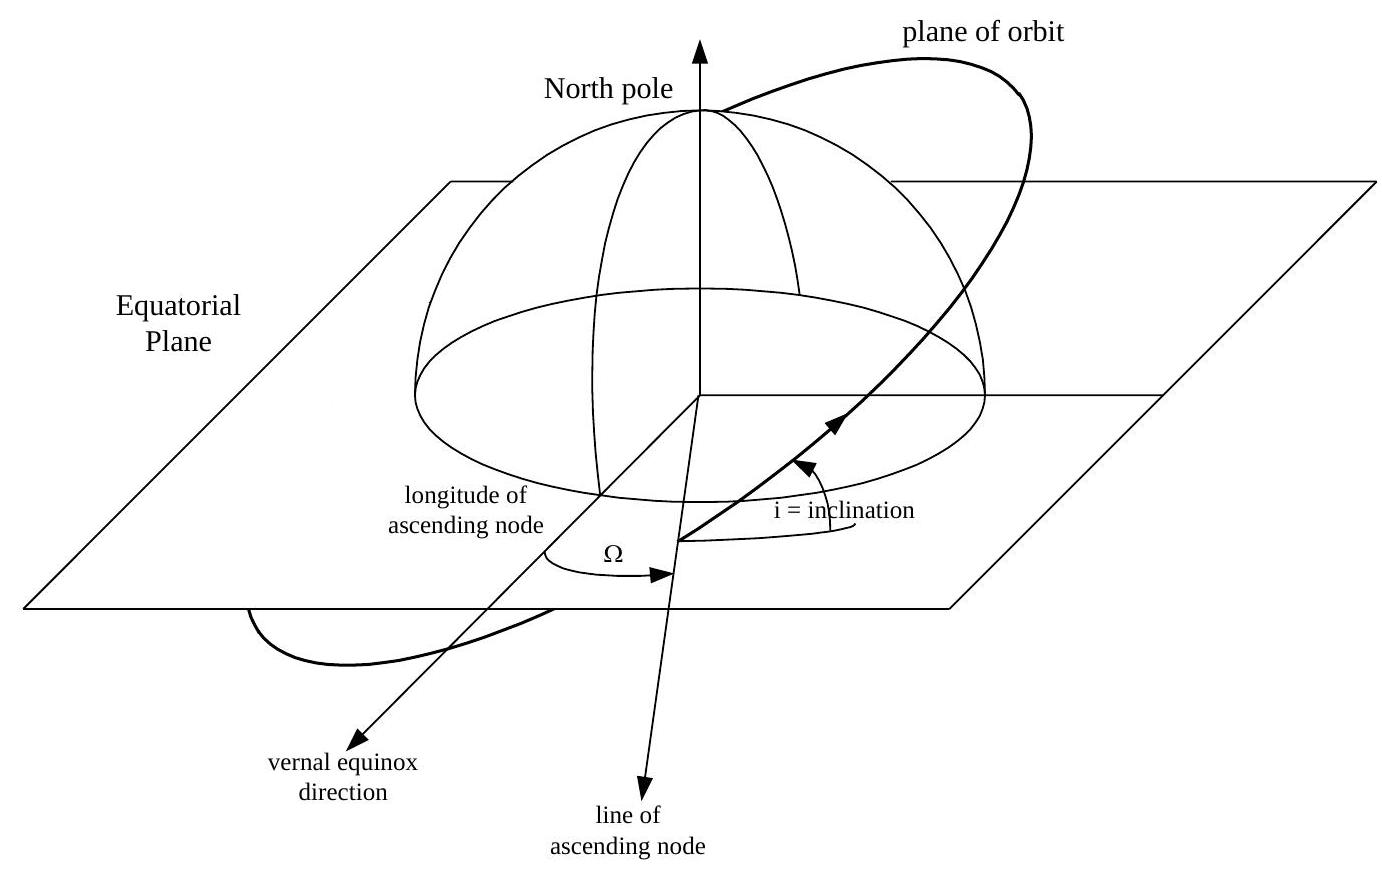
Orbit Models
Two orbit models are including in Visualyse Professional:
- Point mass
- Point mass plus term
The orbit model to update a non-GSO satellite at time is calculated from the orbit elements as follows:
Where:
perigee argument at an initial moment
ascending node longitude at an initial moment
mean anomaly at initial moment
additional, user entered, precession (defaults to zero)
And:
perigee argument precession rate
ascending node longitude precession rate
rate of change of mean anomaly
These are calculated from the following:
where:
Orbit Conversions
Some orbits are defined using other parameters, such as apogee / perigee height or radii. These can be converted into the standard set above using the following equations.
Elliptical orbit shape
The apogee / perigee heights / radius's can be converted using:
Apogee conversion:
Perigee conversion:
is the Earth's radius of .
Then the semi major axis and eccentricity are:
So:
Anomaly Angle
There are a number of ways of defining where the satellite is in the orbit plane with respect to the perigee, including
These are related using:
The last equation can be used together with iteration to calculate from .
Elapsed time is related to using:
where is the mean motion:
where is the gravitational constant
Anomaly Angle
There are a number of ways of defining where the satellite is in the orbit plane with respect to the perigee, including
mean anomaly
These are related using:
The last equation can be used together with iteration to calculate from .
Elapsed time is related to using:
where is the mean motion:
where is the gravitational constant
Station Coordinate Systems
The coordinate system used by the station defines how the antennas are pointed and varies between station types.
- Calculation of Azimuth and Elevation
- Fixed Stations
- Non Geostationary Satellites
- Geostationary Satellites
- Moving Stations
Calculation of Azimuth and Elevation
For each station type an intermediate local set of orthogonal vectors, (X’, Y’, Z’) are generated. From these the azimuth and elevation are calculated as follows:
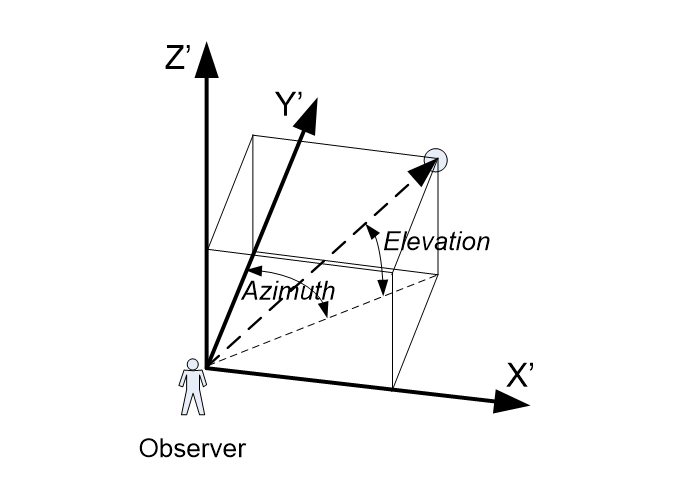
To define the coordinate system for each station type it is therefore necessary to define the ( vectors in each case.
An alternative way of considering it is that for an observer, the azimuth is the angle in the horizontal plane with the line directly ahead, with the right hand being positive, whilst the elevation is the angle in the vertical plane compared to the horizon, with up being positive.
Fixed Stations
For stations at fixed locations, whether Earth, terrestrial, mobile, maritime or aeronautical stations, the azimuth and elevations are derived using the north, east and zenith vectors as shown in the figure below:
Figure Earth / Terrestrial station co-ordinate system
These are mapped onto the generic local vectors as follows:
X’ = E
Y’ = N
Z’ = Z
The result is the traditional alignment of:
- Azimuth = angle in the horizontal plane from due North increasing in a clockwise direction, defined within the range (-180 to +180)
- Elevation = angle above the horizontal plane
Non Geostationary Satellites
For satellites the coordinate system is based upon the line to the centre of the Earth (i.e. towards the sub-satellite point) and the velocity vector, so that for circular orbits:
X’ = Q = vector at right angles to velocity and position vectors
Y’ = P = -R
Z’ = V
The P and Q vectors are shown in the figure below.
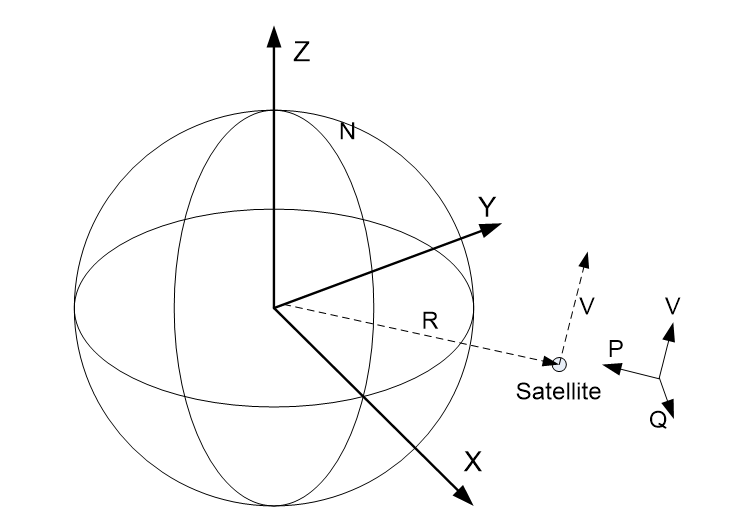
Another way of looking at it is to consider the view from the satellite looking down at the sub-satellite point, head pointing in the direction of the velocity vector – the “superhero” position. In this case as in the figure below:
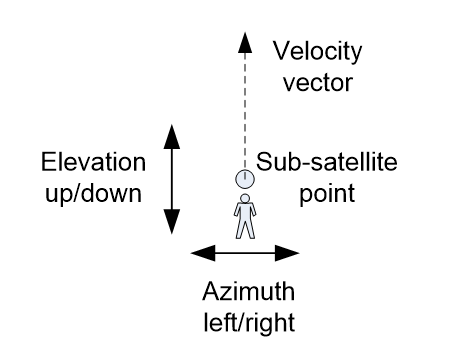
- Azimuth = to left and right of the sub-satellite point, where right is positive
- Elevation = up and down, where up is positive
This coordinate system assumes that the radius vector and velocity vector are at right angles which will only be the case for circular orbits. For elliptical orbits it is necessary to select which vector of (R, V) the coordinate system will align with.
Geostationary Satellites
For satellites the coordinate system is based upon the line to the centre of the Earth (i.e. towards the sub-satellite point), the north vector, and the velocity vector, so that:
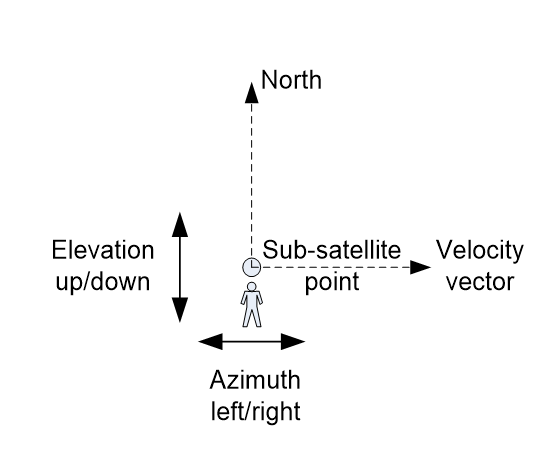
Figure 3: Coordinate System for Geostationary Satellites
In formal terms, for a GSO satellite:
X’ = V
Y’ = -R
Z’ = N
Moving Stations
Moving stations can use either of the coordinate systems describe above:
- North based, as for terrestrial stations
- Velocity based, as for non-GSO satellites.
Additional coordinate frames can be created by utilising the orientation (or Euler) angles (pitch, roll, yaw) which define how the antenna platform is located with respect to the station coordination scheme.
For example consider an aircraft, when the orientation is velocity based, where the following Euler angles have been set:
Pitch = 90º
Roll = 0º
Yaw = 0º
This will rotate the az/el = (0, 0) line from the line from the station to the centre of the Earth to the direction of motion. Having done this the azimuth angle is similar to yaw while elevation angle similar to pitch, as in the figure below using a ship as an example:
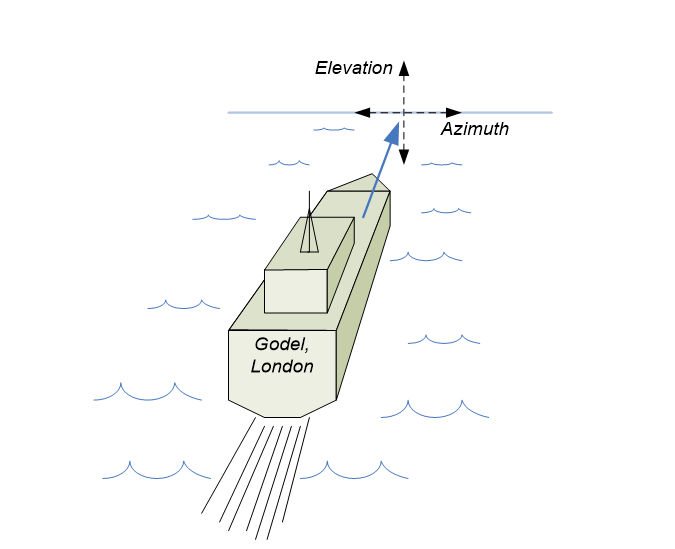
A similar coordinate system can be used for aircraft.
Note that if the aircraft is pitching up or down the velocity vector will not be at right angles to the position vector. Hence the coordinate frame will have to choose which to align with.
To create a coordinate system in which the reference az/el = (0, 0) remains the nose of the aircraft even when pitching up or down the following settings should be used:
Coordinate System:
Velocity based = true
Align with velocity vector = true
Pitch = 90º
Roll = 0º
Yaw = 0º
Station, Antenna and Beam Coordinate Systems
A station can contain multiple antennas which can contain multiple beams. Each can have its own pointing angles – so for example there can be:
- Pointing angles of antenna with respect to station’s coordinate system (these are the azimuth, elevation of the antenna in the station dialog)
- Pointing angles of beam with respect to antenna’s coordinate system (these are the azimuth, elevation of the beam in the antenna dialog)
In addition there can also be:
- Pointing angles of antenna platform with respect to station (these are the orientation angles on the station dialog’s advanced tab)
These angles are combined together in the following order from inertial ECI vectors:
- From ECI to (azimuth, elevation) in station coordinate system using definition of (X’, Y’, Z’) in previous section
- From station coordinate (azimuth, elevation) to antenna platform (azimuth, elevation) using orientation angles (yaw, pitch, roll)
- From antenna platform (azimuth, elevation) to a specific antenna’s (azimuth, elevation) using the antenna’s az/el pointing angles
- From an antenna’s (azimuth, elevation) to a beam’s (azimuth, elevation) using the beam’s az/el pointing angles
Slice Angle
This section describes the definition of the slice angle which is used within Visualyse Professional to display gain patterns.
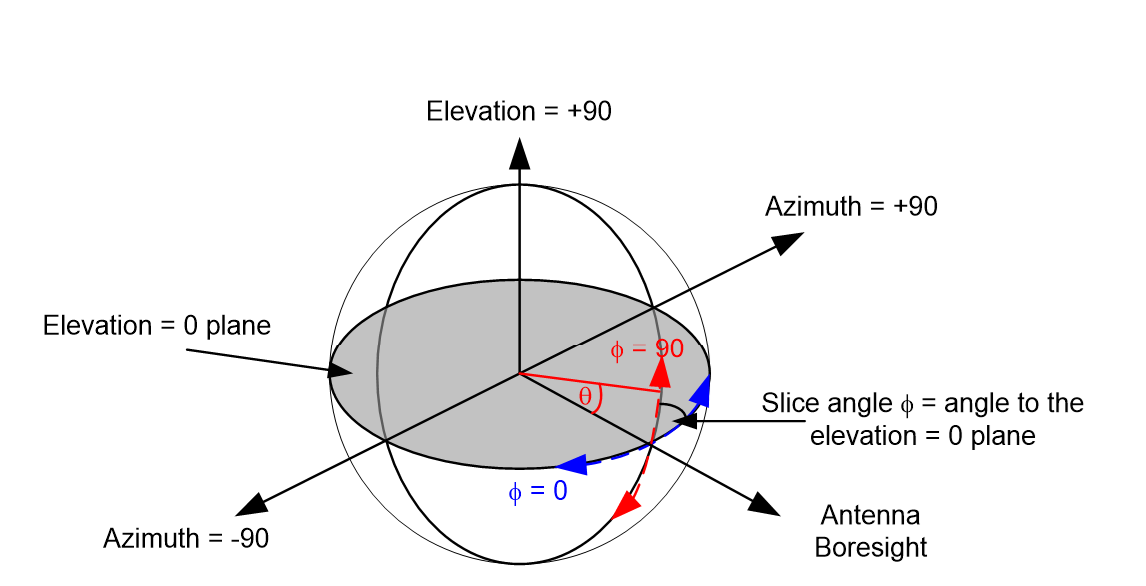
For many antennas, such as those using parabolic reflectors, the gain pattern is symmetric around the boresight. The gain pattern can therefore be displayed in a graph as gain vs offaxis angle – for example the pattern below is Recommendation ITU-R Rec. S.465 for a 2.4m dish at 3.6 GHz:
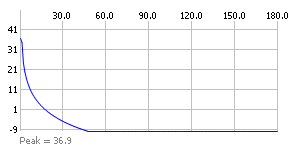
Other antennas do not have this symmetry: for example the patterns of a base station antenna are likely to vary in both azimuth and elevation, and hence are described as 3D patterns.
For these antennas the gain pattern taken in the azimuth and elevation directions are likely to be different, and we call these different directions “slices”. The slices are taken in planes that intersect the boresight line (see figure at top).
The orientation of the slice is defined by the slice angle or , which is the angle of the slice plane to the elevation = 0 plane. Hence the = 0 slice is the gain pattern in the azimuth plane while the = 90 slice is the gain pattern in the elevation plane.
Rather than showing offaxis angle along the X axis of the gain plot, the slice instead shows the angle from the boresight line, shown in the figure above as .
Any slice angle can be selected from 0 to 180 and it will define a plane and hence create a separate gain pattern. As all slices intersect the boresight line all will start with the = 0 point which is the boresight, usually, but not always, defined as the point in the 3D gain pattern with highest gain value.
For example the figures below show two slices from the same 3D gain pattern and hence start with = 0 where the gain = 18 dBi.
 Slice angle = 0 (azimuth plane) Slice angle = 0 (azimuth plane) |  Slice angle = 90 (elevation plane) Slice angle = 90 (elevation plane) |
|---|
Note that azimuth and elevation in this figure are relative to the gain pattern’s boresight and there could be a variety of orientation angles including:
- Beam within the Antenna Type
- Antenna with respect to the Antenna Platform
- Antenna Platform with respect to the Station
Note also there are a variety of Station orientations as described in the previous sections.
Link Budget Calculations
- Power Calculation Reference Points
- Noise Calculation
- Other Parameters
- PFD and Field Strength
- Interference Adjustments
- Link Group Calculations
- Modelling Radar Reflections
- Listen before transmit
Power Calculation Reference Points
In order to be able to model a wide range of radio systems a generic link model is used in all calculations in Visualyse Professional. The basic link budget is as follows:
Where:
transmit power at input to antenna (dBW)
GPeak transmit antenna peak gain
GRel transmit antenna gain towards the receiver relative to peak (dB)
propagation loss between transmit and receive antennas (dB)
GPeak receive antenna peak gain
GRel receive antenna gain towards the transmitter relative to peak
losses between receive antenna and input to the receiver
The reference points are therefore:
Transmitter: at the input to the antenna
Receiver: at the input to the receiver
Hence there is no field in Visualyse Professional for the transmit line loss.
The reference points for the link budgets are therefore as shown in the figure below:
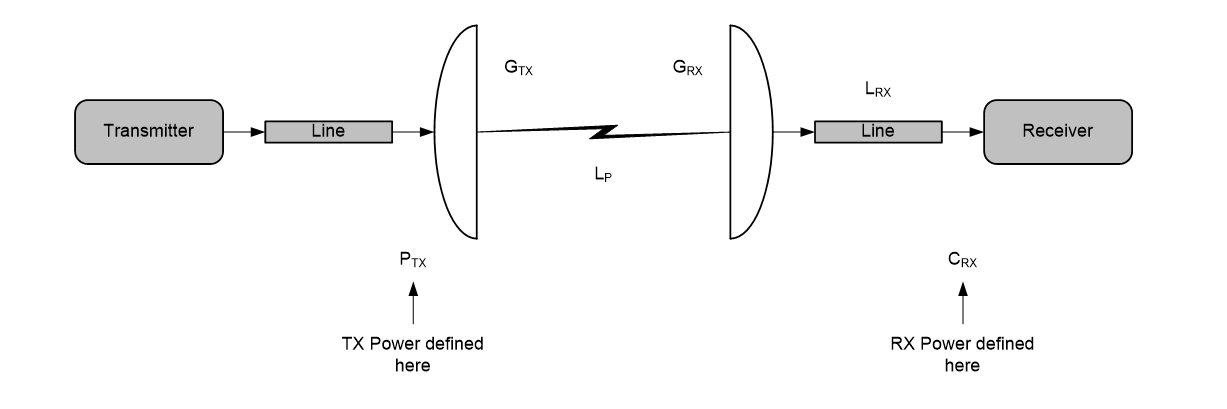
Note that:
The receive measurement point can be made to be at the output of the receive antenna by setting the LRX to zero.
Noise Calculation
In Visualyse Professional there are two ways to define the noise at the receiver:
- Enter the noise temperature of the receiver directly
- Allow Visualyse Professional to calculate the receiver noise temperature from the various components.
The calculation of receiver input noise is based upon the following parameters:
The system temperature is calculated from:
Where:
noise figure of receiver
noise temperature of antenna
feeder loss
feeder temperature
where is 290 Kelvin
Converted to noise spectral density this is:
Other Parameters
There is a wide variety of methods to define link budgets and these can use different parameters that might need to be mapped onto Visualyse Professional fields.
- Transmitter losses: losses such as transmit link losses can be modelled by reducing the transmit power accordingly.
- G/T: Some antennas have their performance defined via their G/T. In this case it is necessary to determine separate G and T figures to be entered into the link budget above.
- Pointing losses: At the transmit side these can be modelled either by reducing the transmit power according to the required level of pointing loss or by adding a slight offset to the antenna pointing angles. At the receive side the pointing loss could be modelled as either being part of the receiver losses or adding a slight offset to the antenna pointing angles.
- Polarisation losses: These can be included by either adding them to the receive feed loss or adjusting the required C/N or C/(N+I) threshold upwards.
- Baseband losses: losses such as implementation losses, demodulation margin etc can be modelled by adjustment of the threshold required.
PFD and Field Strength
In Visualyse Professional the PFD calculation assumes free space path loss, hence it is simply:
It is sometimes useful to derive the PFD assuming the other propagation models within Visualyse Professional’s library. In this case it is possible to calculate the signal (wanted or interfering) as received at an isotropic receiver and convert into either PFD or field strength.
The conversion factors in the case of interference is:
Note that and that
To convert the pfd into field strength use:
Interference Adjustments
- Carrier Overlap
- Frequency Overlap
- Interference Calculation Adjustment
- Frequency Dependent Adjustment
- Polarisation Adjustment
- Mask Integration to derive NFD
Carrier Overlap
It should be noted that all unless masks are given, carrier spectre are assumed to be square with the following parameters defined:
- Central frequency
- Occupied bandwidth
- Allocated bandwidth
Typically the wanted and interfering signals have different central frequencies and / or bandwidths. It is therefore necessary to consider how to adjust the interference calculation to take account of bandwidth factors. The figure below shows a typical situation:

The overlap algorithm is:
Then using the start and end frequencies above:
So:
This is used in the two bandwidth calculations: whether to include the carrier as being partially co-frequency and how much energy from the interfering carrier to include.
Frequency Overlap
An interfering carrier is included in the interference calculation if at least one of the following is true:
- the overlap between carriers (as calculated above) is greater than zero
- the force co-frequency flag is set
Interference Calculation Adjustment
If there is overlap between two carriers, then it is necessary to determine how much energy to include. Three alternatives are available, and the result is the BWF factor which is used to multiply the interfering carrier level to get the resulting interfering level I.
No Adjustment
In this case the BWF is always 1.
Spectral Power Density
In this case the ratio of the two is used, based on the power spectral density:
Overlap
In this case the extent of overlap is used, calculated using:
Note that for the force co-frequency case the frequency of both carriers is set to the same and , and so this becomes the same as Spectral Power Density.
Multiple Carriers
In this case it is assumed that there could be multiple interfering carriers in the bandwidth of the wanted signal. Each interfering carrier is separated by its ABW, but occupies only the OBW. This is shown in the figure below:
Figure Multiple Interferers Into Wanted Carrier
The calculation is therefore:
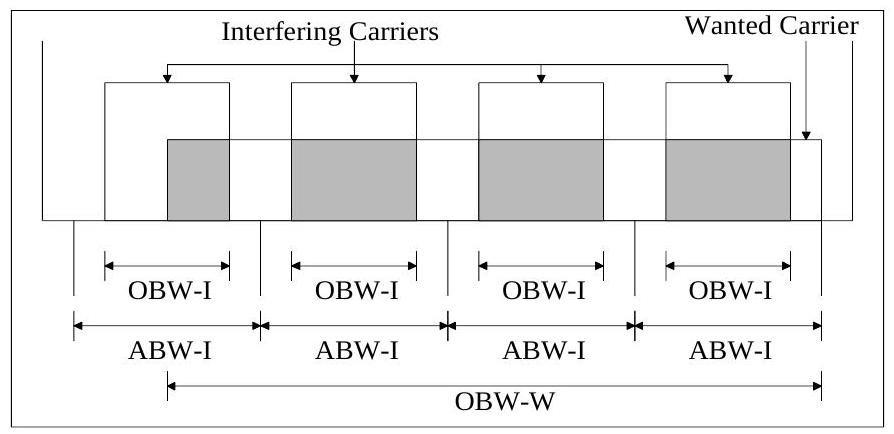
Frequency Dependent Adjustment
The bandwidth adjustment in the tables above is based upon rectangular blocks of frequency. Some carriers are shaped, such as TV, and so the interference to/from one of these carriers will depend on the separation between central frequencies.
This can be included in the link calculation using a table of advantage vs offset of central frequencies. Linear interpolation is used between entries in the table, with no extrapolation at the ends of the table.
Polarisation Adjustment
Polarisation adjustment can be done one of three ways:
- no adjustment
- standard ITU adjustment table
- user defined table
The tables give constant adjustments based on wanted and interfering carrier polarisations. The user defined table allows checking for main beam to main beam alignment. This occurs when the transmit and receive relative gains are -3 dB or higher.
Note that it is possible in Visualyse Professional to do full cross-polar gain pattern calculations by entering the cross-polar values for one system (typically interfering) and using the co-polar gain pattern for the other system (typically wanted). This can be done using the table patterns.
Mask Integration to derive NFD
In Visualyse Professional it is possible to specify the following two masks:
- The transmit mask is defined as the relative power density compared to in-band: in other words as a table it would be defined in dB while in the integration the units would be an absolute ratio.
- The receive mask is defined as the relative attenuation of the receive signal compared to in-band: in other words as a table it would be defined in dB while in the integration the units would be an absolute ratio.
Both the transmit and receive masks are defined using tables with linear interpolation in dB between each point and hence can be modelled as a set of straight lines with equation (in dBs):
In which case the NFD is:
Where:
And:
Note that in general the values of and are not user entered but are derived from a set of values at specific points, as in the figure below.
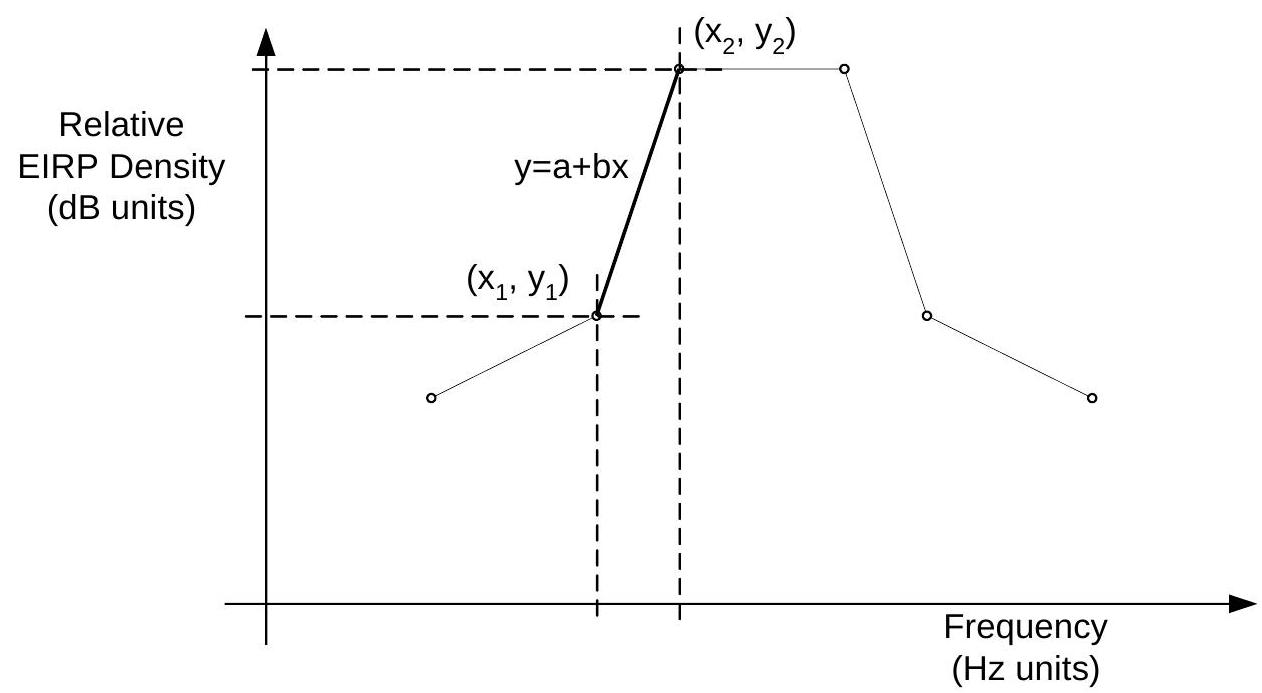
Three formats of this integration are available:
Integrate masks (Classic): Transmit and receive masks integrated and then divided by the transmit bandwidth. This is the correct approach if the TX spectrum mask is referenced to the mean in-band density i.e. 0 dB is when the power density = TX power / occupied bandwidth.
Integrate masks (NFD): Transmit and receive masks integrated and then divided by the integration of the transmit mask. This is the correct approach if the TX spectrum mask 0 dBi point is referenced to the peak power density.
Integrate masks (ETSI): Transmit and receive masks are integrated for the specified frequency offset and then divided by the integral of the TX and RX masks when co-frequency. This is the correct approach to be consistent with the methodology in ETSI TR 101 854 and is sometimes called the Frequency Dependent Rejection or FDR. To adjust for different bandwidth carriers the carrier overlap calculation is included in the adjustment as per Interference Calculation Adjustment.
Note on the 1 NFD: this is calculated as two terms, called NFD and MD where:
i.e. NFD (OverlapAreaCoFrequency / OverlapAreaActualFrequency)
Therefore the (TXArea / OverlapAreaCoFrequency)
Hence MD + NFD = 10log10(TXArea / OverlapAreaActualFrequency)
Therefore the total HCM bandwidth and mask integration factor is the same as the "Standard NFD" calculation described above.
Link Group Calculations
Thermal Additional
Thermal addition is used to calculate end to end performance for analogue systems. In this case the link qualities are added using the following formula:
where X could be I, N or (N+I).
Wanted Signal Phase Addition
Some diversity systems use two links and merge the two received signals such that the wanted carriers remain in phase. This changes the phase of the interfering signal, and the following algorithm is used to add the link qualities (note in W not dBW):
where is a random number between 0 and .
Modelling Radar Reflections
One of the most important uses of the electromagnetic spectrum is for radar.
When modelling radar in simulation tools the most important difference from most other types of radio system is that the signal is received after two paths via a passive reflection, as can be seen in the figures below:

The signal strength that is received can be calculated using the standard radar equation (assuming free space path loss):
Where:
Radar reflections can be modelled via the Link’s End to Start power option. To enable this option:
- Create the radar station with antenna pointing at the aircraft
- Create the aircraft with the required height and for antenna use an isotropic gain pattern with gain 0 dBi
- Create a fixed or dynamic link with:
- Start station = radar station
- End station = aircraft
- Start to End direction: set the transmit power of the antenna
- End to Start direction: set the transmit power option to be “radar reflection” and then set the radar cross section to be that of the aircraft and the noise temperature to be that of the radar station, as in the example below:
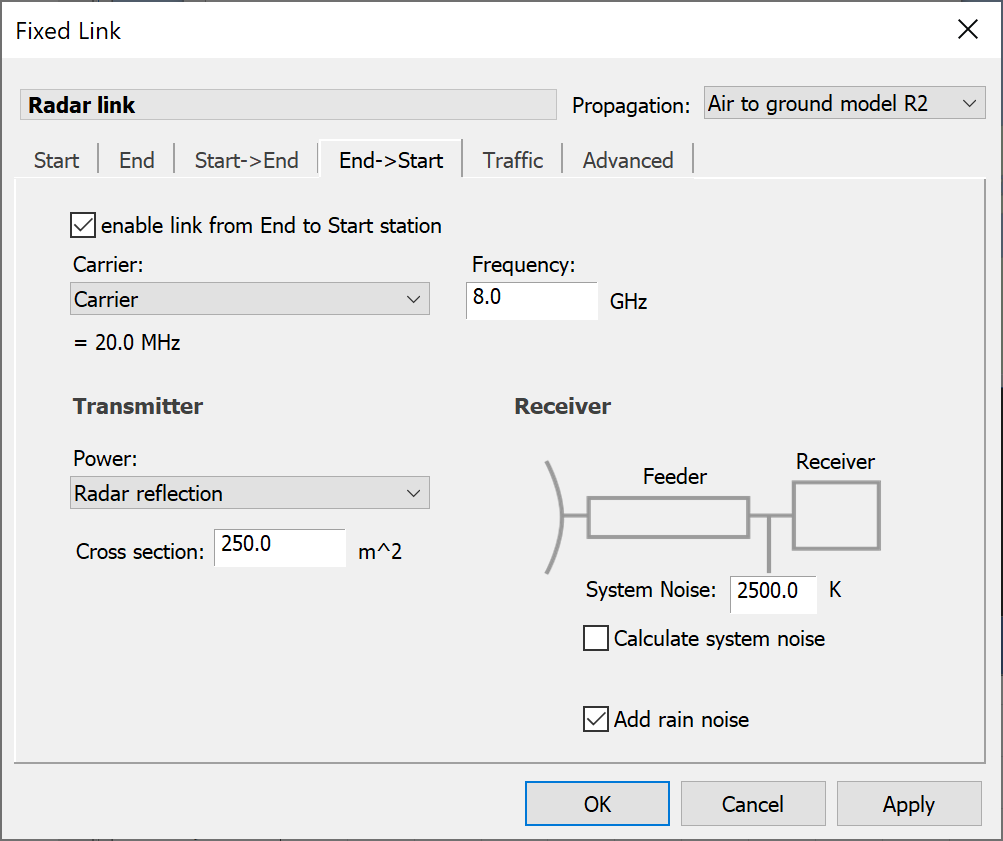
Having created this link the End to Start’s received power will be the radar station’s wanted signal.
Note that any propagation model could be used, not just free space path loss as in the equations above. In particular it could be appropriate to consider:
- Recommendation ITU-R P.452: this includes the effect of terrain and is considered acceptable for low altitudes
- Recommendation ITU-R P.528: this is designed for air to ground / ground to air links up to a maximum height of 20,000m. It does not include the effect of terrain
Both these propagation models can also include a percentage of time field.
Note that the following are checked by Visualyse Professional:
- The Endstart carrier must be the same as the StartEnd carrier
- The Endstart frequency must be the same as the StartEnd frequency
- The end station must use an isotropic antenna with gain = 0 dBi
- The Startend direction must be enabled
Listen before transmit
Recent developments of cognitive technologies, such as listen before transmit, are allowing a range of new sharing scenarios.
An example of this can be found in the 5 GHz band where Radio Local Area Networks (RLANs) can operate as long as they do not cause harmful interference into radars in the frequency ranges 5 250 - 5 350 and 5 470 - 5 725 MHz. The mechanism used to protect the radars is dynamic frequency selection based upon listen before transmit technologies.
As described in Recommendation ITU-R M. 1652, RLANs with the potential to transmit up to 200 mW e.i.r.p. must be capable of detecting radar signals of -62 dBm. If a signal is detected on a channel then it can not be used and instead the RLAN must try another channel.
This is shown graphically in the figure below:
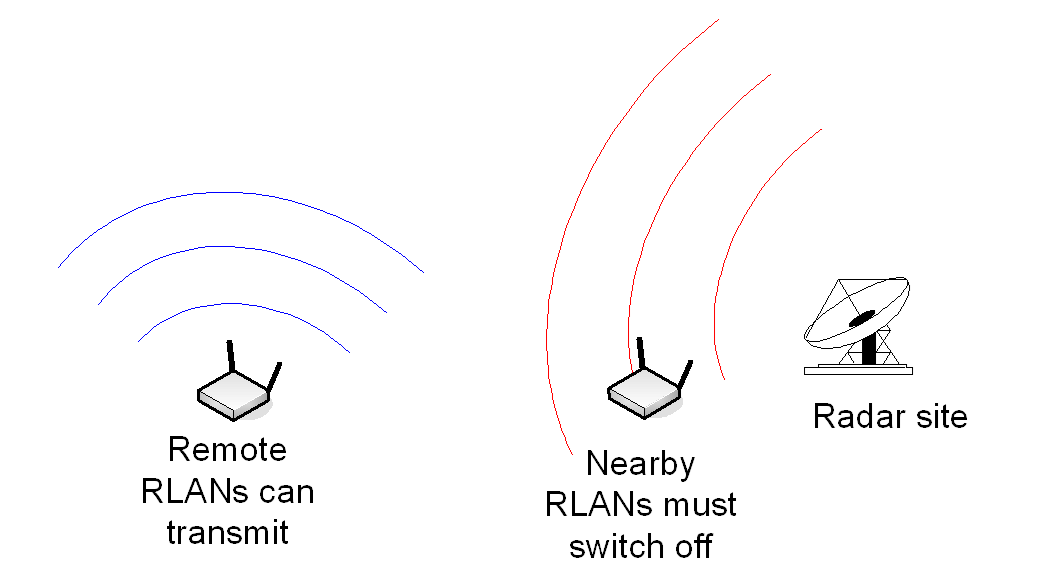
In regulatory terms there could be a constraint similar to:
System A can only transmit at power = X if the signal received from System B is less than Y
The question is then, what are the relevant values of X and Y? This requires interference analysis taking into account deployment densities and propagation conditions.
This can now be modelled in Visualyse Professional using a bi-directional link (i.e. either fixed or dynamic link) as follows:
- Start->End: model System B’s signal as detected by System A (for example, Radar to RLAN)
- End->Start: model System A transmitting in the signal received on the StartEnd path is below the detection threshold (i.e. the RLAN transmitting)
The End->Start direction can then be used as one of the interferers into System B to determine what the impact would be.
The link options are in the End->Start direction as shown in the figure below:
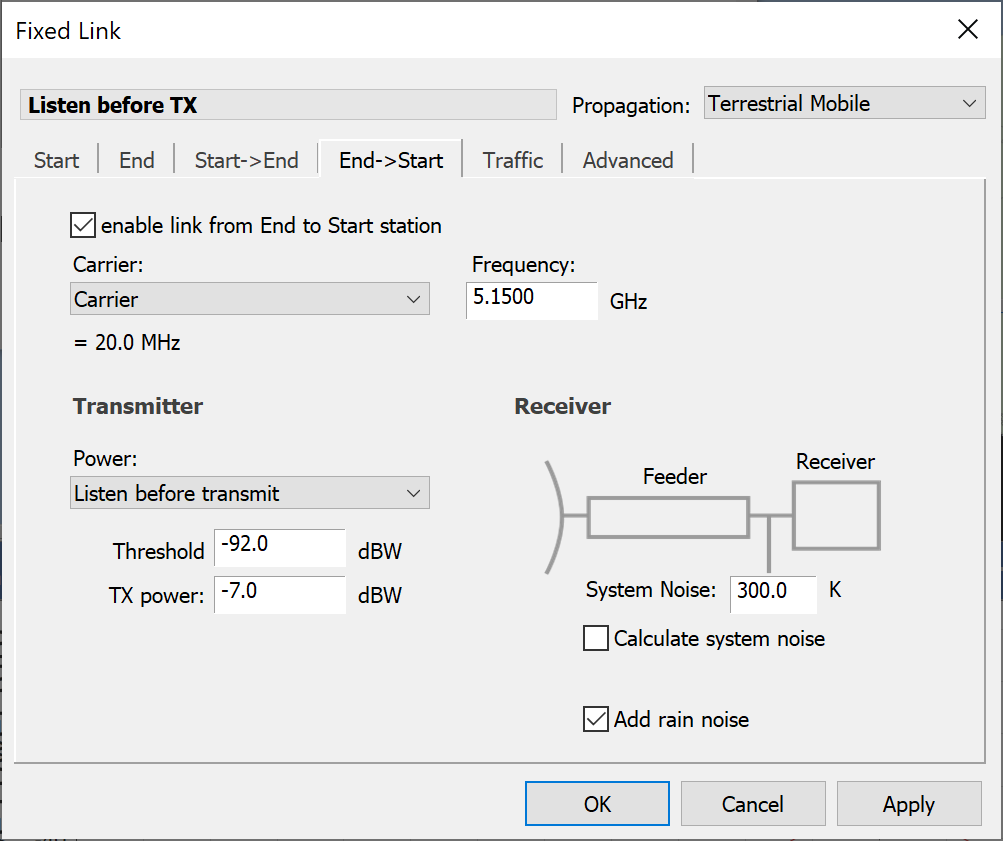
-
HCM Agreement: coordination of Frequencies between 29.7 MHz and 39.5 GHz for the fixed service and the land mobile service ↩
Gain patterns
ITU and ETSI Gain Patterns
The gain patterns in Visualyse Professional come from a number of sources including:
| Source | Pattern(s) | Notes |
|---|---|---|
| ITU-R Radio Regulations Appendix 7: | App 7 Earth Station App 7 Fixed Service | Useful for coordination analysis between satellite earth stations and terrestrial fixed service stations |
| ITU-R Radio Regulations Appendix 30: Provisions for all services and associated Plans and List for the broadcasting-satellite service in the frequency bands 11.7-12.2 GHz (in Region 3), 11.7-12.5 GHz (in Region 1) and 12.2-12.7 GHz (in Region 2) | App 30 Earth Rx Reg 1 & 3 Comm App 30 Earth Rx Reg 1 & 3 Ind App 30 Earth Rx Reg 1 & 3 WRC-97 App 30 Earth Rx Reg 2 App 30 Satellite Tx Reg 1 & 3 App 30 Satellite Tx Reg 1 & 3 FR App 30 Satellite Tx Reg 2 App 30 Satellite Tx Reg 2 FR App 30 Space App 30 Space Fast roll-off | Useful for studies of GSO satellite networks in the BSS plans FR = Fast Rolloff Comm = Commercial Ind = Industry Reg = Region |
| ITU-R Radio Regulations Appendix 30A: Provisions and associated Plans and List for feeder links for the broadcasting-satellite service (11.7-12.5 GHz in Region 1, 12.2-12.7 GHz in Region 2 and 11.7-12.2 GHz in Region 3) in the frequency bands 14.5-14.8 GHz2 and 17.3-18.1 GHz in Regions 1 and 3, and 17.3-17.8 GHz in Region 2 | App 30A Satellite Rx Reg 1 & 3 App 30A Satellite Rx Reg 1 & 3 FR App 30A Satellite Rx Reg 2 App 30A Satellite Rx Reg 2 FR | Useful for studies of feeder links for BSS GSO satellite networks FR = Fast Rolloff Reg = Region |
| ITU-R Radio Regulations Appendix 30B: Provisions and associated Plan for the fixed-satellite service in the frequency bands 4 500-4 800 MHz, 6 725-7 025 MHz, 10.70-10.95 GHz, 11.20-11.45 GHz and 12.75-13.25 GHz | App 30B Earth Station A App 30B Earth Station B App 30B Space Station App 30B Space Station FR | Useful for studies of GSO satellite networks in the FSS plans FR = Fast Rolloff |
| ETSI ETS 300 157: Satellite Earth Stations and Systems (SES);Receive-only Very Small Aperture Terminals (VSATs) operating in the 11/12 GHz frequency bands | ETS 300-157 Rx | VSAT style satellite earth stations operating in RX mode |
| ETSI ETS 300 158 Satellite Earth Stations and Systems (SES);Television Receive Only (TVRO-FSS) Satellite Earth Stations operating in the 11/12 GHz FSS bands | ETS 300-158 Rx | TVRO style satellite earth stations |
| ETSI ETS 300 159 Satellite Earth Stations and Systems (SES);Transmit-only or transmit-and-receive Very Small Aperture Terminals (VSATs) used for communications operating in the Fixed Satellite Service (FSS) 11/12/14 GHz frequency bands | ETS 300-159 Rx ETS 300-159 Tx Spec 1 ETS 300-159 Tx Spec 2 | VSAT style satellite earth stations operating in TX or TX/RX modes |
| ETSI ETS 300 327 Satellite Earth Stations and Systems (SES);Satellite News Gathering (SNG) Transportable Earth Stations (TES) (13-14/11-12 GHz) | ETS 300-327 Rx ETS 300-327 Tx | SNG/TES TX or RX satellite earth stations |
| ETSI ETS 300 332 Satellite Earth Stations and Systems (SES);Transmit-only or transmit-and-receive Very Small Aperture Terminals (VSATs) used for communications operating in the Fixed Satellite Service (FSS) 6 GHz and 4 GHz frequency bands | ETS 300-332 Rx ETS 300-332 Tx | VSATs style satellite earth stations operating in C band |
| ETSI ETS 300 333 Satellite Earth Stations and Systems (SES);Receive-only Very Small Aperture Terminals (VSATs) operating in the 4 GHz frequency band | ETS 300-333 Rx | RX only VSATs operating in C band |
| Recommendation ITU-R BO.1443: Reference BSS earth station antenna patterns for use in interference assessment involving non-GSO satellites in frequency bands covered by RR Appendix 30 | ITU-R BO.1443-1 ITU-R BO.1443-3 | Analysis of EPFD from non-GSO networks into BSS GSO satellite earth stations |
| Recommendation ITU-R F.1245: Mathematical model of average radiation patterns for line-of-sight point-to-point radio-relay system antennas for use in certain coordination studies and interference assessment in the frequency range from 1 to about 70 GHz | ITU-R F.1245 ITU-R F.1245-1 ITU-R F.1245-1 Annex 1 ITU-R F.1245-2 ITU-R F.1245-2 Annex 1 ITU-R F.1245-3 ITU-R F.1245-3 Annex 1 | For point to point FS links when aggregating interference from large numbers of transmitters |
| Recommendation ITU-R F.1336: Reference radiation patterns of omnidirectional, sectoral and other antennas in point-to-multipoint systems for use in sharing studies in the frequency range from 1 to about 70 GHz | ITU-R F.1336 (2.1.1) ITU-R F.1336 (2.1.2) ITU-R F.1336 (2.2) ITU-R F.1336 (4, NOTE 4) ITU-R F.1336-1 (k=0) ITU-R F.1336-1 (k=0.1) ITU-R F.1336-1 (k=0.2) ITU-R F.1336-1 (k=0.7) ITU-R F.1336-2 (2.1) [k=0] ITU-R F.1336-2 (2.1) [k=0.1] ITU-R F.1336-2 (2.1) [k=0.2] ITU-R F.1336-2 (2.1) [k=0.7] ITU-R F.1336-2 (2.2) [k=0] ITU-R F.1336-2 (2.2) [k=0.1] ITU-R F.1336-2 (2.2) [k=0.2] ITU-R F.1336-2 (2.2) [k=0.7] ITU-R F.1336-5 Rec 2.1 ITU-R F.1336-5 Rec 2.2 ITU-R F.1336-5 Rec 3.1.1 ITU-R F.1336-5 Rec 3.1.2 ITU-R F.1336-5 Rec 3.2 ITU-R F.1336-5 Rec 4 ITU-R F.1336-5 Annex 4 | For point to multi-point fixed or mobile base stations. Sections 2.1.1 and 2.1.2 model azimuth symmetric patterns using patterns that are symmetric around the boresight, so should be orientated by setting antenna elevation = 90 degrees. Patterns with defined k value are for sectors with fixed beamwidth of 120° and are not elevation dependent |
| Recommendation ITU-R F.699: Reference radiation patterns for fixed wireless system antennas for use in coordination studies and interference assessment in the frequency range from 100 MHz to about 70 GHz | ITU-R F.699-2 ITU-R F.699-2R ITU-R F.699-3 ITU-R F.699-3R ITU-R F.699-5 ITU-R F.699-6 ITU-R F.699-7 ITU-R F.699-8 | For point to point FS links. The “R” versions had reduced side-lobe. Has been used for other scenarios – e.g. to model symmetric radar antennas |
| Recommendation ITU-R S.580: Radiation diagrams for use as design objectives for antennas of earth stations operating with geostationary satellites | ITU-R Rec. S.580-6 ITU-R S.580-6 (APL) | For satellite earth stations – slightly better than pattern in Rec. S.465 as assumes 29-25log(phi) rolloff |
| Recommendation ITU-R S.465: Reference earth-station radiation pattern for use in coordination and interference assessment in the frequency range from 2 to about 30 GHz | ITU-R S.465-5 ITU-R S.465-5 prior to 1993 ITU-R S.465-5 (APL) ITU-R S.465-6 Rx ITU-R S.465-6 Tx | For satellite earth stations – slightly worse than pattern in Rec. S.580 as assumes 32-25log(phi) rolloff |
| Recommendation ITU-R S.672: Satellite antenna radiation pattern for use as a design objective in the fixed satellite service employing geostationary satellites | ITU-R S.672-3 Annex 1 Ls = -10 ITU-R S.672-3 Annex 1 Ls = -20 ITU-R S.672-3 Annex 1 Ls = -25 ITU-R S.672-3 Annex 1 Ls = -30 ITU-R S.672-3 Ln = -20 ITU-R S.672-3 Ln = -25 ITU-R S.672-3 Ln = -30 ITU-R S.672-4 Annex 1 Ls = -10 ITU-R S.672-4 Annex 1 Ls = -20 ITU-R S.672-4 Annex 1 Ls = -25 ITU-R S.672-4 Annex 1 Ls = -30 ITU-R S.672-4 Ln = -20 ITU-R S.672-4 Ln = -25 | Generally useful for satellites with symmetric gain patterns A range of side-lobes are given: note the Ls = -10 relates to patterns defined in Article 22.2 of the Radio Regulations |
| Recommendation ITU-R S. 1328: Satellite system characteristics to be considered in frequency sharing analyses within the fixed-satellite service | ITU-R S.1328 USAKUL1 | Defines the gain pattern for SkyBridge. Should be used with electronically steered beams with footprint size of 450 km |
| Recommendation ITU-R S.1428: Reference FSS earth-station radiation patterns for use in interference assessment involving non-GSO satellites in frequency bands between 10.7 GHz and 30 GHz | ITU-R S.1428 ITU-R S.1428-1 | Analysis of EPFD from non-GSO networks into FSS GSO satellite earth stations |
| Recommendation ITU-R S.1428: Reference FSS earth-station radiation patterns for use in interference assessment involving non-GSO satellites in frequency bands between 10.7 GHz and 30 GHz | ITU-R S.1428-1 Rec | This gain pattern is the same as the existing Rec. ITU-R S.1428-1 but uses the Recommendation equations to calculate the peak gain rather than from the efficiency. |
| Recommendation ITU-R S. 1528: Satellite antenna radiation patterns for non-geostationary orbit satellite antennas operating in the fixed-satellite service below 30 GHz | ITU-R S. 1528: LN = -15 ITU-R S. 1528: LN = -20 ITU-R S. 1528: LN = -25 ITU-R S. 1528: LN = -30 | Similar to Rec. ITU-R S.672 but for non-GSO satellites. Includes elliptical beam terms |
| Recommendation ITU-R RS.1813: Reference antenna pattern for passive sensors operating in the Earth exploration-satellite service (passive) to be used in compatibility analyses in the frequency range 1.4-100 GHz | ITU-R RS.1813 (Recommends 1) ITU-R RS.1813 (Recommends 2) | Analysis of interference into Earth exploration-satellite’s passive sensors |
| ITU-R Radio Regulations Resolution 221: Use of high altitude platform stations providing IMT in the bands 1 885-1 980 MHz, 2 010-2 025 MHz and 2 110-2 170 MHz in Regions 1 and 3 and 1 885-1 980 MHz and 2 110-2 160 MHz in Region 2 | Resolution 221: LN = -25 Resolution 221: LN = -26 Resolution 221: LN = -28 Resolution 221: LN = -30 Resolution 221: LN = -32 | Analysis sharing between high altitude platform stations (HAPS) and other radio systems |
| Recommendation ITU-R F.1891: “Technical and operational characteristics of gateway links in the fixed service using high altitude platform stations in the band 5 850-7 075 MHz to be used in sharing studies” | ITU-R F.1891: LN = -25 | Analysis sharing between high altitude platform stations (HAPS) and other radio systems |
| Recommendation ITU-R M.2101: “Modelling and simulation of IMT networks and systems for use in sharing and compatibility studies” using parameters from document 5D/TEMP/265R3 Options for the non-co-frequency gain pattern are discussed in Annex 1 to Document 5-1/287-E | IMT-MODEL BS Indoor IMT-MODEL BS Suburban IMT-MODEL BS Urban Outdoor IMT-MODEL UE Indoor IMT-MODEL UE Suburban IMT-MODEL UE Urban Outdoor | Sharing scenarios involving IMT-2020 / 5G systems See notes below on use of this gain pattern |
| Annex 15 to Document 5A/650-E: PDNR ITU-R M.[MS-RXCHAR-28] Receiver characteristics and protection criteria for systems (excluding IMT) in the mobile service in the frequency range 27.5-29.5 GHz for use in sharing and compatibility studies with earth stations in motion operating in geostationary FSS networks and with applications under the fixed service Options for the non-co-frequency gain pattern are discussed in Annex 1 to Document 5-1/287-E | IMT-MODEL 28 GHz BS IMT-MODEL 28 GHz UE A IMT-MODEL 28 GHz UE B | Sharing scenarios involving IMT-2020 / 5G systems See notes below on use of this gain pattern |
| Recommendation ITU-R M.1851 "Mathematical models for radiodetermination radar systems antenna patterns for use in interference analyses” | ITU-R M.1851 (COS Average) ITU-R M.1851 (COS Peak) ITU-R M.1851 (COS) ITU-R M.1851 (COS2 Average) ITU-R M.1851 (COS2 Peak) ITU-R M.1851 (COS2) ITU-R M.1851 (COS3 Average) ITU-R M.1851 (COS3 Peak) ITU-R M.1851 (COS3) ITU-R M.1851 (SIN Average) ITU-R M.1851 (SIN Peak) ITU-R M.1851 (SIN) | For sharing scenarios involving radar systems with pencil beams. See Tables 2, 3 and 5 in Annex 1 of Rec. M.1851 for definition of these patterns |
| Recommendation ITU-R RA.1631: “Reference radio astronomy antenna pattern to be used for compatibility analyses between non-GSO systems and radio astronomy service stations based on the epfd concept” | ITU-R RA.1631 | This Recommendation gives a reference antenna pattern which represents the side-lobe gain levels that are not expected to be exceeded at most off-axis angles in the majority of antennas used in the service |
| ITU-R SA.509: “Space research earth station and radio astronomy reference antenna radiation pattern for use in interference calculations, including coordination procedures, for frequencies less than 30 GHz” | ITU-R SA.509 Rec 1.1 ITU-R SA.509 Rec 1.2 | This Recommendation gives reference antenna radiation patterns for space research and radio astronomy services for calculating interference from a single source or from multiple sources for frequencies less than 30 GHz |
| Table 1: References for ITU-R and ETSI Visualyse Interplanetary Gain Patterns |
These documents can be accessed from:
Registration and/or payment might be required for some documents.
Some patterns are not defined for the full range of offaxis angles. For example ITU-R Rec.S.465 does not define the pattern for offaxis angles less than 1°: in this case it is assumed to be parabolic until reaching the first side-lobe, i.e.
Variations for Recommendation S.465 and S.580 gain patterns extend the pattern using the methodology in the ITU’s Antenna Pattern Library (APL).
Note on the IMT-MODEL Gain Patterns
In order to activate the beamforming of these gain patterns, the antenna type, station and link options should be:
- Antenna type: ensure “Electronically steerable” is checked
- Station antenna pointing:
- For the BS: set fixed pointing angles
- For the UEs: point at another station (the BS) using random offsets of azimuth = {-60, +60}, elevation = {-90, +90}
- Link: either a Fixed or Dynamic link from the BS to the UE (or vice versa) to activate the antenna pointing. Note that a transmit or receive link cannot be used
The BS antenna azimuth could also be defined via the Monte Carlo service area Define Variable.
The parameters used to configure this gain pattern take account of the frequency, typically defined in the link.
Note on the IMT-MODEL Non-Co-Frequency Gain Pattern
For antenna types defined by the IMT-MODEL patterns, there are options to select how the gain pattern changes for non-co-frequency interference paths.
The following options are available from the Advanced Beam Options dialog:
- Use co-frequency pattern: the M.2101 pattern is used with D/lambda = 0.5 for both co-frequency and non-co-frequency scenarios
- Single element pattern: the M.2101 single element pattern is used if the victim centre frequency is non-co-frequency
- Assume D/lambda = 0.46: in the M.2101 gain pattern a D/lambda of 0.46 is used rather than 0.5
- Variable D/lambda: it is assumed that at the centre frequency supplied the D/lambda = 0.5, and so for other frequencies the D is derived and fixed but the lambda varies depending upon the victim frequency
The definition of what constitutes “co-frequency” and what “non-co-frequency” for the IMT-MODEL gain pattern is set via:
- Centre Frequency: this is the centre frequency that the IMT-MODEL antenna has been tuned to
- Co-Frequency Bandwidth: this is the total bandwidth that is defined as being co-frequency in range:
- Minimum = CentreFrequency – CoFrequencyBandwidth./2
- Maximum = CentreFrequency + CoFrequencyBandwidth./2
Outside this frequency range the interference path is assumed to be non-co-frequency.
To activate these non-co-frequency gain patterns it is necessary to set the Interference Path option:
- Calculate Interfering Signal using Victim Frequency = true
This will use the victim centre frequency when calculating the interfering signal and hence allow the antenna type to identify if the path is co-frequency (to the IMT-MODEL antenna) or non-co-frequency. It will not affect other calculations, in particular the mask integration adjustment or NFD.
Additional Gain Patterns
Other useful gain patterns are:
- Bessel
- Capped Bessel
- Bessel Standard
- GPS L1
- GPS L2
- GPS User
- Linear with angle
- Omni directional
- Parabolic rolloff
- Sine(x)/x
These are specified in the sections below.
Bessel
This is the theoretical model for antenna performance, and is given below.
If:
Then:
Capped Bessel
The capped Bessel follows the Bessel for the main beam, and then for the side-lobes it connects the peaks.
Bessel Standard
The Bessel function gain pattern was calculated using:
Where:
For angles greater than , the gain at is used. The existing Bessel function gain pattern is similar but has a wider main-beam.
GPS L1
The following pattern is used:
Then:
Note this assumes that the peak gain is set to .
GPS L2
The following pattern is used:
Then:
Note this assumes that the peak gain is set to .
GPS User
The following pattern is used from ITU-R document 8D/142 from October 1998:
Then:
Note this assumes that the peak gain is set to .
Linear
This algorithm is used so that the offaxis angle can be determined from the offaxis gain. The equation is:
Omni Directional
This gives the same value in all directions and is hence essentially isotropic. The peak gain is set by default to 0 dB, but can be any user entered value.
Parabolic
This pattern is parabolic with floor defined. The equation is:
The is input by the user. A typical value is .
Sin(x)/x
The calculation is the same as the Bessel Function, but replacing the call to Bessel by sin.
Archived Gain Patterns
The following gain patterns are included in Visualyse Professional Version 7 for reasons of backward compatibility:
- Appendix 29 Earth Station
- Analytic ES
- Analytic NGSO
- Cosine
- FSATMULTI_1A Earth Station
- FSATMULTI_1A Type A
- NGSO FSS RX
- NGSO FSS TX
- SMATV
- Sine
- SkyBridge RX Type A
- SkyBridge TX Type A
- TVRO
- Teledesic 2 - RX
- Teledesic 2 - RX fixed BW
- Teledesic 2 - TX
- Teledesic 2 - TX fixed BW
- Teledesic Type A
- Teledesic Type B
- Teledesic Type C
More information is available on request.
Propagation models
Visualyse Professional contains a number of propagation models that can be activated either individually or in combination. These are described in the sections below.
- ITU-R Recommendations
- Other Standard Models
- Terrestrial Mobile
- Fixed loss Models
- Extra Clutter Models
- Other Models
- Use with Define Variable Module
ITU-R Recommendations
- Recommendation ITU-R P.452
- Recommendation ITU-R P.525
- Recommendation ITU-R P.526
- Recommendation ITU-R P.528
- Recommendation ITU-R P.530
- Recommendation ITU-R P.530 Multipath
- Recommendation ITU-R P.530 Rain Fade
- Recommendation ITU-R P.618
- Recommendation ITU-R P.676
- Recommendation ITU-R P.840
- Recommendation ITU-R SF.1395
- Recommendation ITU-R P.1546
- Recommendation ITU-R P.1791
- Recommendation ITU-R P.1812
- Recommendation ITU-R P.2001
Recommendation ITU-R P.452
Prediction procedure for the evaluation of microwave interference between stations on the surface of the Earth at frequencies above about 0.7 GHz
This option uses the model in Recommendation ITU-R P.452 for line of sight and trans-horizon loss valid for frequencies between 100 MHz and 50 GHz, though recent research suggests it might also be applicable at higher frequencies. Visualyse Professional includes all the key components of the model, including free space path loss, multi-path enhancements, gaseous absorption, diffraction, ducting and layer reflection/refraction, troposcatter and clutter loss.
Data needed for the model can be derived directly from the IDWM database if you are using the IDWM module, otherwise they must be input by hand. If a terrain database is available it will be used to derive parameters relating to the path including diffraction. The clutter model can use the land usage database or parameters entered by hand.
The associated percentage of time can either be user-entered or selected at random for Monte Carlo style analysis. The range in the Recommendation is 0.001 % to 50%, reflecting the fact that this model is designed for interference paths and so does not include effects for over 50% of time such as deep fades.
Recommendation ITU-R P.525
Calculation of free-space attenuation
This is the basic free space path loss that can be used for all paths at all frequencies. Note that by default for all paths including terrestrial no consideration is made as to whether there is line of sight, and losses increase steadily by distance.
Recommendation ITU-R P.526
Propagation by diffraction
Recommendation ITU-R P.526 defines models to be used in calculating diffraction losses for trans-horizon links for frequencies above about 30 MHz. Visualyse Professional implements both the smooth Earth model and the modified three-knife edge Deygout construction when terrain data is available.
Recommendation ITU-R P.528
Propagation curves for aeronautical mobile and radionavigation services using the VHF, UHF and SHF bands
This Recommendation is designed to predict propagation loss for air to ground / ground to air links. It gives curves of loss vs. distance for frequencies 125, 300, 1200, 5100, 9400 and 15 500 MHz and at TX/RX heights of 15m, 1 km, 10 km, and 20 km for probabilities of 5%, 50% and 95% of time. Interpolation is used to derive the loss for other frequencies, heights and percentages of time.
Recommendation ITU-R P.530
Propagation data and prediction methods required for the design of terrestrial line-of-sight systems
Visualyse Professional contains two of the propagation models in Recommendation ITU-R P.530 - rain and multipath fading, as describing below.
Parameters in various equations within the Recommendation have been derived from fading data from links operating in the range 450 MHz – 37 GHz, though they should be valid up to frequencies of 50 GHz.
Recommendation ITU-R P.530 Multipath
This option uses the fade distribution defined in Method 1 of Recommendation ITU-R P.530 to generate a fade or multipath enhancement either for a specific percentage of time or at random using a Monte-Carlo technique.
This method is applicable to lineofsight fixed links and is intended for initial planning and link design. The geoclimatic factor K parameter is derived from the Recommendation.
Recommendation ITU-R P.530 Rain Fade
This option uses the model defined in Recommendation ITU-R P.530 to generate a rain fade loss. It is intended to be used for line-of-sight fixed links.
The rain rate can either be entered directly or read automatically from Recommendation ITU-R P.837. The associated percentage of time can be either entered directly or generated at random for Monte Carlo analysis.
Recommendation ITU-R P.618
Propagation data and prediction methods required for the design of Earthspace telecommunication systems
This Recommendation models rain attenuation on earth to space / space to earth links and the rain rate can come from ITU-R Recommendation P.837 versions or directly entered by the user. It is valid for frequencies up to 55 GHz.
The associated percentage of time can be either entered directly or generated at random for Monte Carlo analysis.
Recommendation ITU-R P.676
Attenuation by atmospheric gases
This method implements losses due to dry air and water vapour defined in Annex 2 of Recommendation ITU-R P.676, and is intended to be used for earth to space / space to earth links. It is valid for frequencies from 1 GHz to 350 GHz.
The values of the temperature, water vapour density and pressure can be entered directly.
Recommendation ITU-R P.840
Attenuation due to clouds and fog
This method implements losses due to attenuation from cloud and fogs as described in Recommendation ITU-R P.840, and is intended for earth to space / space to earth links above about 10 GHz.
The values of the water concentration in the cloud and associated percentage of time can be entered directly.
Recommendation ITU-R SF.1395
Minimum propagation attenuation due to atmospheric gases for use in frequency sharing studies between the fixed-satellite service and the fixed service
This model calculates the attenuation due to atmospheric gases in more detail for low elevation paths than the direct method in Recommendation ITU-R P. 676. It fits a set of curves to a numerical integration at key frequencies.
Recommendation ITU-R P.1546
Method for point-to-area predictions for terrestrial services in the frequency range 30 MHz to 3 000 MHz
This propagation model is designed for use in modelling terrestrial services; in particular point-to-area predictions in the frequency range 30 MHz to 3 GHz.
Propagation parameters required by this model such as distance over water and whether warm water can be automatically extracted from IDWM or entered by hand.
The clutter model can use the land usage database or parameters entered by hand.
Note that this model calculates loss assuming high height transmitter and low height receiver and it is assumed that the loss in the return direction is then the same. The loss is calculated to a receiver height of 10m and then adjustments must be made for the actual receiver height.
Recommendation ITU-R P.1791
Propagation prediction methods for assessment of the impact of ultra-wideband devices
This model is a generic propagation model for short range scenarios built up work within the ITU-R studying ultra-wideband (UWB) devices. In the Recommendation it is basically a dual slope model with log-normal distribution: however we have included a number of extensions that were discussed during its development to make it a more generic short range propagation model.
In its more flexible generic form it comprises four elements:
- Basic loss: this can either be a single slope or dual slope, with a specified break distance and either one or two slopes. For wide band signals such as UWB it should use the adjusted basic path loss that takes account of the frequency range
- Optional indoor-outdoor propagation loss: it is assumed that the loss varies depending upon the building type and distance to exterior wall, with distribution defined by two break points and assuming loss is capped below and above and with linear interpolation between break points
- Optional additional log-normal loss with mean zero and standard deviation a user entered parameter, which can be different before and after the break point
- Optional additional loss, to cover other propagation effects
The log-normal loss can include enhancements, which could in theory result in less loss than would be the case with free space path loss. The loss can therefore be capped at this value to ensure physically plausible results.
Recommendation ITU-R P.1812
A path-specific propagation prediction method for point-to-area terrestrial services in the VHF and UHF bands
This propagation model is designed for use in modelling terrestrial services; in particular point-to-area predictions in the frequency range 30 MHz to 3 GHz.
Conceptually it is a mixture of Recommendations ITU-R P.452 and ITU-R P.1546 using:
- The path profile extraction and analysis method in ITU-R P.452 to work out propagation loss taking into account details of the terrain
- The clutter loss and percentage of locations within a pixel methodology within ITU-R P.1546.
The propagation model in ITU-R P.452 can calculate propagation loss for percentages of time down to 0.001% for frequency over about 700 MHz. However it is not feasible at present to predict propagation losses for very small percentages of time for the lower frequencies ranges covered by ITU-R P.1812: hence it is restricted to percentages between 1 and 50%.
Visualyse Professional includes all the key components of the model, including gaseous absorption, fading, ducting, troposcatter and clutter. Data needed for the troposcatter model can be derived directly from the IDWM database if you are using the IDWM module, otherwise they must be input by hand. If a terrain database is available it will be used to derive parameters relating to the path including diffraction. If a land use database is available it will be used to adjust the path profile with the heights indicated for each clutter category.
Propagation parameters required by this model such as distance over water and whether warm water can be automatically extracted from IDWM or entered by hand.
Recommendation ITU-R P.2001
A general purpose wide-range terrestrial propagation model in the frequency range 30 MHz to 50 GHz
This propagation model is designed for terrestrial sharing scenarios, in particular for use in Monte Carlo style methodologies.
Many of the other propagation models handle fading and enhancements separately. For example in sharing scenarios involving the fixed service there are two models:
- Wanted path: as well as free space path loss, Rec. P.530 is used to model fades on the link below the 50% of time level
- Interference path: Rec. P.452 is used to model interference including enhancements above the 50% of time level
When undertaking Monte Carlo modelling it is important to model the full range of probabilities for wanted and interfering paths so that the convolution of C/(N+I) is correctly calculated. This is was Rec. P.2001 is designed to do.
This Recommendation has similarities with both P.452 and P.1812 in its handling of terrain paths but extends both to cover the full range of percentage of times [0.00001% to 99.99999%].
At present no clutter model is included in this Recommendation but if need be the Extra models terminal clutter loss can be added to the list of propagation models with P.2001.
Other Standard Models
Crane Rain Model
This implements the Crane rain model with options to include the NASA data set. It is intended to be used for earth to space / space to earth paths.
Either the climatic region or rain rate and rain height can be entered.
The associated percentage of time can be either entered directly or generated at random for Monte Carlo analysis.
Note: The implementation is based on Section 4.3 of Electromagnetic Wave Propagation Through Rain by Robert K. Crane (© 1996 John Wiley & Sons, Inc. ISBN 0-471-61376).
The following modifications were made when implementing the model:
- The section of Crane that deals with horizontal paths over is only used when a climate region is specified.
- In equation 4.8, the is replaced with
- This is similar to the method used in the NASA Propagation Effects Handbook for Satellite Systems Design (1989, fourth edition, section 6.3.2.1, page 6-23).
- Equation 4.10 is used instead of the approximations which follow it.
- Equation 4.13 is used instead of 4.12
- Alpha and in section 4.3.1 are calculated using Rec. ITU-R P.838
Appendix S.7 (WRC-95)
Visualyse Professional includes the propagation model defined in Appendix S.7 as agreed at WRC 95 (previously known as Appendix 28). This can be either Mode 1, Mode 2 or a combined model. It is valid between 1 and 40 GHz.
If the IDWM model is available then it will extract the zone(s) required for Mode 1 calculations automatically, otherwise a single zone can be directly selected. The associated percentage of time can be either entered directly or generated at random for Monte Carlo analysis.
If the IDWM model is available then it will extract the rain rate, rain cell size, and vapour density required for Mode 2 calculations automatically, otherwise these fields can be entered directly.
TIA Bulletin 10F
The US Telecommunications Industry Association has produced a technical bulletin relating to interference calculations for fixed service systems. One element is a model for short term deep fading. Visualyse Professional allows this model to be used across all percentages of time by linearly extrapolating from deep to shallow fading.
Longley-Rice
The Longley-Rice Irregular Terrain Model
This propagation model is the point to point version of the National Telecommunications and Information Administration (NTIA) Institute for Telecommunication Sciences’s Irregular Terrain Model (ITM) version 1.2.2.
As well as using the path profile extracted from the terrain database there are also options to select the surface refractivity, dielectric ground constant, ground conductivity and radio climate from standard options.
The median propagation loss can be adjusted in two dimensions:
- Time: you can enter the percentage of time that the propagation loss will not be exceeded i.e.
- Confidence: Confidence that the propagation loss will not exceed the level for the specified of time
Terrestrial Mobile
Visualyse Professional contains several standard propagation models to calculate median loss for terrestrial mobile applications.
- Egli
- Hata / COST-231
- Lee
- IMT Path Loss Models
- Recommendation ITU-R P.2109: Building Entry Loss
- Recommendation ITU-R P.2108
Egli
The Egli model is an empirical model applicable to a mobile environment. It is a model with corrections for antenna heights and frequency.
The calculations for this model have been derived from algorithms in: “The Mobile Radio Propagation Channel”, J. D. Parsons, Pentech Press 1992. This simplified Egli model is valid for use at frequencies between 90 MHz and 1 GHz and has no input parameters.
Hata / COST-231
The Hata model is an empirical model applicable to a mobile environment, which gives the median loss and is widely used and was extended by COST-231. The original Hata model was valid for frequencies from 150 MHz – 1,500 MHz and the COST-231 version was extended to 2 GHz.
The implementation of COST-231 is consistent with the approach in defined in ECC Report 68.
It should be noted that the Hata version of this model is asymmetric – the loss is assumed to be calculated in the direction from the (higher) base station to the (lower height) mobile station. To allow calculation in the reverse direction, the COST-231 implementation assumes the station with the highest antenna is the base station independent of other parameters of the network.
In both cases the environment can be selected as one of urban, suburban or rural.
Lee
The Lee model is an empirical model applicable to a mobile environment, and allows the median transmission loss, the slope of path loss curve, and frequency adjustment factors to be entered.
The calculations for this model have been derived from algorithms in: “The Mobile Radio Propagation Channel”, J. D. Parsons, Pentech Press 1992.
IMT Path Loss Models
These models are designed for short range paths for the wanted or interfering signals of IMT-2020 / 5G systems. The models included are:
- ABG
- CI/CIF
- 3GPP TR 38.900
- 3GPP TR 38.901
- WINNER II
- WINNER+
- ITU-R Report M.2135
The alpha, beta, gamma (ABG) and close-in / close-in with frequency-dependent path loss exponent (CI/CIF) path loss models were defined in document ITU-R WP 5D/TEMP/292. Each requires a set of parameters which will depend upon the environment models, such as the examples in the document referenced.
The 3GPP wanted signal path loss models are defined in these documents:
- 3GPP Technical Report (TR) 38.900: Study on channel model for frequency spectrum above 6 GHz
- 3GPP TR 38.901: Study on channel model for frequencies from 0.5 to 100 GHz
These define path loss models for specific environments, taking into account whether the path is line of sight (LOS) or non-LOS. For some environments the path could also be from indoor to outdoor.
The 3GPP TR 38.900 and 38.901 path loss models are not symmetric, in that they have as inputs the BS and UE heights. To ensure that Visualyse Professional identifies the stations correctly, it should be configured so that:
- The BS is a Terrestrial Fixed Station
- The UE is a Mobile Station
Note that 3GPP TR 38.900 and 38.901 have, for some environments, assumptions about the BS height. For example in the UMa environment it is assumed that the height of the BS is 25m while for UMi – Street Canyons this is 10m. This value would be used within these path loss models irrespective of the height set in the station dialog. The equations to determine the probability of LOS makes similar assumptions about antenna heights.
In addition, some parameters have ranges of acceptable values which are enforced. For example, the RMa environment requires the average street width and building height to be entered which are constrained to be between 5m and 50m.
The WINNER propagation models are described in the following documents:
- WINNER II Channel Models (Project IST-4-027756, versions D1.1.2 V1.2)
- WINNER+ Final Channel Models (Project CELTIC / CP5-026, version 1.0)
Recommendation ITU-R P.2109: Building Entry Loss
Recommendation ITU-R P.2109 (previously described as P.BEL) defines the entry / exit loss for a path between a station inside and another station outside a building, as in the figure below:
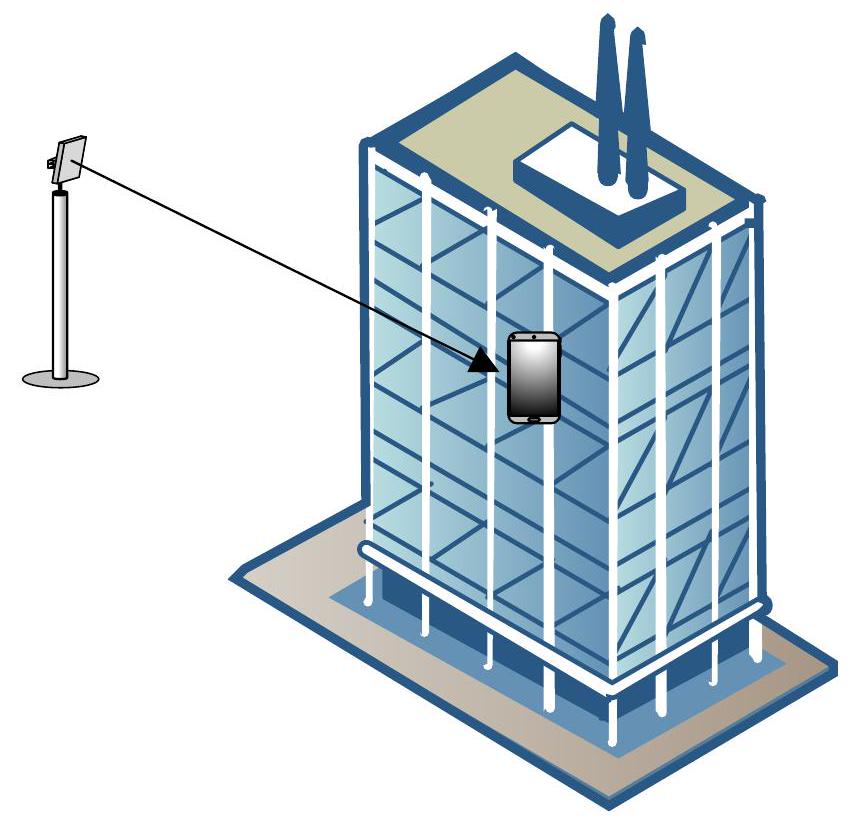
The loss will depend upon a number of factors, such as frequency, elevation angle of path at the station inside and the type of building. Measurements noted that a key factor was whether the exterior is made from:
-
Traditional materials
-
Thermally efficient materials
There can be a wide variation in losses depending upon details of the materials, the location of the station inside, the floors, furniture etc. Therefore, rather than giving a single value a statistical model was used that defines the building entry loss exceeded for a given likelihood.
The inputs are therefore:
- Frequency
- Elevation angle
- Building material
- Probability
The probability can either be entered or selected at random for Monte Carlo analysis. The elevation angle can either be entered or will be calculated from the radio path.
Recommendation ITU-R P.2108
Recommendation ITU-R P.2108 (previously described as P.Clutter) contains three component models depending upon whether:
- Terminal below representative clutter height
- Terrestrial terminal within the clutter
- One terminal is within the clutter and the other is a satellite, aeroplane or other platform above the surface of the Earth.
Height / Gain Clutter Model
This is the same model as in P.1812 and depends upon:
- Frequency
- Antenna height
- Street width
- Representative clutter height
- Clutter type
As this model is “stand-alone” it should be combined with other propagation models as considered appropriate, such as that within Recommendation ITU-R P.2001 (which does not include a clutter loss model). Note that if used with P.452 the clutter model within that Recommendation should be switched off.
The model is valid for the frequency range 30 MHz to 3 GHz.
Statistical Clutter Model
This model is purely statistical in nature, depending upon:
- Frequency
- Distance
- Percentage of locations
The model is valid for the frequency range 2 to 67 GHz and for a minimum path length of:
- 0.25 km (for the correction to be applied at only one end of the path)
- 1 km (for the correction to be applied at both ends of the path)
Elevation Clutter Model
This model gives a clutter loss that is elevation dependent. It is not a fixed value but probabilistic, so a percentage of locations (samples) value must also be given. The parameters are:
- Frequency
- Elevation angle
- Percentage of locations
This model is valid for the frequency range: 10 to 100 GHz and elevation angles from 0° to 90°.
Fixed loss Models
Const Fixed
This option adds a constant dB value to the loss. The constant is a user input.
Const Per Km
This option adds a fixed loss per kilometre of atmosphere through which the path passes.
Transhorizon loss
This allows a fixed loss to be included should the path extend beyond the radio horizon. The loss and effective earth radius can be entered by the user.
This can be combined with ITU-R P.525 propagation model which by default does not include a loss for terrestrial trans-horizon paths. Note this is not needed for earth-space links that are assumed to fail when there is no longer line of sight.
Clutter loss
The clutter loss can be entered by hand or taken from the land use database.
Extra Clutter Model
This option (found in Extra Models) defines the following options:
No Clutter Loss
.
Constant Clutter Loss
Fixed user entered clutter loss, .
P.2108 Clutter Model with zero loss short paths
If distance :
Otherwise:
P.2108 Clutter Model with linear in d interpolation
If distance :
If :
If :
calculate clutter loss at distance
P.2108 Clutter Model with log-linear in d interpolation
, P.2108 Loss
Constant Loss, Likelihood by Distance
User entered parameters:
- Fixed user entered clutter loss
- Minimum distance, do
- Exponent factor,
Calculate likelihood of line of sight, :
if distance :
if :
Then calculate clutter loss using random number :
if : if :
Other Models
Dry Air
This option calculates attenuation due to dry air using frequency dependent curves defined in ITU-R Report 719 to calculate the loss on the path.
Water
This option switches on just the water vapour attenuation part of Recommendation ITU-R P.676.
Use with Define Variable Module
The Define Variable Module allows any input parameter to be specified for each time step as being selected from a distribution or defined from set of values.
This can be used to extend the propagation models further – for example to specific distributions such as Rayleigh or log-normal fading or user entered distributions.
File Formats
- Visualyse Binary Files
- Shaped Beams Gain Tables
- ITU Graphical Data
- Logged Data
- Terrain Data General Import File Format
- Land Use Generic File Format
- View Overlay XML Files
- Text File Format
- Service Area Wizard
- TLEs
- FS Import
- Import Tx System
- Import Rx System
- Import Non-GSO Orbit Elements
Visualyse Binary Files
Visualyse Professional binary files are stored complete with all the information that is required to describe a scenario including the windows used. The file format is not available to the user.
Shaped Beams Gain Tables
The shaped beams are constructed as a table, with a grid of azimuth and elevation angles, and a gain value for each point on the grid. To ease defining complex gain tables, the data can be read in from a text file.
Two formats are available:
HPCON
HPCON is a standard format for antenna pattern data. The format is defined by TICRA Copenhagen, the world leader in antenna design and analysis software.
The format used is described below:
| Record | Data | Format |
|---|---|---|
| First Line | Identifying label | 18 characters of text |
| Second Line | U1,U2,V1,V2,MU,MV Where: U1 = start azimuth, U2 = end azimuth, V1 = start elevation, V2 = end elevation, MU = number of azimuths, MV = number of elevations. | Floating point number represented by an 8 character fixed field padded out with spaces. Accuracy is 3 decimal places. Integer value represented by a 4 character fixed field padded out with spaces |
| Subsequent Lines | (ZR(I,J), J=1,MV) , I=1 MU Where ZR(I,J) is the gain for the Ith azimuth and Jth elevation. There is a maximum of 10 entries per line. | Floating point number represented by an 8 character fixed field padded out with spaces. Accuracy is 3 decimal places. |
Additional data may follow such as the phase of field for each azimuth and elevation, but this is ignored.
Visualyse Professional
There are two possible file formats whereby the data is read in in rows or columns.
The fields are text, separated by one of the following:
- tabs
- commas
- spaces
Format 1:
The file format is described below. The square brackets would not appear in the actual file.
[AzStart] [AzStep] [AzNum] [ElStart] [ElStep] [ElNum]

[Gain X-1 Y-1]

:

[Gain X-n Y-1]

[Gain X-1Y-2]

:

[Gain X-nY-2]

:

:

[Gain X-1Y-m]

:

[Gain X-nY-m]
where:
[AzStart] = start (smallest) azimuth in degrees
[AzStep] = spacing between azimuth grid points (degrees)
[AzNum] = number of azimuth points
[ElStart] = start (smallest) elevation in degrees
[ElStep] = spacing between elevation grid points (degrees)
[ElNum] = number of elevation points
[Gain Az-i El-j] = gain of i-th Azimuth point, j-th Elevation point in dB
Format 2:
The file format is described below using the same notation as for the previous version:
[AzStart] [AzStep] [AzNum] [ElStart] [ElStep] [ElNum]

[Gain X-1 Y-1]

:

[Gain X-1 Y-n]

[Gain X-2Y-1]

:

[Gain X-2Y-n]

:

:

[Gain X-nY-1]

:

[Gain X-nY-m]
Shaped Antenna Type: Multiple Tables File Format
This section describes the file format to load Multiple Tables into a Shaped Antenna Type. The Antenna Type should use an electronically steered beam.
File Type
The fields are text, separated by one of the following:
- tabs
- commas
- spaces
Header Format
The file format is described below for Shaped Antenna Type with N gain tables. The square brackets would not appear in the actual file.
[DataTypeCode] [NumberOfTables = N]

[GainTable 0]

[Azimith-1] [Elevation-1]

[GainTable 1]

:

[Azimith-N-1] [Elevation-N-1]

[GainTable N-1]
The following DataTypeCodes are valid:
101 = Gain tables dependent upon azimuth only and the elevation can be set to zero. Visualyse will select the gain table with skew angle closest to the given azimuth angle, rotate until the pattern has the same skew angle and then rotate the pattern around the sub-satellite point to align with the target pointing direction.
102 = Gain table dependent upon both azimuth and elevation. Visualyse will select the GainTable with (azimuth, elevation) closest to the beam pointing direction, and then rotate the pattern so it aligns with the target pointing direction.
The format of the field [GainTable N] is given in the following section.
The gain table Gain(az, el) reflects the beam when it is pointing at a direction = (azimuth, elevation). So, in most cases, the gain table should have it’s peak gain at the given (azimuth, elevation).
The 0-th gain table is the sub-satellite one i.e. for an (azimuth, elevation) = (0, 0) so there is no need to enter the azimuth or elevation angles for that table.
GainTable Format
The file format is described below. The square brackets would not appear in the actual file.
[AzStart] [AzStep] [AzNum] [ElStart] [ElStep] [ElNum]

[Gain X-1 Y-1]

:

[Gain X-n Y-1]

[Gain X-1Y-2]

:

[Gain X-nY-2]

:

:

[Gain X-1Y-m]

:

[Gain X-nY-m]
where:
[AzStart] = start (smallest) azimuth in degrees
[AzStep] = spacing between azimuth grid points (degrees)
[AzNum] = number of azimuth points
[ElStart] = start (smallest) elevation in degrees
[ElStep] = spacing between elevation grid points (degrees)
[ElNum] = number of elevation points
[Gain Az-i El-j] = gain of i-th Azimuth point, j-th Elevation point in dB
The gain values are loaded in azimuth rows (from lowest azimuth to largest azimuth) starting with the lowest elevation row.
ITU Graphical Data
Visualyse Professional has the ability to read/write files based on the format for shaped beams specified in ITU CR/58. The file format structure is text with sections as used by Microsoft Windows INI files, i.e.:
[SectionName1]

key1=value1

key2=value2

[SectionName2]

key1=value1

key2=value2
The sections are:
-
FormatInfo: specifies the file format
-
GeoMain: contains general information such as name and satellite location
-
COHeader: specifies parameters such as number of contours and boresights
-
Bi: one section for each boresight
-
Ci: one section for each contour, specifying level and series of lat/long points
These sections are described in more detail in the sections below.
FormatInfo
This has a single field to specify the version which is set to one, i.e.:
| Key | Type | Description |
|---|---|---|
| format_ver | int | Version, set to 1 |
GeoMain
This section contains global information about the file. The fields are:
| Key | Type | Description |
|---|---|---|
| adm | char | The notifying administration: this field is not used within Visualyse Professional and so is set to DK for export. |
| ntwk_org | char | The responsible organisation operating the satellite: this field is not used within Visualyse Professional and so is set to DK for export. |
| sat_name | char | This is the satellite name and is used as the antenna description |
| long_nom | char | The satellite’s nominal longitude, used as the antenna longitude |
| n_diag | int | The number of diagrams: not used by Visualyse Professional, so set to 1 for export. |
COHeader
This section describes the contours contained within the file. The fields are:
| Key | Type | Description |
|---|---|---|
| beam_id | char | The designation of the beam. Set to 1 for export |
| emi_rcp | char | The emission / reception flag at the satellite, set to E for emission, R for reception. Visualyse Professional does not distinguish between up and down beams: for export this field is set to E. |
| polar_disc | char | The polarisation discriminator, set to C for co-polarisation, X for cross-polarisation. Visualyse Professional contours are co-polar (though could be used as cross polar) and so this field should be set to C. |
| reason | char | The reason for notification: not used by Visualyse so set to A (advance publication) |
| n_bore | int | Number of boresights |
| n_cont | int | Number of contours |
Visualyse Professional adds a field to this section to specify the peak gain of the beam. This would not affect how the file is read by other systems, but is required to completely define the pattern. This field has the following structure:
| Key | Type | Description |
|---|---|---|
| gain | real | peak gain in dBi of the beam |
Bi
There is a separate section for each of the boresights. Each section has the section name of the form Bi, for example the first boresight would have section name B1.
Each boresight section has the following keys:
| Key | Type | Description |
|---|---|---|
| gain | real | gain relative to peak in dB of the boresight |
| p | geo-coord | The geographical co-ordinates of the boresight in degrees (longitude;latitude) |
Ci
There is a separate section for each of the contours. Each section has the section name of the form Ci, for example the first contour would have section name C1.
Each contour section has the following keys:
| Key | Type | Description |
|---|---|---|
| gain | real | gain relative to peak in dB of the boresight |
| n_point | int | The number of points forming the contour |
| p1 | geo-coord | The geographical co-ordinates of the first contour point in degrees (longitude; latitude) |
| : | : | |
| pn | geo-coord | The geographical co-ordinates of the n-th contour point in degrees (longitude; latitude) |
Visualyse Professional will convert open contours to closed contours when reading in.
Example
The following file was produced by creating a contour antennas in Visualyse Professional and then using the export to ITU file format option.
[FormatInfo]

format_ver=1

[GeoMain]

adm=DK

ntwk_org=DK

sat_name=GSO_Test_A

long_nom=-105.000

n_diag=1

[COHeader]

beam_id=1

emi_rcp=E

polar_disc=C

reason=A

gain=+30.00

n_bore=1

n_cont=3

[B1]

gain=+0.00

p=-99.559;+40.189

[C1]

gain=-3.00

n_point=30

p1=-109.008;+50.377

p2=-114.173;+49.623

p3=-120.598;+48.491

p4=-123.370;+47.547

p5=-124.126;+42.075

p6=-122.866;+37.170

p7=-120.724;+34.151

p8=-117.449;+32.264

p9=-114.551;+29.434

p10=-109.260;+28.679

p11=-105.102;+25.660

p12=-99.685;+23.208

p13=-96.913;+25.849

p14=-90.488;+28.679

p15=-86.079;+26.981

p16=-81.921;+23.396

p17=-77.890;+21.321

p18=-76.252;+21.321

p19=-77.008;+25.472

p20=-76.504;+31.887

p21=-74.866;+35.660

p22=-70.709;+39.434

p23=-68.945;+42.830

p24=-69.323;+46.415

p25=-72.724;+50.566

p26=-83.307;+51.698

p27=-90.866;+50.000

p28=-97.291;+49.811

p29=-105.228;+50.755

p30=-109.008;+50.377

[C2]

gain=-6.00

n_point=19

p1=-112.535;+62.453

p2=-124.882;+60.377

p3=-129.921;+51.887

p4=-131.307;+37.358

p5=-126.520;+28.113

p6=-116.189;+22.264

p7=-110.016;+16.415

p8=-99.433;+12.642

p9=-91.244;+12.453

p10=-80.787;+14.151

p11=-75.244;+12.642

p12=-69.701;+17.547

p13=-66.173;+35.472

p14=-64.283;+43.208

p15=-67.685;+55.660

p16=-78.898;+59.623

p17=-98.299;+62.264

p18=-108.882;+63.019

p19=-112.535;+62.453

[C3]

gain=-30.00

n_point=5

p1=-140.000;+70.000

p2=-60.000;+70.000

p3=-60.000;+0.000

p4=-140.000;+0.000

p5=-140.000;+70.000
Logged Data
Data can be logged to text file, where it has the following format (the entries in square brackets are fields with values that will depend upon the simulation setup):
Log data from run: [Filename]

Number of logs: [Number of variables logged, n]

Timesteps between logs: [Timesteps between file updates]

Elapsed Time [Var-1 long name] … [Var-n long name]

Time since start [Var-1 short name] … [Var-n short name]

s [Var-1 units] … [Var-n units]

[t-0] [Var-1 at t-0] … [Var-n at t-0]

[t-1] [Var-1 at t-1] … [Var-n at t-1]

: : :

[t-m] [Var-1 at t-m] … [Var-n at t-m]
Terrain Data General Import File Format
The General file format is a flexible documented format to the standard set of terrain file formats (USGS GTOPO 30, SRTM etc). Users can translate terrain of their own format into the General file format for loading into Visualyse Professional.
The first terrain data point read is the height at the bottom left of the terrain region specified. The file is binary and each spot height is 2 bytes.
By default values of -9999 will be displayed as sea on the map so as to differentiate from land with height zero. The Propagation models and Path Profile will use a height of zero in place of -9999.
The first height data point is taken to be the terrain height at the bottom left the next. All the fields are twos compliment, little-endian (Intel) integers and the file is packed binary.
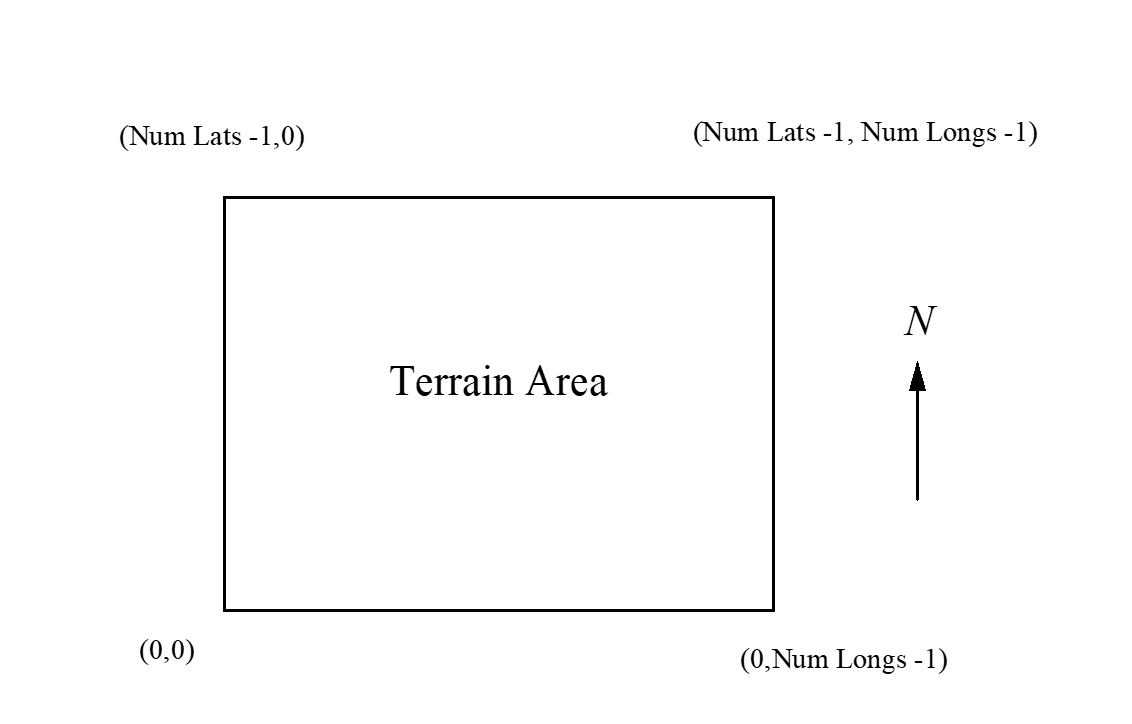
Terrain data can be imported into Visualyse Professional using the following file format:
| Description | Units | Size in bytes |
|---|---|---|
| Type | - | 4 |
| Version | - | 4 |
| Bottom most latitude | milliseconds | 4 |
| Left most longitude | milliseconds | 4 |
| Nlats | - | 4 |
| Nlongs | - | 4 |
| Spacing of latitude points | milliseconds | 4 |
| Spacing of longitude points | milliseconds | 4 |
| Height (1,1) | meters | 2 |
| Height (1,2) | meters | 2 |
| … | … | … |
| Height (1, nlongs) | meters | 2 |
| Height (2,1) | meters | 2 |
| Height (2,2) | meters | 2 |
| … | meters | 2 |
| Height (nlats, nlongs) | meters | 2 |
| EOF | - | - |
Where Nlats is the number of latitude points and Nlongs is the number of longitude points.
An example of the alternative sources of data is the Shuttle Radar Topography Mission (SRTM), which can be found at:
http://edcsns17.cr.usgs.gov/srtm/index.html
Land Use Generic File Format
The clutter data is assumed to be structured as in the figure below:
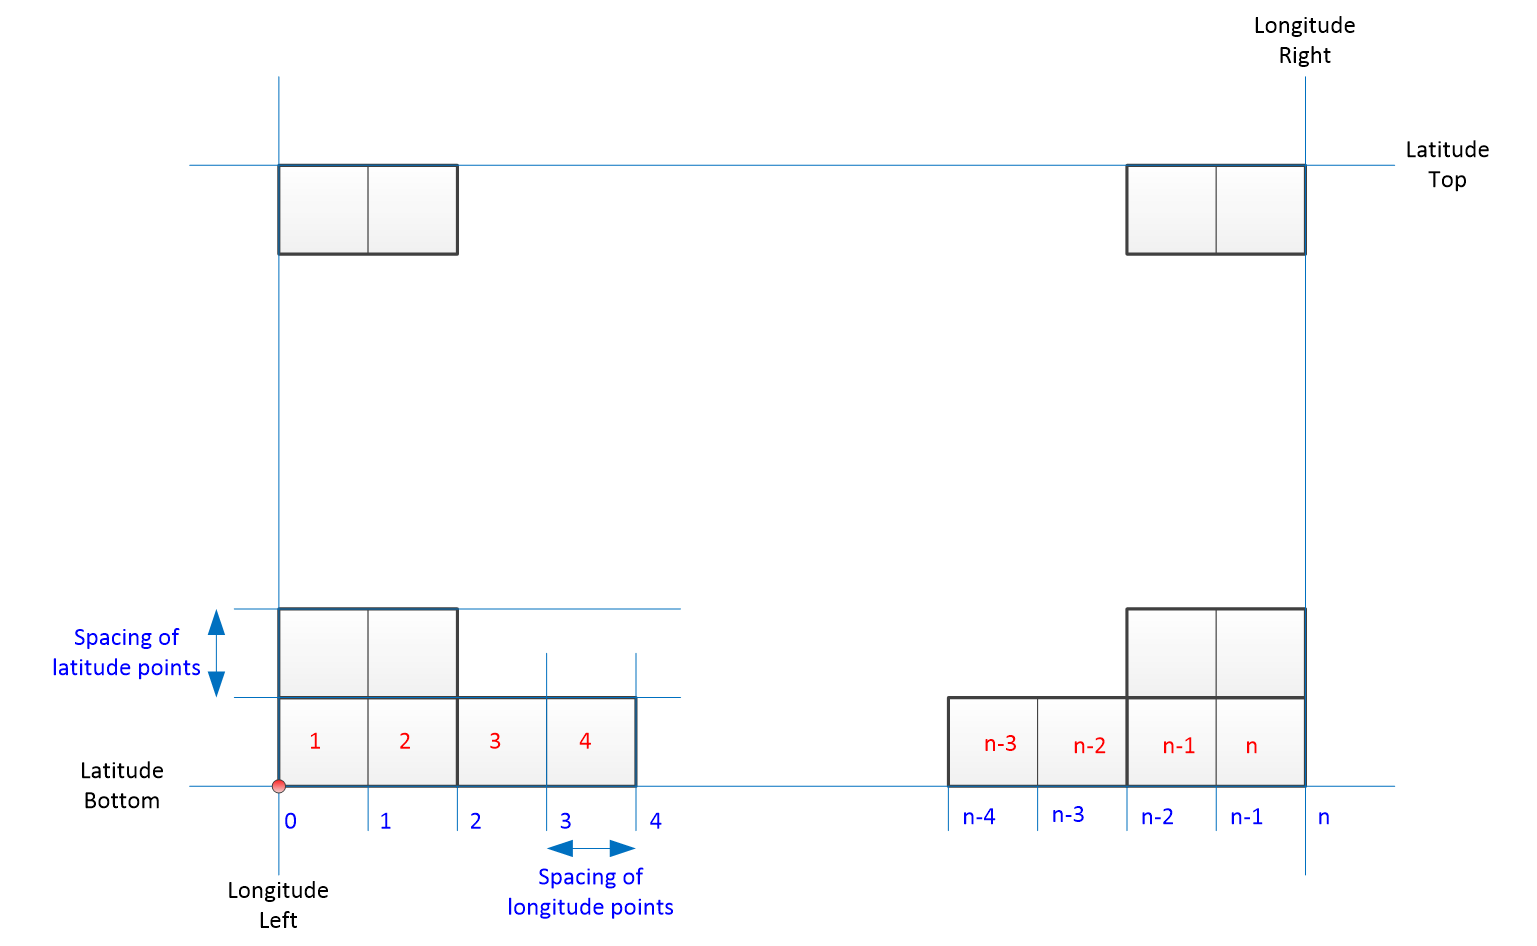
There is a grid of clutter codes starting from bottom left. Each clutter code represents the environment across the whole of the pixel: therefore with a grid of n lat/long lines there are n pixel codes not n+1 (as for terrain).
The location of the bottom right of the rectangle is defined via the (LatitudeBottom, LongitudeRight) point. The other corner of the rectangle is calculated from:
LongitudeRight = LongitudeLeft + LongitudePoints * LongitudeSpacing
LatitudeTop = LatitudeBottom + LatitudePoints * LatitudeSpacing
Each clutter code is assumed to be an integer in the range [0..15] so that there are sixteen possible clutter environments.
Mapping of codes to propagation parameters
The clutter codes are mapped to propagation parameters such as height of clutter and distance to clutter in the Visualyse Professional configuration dialog as shown in the figure below:
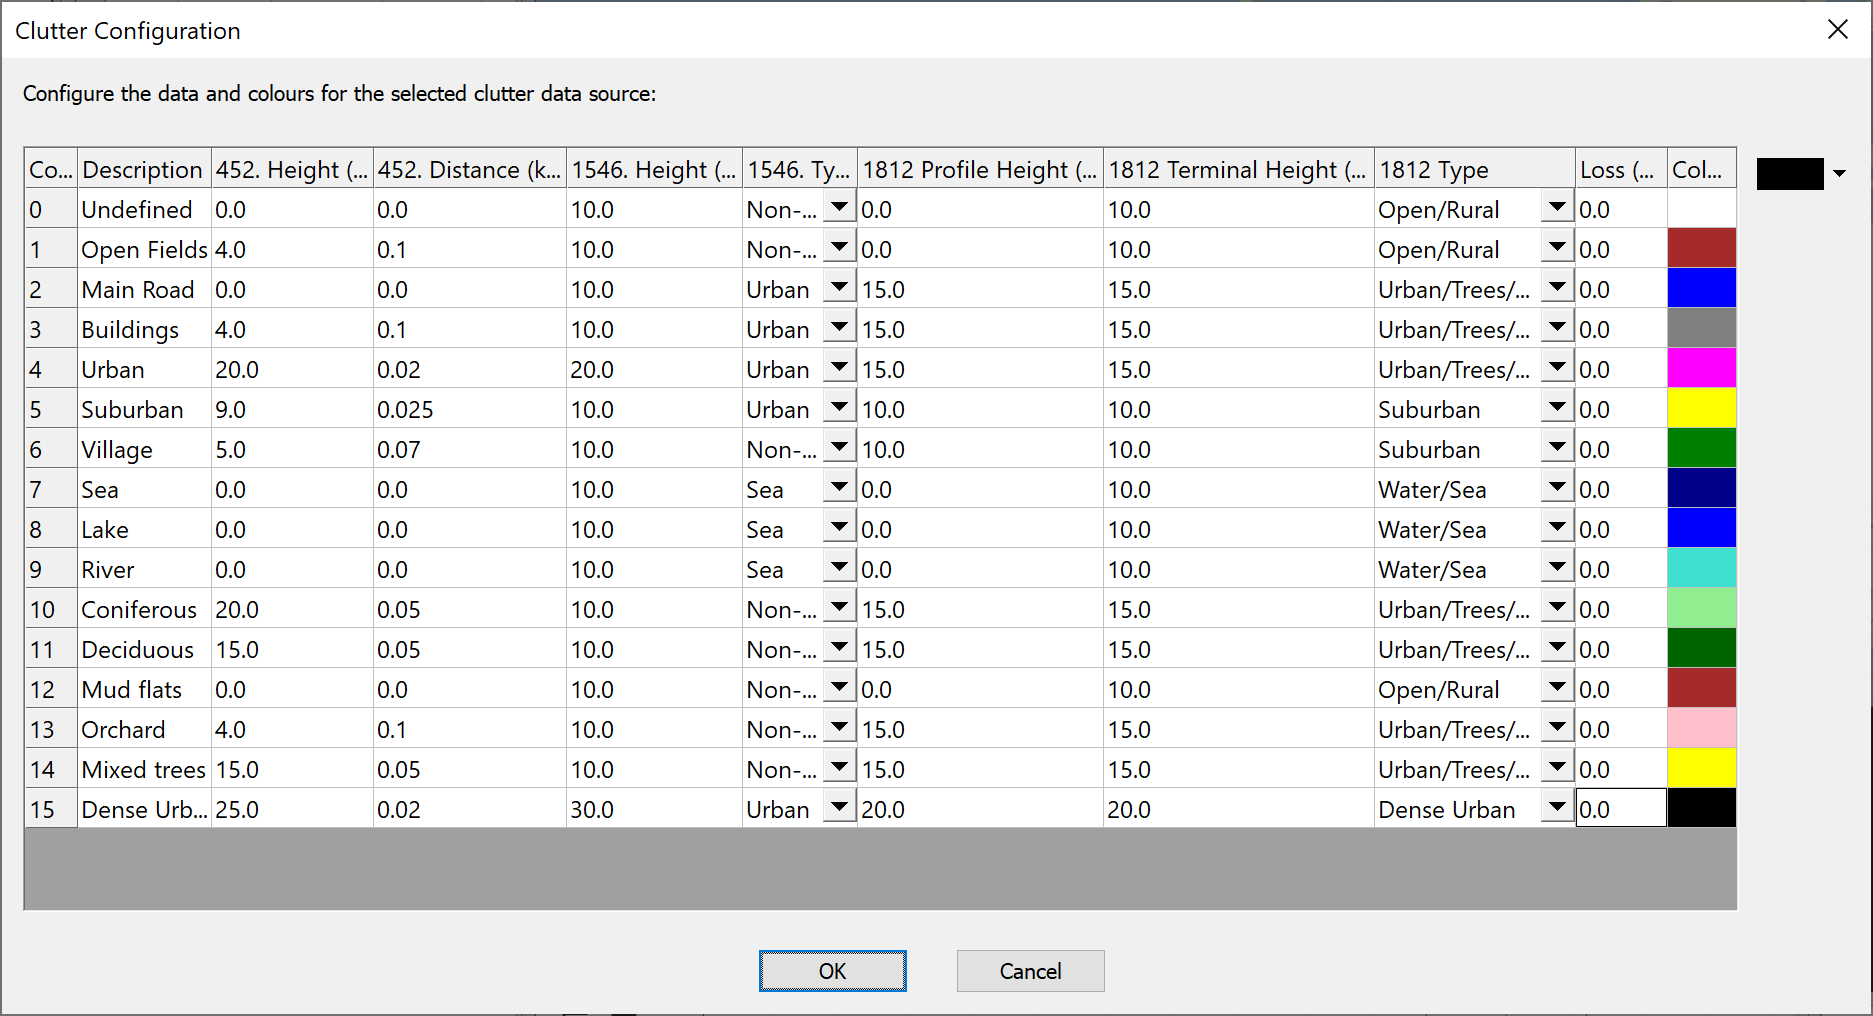
Reference Geoid
The clutter file format does not specify the reference geoid and all data used in a simulation (clutter data, terrain data and station locations) should use the same reference geoid.
File Format
Generic clutter data can be imported into Visualyse Professional using the following file format.
| Description | Units | Size in bytes |
|---|---|---|
| Type | - | 4 |
| Version | - | 4 |
| Bottom most latitude | milliseconds | 4 |
| Left most longitude | milliseconds | 4 |
| nLats | - | 4 |
| nLongs | - | 4 |
| Spacing of latitude points | milliseconds | 4 |
| Spacing of longitude points | milliseconds | 4 |
| String name of clutter type 1 | - | 20 |
| String name of clutter type 2 | - | 20 |
| : | : | : |
| String name of clutter type 16 | - | 20 |
| Code(1,1) | - | 1 |
| Code(1,2) | - | 1 |
| … | … | … |
| Code(1, nLongs-1) | - | 1 |
| Code(1, nLongs) | - | 1 |
| Code(2,1) | - | 1 |
| Code(2,2) | - | 1 |
| … | … | … |
| Code(nLats, nLongs-1) | - | 1 |
| Code(nLats, nLongs) | - | 1 |
| EOF | - | - |
The field “Type” should be set to 200 and the field “Version” should be 100.
Strings should be ASCII coded zero terminated and padded to a length of 20 bytes including zero.
All the fields are twos compliment, little-endian (Intel) integers and the file is packed binary.
View Overlay XML Files
It is possible to overlay images such as maps and vector data such as boundaries, roads etc on top of the Mercator, Plate Carree and 3D views. This section gives the file format for the XML file that describes the data.
The XML file and any referenced graphics files must be located in the “Visualyse 7/Overlays” directory at the time that Visualyse Professional 7 is started.
- View Overlay Images
- View Overlay Vector Line Data
- View Overlay Point Data
- View Overlay Drawing Objects
View Overlay Images
Images in formats such as JPG and BMP can be displayed on top of Visualyse Professional’s views. An XML file is used to define the four corners (lat, long) in either degrees or radians, and also point to the relevant file.
The format is given below, with the fields to complete contained within square brackets and in capital letters - i.e. [MAP_NAME]
<?xml version="1.0" encoding="utf-8"?>
<image xmlns="http://www.transfinite.com"
xmlns:xsi="http://www.w3.org/2001/XMLSchema-instance"
xsi:schemaLocation="http://www.transfinite.com overlay.xsd" name="[NAME]">
    <texture>[FILENAME]</texture>
    <bottomLeft units="[UNITS]" latitude="[LAT_BL]" longitude="[LONG_BL]" />
    <topLeft units="[UNITS]" latitude="[LAT_TL]" longitude="[LONG_TL]" />
    <topRight units="[UNITS]" latitude="[LAT_TR]" longitude="[LONG_TR]" />
    <bottomRight units="[UNITS]" latitude="[LAT_BR]" longitude="[LONG_BR]" />
    <colour>[TTRRGGBB]</colour>
</image>
The fields to enter are therefore:
NAME used to display this image on list of possible overlays
FILENAME filename may include full path or be relative to overlays directory
UNITS either “degrees” or “radians”
LAT_BL latitude in relevant units of bottom left of image
LAT_TL latitude in relevant units of top left of image
LAT_BR latitude in relevant units of bottom right of image
LAT_TR latitude in relevant units of top right of image
LONG_BL longitude in relevant units of bottom left of image
LONG_TL longitude in relevant units of top left of image
LONG_BR longitude in relevant units of bottom right of image
LONG_TR longitude in relevant units of top right of image
TTRRGGBB codes in hex for the Transparency, Red, Green & Blue to use
Note that it is necessary to define the lat/long of all four corners of the image rather than just top (top left and bottom right) as some images could be rotated. For example, maps generated in Universal Transverse Mercator (UTM) or local variants such as the UK’s National Grid do not always align with vertically with the North-South line.
An example of this format is given below:
<?xml version="1.0" encoding="utf-8"?>
<image xmlns="http://www.transfinite.com"
xmlns:xsi="http://www.w3.org/2001/XMLSchema-instance"
xsi:schemaLocation="http://www.transfinite.com overlay.xsd"
name="Google Maps Seattle">
    <texture>C:\Program Files (x86)\Visualyse 7\Overlays\Seattle Area.bmp</texture>
    <bottomLeft units="degrees" latitude="47.17" longitude="-125.6121825" />
    <topLeft units="degrees" latitude="49.81" longitude="-125.6121825" />
    <topRight units="degrees" latitude="49.81" longitude="-120.5035395" />
    <bottomRight units="degrees" latitude="47.17" longitude="-120.5035395" />
    <colour>ffffffff</colour>
</image>
View Overlay Vector Line Data
Vector data such as roads, railways, borders, boundaries etc can be displayed on top of Visualyse Professional’s views. An XML file is used to define a set of (lat, long) points and a line colour is used to connect them.
The format is given below, with the fields to complete contained within square brackets and in capital letters - i.e. [NAME]
<?xml version="1.0" encoding="utf-8"?>
<lines xmlns="http://www.transfinite.com"
xmlns:xsi="http://www.w3.org/2001/XMLSchema-instance"
xsi:schemaLocation="http://www.transfinite.com overlay.xsd"
name="[NAME]" colour="[TTRRGGBB]">
<line units="UNITS">
<coordinates>
“[LAT_1]”, “[LONG_1]”,
“[LAT_2]”, “[LONG_2]”,
“[LAT_3]”, “[LONG_3]”,
...
“[LAT_n]”, “[LONG_n]”
</coordinates>
</line>
</lines>
The fields to enter are therefore:
NAME used to display this image on list of possible overlays
TTRRGGBB codes in hex for the Transparency, Red, Green & Blue to use
UNITS either “degrees” or “radians”
LAT_i set of latitudes
LONG_i set of longitudes
Any number of (lat, long) points may be used, though there could be performance implications for very large data sets.
An example of this format is given below:
<?xml version="1.0" encoding="utf-8"?>
<lines xmlns="http://www.transfinite.com"
xmlns:xsi="http://www.w3.org/2001/XMLSchema-instance"
xsi:schemaLocation="http://www.transfinite.com overlay.xsd"
name="Washington BEA" colour="8000ffff">
    <line units="degrees">
        <coordinates>
        39.194801,-79.487396,
        39.205856,-79.487099,
        39.279827,-79.487877,
        39.216099,-79.507797,
        39.194801,-79.487396
        </coordinates>
    </line>
</lines>
View Overlay Point Data
Point data such as capital cities can be displayed on top of Visualyse Professional’s views. An XML file is used to define a set of (lat, long) points with a label.
The format is given below, with the fields to complete contained within square brackets and in capital letters - i.e. [NAME]
<?xml version="1.0" encoding="utf-8" ?>
- <points xmlns="http://www.transfinite.com"
xmlns:xsi="http://www.w3.org/2001/XMLSchema-instance"
xsi:schemaLocation="http://www.transfinite.com overlay.xsd"
name="[NAME]">
  <poi units="[UNITS]" legend="[LEG_1]" latitude="[LAT_1]" longitude="[LONG_1]" />
  <poi units="[UNITS]" legend="[LEG_2]" latitude="[LAT_2]" longitude="[LONG_2]" />
  <poi units="[UNITS]" legend="[LEG_3]" latitude="[LAT_3]" longitude="[LONG_3]" />
  <poi units="[UNITS]" legend="[LEG_4]" latitude="[LAT_4]" longitude="[LONG_4]" />
  <poi units="[UNITS]" legend="[LEG_5]" latitude="[LAT_5]" longitude="[LONG_5]" />
  <poi units="[UNITS]" legend="[LEG_6]" latitude="[LAT_6]" longitude="[LONG_6]" />
</points>
The fields to enter are therefore:
NAME used to display this image on list of possible overlays
UNITS either “degrees” or “radians”
LEG_i set of legends
LAT_i set of latitudes
LONG_i set of longitudes
Any number of (lat, long) points may be used, though there could be performance implications for very large data sets.
An example of this format is given below:
<?xml version="1.0" encoding="utf-8"?>
<points xmlns="http://www.transfinite.com"
xmlns:xsi="http://www.w3.org/2001/XMLSchema-instance"
xsi:schemaLocation="http://www.transfinite.com overlay.xsd"
name="Capital Cities of the World">
  <poi units="degrees" legend="Kabul" latitude="34.467" longitude="69.1833" />
  <poi units="degrees" legend="Tirane" latitude="41.3" longitude="19.81666667" />
  <poi units="degrees" legend="Algiers" latitude="36.7" longitude="3.133333333" />
  <poi units="degrees" legend="Plymouth" latitude="16.6802" longitude="-62.2014" />
  <poi units="degrees" legend="Saint Johns" latitude="17.1175" longitude="-61.8455" />
  <poi units="degrees" legend="The Valley" latitude="18.2249" longitude="-63.0668" />
</points>
View Overlay Drawing Objects
Basic shapes including Rectangles, Ellipses and Grids can be displayed on top of Visualyse Professional’s views. An XML file is used to define the drawing object as below:
Rectangle
The format is given below, with the fields to complete contained within square brackets and in capital letters - i.e. [NAME]
<?xml version="1.0" encoding="utf-8"?>
<drawing xmlns="http://www.transfinite.com"
xmlns:xsi="http://www.w3.org/2001/XMLSchema-instance"
xsi:schemaLocation="http://www.transfinite.com overlay.xsd"
name="[NAME]" colour="[TTRRGGBB]">
<rect units="[UNITS]" top="[LAT_TOP]" left="[LONG_LFT]" bottom="[LAT_BTM] right="[LONG_RGT]" />
</drawing>
The fields to enter are therefore:
NAME used to display this image on list of possible overlays
TTRRGGBB codes in hex for the Transparency, Red, Green & Blue to use
UNITS either “degrees” or “radians”
LAT_TOP top latitude
LONG_LFT left longitude
LAT_BTM bottom latitude
LONG_RGT right longitude
An example of this format is given below:
<?xml version="1.0" encoding="utf-8"?>
<drawing xmlns="http://www.transfinite.com"
xmlns:xsi="http://www.w3.org/2001/XMLSchema-instance"
xsi:schemaLocation="http://www.transfinite.com overlay.xsd"
name="Test Rectangle" colour="8000ffff">
<rect units="degrees" top="37.0" left="-9.0" bottom="23.5" right="12.0" />
</drawing>
Ellipse
The format is given below, with the fields to complete contained within square brackets and in capital letters - i.e. [NAME]
<?xml version="1.0" encoding="utf-8"?>
<drawing xmlns="http://www.transfinite.com"
xmlns:xsi="http://www.w3.org/2001/XMLSchema-instance"
xsi:schemaLocation="http://www.transfinite.com overlay.xsd"
name="[NAME]" colour="[TTRRGGBB]">
<ellipse units="[UNITS]" centrelat="[CTR_LAT]" centrelong="[CTR_LNG]" radiuslat="[RAD_LAT] radiuslong="[RAD_LNG]" />
</drawing>
The fields to enter are therefore:
NAME used to display this image on list of possible overlays
TTRRGGBB codes in hex for the Transparency, Red, Green & Blue to use
UNITS either “degrees” or “radians”
CTR_LAT centre latitude
CTR_LNG centre longitude
RAD_LAT radius latitude
RAD_LNG radius longitude
An example of this format is given below:
<?xml version="1.0" encoding="utf-8"?>
<drawing xmlns="http://www.transfinite.com"
xmlns:xsi="http://www.w3.org/2001/XMLSchema-instance"
xsi:schemaLocation="http://www.transfinite.com overlay.xsd"
name="Test Ellipse" colour="8000ffff">
<ellipse units="degrees" centrelat="60.0" centrelong="20.0" radiuslat="10" radiuslong="20" />
</drawing>
Grid
The format is given below, with the fields to complete contained within square brackets and in capital letters - i.e. [NAME]
<?xml version="1.0" encoding="utf-8"?>
<drawing xmlns="http://www.transfinite.com"
xmlns:xsi="http://www.w3.org/2001/XMLSchema-instance"
xsi:schemaLocation="http://www.transfinite.com overlay.xsd"
name="[NAME]" colour="[TTRRGGBB]">
<grid areaunits="[UNITS]" top="[LAT_TOP]" left="[LONG_LFT]" bottom="[LAT_BTM] right="[LONG_RGT]" horzres="[HOR_RES] vertres="[VER_RES]" />
</drawing>
The fields to enter are therefore:
NAME used to display this image on list of possible overlays
TTRRGGBB codes in hex for the Transparency, Red, Green & Blue to use
UNITS either “degrees” or “radians”
CTR_LAT centre latitude
CTR_LNG centre longitude
RAD_LAT radius latitude
RAD_LNG radius longitude
HOR_RES horizontal resolution (km)
VER_RES vertical resolution (km)
An example of this format is given below:
<?xml version="1.0" encoding="utf-8"?>
<drawing xmlns="http://www.transfinite.com"
xmlns:xsi="http://www.w3.org/2001/XMLSchema-instance"
xsi:schemaLocation="http://www.transfinite.com overlay.xsd"
name="Test Grid" colour="8000ffff">
<grid areaunits="degrees" top="30.0" left="-50.0" bottom="10" right="-30" horzres="300" vertres="300" />
</drawing>
Text File Format
Structure
Visualyse Professional has a file format that allows complete definition of simulations in a standard ASCII text file. In it are definitions of all objects and their attributes required to specify any Visualyse Professional sharing scenario. The file format can also be used to define single elements – for example a station or an antenna.
The format is based upon the Microsoft Windows INI structure, using section headers and field names as follows:
[Section Header]

[Field Name] = (value)
The section header describes the object being defined based upon the Visualyse Professional object tree. Each simulation starts at the root object “Simul” and then has branches for stations, antennas, links etc separated by a period or “.”1.
So the section header for the geographic location of a station called “FS TX” would be:
[Simul.Station List.FS TX.Start LatLongHeight]
Field names are the variables associated with the object defined by the section header – so for the geographic location the variables would be latitude and longitude. The section would then start as follows:
[Simul.Station List.FS TX.Start LatLongHeight]

Name=Start LatLongHeight

Description=Start Earth latitude, longitude, height

Latitude=N38:58'31.2034"

Longitude=W77:9'39.1658"
Creating Text Files
While in theory it is possible to create text files solely using a text editor, in practice it is easier to get Visualyse Professional to make a template which you can then edit. This ensures the format is the one that Visualyse Professional expects, as all the variables and objects must be specified in the correct format.
These can be done by either:
- Creating a simulation file (as normal) and then using the “Save As” option and selecting the text file format;
- Opening the Model View and saving the object required as a text file.
Batch Mode
It is also possible to run Visualyse Professional in batch mode from the command line. This could be useful if there are many simulations to be run or an iterative approach is required.
With this file format the command line would be something like:
C:\\Program Files (x86)\\Visualyse 7\\Program\>visualyse –x mss-fs.txt
where the -x command closes Visualyse Professional on completion of the run.
This command line would save the results into the file “mss-fs.txt” which could then be read in by other programs.
Service Area Wizard
Station locations can be read into Visualyse Professional using the service area wizard. This requires a text file with a set of rows similar to this:
[Lat-1], [Long-1]

[Lat-2], [Long-2]

: :
The fields should be separated by commas.
TLEs
Satellites orbit data can be read into Visualyse Professional using the Two Line Element (TLE) format.
This file format is defined in the document that can be found here:
http://celestrak.com/columns/v04n03/
Note: Visualyse Professional requires the first line to be the name of the satellite so the software can identify it.
FS Import
The FS Import tool uses a pre-defined format in which each row defines one point to point (PtP) link. The FS Import requires the following fields to be defined and then either pasted into Visualyse Professional or be available in a CSV format file:
| Column | Field |
|---|---|
| 1 | Link Number |
| 2 | Link Name Or Reference |
| 3 | Operator Name |
| 4 | Centre Frequency (GHz) |
| 5 | Licensed Bandwidth (MHz) |
| 6 | Tx OBW (MHz) |
| 7 | Transmit Station Name |
| 8 | Tx Longitude (degrees) |
| 9 | Tx Latitude (degrees) |
| 10 | Tx Height Above Terrain (m) |
| 11 | Receive Station Name |
| 12 | Rx Longitude (degrees) |
| 13 | Rx Latitude (degrees) |
| 14 | Rx Height Above Terrain (m) |
| 15 | Transmit Power (dBW) |
| 16 | Tx Antenna Peak Gain (dBi) |
| 17 | Tx Antenna Gain roll-off Code |
| 18 | Tx Antenna Beam width (degrees) |
| 19 | Tx Feed Loss (dB) |
| 20 | Rx Antenna Peak Gain (dBi) |
| 21 | Rx Antenna Gain roll-off Code |
| 22 | Rx Antenna Beam width (dB) |
| 23 | Rx Feed Loss (dB) |
| 24 (*) | Hop Geoclimatic Factor (c) |
| 25 (*) | pL (Rec P.453) |
| 26 | Pol |
| 27 | System Temp (k) |
| 28 | C/I Threshold |
| 29 | C/N Threshold |
| 30 | C/(N+I) Threshold |
| 31 | I/N Threshold |
Fields marked (*) are not required in Visualyse Professional Version 7 but are there to ensure backwards compatibility.
Valid polarisation codes are given in the table below:
| Polarisation | Code |
|---|---|
| Linear horizontal | H |
| Linear vertical | V |
| Left hand circular | LHC |
| Right hand circular | RHC |
The gain patterns should match one of the following codes or text descriptions:
| Code | Gain Pattern |
|---|---|
| 0 | Analytic ES |
| 1 | Analytic NGSO |
| 2 | App 29 Earth Station |
| 3 | App 30 Earth Rx Reg 1 & 3 Comm |
| 4 | App 30 Earth Rx Reg 1 & 3 Ind |
| 5 | App 30 Earth Rx Reg 1 & 3 WRC-97 |
| 6 | App 30 Earth Rx Reg 2 |
| 7 | App 30 Satellite Tx Reg 1 & 3 |
| 8 | App 30 Satellite Tx Reg 1 & 3 FR |
| 9 | App 30 Satellite Tx Reg 2 |
| 10 | App 30 Satellite Tx Reg 2 FR |
| 11 | App 30 Space |
| 12 | App 30 Space Fast roll-off |
| 13 | App 30A Satellite Rx Reg 1 & 3 |
| 14 | App 30A Satellite Rx Reg 1 & 3 FR |
| 15 | App 30A Satellite Rx Reg 2 |
| 16 | App 30A Satellite Rx Reg 2 FR |
| 17 | App 30B Earth Station A |
| 18 | App 30B Earth Station B |
| 19 | App 30B Space Station |
| 20 | App 30B Space Station FR |
| 21 | App 7 Earth Station |
| 22 | App 7 Fixed Service |
| 23 | App 8 Earth Station |
| 24 | Bessel |
| 25 | Bessel Standard |
| 26 | Capped Bessel |
| 27 | Cosine |
| 28 | ETS 300-157 Rx |
| 29 | ETS 300-158 Rx |
| 30 | ETS 300-159 Rx |
| 31 | ETS 300-159 Tx Spec 1 |
| 32 | ETS 300-159 Tx Spec 2 |
| 33 | ETS 300-327 Rx |
| 34 | ETS 300-327 Tx |
| 35 | ETS 300-332 Rx |
| 36 | ETS 300-332 Tx |
| 37 | ETS 300-333 Rx |
| 38 | FSATMULTI_1A Earth Station |
| 39 | FSATMULTI_1A Type A |
| 40 | GPS L1 |
| 41 | GPS L2 |
| 42 | GPS User |
| 43 | IMT-MODEL 28 GHz BS |
| 44 | IMT-MODEL 28 GHz UE A |
| 45 | IMT-MODEL 28 GHz UE B |
| 46 | IMT-MODEL BS Indoor |
| 47 | IMT-MODEL BS Suburban |
| 48 | IMT-MODEL BS Urban Outdoor |
| 49 | IMT-MODEL UE Indoor |
| 50 | IMT-MODEL UE Suburban |
| 51 | IMT-MODEL UE Urban Outdoor |
| 52 | ITU-R BO.1443-1 |
| 53 | ITU-R BO.1443-3 |
| 54 | ITU-R F.1245 |
| 55 | ITU-R F.1245-1 |
| 56 | ITU-R F.1245-1 Annex 1 |
| 57 | ITU-R F.1245-2 |
| 58 | ITU-R F.1245-2 Annex 1 |
| 59 | ITU-R F.1245-3 |
| 60 | ITU-R F.1245-3 Annex 1 |
| 61 | ITU-R F.1336 (2.1.1) |
| 62 | ITU-R F.1336 (2.1.2) |
| 63 | ITU-R F.1336 (2.2) |
| 64 | ITU-R F.1336 (4, NOTE 4) |
| 65 | ITU-R F.1336-1 (k=0) |
| 66 | ITU-R F.1336-1 (k=0.1) |
| 67 | ITU-R F.1336-1 (k=0.2) |
| 68 | ITU-R F.1336-1 (k=0.7) |
| 69 | ITU-R F.1336-2 (2.1) [k=0.1] |
| 70 | ITU-R F.1336-2 (2.1) [k=0.2] |
| 71 | ITU-R F.1336-2 (2.1) [k=0.7] |
| 72 | ITU-R F.1336-2 (2.1) [k=0] |
| 73 | ITU-R F.1336-2 (2.2) [k=0.1] |
| 74 | ITU-R F.1336-2 (2.2) [k=0.2] |
| 75 | ITU-R F.1336-2 (2.2) [k=0.7] |
| 76 | ITU-R F.1336-2 (2.2) [k=0] |
| 77 | ITU-R F.1336-5 Rec 2.1 |
| 78 | ITU-R F.1336-5 Rec 2.2 |
| 79 | ITU-R F.1336-5 Rec 3.1.1 |
| 80 | ITU-R F.1336-5 Rec 3.1.2 |
| 81 | ITU-R F.1336-5 Rec 3.2 |
| 82 | ITU-R F.1336-5 Rec 4 |
| 83 | ITU-R F.1336-5 Annex 4 |
| 84 | ITU-R F.1891 (LN = -25) |
| 85 | ITU-R F.699-2 |
| 86 | ITU-R F.699-2R |
| 87 | ITU-R F.699-3 |
| 88 | ITU-R F.699-3R |
| 89 | ITU-R F.699-5 |
| 90 | ITU-R F.699-6 |
| 91 | ITU-R F.699-7 |
| 92 | ITU-R F.699-8 |
| 93 | ITU-R M.1851 (COS Average) |
| 94 | ITU-R M.1851 (COS Peak) |
| 95 | ITU-R M.1851 (COS) |
| 96 | ITU-R M.1851 (COS2 Average) |
| 97 | ITU-R M.1851 (COS2 Peak) |
| 98 | ITU-R M.1851 (COS2) |
| 99 | ITU-R M.1851 (COS3 Average) |
| 100 | ITU-R M.1851 (COS3 Peak) |
| 101 | ITU-R M.1851 (COS3) |
| 102 | ITU-R M.1851 (COS4 Average) |
| 103 | ITU-R M.1851 (COS4 Peak) |
| 104 | ITU-R M.1851 (COS4) |
| 105 | ITU-R M.1851 (SIN Average) |
| 106 | ITU-R M.1851 (SIN Peak) |
| 107 | ITU-R M.1851 (SIN) |
| 108 | ITU-R M.2101 |
| 109 | ITU-R RA.1631 |
| 110 | ITU-R RS.1813 (Recommends 1) |
| 111 | ITU-R RS.1813 (Recommends 2) |
| 112 | ITU-R S.1328 USAKUL1 |
| 113 | ITU-R S.1428 |
| 114 | ITU-R S.1428-1 |
| 115 | ITU-R S.1428-1 Rec |
| 116 | ITU-R S.1528 (1.2) LN = -15 |
| 117 | ITU-R S.1528 (1.2) LN = -20 |
| 118 | ITU-R S.1528 (1.2) LN = -25 |
| 119 | ITU-R S.1528 (1.2) LN = -30 |
| 120 | ITU-R S.465-5 |
| 121 | ITU-R S.465-5 (APL) |
| 122 | ITU-R S.465-5 prior to 1993 |
| 123 | ITU-R S.465-6 Rx |
| 124 | ITU-R S.465-5 Tx |
| 125 | ITU-R S.580-6 |
| 126 | ITU-R S.580-6 (APL) |
| 127 | ITU-R S.672-3 Annex 1 Ls = -10 |
| 128 | ITU-R S.672-3 Annex 1 Ls = -20 |
| 129 | ITU-R S.672-3 Annex 1 Ls = -25 |
| 130 | ITU-R S.672-3 Annex 1 Ls = -30 |
| 131 | ITU-R S.672-3 Ln = -20 |
| 132 | ITU-R S.672-3 Ln = -25 |
| 133 | ITU-R S.672-3 Ln = -30 |
| 134 | ITU-R S.672-4 Annex 1 Ls = -10 |
| 135 | ITU-R S.672-4 Annex 1 Ls = -20 |
| 136 | ITU-R S.672-4 Annex 1 Ls = -25 |
| 137 | ITU-R S.672-4 Annex 1 Ls = -30 |
| 138 | ITU-R S.672-4 Ln = -20 |
| 139 | ITU-R S.672-4 Ln = -25 |
| 140 | ITU-R SA.509 Rec 1.1 |
| 141 | ITU-R SA.509 Rec 1.2 |
| 142 | Linear with angle |
| 143 | NGSO FSS RX |
| 144 | NGSO FSS TX |
| 145 | Omni directional |
| 146 | PFD Area |
| 147 | Parabolic rolloff |
| 148 | Resolution 221 (LN = -25) |
| 149 | Resolution 221 (LN = -26) |
| 150 | Resolution 221 (LN = -28) |
| 151 | Resolution 221 (LN = -30) |
| 152 | Resolution 221 (LN = -32) |
| 153 | SMATV |
| 154 | Sine |
| 155 | Sine(x)/x |
| 156 | SkyBridge RX Type A |
| 157 | SkyBridge TX Type A |
| 158 | TVRO |
| 159 | Teledesic 2 - RX |
| 160 | Teledesic 2 - RX fixed BW |
| 161 | Teledesic 2 - TX |
| 162 | Teledesic 2 - TX fixed BW |
| 163 | Teledesic Type A |
| 164 | Teledesic Type B |
| 165 | Teledesic Type C |
Import Tx System
The Import Tx System tool uses a pre-defined format in which each row defines one Transmit station and link. The Import Tx System tool requires the following fields to be defined and then either pasted into Visualyse Professional or be available in a CSV format file:
| Column | Field |
|---|---|
| 1 | Number |
| 2 | Reference |
| 3 | Operator Name |
| 4 | Centre Frequency (GHz) |
| 5 | Licensed Bandwidth (MHz) |
| 6 | Tx OBW (MHz) |
| 7 | Tx Station Name |
| 8 | Tx Longitude (degrees) |
| 9 | Tx Latitude (degrees) |
| 10 | Tx Height Above Terrain (m) |
| 11 | Transmit Power (dBW) |
| 12 | Tx Antenna Peak Gain (dBi) |
| 13 | Tx Antenna Gain roll-off Code |
| 14 | Tx Antenna Beam width (degrees) |
| 15 | Polarisation |
| 16 | Icon |
| 17 | Tx Antenna Azimuth (degrees) |
| 18 | Tx Antenna Elevation (degrees) |
| 19 | Tx Antenna Feeder Loss (dB) |
| 20 | Number of Links (optional field) |
Valid polarisation codes are given in table 3 in the previous section
The gain patterns should match one of the codes or text descriptions in Table 4 in the previous section.
The Icon should be a string of the form icon-name (R,G,B) where R,G,B are values in the range 0 – 255 to indicate colour. For example: dish-medium (200,60,25)
Tower Icons
| Name |
|---|
| broadcast-tower |
| cell-tower |
| golf-ball |
| microwave-tower |
| office-building |
| broadcast-tower |
Dish Icons
| Name |
|---|
| 5G-base |
| dish-large |
| dish-medium |
| dish-small |
| dish-tiny |
| house |
| microwave-dish |
| radar |
| router |
Satellite Icons
| Name |
|---|
| 3-cube |
| 3-panel-h |
| 3-panel |
| 4-dish |
| 8-panel |
| cube |
| eos |
| gps |
| gso |
| hubble |
| iss |
| leo-2-dish-h |
| leo-2-dish |
| leo |
| ngso-v |
| ngso |
| t-long |
| t-short |
| wide-span |
Handset Icons
| Name |
|---|
| mobile-small |
| mobile |
| satphone |
Vehicle Icons
| Name |
|---|
| aircraft |
| blimp |
| car |
| ferry |
| helicopter |
| rocket |
| ship |
| shuttle |
| tank |
| train |
| truck |
Broadcasting Icons
| Name |
|---|
| camera-small |
| camera |
| hand-mic-small |
| hand-mic |
| headset-small |
| headset |
| mic-symbol-small |
| mic-symbol |
Marker Icons
| Name |
|---|
| marker-cross |
| marker-dot |
| marker-flag |
| marker-map-rounded |
| marker-map |
| marker-pin |
| marker-ring |
| marker-triangle |
Import Rx System
The Import Rx System tool uses a pre-defined format in which each row defines one Receive station and link. The Import Rx System tool requires the following fields to be defined and then either pasted into Visualyse Professional or be available in a CSV format file:
| Column | Field |
|---|---|
| 1 | Number |
| 2 | Reference |
| 3 | Operator Name |
| 4 | Centre Frequency (GHz) |
| 5 | Licensed Bandwidth (MHz) |
| 6 | Rx OBW (MHz) |
| 7 | Rx Station Name |
| 8 | Rx Longitude (degrees) |
| 9 | Rx Latitude (degrees) |
| 10 | Rx Height Above Terrain (m) |
| 11 | Rx Antenna Peak Gain (dBi) |
| 12 | Rx Antenna Gain roll-off Code |
| 13 | Rx Antenna Beam width (degrees) |
| 14 | Polarisation |
| 15 | Icon |
| 16 | Rx Antenna Azimuth (degrees) |
| 17 | Rx Antenna Elevation (degrees) |
| 18 | Rx Antenna Feeder Loss (dB) |
| 19 | Rx Temperature (K) |
Valid polarisation codes are given in table 5 in the previous section
The gain patterns should match one of the codes or text descriptions in Table 4 in the previous section.
The Icon should be as per the previous section.
Import Non-GSO Orbit Elements
The Import Non-GSO Orbit Elements tool uses a pre-defined format in which each row defines one Non-GSO station. The Import Non-GSO Orbit Elements requires the following fields to be defined and then either pasted into Visualyse Professional or be available in a CSV format file:
| Column | Field |
|---|---|
| 1 | Number |
| 2 | Semi-major axis, a (km) |
| 3 | Eccentricity, e |
| 4 | Inclination, i (degrees) |
| 5 | Use LAN (TRUE/FALSE) |
| 6 | Longitude ascending node / RAAN (degrees) |
| 7 | Argument of periapsis (degrees) |
| 8 | True anomaly (degrees) |
-
This is the reason that Visualyse Professional object names are not allowed to include the “.” character ↩
VisTools
This section describes the calculations in the Visualyse Professional stand-alone tool kit, VisTools.
- dB Calculation
- Frequency to Wavelength
- Path Loss
- Field of View
- Peak Gain
- Half Power Beamwidth
- Relative Gain
- Temperature to Noise
- Link Budget
dB Calculation
The tool converts between (d) and absolute (a) using:
Frequency to Wavelength
The Frequency tool converts between frequency and wavelength using:
where is the speed of light
Path Loss
The Pathloss tool calculates the free space path loss. The parameters used are:
- Frequency and Frequency units
- Path Length
- Path Loss
Each of these three can be calculated from the other using:
Field of View
The field of view tool provides information about circular orbits in terms of field of view and orbit period. The parameters are:
- height of satellite
- distance to horizon
- half of field of view,
- orbital period
as shown in the figure below:
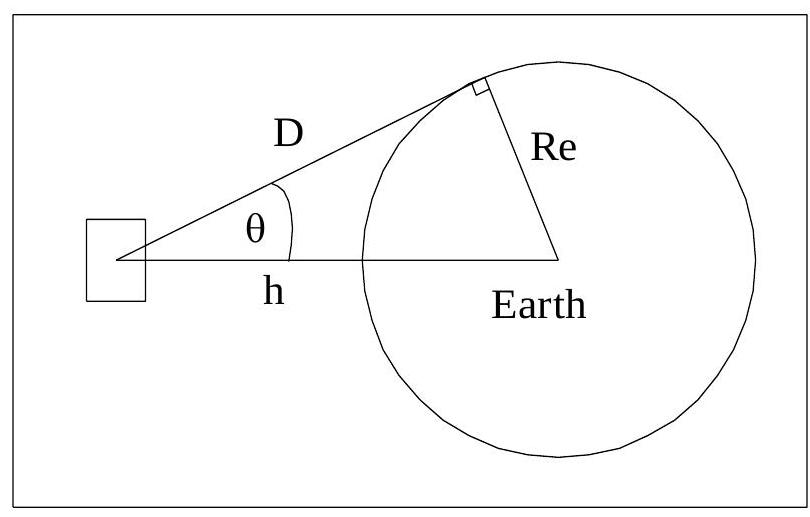
The equations are:
where:
Peak Gain
This tool calculates peak gain based on the following parameters:
- frequency and frequency units
- dish size D
- efficiency
- peak gain
These parameters are related using the following equation:
Half Power Beamwidth
The Theta-3dB tool calculates half power beamwidth based upon the following parameters:
- peak gain,
- efficiency,
- half power beamwidth,
These parameters are related using the following equation:
Relative Gain
The relative gain tool calculates offaxis gain within the main lobe for a pure parabolic dish, based upon the following parameters:
- Gain relative to peak,
- Half power beamwidth,
- Offaxis angle, These parameters are related using the following equation:
Temperature to Noise
The noise tool converts between temperature in Kelvin to noise in . The following parameters are used:
- Temperature in Kelvin
- Noise in
These parameters are related using the following equations:
where is Boltzmann's constant in .
Link Budget
These various tools are combined to produce a link budget tool with the following parameters:
- Frequency, f, entered either directly or using the frequency tool
- Transmit power, P, entered directly, or calculated from transmit EIRP
- Transmit peak gain , entered either directly or using the peak gain tool
- Transmit relative gain , entered either directly or using the offaxis gain tool
- Transmit eirp, EIRP, either entered directly or calculated from or using:
- Free space path loss, , either entered directly or using the pathloss tool
- Other losses, , entered directly
- Receive peak gain , entered either directly or using the peak gain tool
- Receive relative gain , entered either directly or using the offaxis gain tool
- Receive power, C, either entered directly or calculated from EIRP or or using
- Receive noise, , either entered directly or using the noise tool
- Receive , either entered directly or calculated using:
Note that: - If is changed directly the , EIRP and transmit power fields update accordingly
- If the EIRP field is changed directly, the , and transmit power fields update accordingly
- If the transmit power field is changed directly, the EIRP, and , fields update accordingly
- If the field is changed directly the C, EIRP, and transmit fields update accordingly
Acronyms and Abbreviations
| Acronym / Abbreviation | Description |
|---|---|
| 3GPP | 3rd Generation Partnership Project |
| ABW | Allocated Bandwidth |
| AMS | Annual Maintenance and Support |
| BWF | Bandwidth Factor |
| BSS | Broadcast Satellite Service |
| CSV | Comma Separated Values |
| ECI | Earth Centred Inertial |
| EIRP | Equivalent Isotropic Radiated Power |
| EPFD | Equivalent Power Flux Density |
| ETSI | European Telecommunications Standards Institute |
| FDR | Frequency Dependent Rejection |
| FR | Fast Rolloff |
| FS | Fixed Service |
| FSS | Fixed Satellite Service |
| GPS | Global Positioning System |
| GSO | Geostationary Orbit |
| IDWM | ITU Digitised World Map |
| IPR | Intellectual Property Rights |
| ITU | International Telecommunications Union |
| NASA | National Aeronautical and Space Administration |
| NFD | Net Filter Discrimination |
| NGR | National Grid Reference |
| OBW | Occupied Bandwidth |
| PFD | Power Flux Density |
| PtP | Point to Point |
| SES | Satellite Earth Stations |
| SNG | Satellite News Gathering |
| RX | Receive |
| TES | Transportable Earth Station |
| TIA | Telecommunications Industry Association |
| TLE | Two Line Element |
| TVRO | Television Receive Only |
| TX | Transmit |
| UWB | Ultra Wideband |
| VSAT | Very Small Aperture Terminals |
| WRC | World Radiocommunications Conference |
Modules
This document is the Modules User Guide for Visualyse Professional Version 7.
Visualyse Professional Version 7 can be enhanced by one or more of the following modules, namely:
- Define Variable Module, including Monte Carlo analysis
- ITU Digitised World Map (IDWM) Module
- Terrain Module including clutter calculations using land use data
- Traffic Module
This Modules User Guide is to be read in conjunction with the following other documents, namely:
- User Guide: this describes how to use the core Visualyse Professional product
- Technical Annex: gives information about the calculations undertaken by Visualyse Professional
- Tutorial Document: this gives a walk-through of the steps required to create an example simulation
- Maintenance Document: this gives information on changes released under the Annual Maintenance and Support (AMS) service
- Demonstration Files Document: this describes the example files shipped with Visualyse Professional version 7 and gives an indication of the types of simulations it can model
Define Variable Module
Introduction
The Define Variable Module allows you to vary the value of any input parameter of any object during a simulation run. The value can be randomised, taken from a sequence or offset from another object attribute. In addition there are tools to Monte Carlo satellites within a non-GSO constellation and mobile stations within a cell.
Under normal circumstances the value of an object attribute is either fixed for the duration of a run or it is changed internally by the simulation. The Define Variable Module gives you the ability to change or control an attribute’s value as a run progresses.
Within Visualyse Professional this is done by a “Variable Definition”, of which there are six types:
- Monte Carlo: a simulation variable is set by randomly sampling values from a number of distributions including Rayleigh, normal, and log normal
- Offset: a simulation variable is set based upon another simulation variable’s value offset by a fixed amount or ratio
- Event table: the variable is set at each time step using interpolation between points of a table of (value, time)
- Sequence: the variables value for each time step is set explicitly
- Monte Carlo Constellation: the position of all the satellites within a non-GSO constellation are randomised while maintaining their relative positions
- Monte Carlo Mobiles: the positions of mobile stations is randomised within a cell around a base station that can be a circle, square or hexagon
Managing Variable Definitions
Variable Definition objects are part of the simulation, stored in the .sim file, and managed via a list where they can be created, deleted, duplicated, and modified.
The Variable Definition list can be accessed via the “Model” menu option “Variable Definition” or by the toolbar icon: ![]()
Selecting either of these will open the Variable Definition list, as shown below.
From this list, you can add a new Variable Definition, edit or duplicate an existing one or delete one from the list.
If you select add you will be prompted to select the appropriate type of Variable Definition with following dialog:
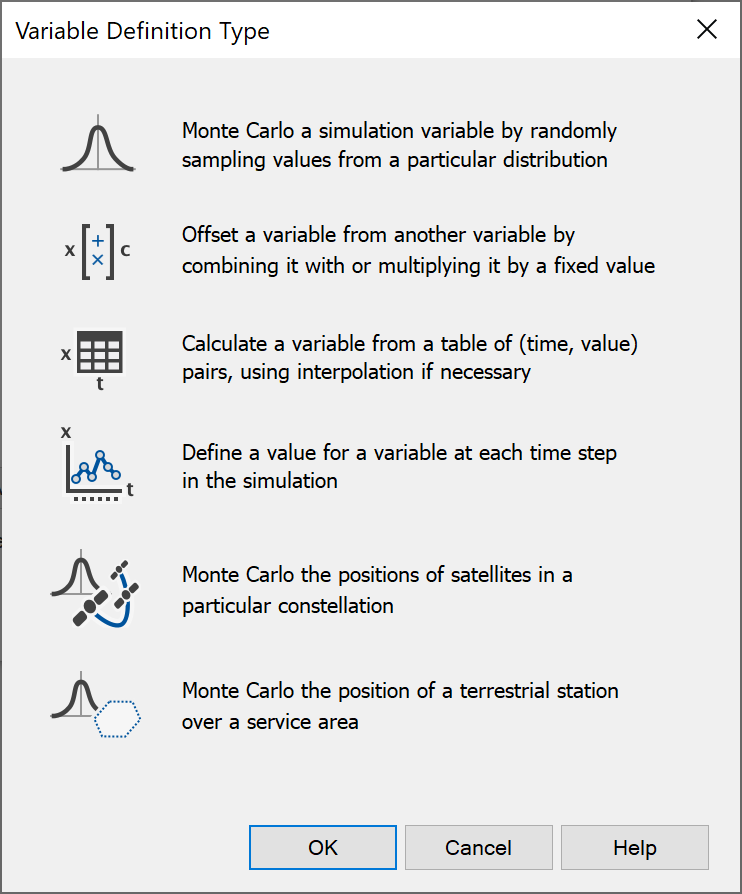
Variable Selection
A key stage in the first four types of Variable Definition is to select the variable that must be modified. This is done using a tree-like selection dialog as in the figure below:
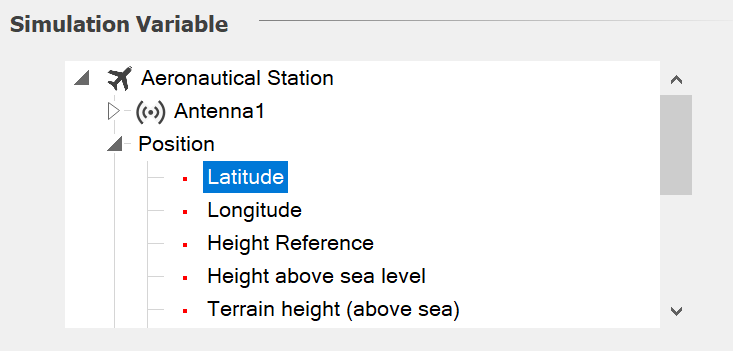
The tree will show all objects within the simulation and their attributes – in this case the simulation shows the aircraft’s position attributes of latitude, longitude and height.
The tree is worth exploring as it’s quite extensive – in particular the variables under the link objects.
For the Monte Carlo, Event List and Sequence Define Variables it is also possible to select all the variables within a group. For example, rather than randomizing the pointing of the antenna of one station, the azimuths of all the antennas in a group of stations can be randomized. This is available for station groups and link groups as the option [all station objects] or [all link objects] as in the figure below:
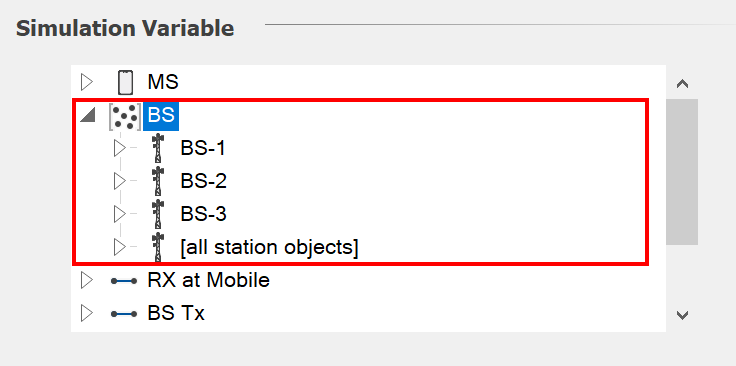
Note that this requires that all stations in the group contain the same set of internal objects and variables. For example, all stations in a group should use the same names for their antennas.
Variable Definitions
Monte Carlo Variable
The value of an object attribute can be changed by randomly sampling from a distribution. This process facilitates the Monte Carlo method of simulation. Sampling is repeated for a number of trials, and the outcomes are tallied in some way to produce the final result.
An example of the Monte Carlo dialog is shown below where the transmit frequency of a link has been randomised to be 800 MHz +/- 10 MHz:
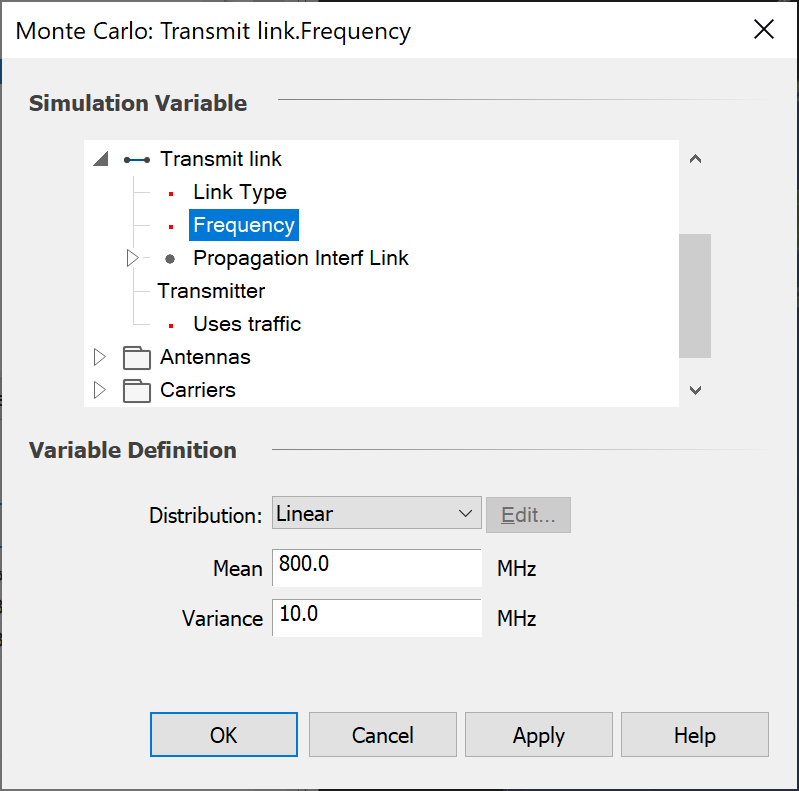
The key stages are:
- Select the parameter to vary
- Select the distribution type as one of: Linear, Triangular, Normal, Poisson, Log Normal, Erlang, Exponential, Gamma, Rayleigh and Table.
- Configure the distribution
The configuration options will depend upon the distribution type selected. For Erlang distributions, you need to specify a mean and k value and for Gamma distributions, alpha and beta will be required.
For Table distributions, click “Edit…”. In the Table Size box, type the number of table entries, and then fill out the table with values and associated probabilities. They can also be pasted in – for example from applications such as Microsoft Excel. When you have finished, click OK.
For all other distribution types, type a mean and variance in the Mean and Variance boxes.
An example of use of the Monte Carlo Define Variable can be found in the example file “AMT vs. Globalstar.SIM” in the “Aeronautical” directory.
Offset Variable
You can vary an object attribute in relation to another object attribute. The target attribute can either be
- A fixed offset from the source attribute
- A multiple of the source attribute.
The offset dialog is shown below.
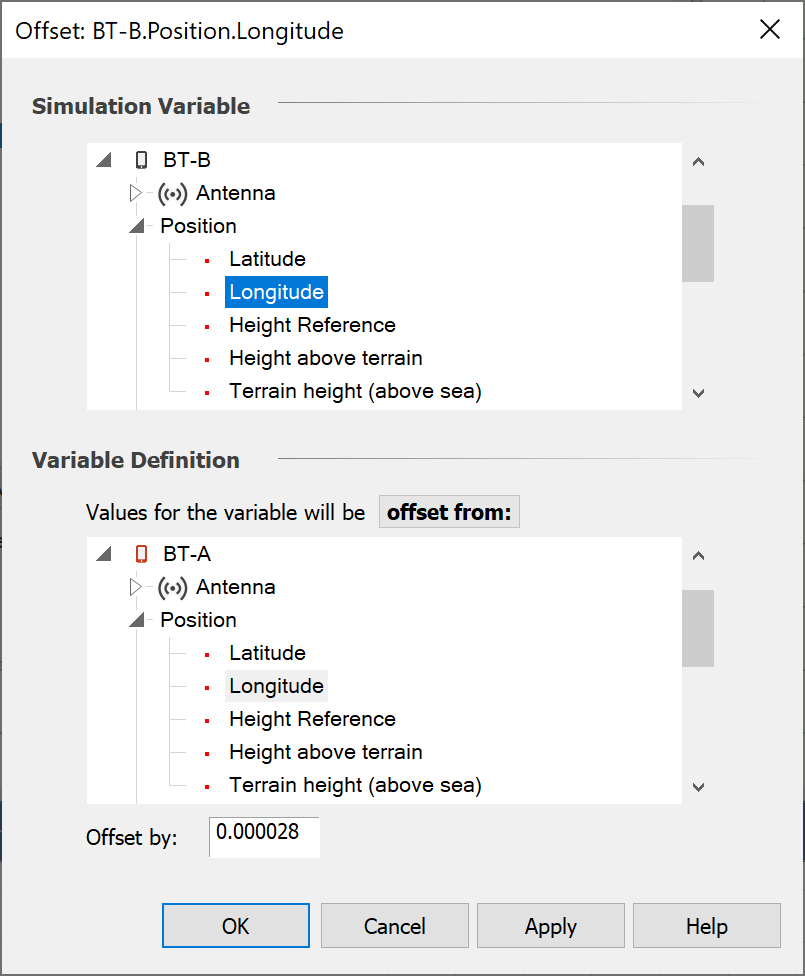
The key stages are:
- Select the parameter to vary
- Select the method as either “offset from” or “multiple of”
- Select the parameter to base the calculation on
- Select the offset amount
The dialog in the figure above comes from the example file “WiFi and BT.SIM” in the “Short Range” directory. It shows how the Offset from Variable Definition can be used to have two Bluetooth devices at a random location but always paired together with the same separation distance.
Event List Variable
An attribute can be made to change at or in between a specified set of simulation times. This is known as varying an object attribute by events.
The dialog is shown in the figure below:
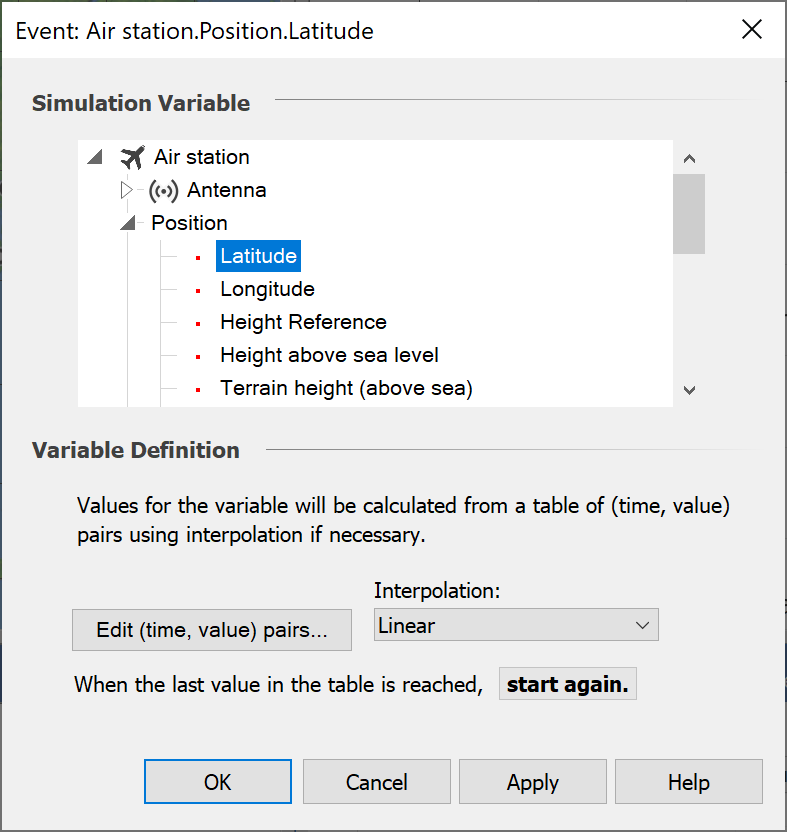
The key stages are:
- Select the parameter to vary
- Enter a table of (time, value) pairs
- Select what interpolation method to use at times between points in the table.
- Select what to do when reach the last time in the table as either “Start Again” or “Use last value”
The table is entered using the standard Visualyse Professional table as in the figure below.
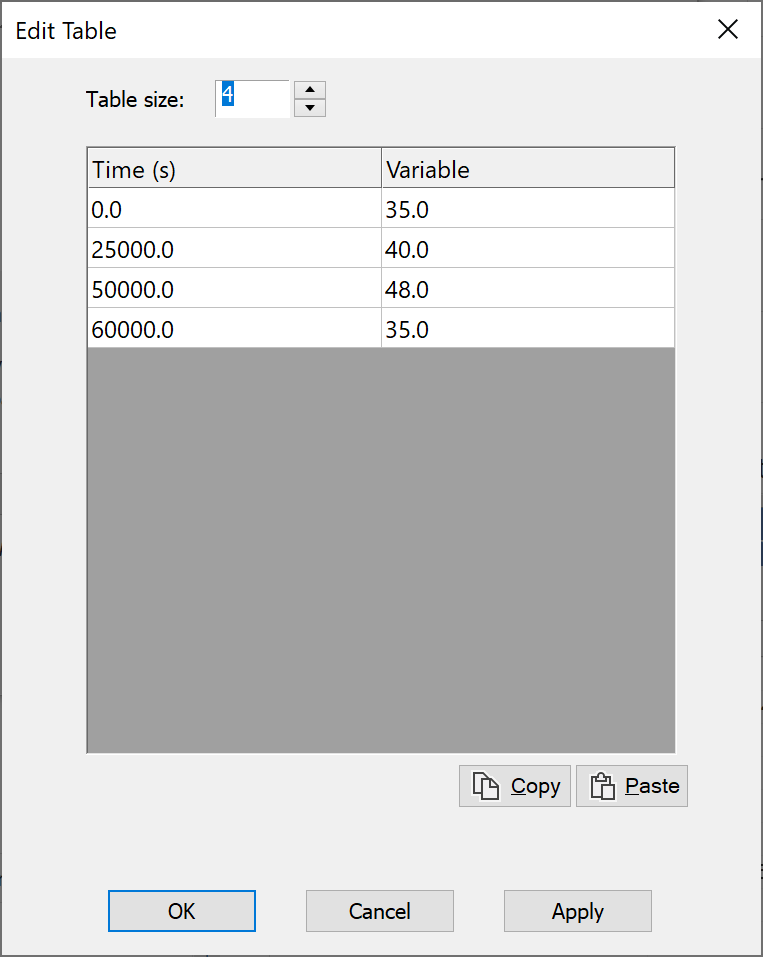
It contains a set of pairs of (time, variable), where time is in seconds since the simulation start and variable is in its own units. A field at the top can be used to change the table size. Note this format allows entries to be easily pasted if created in applications such as Microsoft Excel.
Each event defines a value for the attribute at a point in time. What you need to decide now is how to determine the value of the attribute for times not specified in the event table. This process is known as interpolation and the method is selected using the Interpolation list on the Define Event Variable dialog.
Visualyse Professional provides the following interpolation methods:
- Linear: this is standard linear interpolation. If the required value does not lie in between two entries in the table, the value for the nearest entry is used.
- Linear Extrapolate: this is the same as Linear, except that when the required value does not lie in between two entries in the table, extrapolation outside the bounds of the table is allowed.
- Linear Check Equal: this is the same as Linear. However, if the required value falls between two entries which have the same value then the two previous and two following entries are used to generate two lines which are then used to determine the required value.
- Linear Check Equal Extrapolate: this is a combination of Linear Check Equal and Linear Extrapolate.
- Polynomial: a polynomial is computed from the entries in the table. The interpolated value is then calculated from the polynomial.
- Cubic Spline: a cubic spline is computed from the entries in the table and the interpolated value is calculated from this.
- Largest: when the required value falls between two entries, then the largest value of the two entries is used.
- Smallest: when the required value falls between two entries, then the smallest value of the two entries is used.
If you want the attribute to change only when an event occurs, choose Largest or Smallest. However, if you want the attribute to change steadily from the value at one event to the value at another event, choose one of the other interpolation methods.
The dialog in the figure above comes from the example file “Aircraft with preset track across US and interference from FS.SIM” in the “Aeronautical” directory. It shows how the (latitude, longitude, height) of the aircraft is set via three Define Variables, with way points marking airports and the aircraft flying in a straight line between them.
In examples like this there should be consistency between the (time, latitude) and (time, longitude) arrays to ensure the aircraft speed is constant. This can be achieved using Microsoft Excel to calculate what would be appropriate values to use at each way point.
Sequence Variable
An attribute can be made to change at every time step, using a sequence of values. This could be because the value has been derived external to Visualyse Professional using another tool or even could be measured data.
The dialog is shown in the figure below:
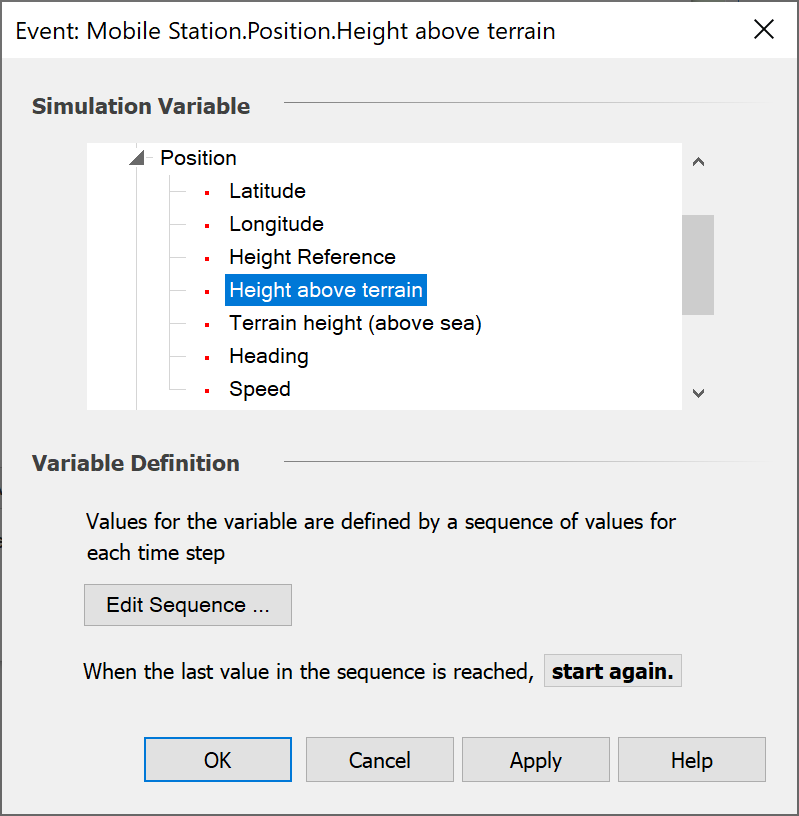
The key stages are:
- Select the parameter to vary
- Enter a table values to use at each time step
- Select what to do when reach the last time in the table as either “Start Again” or “Use last value”
The table is entered using the standard Visualyse Professional table as in the figure below.
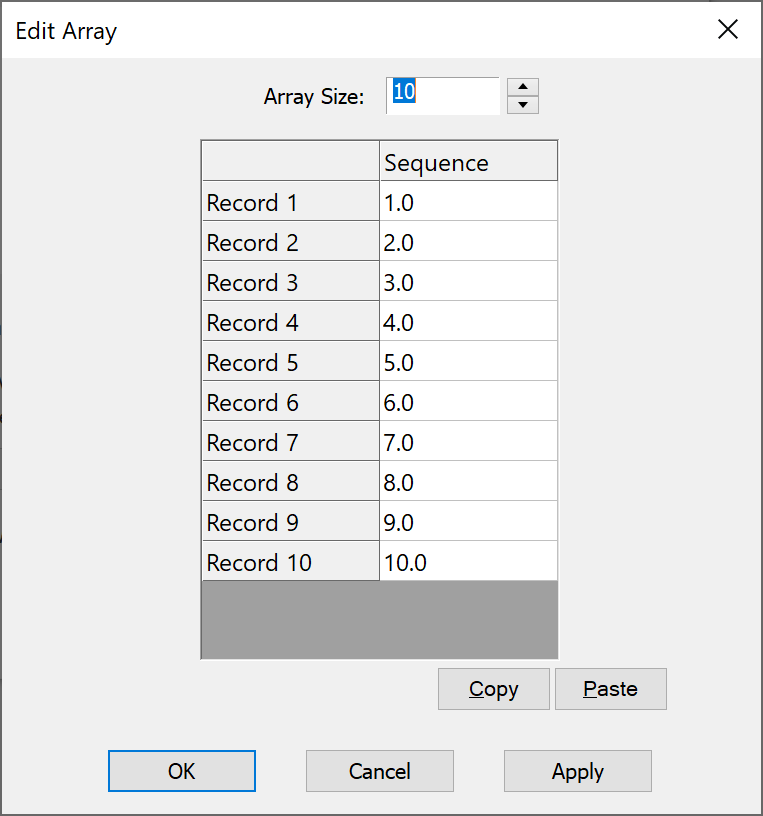
Note this format allows entries to be easily pasted if created in applications such as Microsoft Excel.
Monte Carlo Constellation
Visualyse also provides a special Define Variable object that randomly positions a single satellite or all satellites in a constellation while maintaining consistency of their relative positions.
The figure below gives an example with a 10 satellite constellation at two time samples: the relative positions are the same but the constellation’s start point has been randomised.
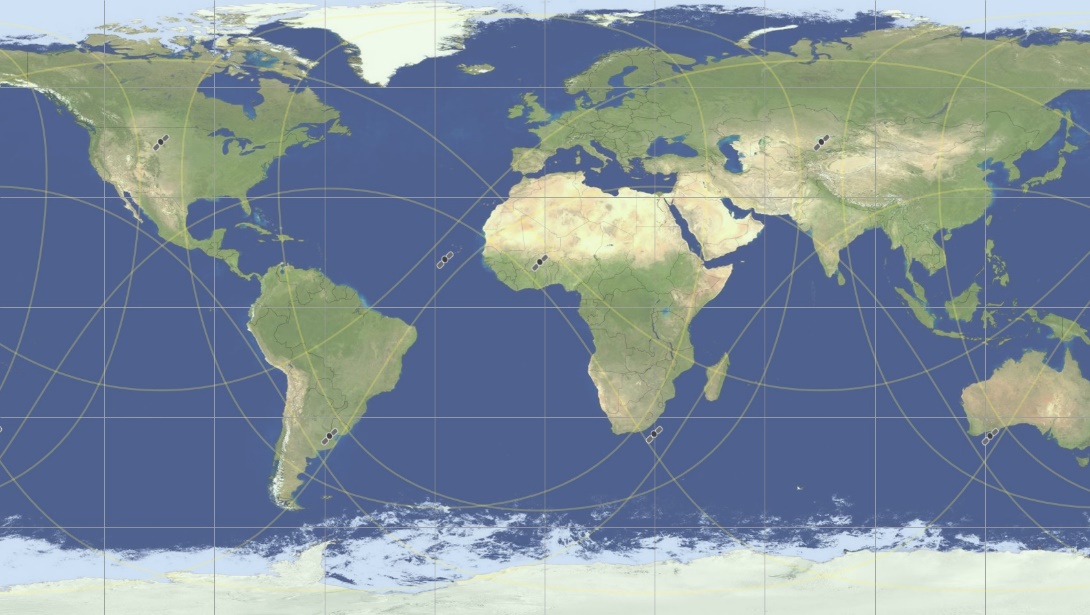
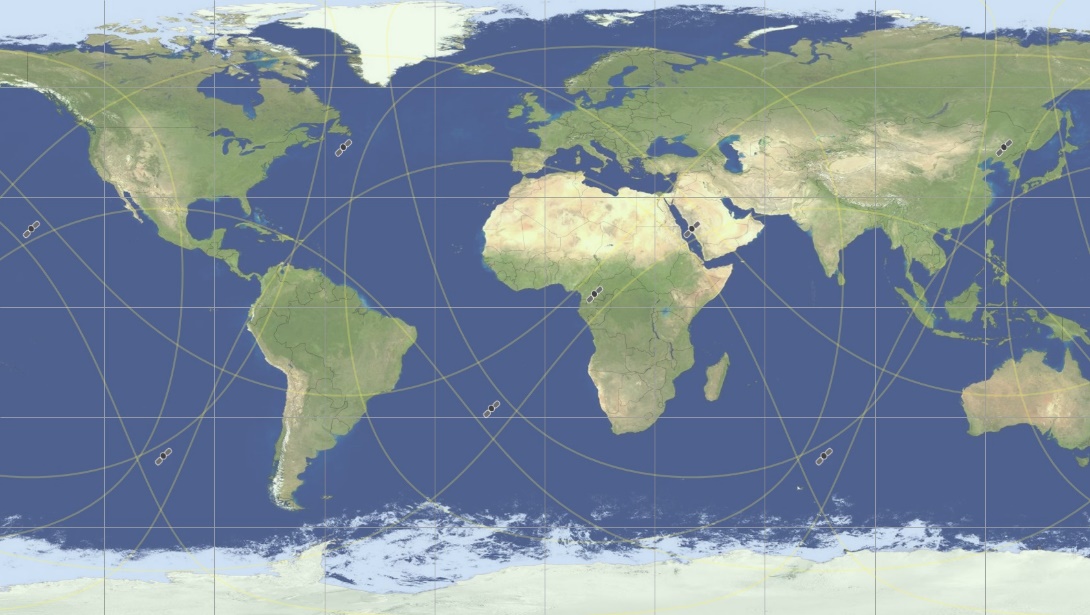
The Monte Carlo methodology is one of two methods that can be used to model non-GSO constellations within Visualyse Professional:
-
Dynamic simulation: the position of the satellites is specified for each time step using orbit predictions based upon start time or epoch time orbit parameters and time from that reference moment.
-
Monte Carlo simulation: the position of the satellites is randomised over the whole potential orbit sphere.
The benefits and disadvantages are shown in the table below.
| Simulation Method | Advantages | Disadvantages |
|---|---|---|
| Dynamic | Intuitive as can see movement of the satellites Can generate statistics of interference event duration and probabilities | Statistics are only valid if run for the appropriate time Can be difficult to work out what the appropriate time is The appropriate time can involve a large number of time steps |
| Monte Carlo | Statistics can be checked for validity as they are generated Statistics for medium percentages of time can be quickly generated | Do not get event length information Less intuitive |
The problem with calculation of run time for dynamic simulations is to ensure that all points on the orbit sphere have been filled to an equal number of times. If a constellation is drifting slowly round the equator then it is necessary to work out exactly how long this will take and stop precisely when it has achieved an integer number of repeats.
These calculations can be done (see Recommendation ITU-R S.1503 for details) but can become complex. Monte Carlo simulations avoid this as the sampling method means the statistic’s validity can be assured to a percentage of time that depends only on the number of samples.
Note it should only be used for circular orbit non-repeating ground track constellations. This is because the Monte Carlo Constellation Define Variable will randomly locate the longitude of ascending node and true anomaly with equal likelihood for all values. For repeating ground track networks, including HEO constellations, this is not the case as the satellite orbits are tuned for specific values to control where the satellites are located.
The Define Monte Carlo Constellation dialog is shown below:
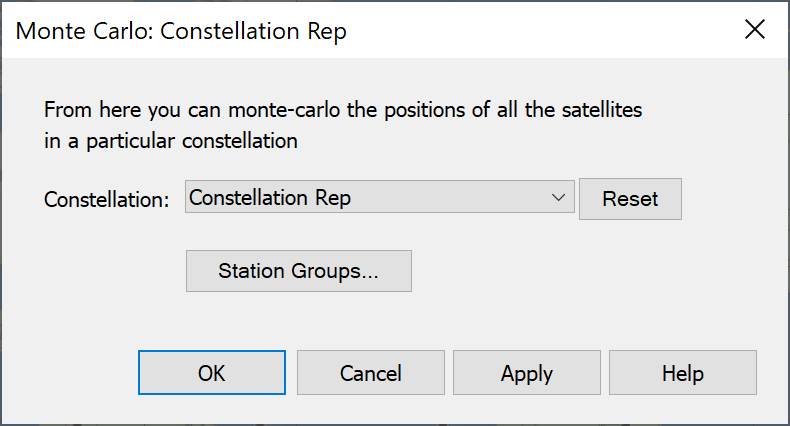
The options are:
- Select a constellation from the list of currently defined groups
- Reset the selected constellation: you will receive a prompt as in the figure below:
It is also possible to go to the station group list to create or edit a constellation.
Note the group can contain a single satellite.
Monte Carlo Mobiles
Visualyse also provides a special Define Variable object that randomly positions mobiles within the cell of a base station.
The Monte Carlo variable option can be used to randomise the latitude and longitude of a mobile. However this has to be configured for each station both coordinates and is by nature limited to rectangular cells.
To simplify the process the Monte Carlo Mobiles option undertakes all the steps necessary to randomise the location of a mobile within a cell, and can model a variety of shapes and locations of the base station (or reference station, as required), as in the figure below where the red dot indicates possible locations of the BS:
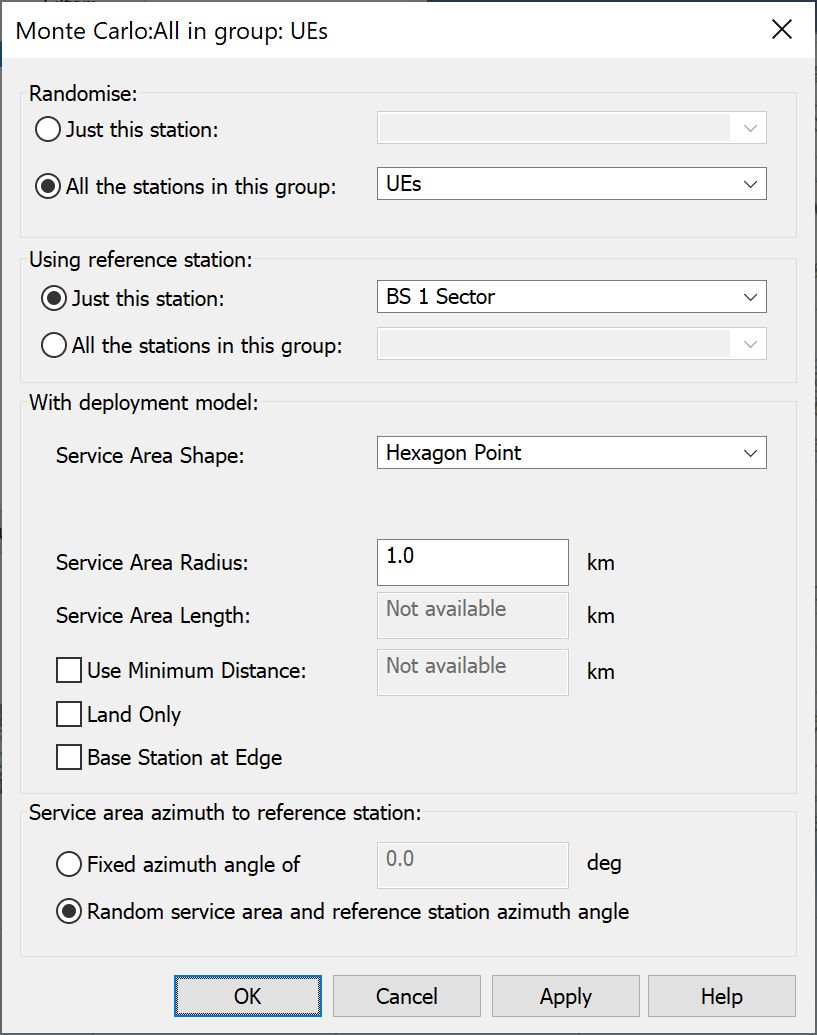
The location of the mobile user is assumed to be equally likely at all points within the cell.
The cell shapes available are:
- Circle, with reference station (RS) at the centre or edge
- Quadrant of circle (a quarter) with RS at the circle centre
- Segment of circle (a third) with RS at the circle centre
- Doughnut defined via inner and outer radius
- Hexagon with point in the direction of azimuth with RS at centre or edge
- Segment of hexagon (a third) with point in the direction of azimuth with RS at hexagon centre
- Hexagon with flat side in the direction of azimuth with RS at centre or edge
- Square with flat side in the direction of azimuth with RS at centre or edge
- Diamond with point in the direction of azimuth with RS at centre or edge
- Rectangle with flat side in the direction of azimuth with RS at centre or edge
- Non-uniform, using the deployment distributions agreed at TG 5-1
The shape can then be rotated around the reference station to the required orientation.
The configuration dialog is shown below:
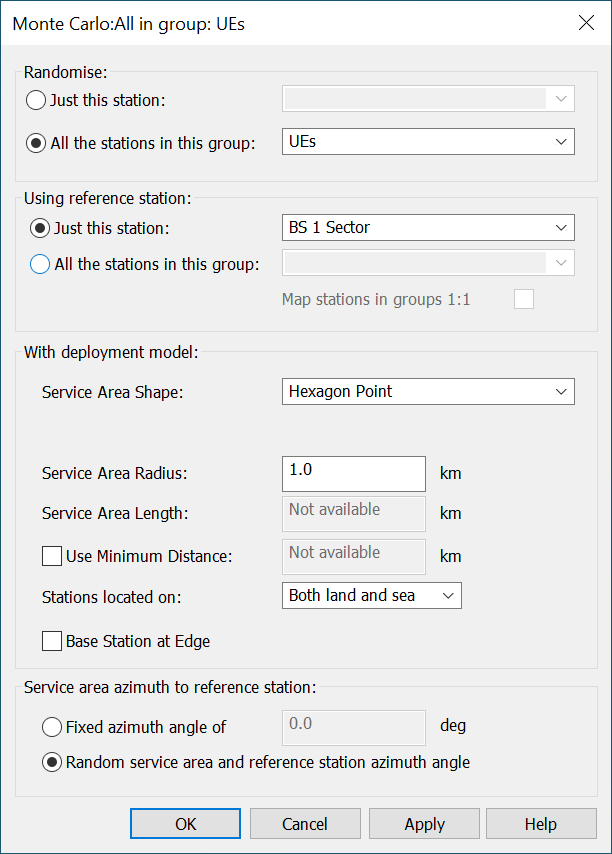
The key stages are:
- Select the mobile or mobiles to randomise. This can be all those stations within a group or just a single station. Note in the former case you can add and remove stations from the group at any stage but the group must exist at the time of creating the Monte Carlo Mobiles
- Select the reference station of the cell: note this must also already exist when creating the Monte Carlo Mobiles
- Select the shape from the list above
- Select the radius of the cell in km (see figure above for definition of radius) or, for the rectangle, the width and length in km. Note that the non-uniform deployment uses the parameters agreed at the ITU so it is necessary to select the environment rather than distances.
- Select, where applicable, whether the reference station is at the edge or centre of the shape
- If required, select additional parameters (Minimum distance and Land Only) as described below.
- Select the azimuth from the reference station to the shape. This can be randomised in which case the antenna of the reference station will also be randomised to ensure the antenna pointing and sector azimuths align. Note only the first antenna of the reference station will be randomised.
The result is a cell with cells distributed at random with different locations at each time step, as in the figures below.
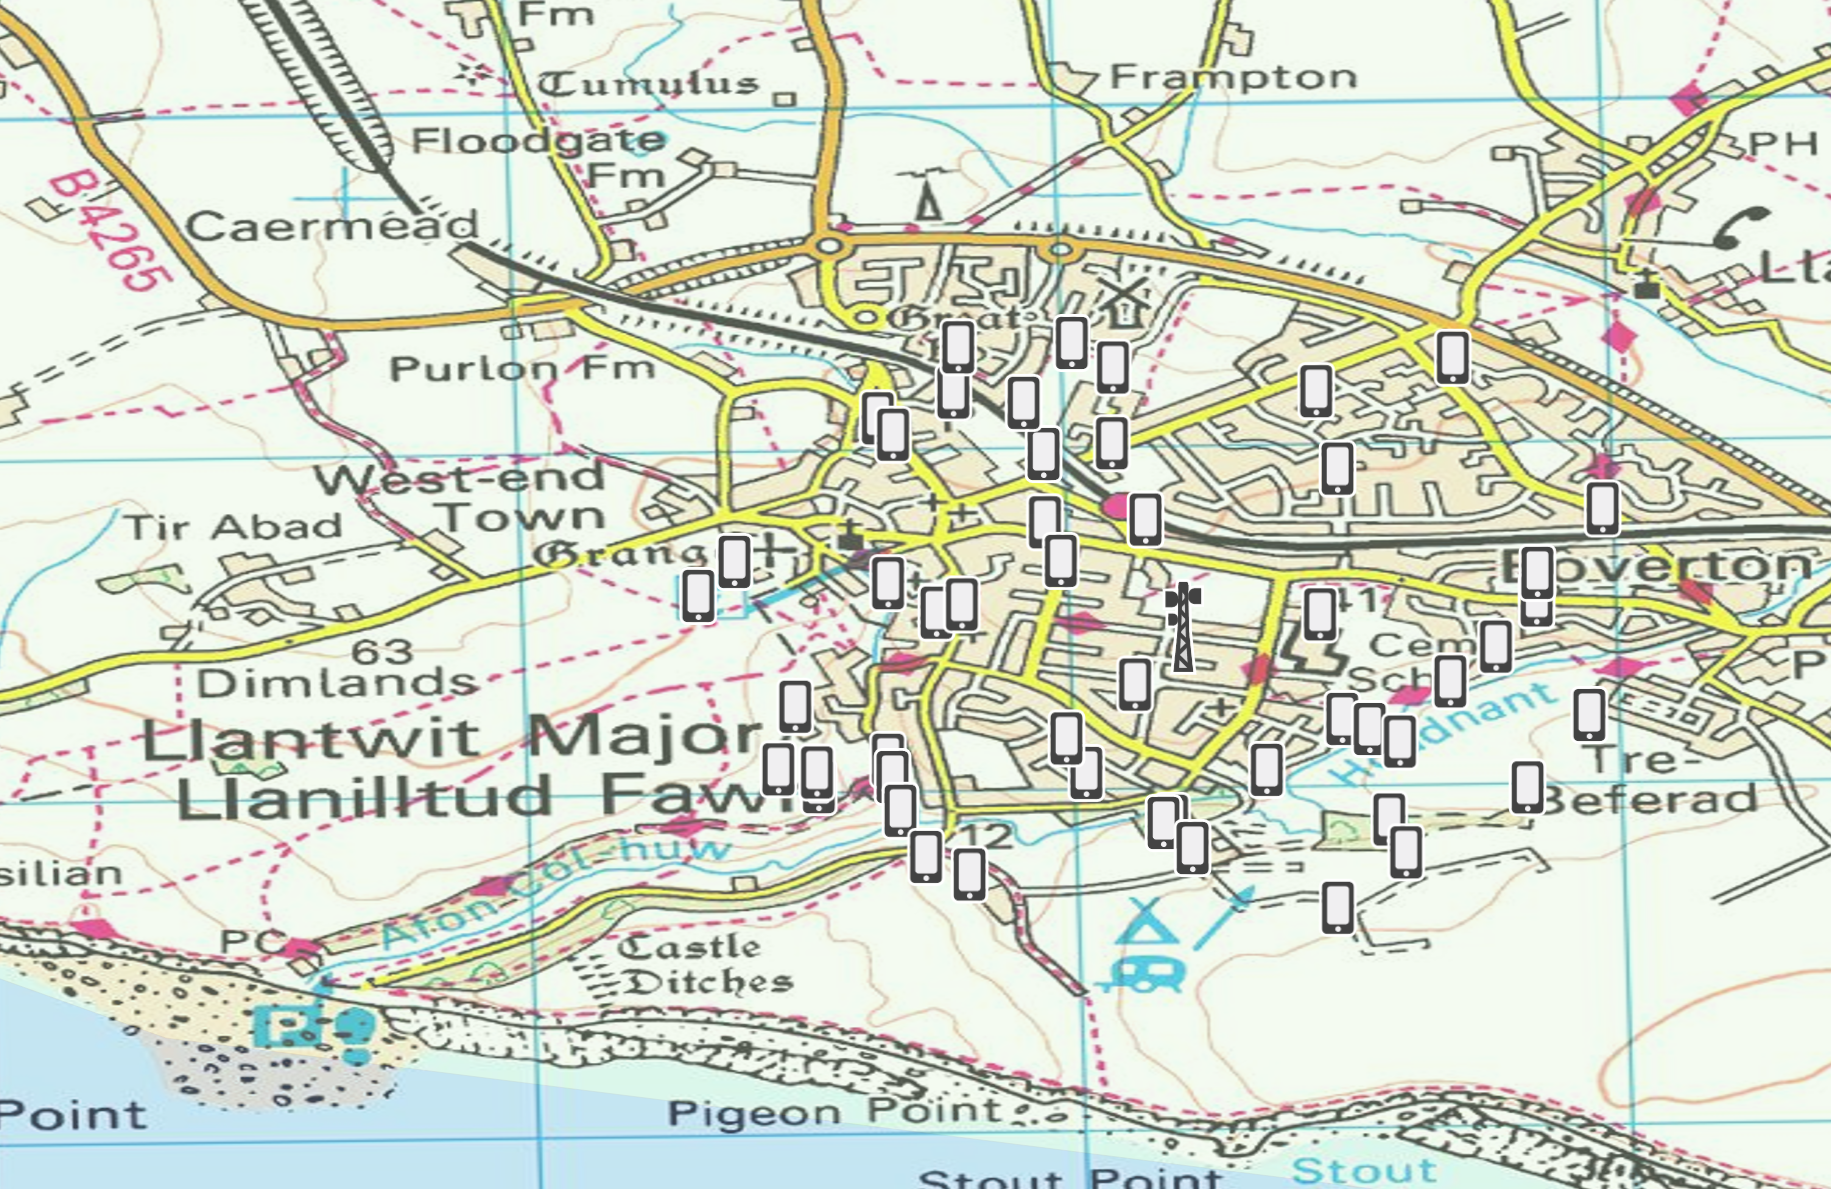 |  |
|---|
Additional options can be used to:
- Enforce a minimum distance between stations, in which case the minimum distance should be entered. For example, if a random deployment of BS is generated, it might be that there should be a minimum separation distance of 100m. Note that Visualyse will make a maximum of 10 attempts to select a location that has the minimum separation distance
- Ensure that the random locations are located on land not sea.
An example of these two options being enabled can be seen in the figures below, with the figure to the left neither option being active, while the figure to the right both are active so that the UEs are deployed on land with at least 100m apart.
 |  |
|---|
A new option (“Map stations in groups 1:1”) allows the position of a group of Stations (e.g. mobiles) to be randomised with respect to another group of Stations (e.g. base stations (BSs)) with a 1:1 mapping. Hence rather than being located a random over the total area of all the reference Stations, which could lead to clusters at some locations and gaps in others, there is always a uniform deployment.
The algorithm loops over each group, so that if there were (say) twice as many stations in the mobile group than the BS group, then there’d be two mobile stations assigned to the service area of each BS, as in the figure below:
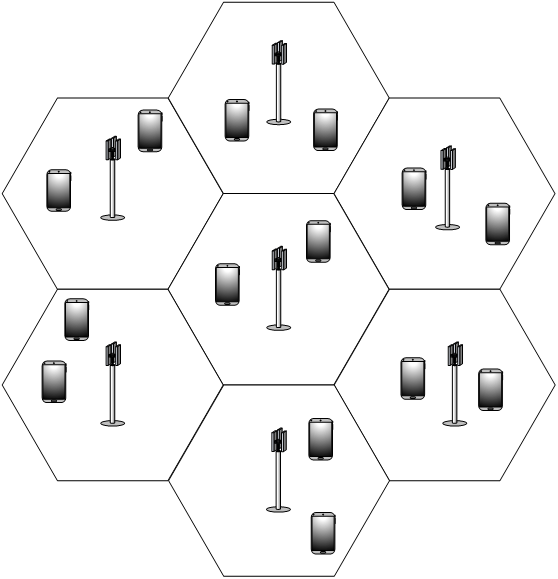
Define Variable Tips
Two tips for using Define Variables within simulations.
Tip 1: Create Define Variables before Duplicating Stations and Links
If you have a define variable of a station object or a link object and you duplicate it, Visualyse Professional will also duplicate the associated Variable Definitions.
Hence you can reduce the work required to define a simulation by creating the Define Variables for one particular station or link before duplicating it.
Tip 2: Using Define Variable to set Propagation Parameters
The propagation environments are not available on the tree of Visualyse Professional objects that is used to select a variable to modify. However the propagation models within each link are available. Hence if you want to use Define Variable on any propagation parameters you must select the link’s advanced option “Override default propagation models” and configure them on a link by link basis.
This can be very useful to:
- To have extra control on how the percentage of time is set (for example to force full correlation of propagation loss on interfering paths or between wanted and interfering paths)
- Define additional random losses – for example Rayleigh fading, indoor – outdoor losses, or any other losses
IDWM Module
Introduction
The IDWM module allows you to use data from the ITU Digitized World Map in your propagation models. This includes information such as distance to coast, path over water and radio climatic data.
Visualyse Professional includes implementations of Recommendation ITU-R P.452, Recommendation ITU-R P.1546, Recommendation ITU-R P.1812, Recommendation ITU-R P.2001, and Appendix S.7, all of which use information that can be extracted from the IDWM.
The IDWM database can also be used in your own programs. Full documentation as provided by the ITU is included in electronic format.
This section describes how information from the IDWM can be used in Visualyse Professional propagation models.
Using IDWM
Recommendation ITU-R P.452
The propagation model in Recommendation ITU-R P.452 is very flexible and can be used for most scenarios where it is necessary to calculate interference between terrestrial stations.
A key parameter of the model is how much of the path is over water, how much over coastal areas, and how much over land. This can be entered by hand if known, but where it is not these can be extracted from IDWM, as in the figure below.
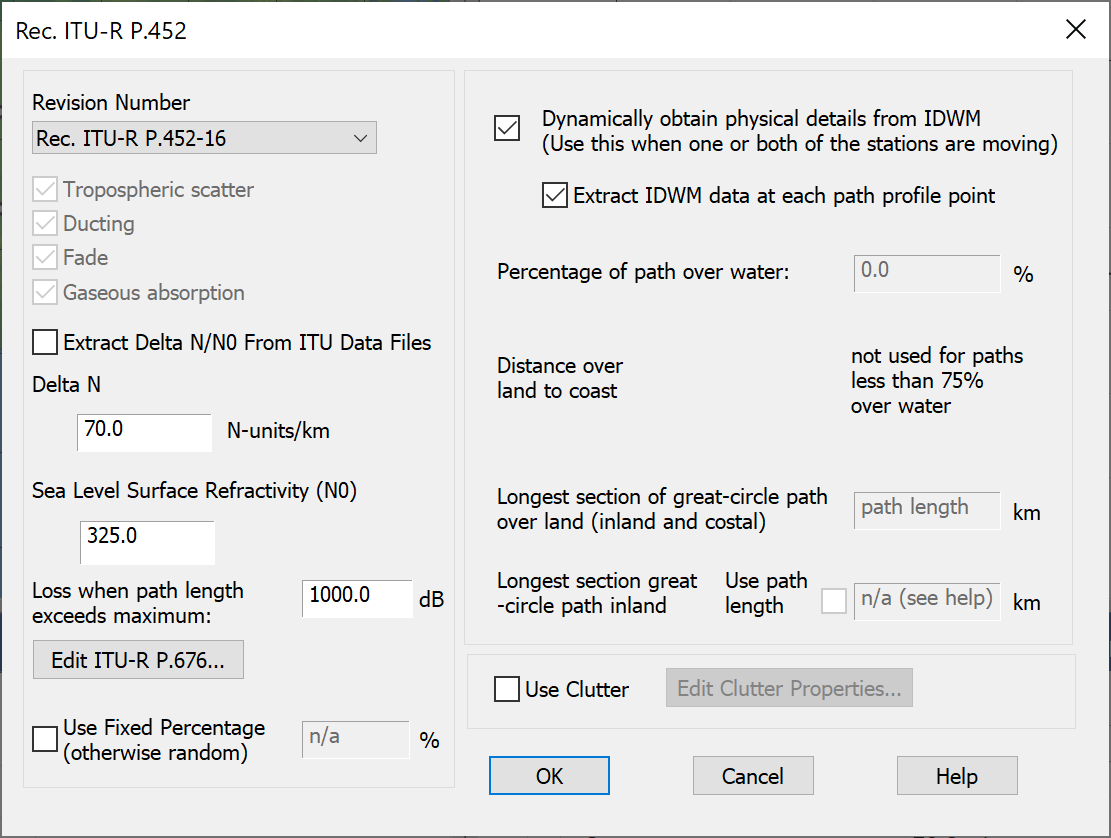
Recommendation ITU-R P.1546
The propagation model in Recommendation ITU-R P.1546 is very powerful and is the basis of broadcasting networks planning. As with Recommendation P.452, a key parameter of the model is how much of the path is over water. This can be entered by hand if known, but where it is not these can be extracted from IDWM, as in the figure below.
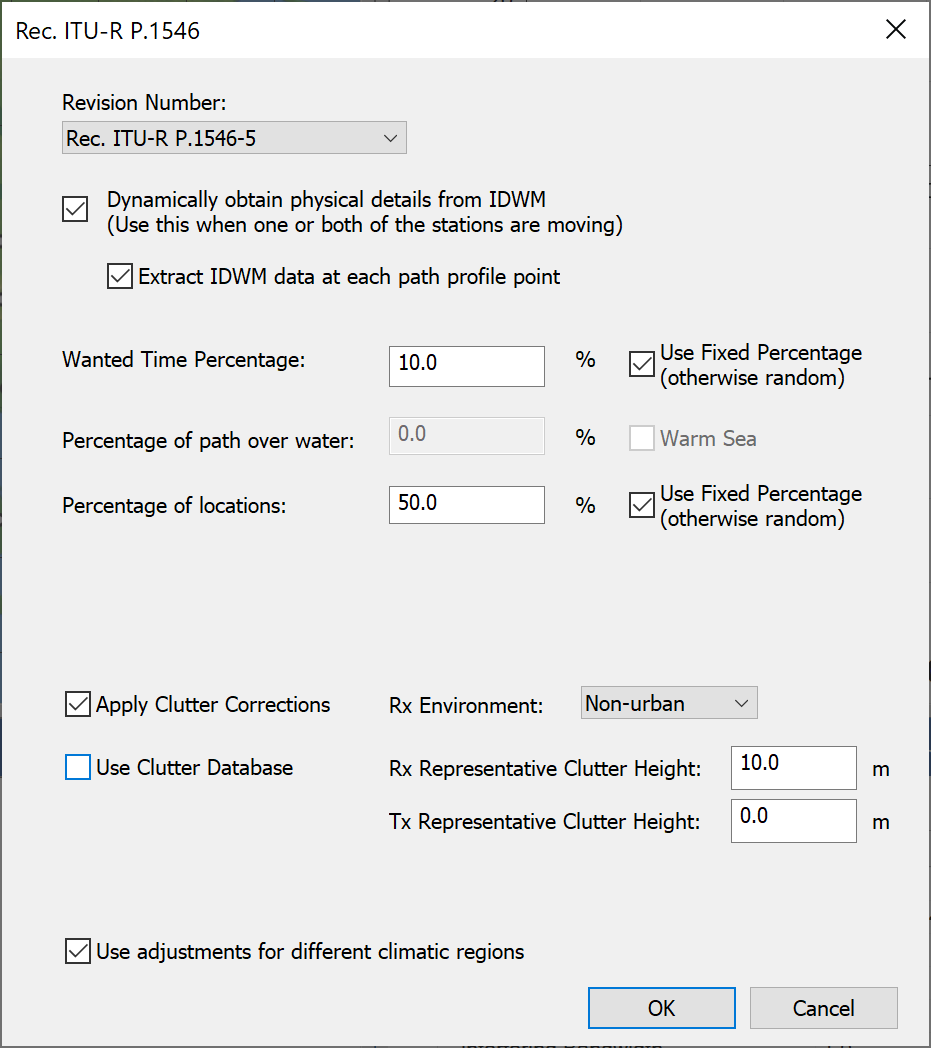
Recommendation ITU-R P.1812
The propagation model in Recommendation ITU-R P.1812 combines aspects of Recs ITU-R P.452 and P.1546, in that it:
- Undertakes path specific analysis using a terrain database in a similar way to Rec. ITU-R P.452
- Includes a location dependent clutter model similar to that in Rec. ITU-R P.1546
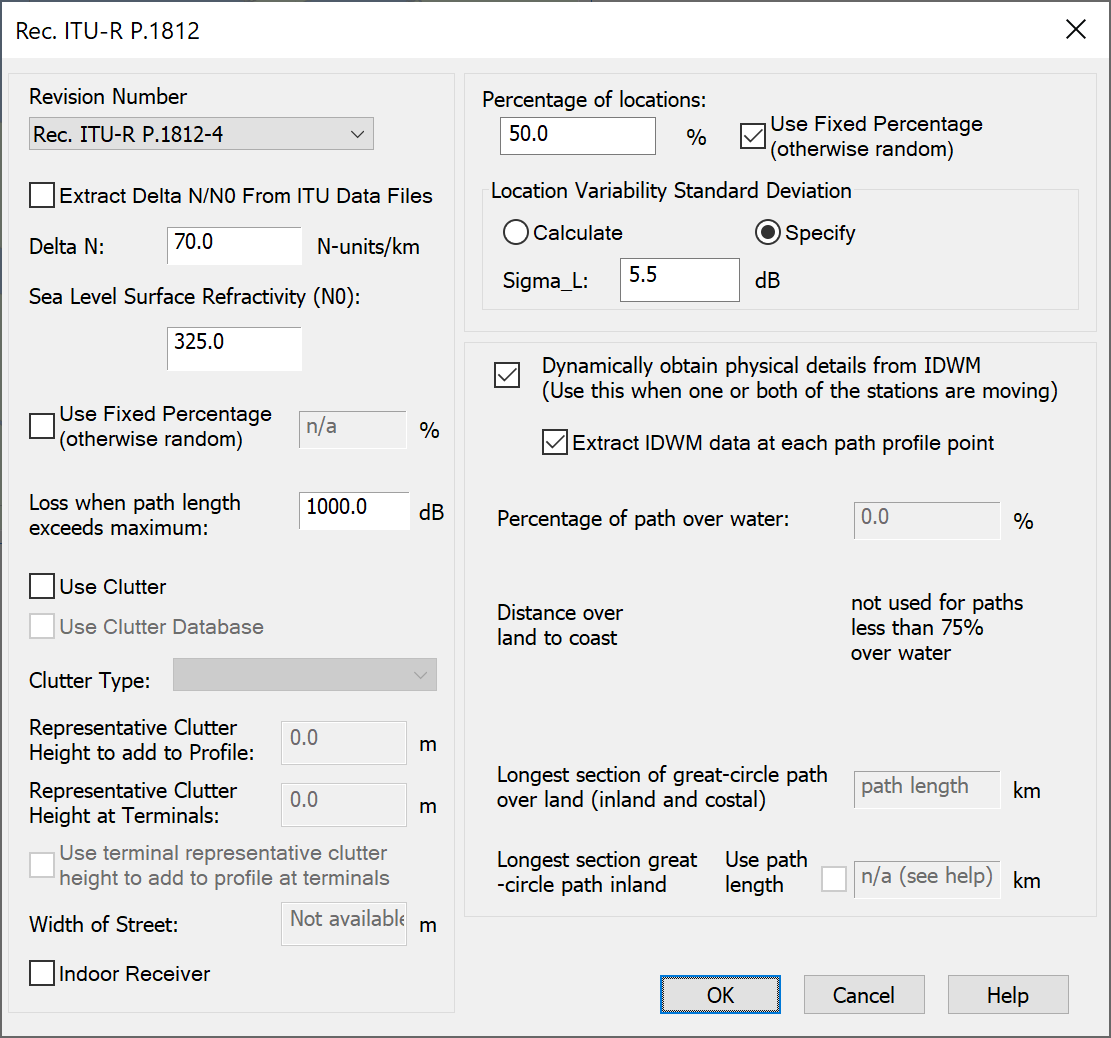
The path analysis part can use IDWM, in a similar way to the Rec. ITU-R P.452.
Recommendation ITU-R P.2001
This Recommendation has similarities with both P.452 and P.1812 in its handling of terrain paths but extends both to cover the full range of percentage of times [0.00001% to 99.99999%].
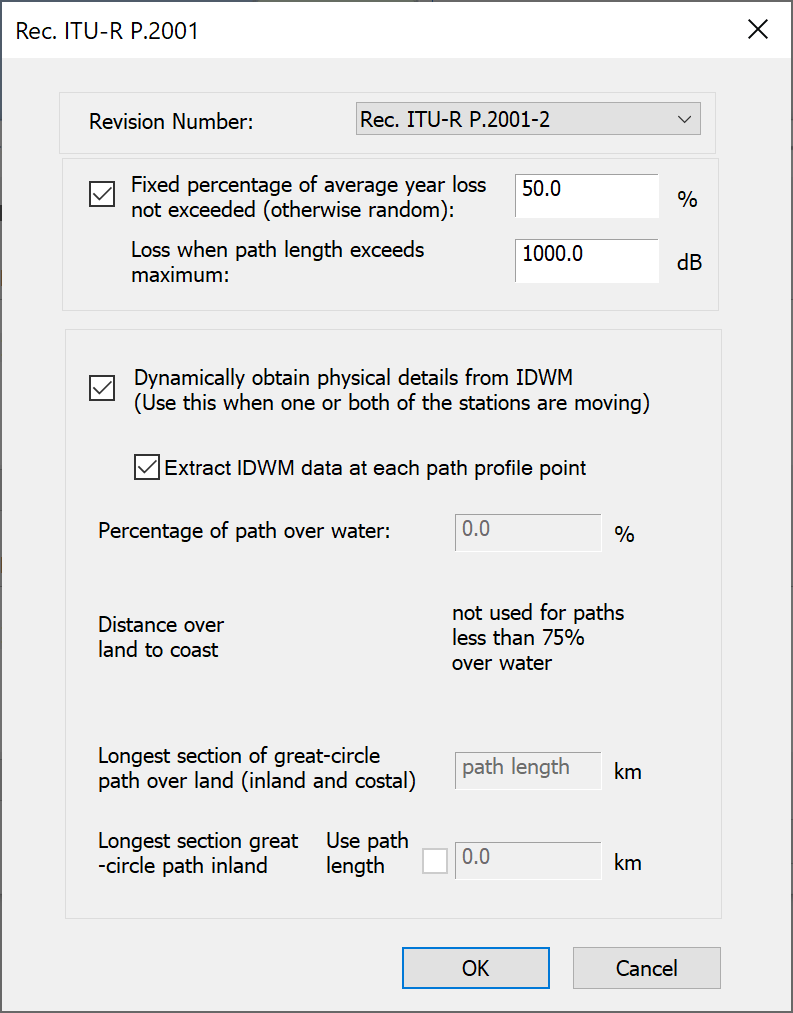
The path analysis part can use IDWM, in a similar way to the Rec. ITU-R P.452.
Appendix S.7
The propagation model in Appendix S.7 of the Radio Regulations can be used to calculate whether coordination is required between stations of the fixed service and satellite earth stations.
This model uses parameters that are within IDWM including:
Mode 1 propagation: Zone (A, B or C)
Mode 2 propagation: Rain rate, rain cell size, water vapour density
If you select these propagation models and you have the IDWM module you have the option for these parameters to be extracted automatically and hence they can vary depending upon location.
The configuration dialogs are shown below.
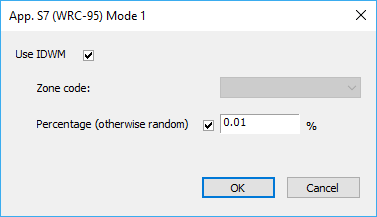
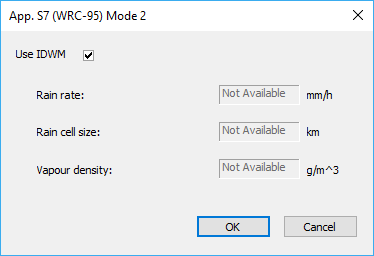
The Appendix S7 Combined model uses all the parameters, as in the figure below.
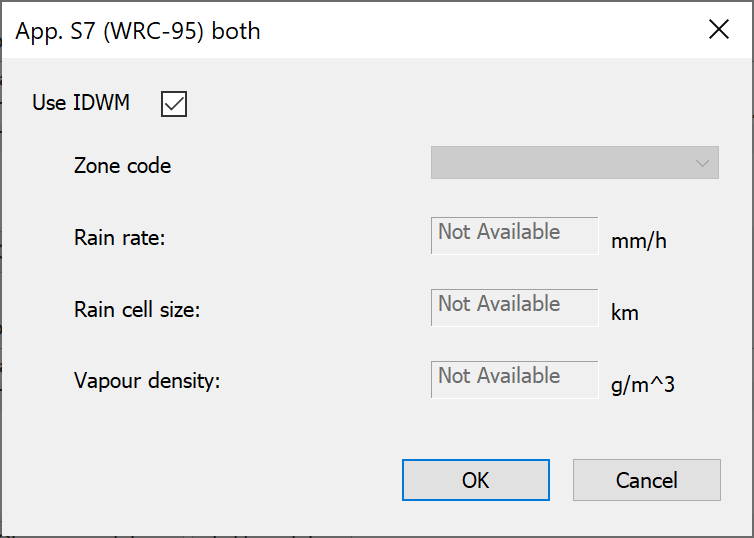
Terrain Module
Introduction
The Terrain Module includes the ability to model the effects of irregular terrain and also the impact of clutter via a land-use database. This section discusses terrain modelling, and the next section Clutter Loss Modelling, but both are part of the Terrain Module.
One of the factors that can influence the strength of a received signal, whether wanted or interfering, is the terrain between the transmitter and the receiver. For example consider the scenario in the figure below.
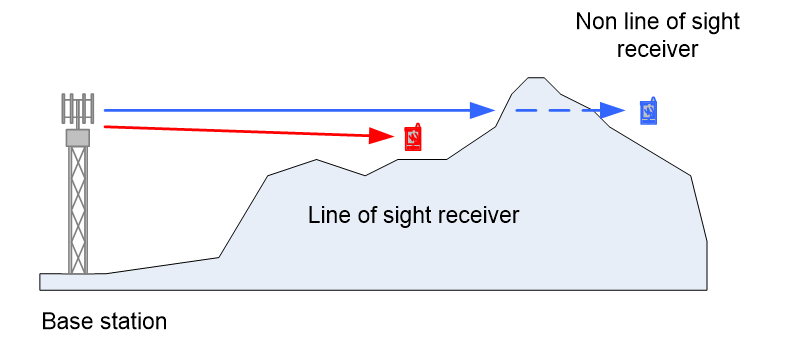
The base station is transmitting to two mobiles: the red one is in line of sight but the blue one is on the other side of a hill and so the signal will be reduced or attenuated due to diffraction loss.
In this and other similar scenarios, the signal received depends upon the terrain characteristics along the path from the transmitter.
In Visualyse Professional Version 7, terrain modelling can be included via:
- The ability to read a database that contains spot heights on a grid of points, the terrain database
- Extraction from this database of path profiles – a series of spot heights that describes a slice through the terrain between a transmitter and receiver
- Propagation models that use the path profile to calculate path loss between the transmitter and the receiver
The result of using terrain is a more realistic modelling, where the coverage of a transmitter takes accounts of the hills and plains, as in the figure below.
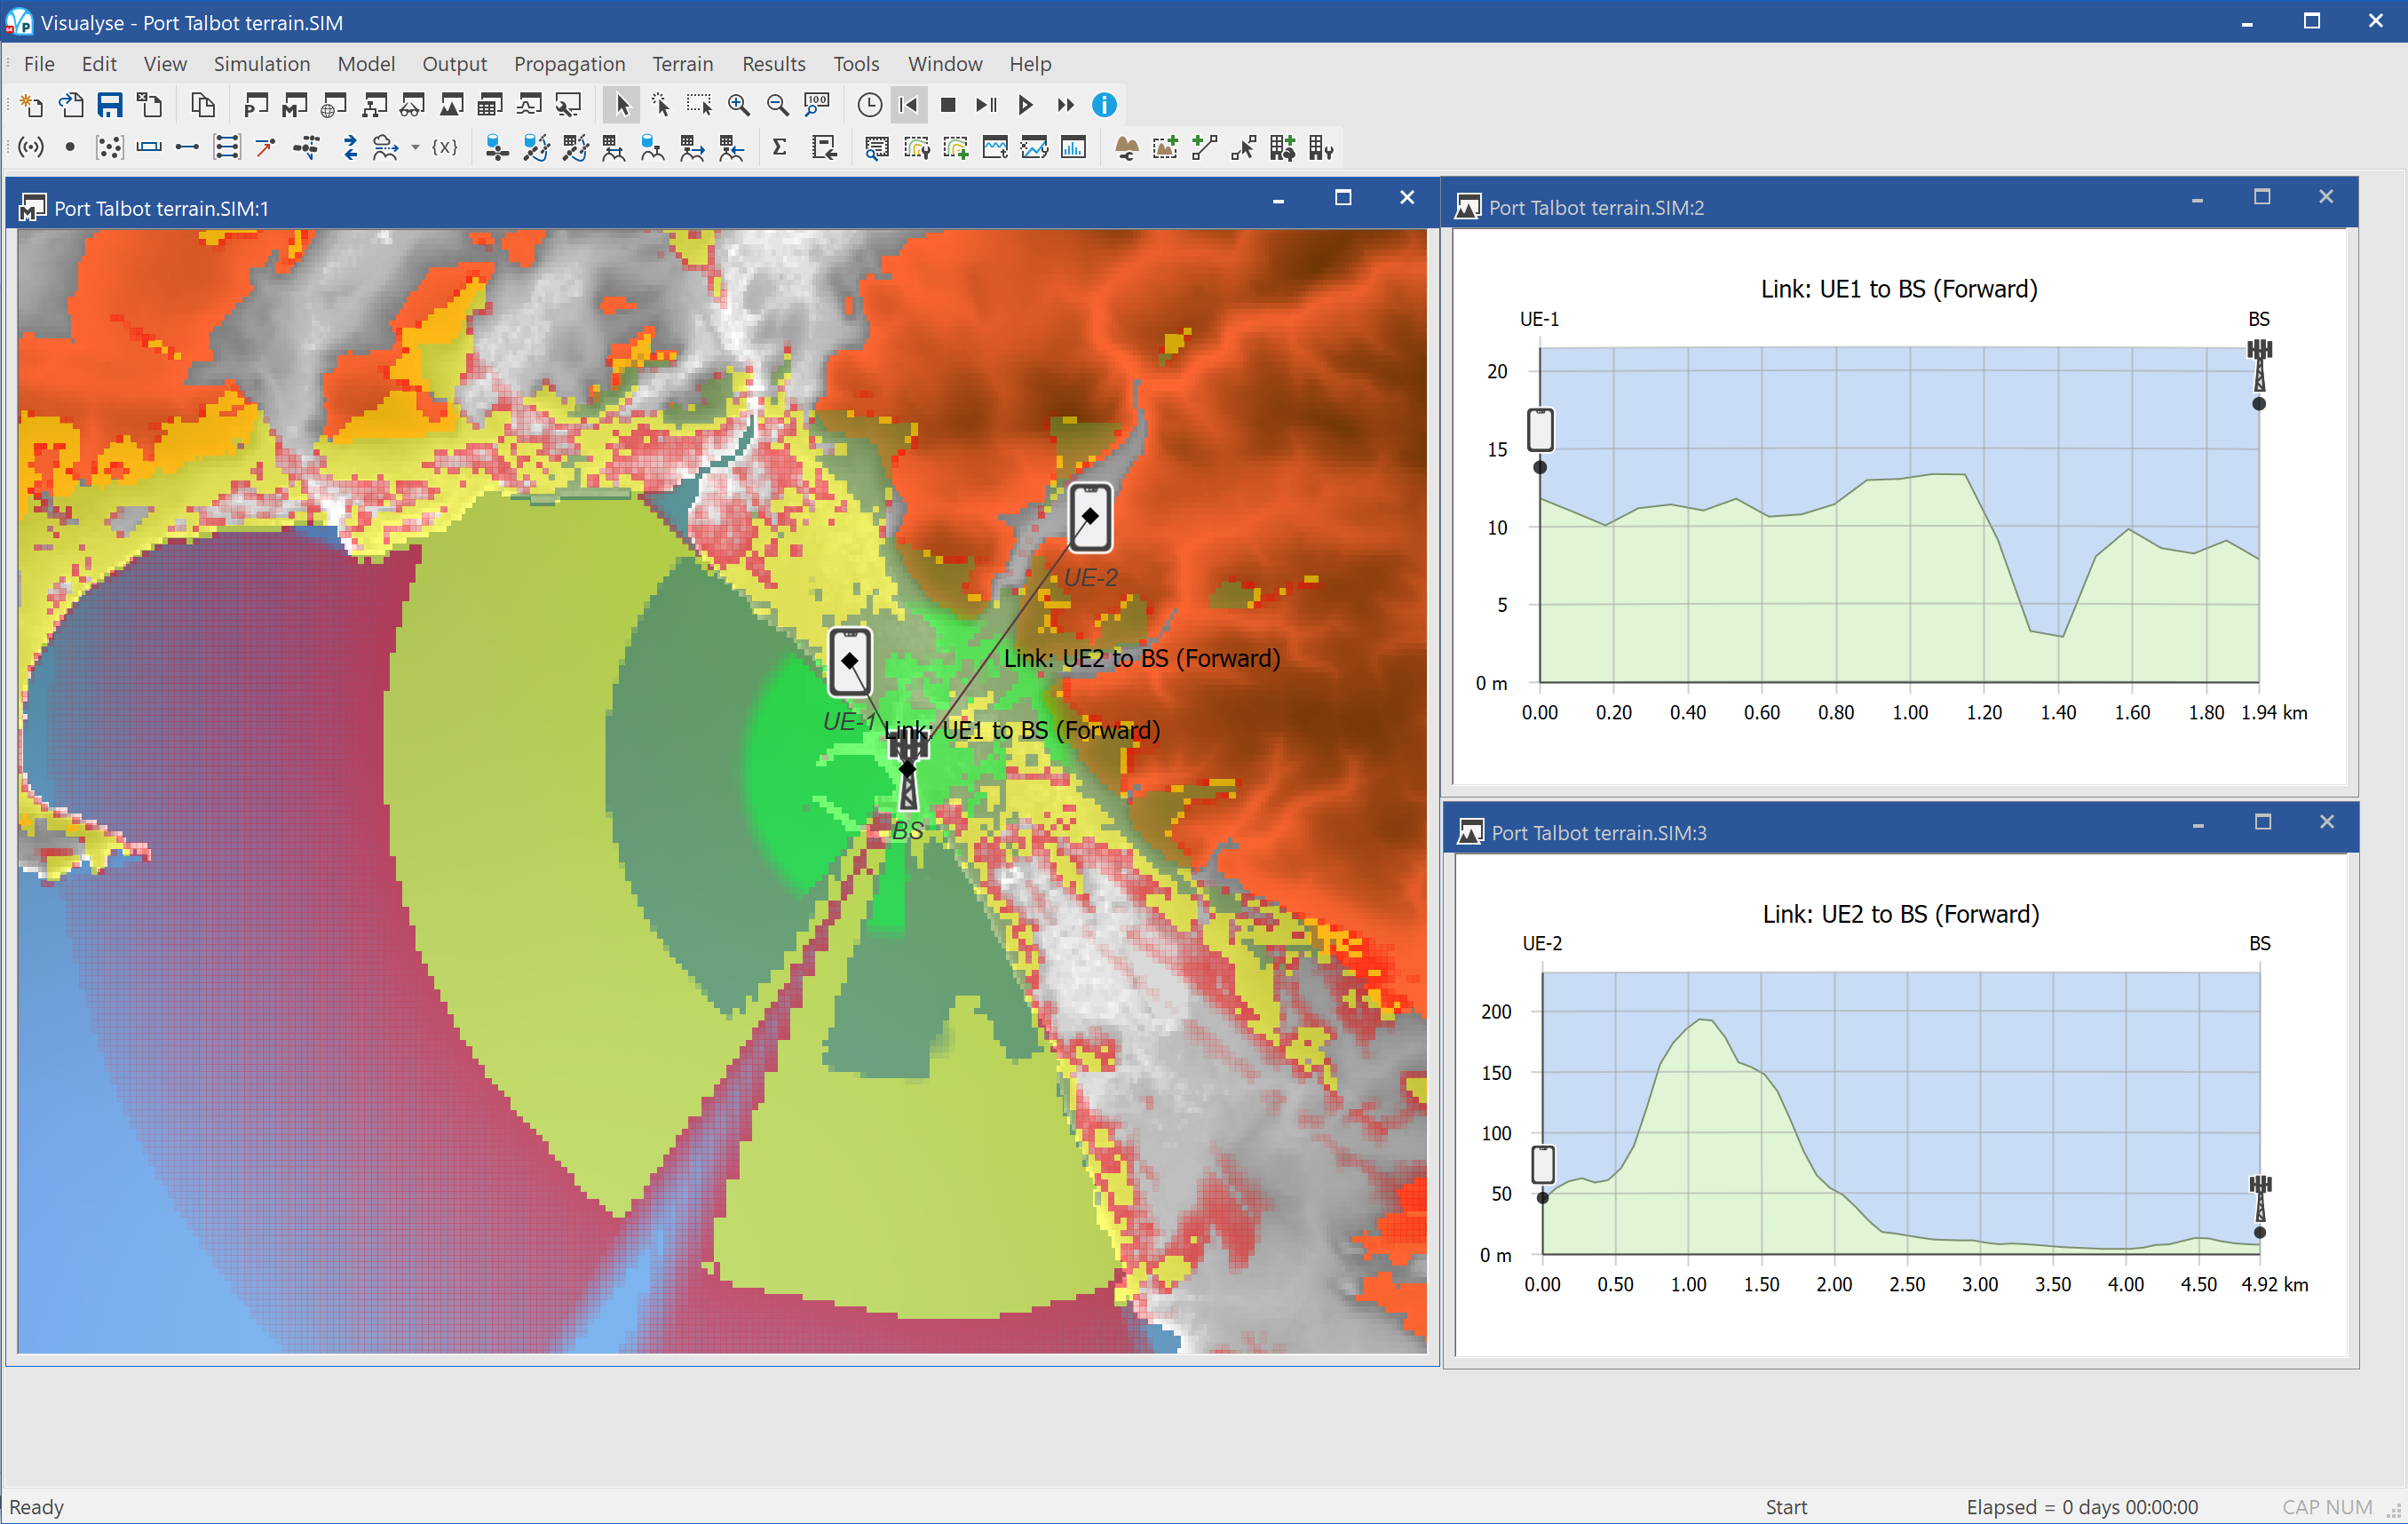
This example shows coverage of a base station in a coastal region with green the strongest signal, yellow medium and red the weakest. The signal can be seen to propagate out to sea best, less well along the coastline and is stopped by the hills inland. The terrain has been colour coded grey for low areas and brown for high areas. On the right are two windows showing path profiles through the terrain: the upper one is mostly flat and along the coast while the lower is into the hills.
The impact can also be seen by viewing the same coverage prediction exported to Google Earth (as described in the main User Guide), as in the figure below.
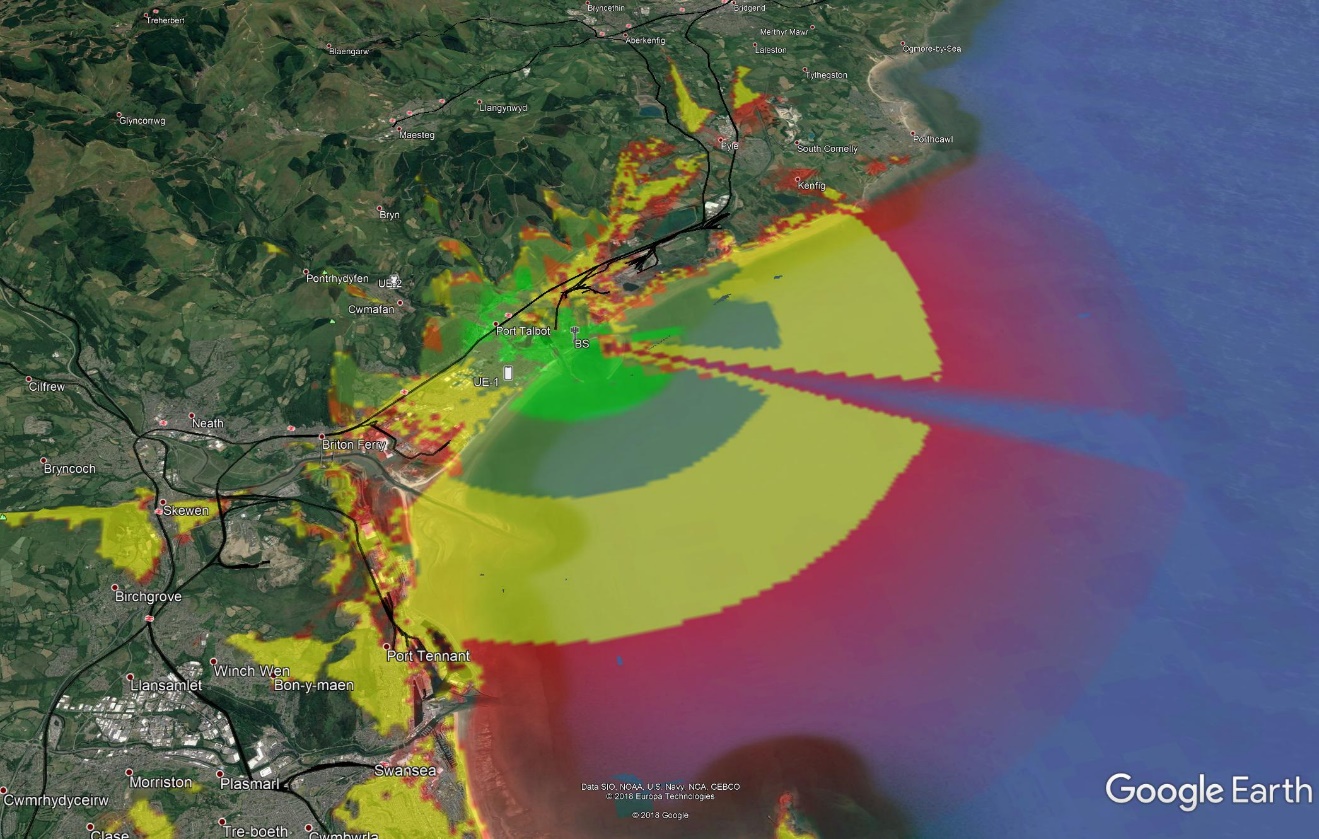
Terrain Features in Visualyse Professional
To include terrain modelling in Visualyse Professional you need to be aware of all the various components and where they can be found on the menus. This section gives an overview of all terrain related features in Visualyse Professional.
Terrain Database Interface
The starting point for using terrain is to configure the interface from Visualyse Professional to one or more sources of terrain data. This can be found on the “File” menu under “Terrain Settings” and is described in more detail in the Terrain Database Interface section.
Loading Terrain Regions
When Visualyse Professional has been configured to interface to one or more topographic databases, it must then be told whether to load the data and over what geographic area – what we call a Terrain Region.
This can be done by one of the following ways:
- Selecting “New Terrain Region” from the “Terrain Menu” and then interactively using the mouse to identify the area required
- Opening up the Terrain Region Manager, also on the “Terrain Menu” and then explicitly defining the new region of interest
- Selecting the toolbar cursor option “New Terrain Region” and then interactively using the mouse to identify the area required
More information is given in the Terrain Database Interface section.
Propagation Models
With terrain data loaded it can be used within link calculations via the propagation model, either selected via one of the propagation environments or via a link specific propagation model. The heights and path profiles can be used within the following models:
- Recommendation ITU-R P.452
- Recommendation ITU-R P.526
- Recommendation ITU-R P.1546
- Recommendation ITU-R P.1812
- Recommendation ITU-R P.2001
- Longley-Rice
More information on the use of terrain within propagation model is given in Using Terrain Data.
Path Profiles
A key parameter in the calculation of propagation loss due to terrain is the path profile resolution. The value used in the current simulation can be found under the “Terrain” menu option “Path profile settings…” while the default values to use for new simulations can be set via the “File” menu option “Terrain settings…” More information on path profile settings is given in Changing the Path Profile Defaults.
Path profiles can also be displayed on a special view and configured to select the path of interest. More information on the path profile window is given in Path Profiles.
Watch Window
The resulting path loss calculated using the propagation model and the terrain data can be seen in the watch window along with the other propagation loss fields and will be included in the received signal strength calculation (whether wanted or interfering).
Maps and 3D View
The terrain data can be displayed graphically on the Plate Carree and Mercator maps, and also on the 3D View. A translation between spot heights and colours can be created and so the terrain shown as one of the overlays found under the View Properties dialog. The terrain data overlay can be configured like any of the other overlays, including:
- Changing display order
- Changing transparency level
- Changing tint colour
The colour to use for terrain data for the current simulation is set via the “Terrain” menu option “Terrain Colours….”, while the default colours to use can be set via the “File” menu option “Terrain settings” option.
More information is given in Showing Terrain Data.
Availability and Types of Terrain Data
A number of sources of terrain data are available and they can have significantly different characteristics. These are arranged in a grid of spot heights, where the grid can be aligned with lines of latitude and longitude, or with a local reference frame, such as in the UK the National Grid.
The first and most important characteristic is the resolution of the terrain data. This is the spacing between the spot heights and the higher the resolution (i.e. the smaller the distance between samples) the better.
For example consider the following two figures which show the topography around London using different resolution terrain databases. For comparison with later figures, the circle shows the location of London’s Docklands and the grid lines are spaced every 10km. In addition all use the same colour scheme.
GTOPO30: a 30 arc second i.e. 900m terrain database:
Ordnance Survey terrain data, sampled every 50m:
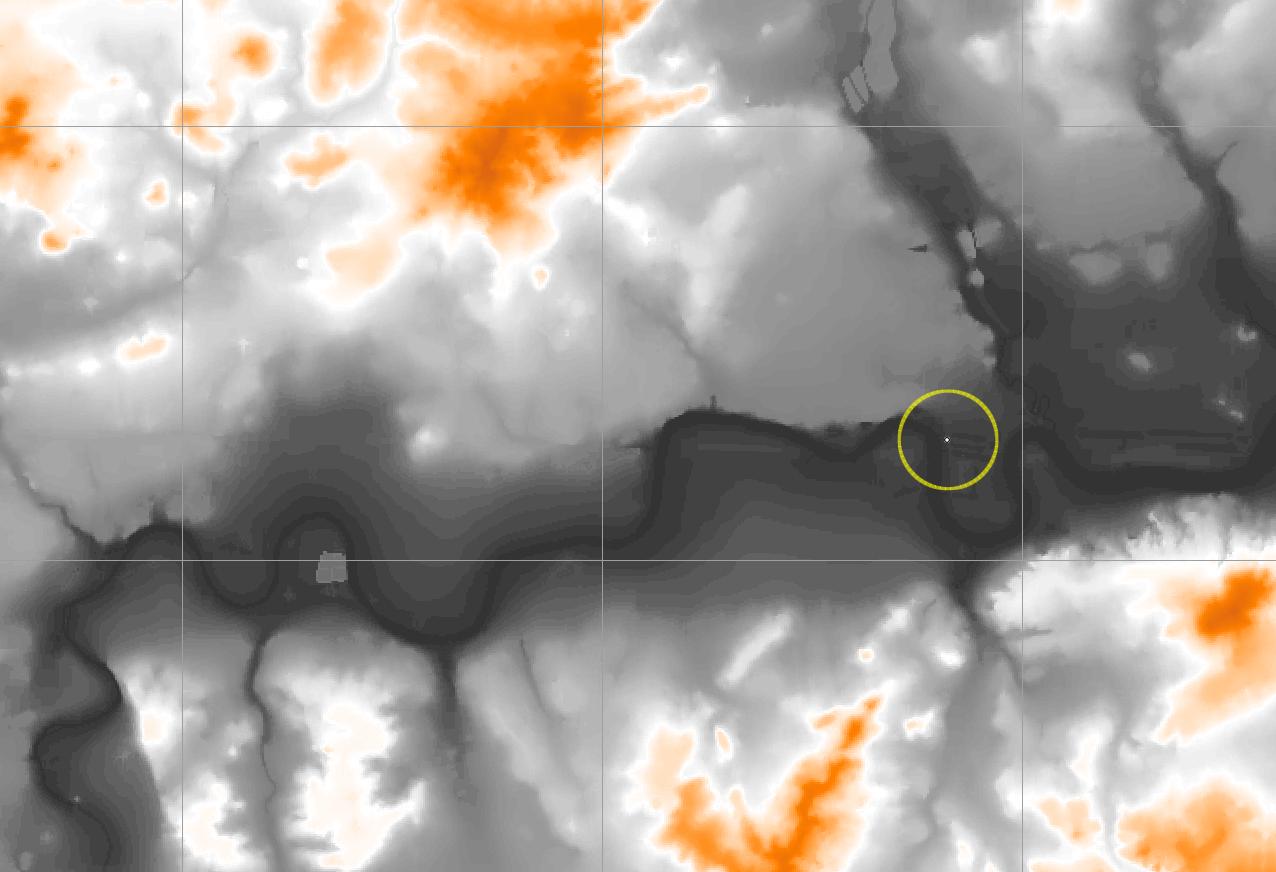
It can be seen that the latter is much higher resolution and would give much more accurate predictions!
However the higher resolution data also requires significantly greater memory and so for analysis over large areas it can be better to use the lower resolution data, or to use high resolution data only for around the transmit and receive sites.
Another difference to be aware of is between terrain and surface data. The figure below uses a surface database taken by radar measurements from a Space Shuttle mission. It contains measurements of where the radar waves are reflected, which could be terrain but also be from structures like buildings sitting on the terrain. This data is freely available and can be downloaded from various websites.
SRTM Surface Database, sampled every 3 arc seconds i.e. 90m:
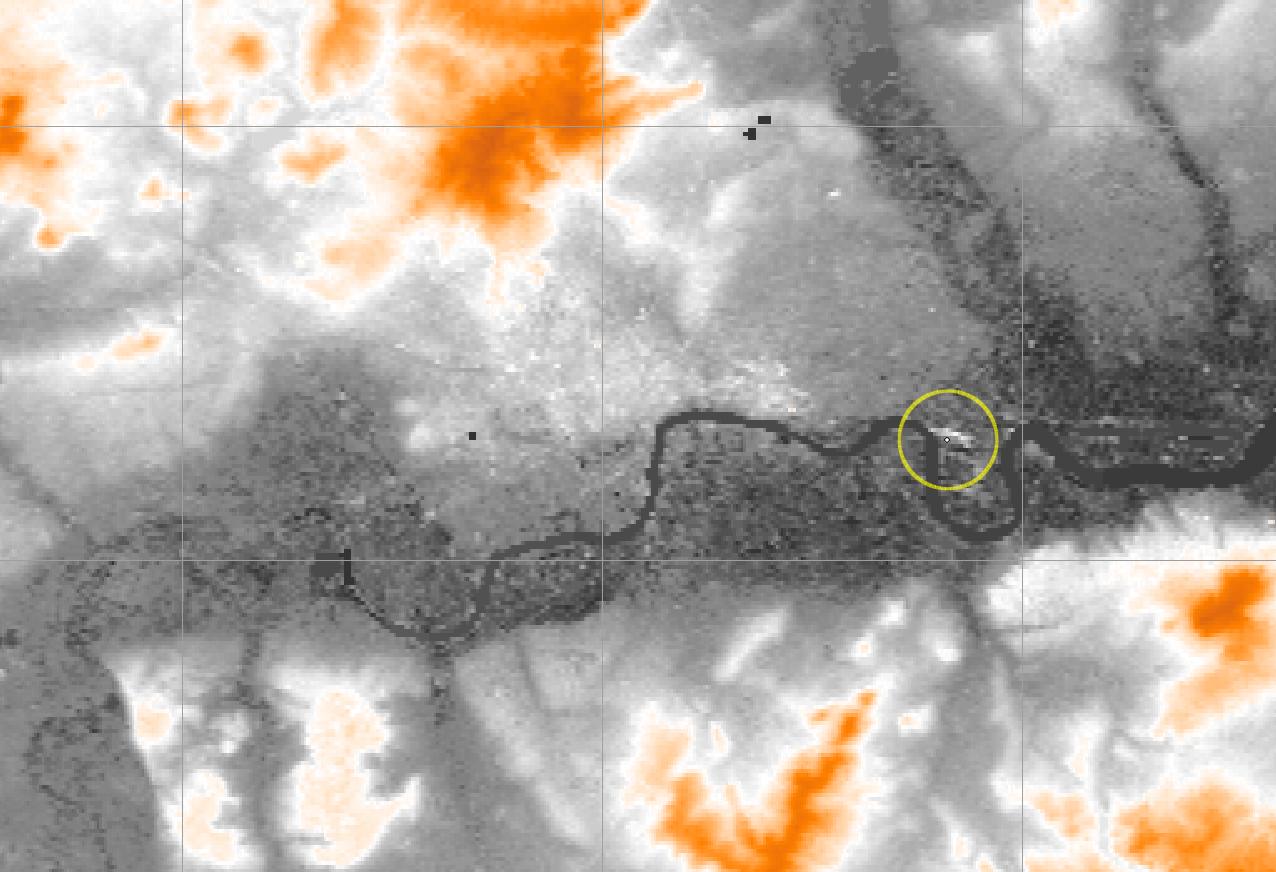
Additional features can be seen which include roads, railways, and buildings. The circled feature is the Docklands development to the east of London. It can be seen that there are structures in white, which are the large office towers, which are not shown in the previous OS database, which excludes surface objects like buildings.
Using surface data can improve the accuracy of predictions as the radio waves will actually propagate over the surface rather than the terrain. However to significantly improve accuracy this can require much higher resolution – such as use of LIDAR whereby surface data with resolutions of under 5m can be generated.
Note that use of a clutter database (as discussed in the following section) should be combined with a terrain but not a surface database. This is to avoid the double counting that can come from modelling the additional loss due to buildings twice.
A final point to be aware of is that different terrain databases can use different Earth geoids and the locations (latitude, longitudes) of stations entered should be consistent with the reference frame used for terrain data.
Terrain Database Interface
Interface Management
The first step to using terrain data in Visualyse Professional Version 7 is to configure the interfaces to the sources of data. This is a “Visualyse” level operation in that the changes you make here will impact all simulations you open on that PC.
The interface will depend upon the terrain database available to you and provided by us. At the time of writing the following interfaces were shipped by default.
Note: the name in brackets is how the format is named in Visualyse.
-
ASTER GDEM (ASTER GDEM) - 1 arc second (about 30m) for 83° North to 83° South.
This is legacy data included for backwards compatibility.
The latest version of this data is ASTER GDEM V3
-
ASTER2 GDEM (ASTER2 GDEM) - 1 arc second (about 30m) for 83° North to 83° South.
This is legacy data included for backwards compatibility.
The latest version of this data is ASTER GDEM V3
-
ASTER GDEM V3 (ASTER GDEM V3) - 1 arc second (about 30m) for 83° North to 83° South.
As described here
-
General Import (General Import) – variable resolution and coverage.
Uses the file format as described in the Technical Annex, so if you can convert your data into this format it can be read into Visualyse Professional.
-
Generic GeoTIFF (Generic GeoTIFF) - variable resolution and coverage.
Note: data in this format is loaded by first adding the “Generic GeoTIFF” database in “Terrain Settings” then opening “Terrain Manager”, selecting “Load Region”, choosing "GeoTIFF Format (*.tif)” from the file type and then selecting an appropriate GeoTIFF file. This terrain format does not support the click-drag terrain interface.
-
USGS GLOBE DEM (GLOBE DEM) – 30 arc second (about 900m) global for all latitudes.
As described here
Note: if using this data you need to add this file to the data directory.
-
Generic GRC (Generic GRC) - variable resolution and coverage.
Note: data in this format is loaded by first adding the “Generic GRC” database in “Terrain Settings” then opening “Terrain Manager”, selecting “Load Region”, choosing "GRC Format (*.grc)” from the file type and then selecting an appropriate GRC file. This terrain format does not support the click-drag terrain interface.
-
Generic GRD (Generic GRD) - variable resolution and coverage.
Note: data in this format is loaded by first adding the “Generic GRD” database in “Terrain Settings” then opening “Terrain Manager”, selecting “Load Region”, choosing "GRD Format (*.grd)” from the file type and then selecting an appropriate GRD file. This terrain format does not support the click-drag terrain interface.
-
Infoterra Lidar (Infoterra Lidar) – variable resolution and coverage.
This is legacy data included for backwards compatibility.
-
Infoterra Lidar Surface (Infoterra Lidar Surface) – variable resolution and coverage.
This is legacy data included for backwards compatibility.
-
Infoterra Lidar Terrain (Infoterra Lidar Terrain) – variable resolution and coverage.
This is legacy data included for backwards compatibility.
-
National Elevation Dataset (NED) (NED GeoTIFF) - 1 arc second (30m), 1/3 arc second (10m), 1/9 arc second (3m) for United States, Alaska, Hawaii, and territorial islands
As described here
Note: data in this format is loaded by first adding the “NED GeoTIFF” database in “Terrain Settings” then opening “Terrain Manager”, selecting “Load Region”, choosing “NED GeoTIFF (*.tif)” from the file type and then selecting an appropriate GeoTIFF file. This terrain format does not support the click-drag terrain interface.
-
Ofcom (Ofcom) - 50m data for the U.K
This data is for Ofcom (UK) use only and not generally available.
-
Ordnance Survey Public Domain Landform Panorama (OS 50m) - 50m terrain database for the U.K
This is legacy data included for backwards compatibility.
-
SRTM-3 Level 1 (SRTM-3 Level 1) – 3 arc second (about 90m) from 60° North to 56° South.
This is legacy data included for backwards compatibility.
-
SRTM-1 Level 2 (SRTM-1 Level 2) – 1 arc second (about 30m) for the United States of America for latitudes below 60° North.
This is legacy data included for backwards compatibility.
-
SRTM-1 Level 2 (HGT) (SRTM-1 Level 2 (HGT)) - 1 arc second (about 30m) from 60° North to 56° South.
More information here
-
SRTM-3 Level 1 (HGT) (SRTM-3 Level 1 (HGT)) - 3 arc second (about 90m) from 60° North to 56° South.
More information here
-
Transfinite processed SRTMGL1V003 (TSL SWBD Merged SRTMGL1V003) – 1 arc second (about 30m) from 60° North to 56° South.
More information here
-
Transfinite processed SRTM V2.1 (TSL SWBD Merged SRTM-3 V2-1) – 3 arc second (about 90m) from 60° North to 56° South.
This is legacy data included for backwards compatibility.
More information here
-
Transfinite processed SRTM V3.0 (TSL SWBD Merged SRTM-3 V3-0) – 3 arc second (about 90m) from 60° North to 56° South.
More information here
-
Transfinite processed SRTM (TSL SWBD Merged SRTM-3) – 3 arc second (about 90m) from 60° North to 56° South.
As SRTM-3 Level 1 but processed to take account of land / sea boundaries.
This is legacy data included for backwards compatibility.
More information here
-
UK Lidar DSM (UK Lidar DSM) - variable resolution data for the U.K
This is legacy data included for backwards compatibility.
-
UK Lidar DTM (UK Lidar DTM) - variable resolution data for the U.K
This is legacy data included for backwards compatibility.
-
USGS GTOPO30 (USGS GTOPO30 DEM) – 30 arc second (about 900m) global for all latitudes.
As described here
More information here
-
USGS Resampled (USGS Resampled) - 3 arc second (about 90m) for the United States of America
As described here
If you have a specific requirement to interface to an additional database, please do not hesitate to contact us.
The “File” menu option “Terrain Settings…” opens the following dialog:
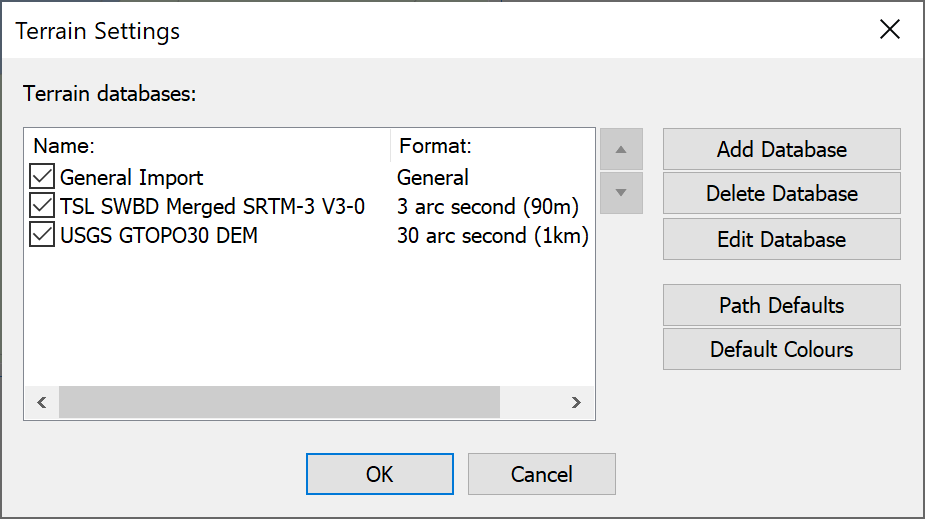
This dialog can be used to:
- Add an interface to a new source of terrain data
- Delete an existing interface to terrain data
- Edit an existing interface to terrain data
- Set the default path profile settings to use when opening a new simulation
- Set the default terrain colours to use when opening a new simulation
These are discussed in more detail in the sections below.
Adding a Terrain Database Interface
If you click on the “Add Database …” button a list of available terrain database interfaces will be shown, as in the figure below.
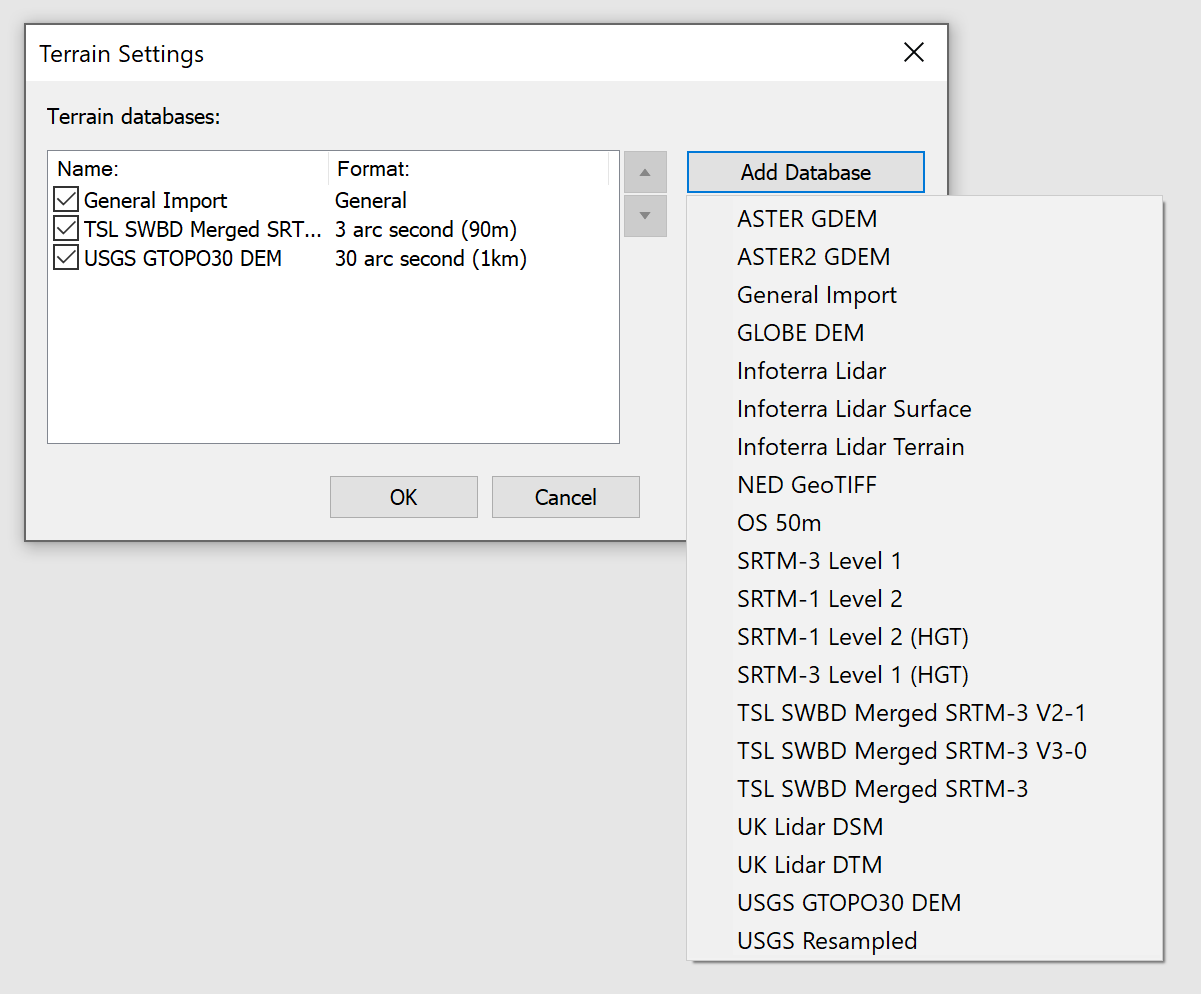
After selecting the interface you want to create you will be prompted for configuration options, such as name to call this source of data (as in the figure below) and any other parameters such as directories where data can be found.
The terrain database interface will then be added to the list of those available.
Deleting a Terrain Database Interface
To delete a terrain database interface (for example because you now have access to higher resolution data), select the terrain data source from the list and click on the “Delete Database…” button.
A dialog will ask you to confirm, as shown below.
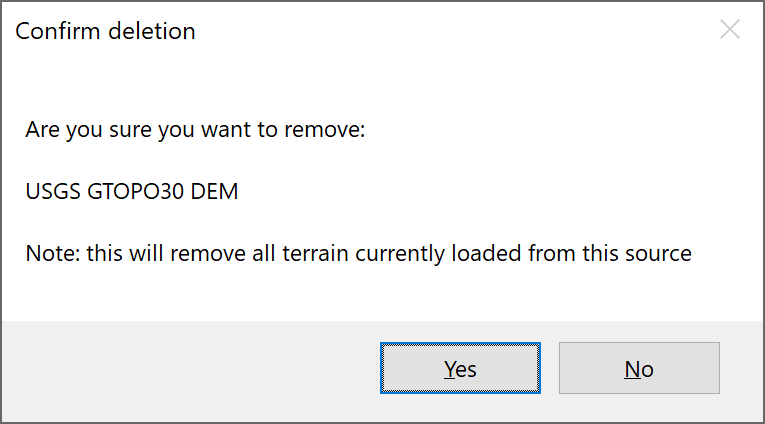
Note deleting a terrain database interface will also impact on your ability to load files that referred to that source of terrain data and that any configuration options would have to be re-set.
Edit a Terrain Database Interface
This option allows you to rename a terrain database interface and / or alter the directory identifying where the data is stored.
Ordering Terrain Databases
The list of terrain database interfaces can be ordered by selecting one and clicking on the move up or move down arrows. For example in the example below the TSL SWBD Merged SRTM-3 is initially below the USGS GTOP30 DEM.
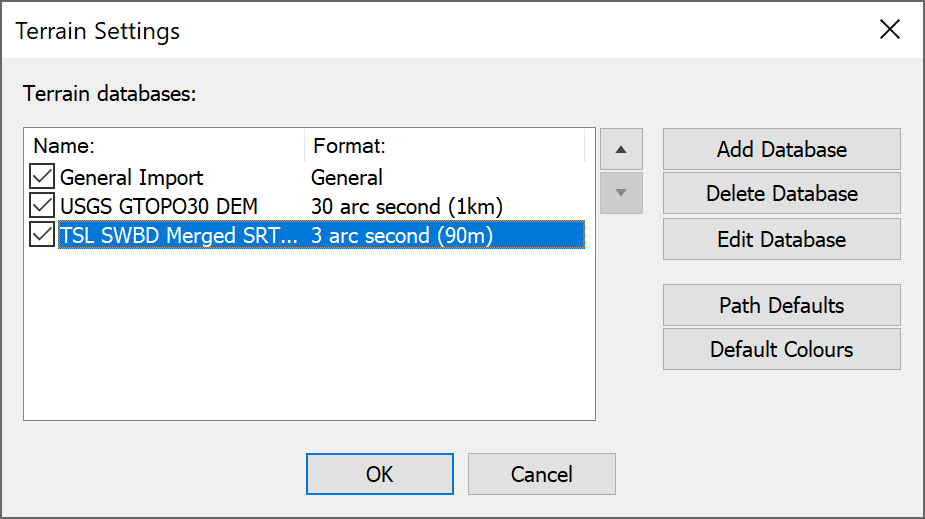
By selecting it and clicking the up arrow the order of terrain databases can be changed so that it is above, as in the figure below.
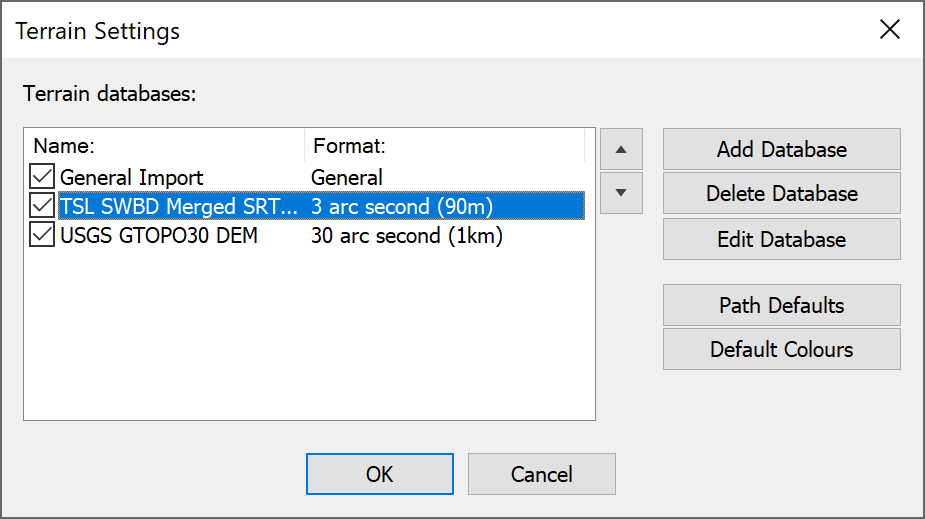
Visualyse Professional uses the order of databases here when there are two terrain regions covering the same location to determine which it should use. For example you might want very high resolution terrain data in the vicinity of the transmitter / receiver, but it would require excessive memory to continue with the same resolution all along the path.
An example can be seen in the figure below where a high resolution terrain region is overlaid on top of a larger low resolution terrain region. The path profile can be seen to be highly detailed at the start and be less detailed when it crosses into the lower resolution area.
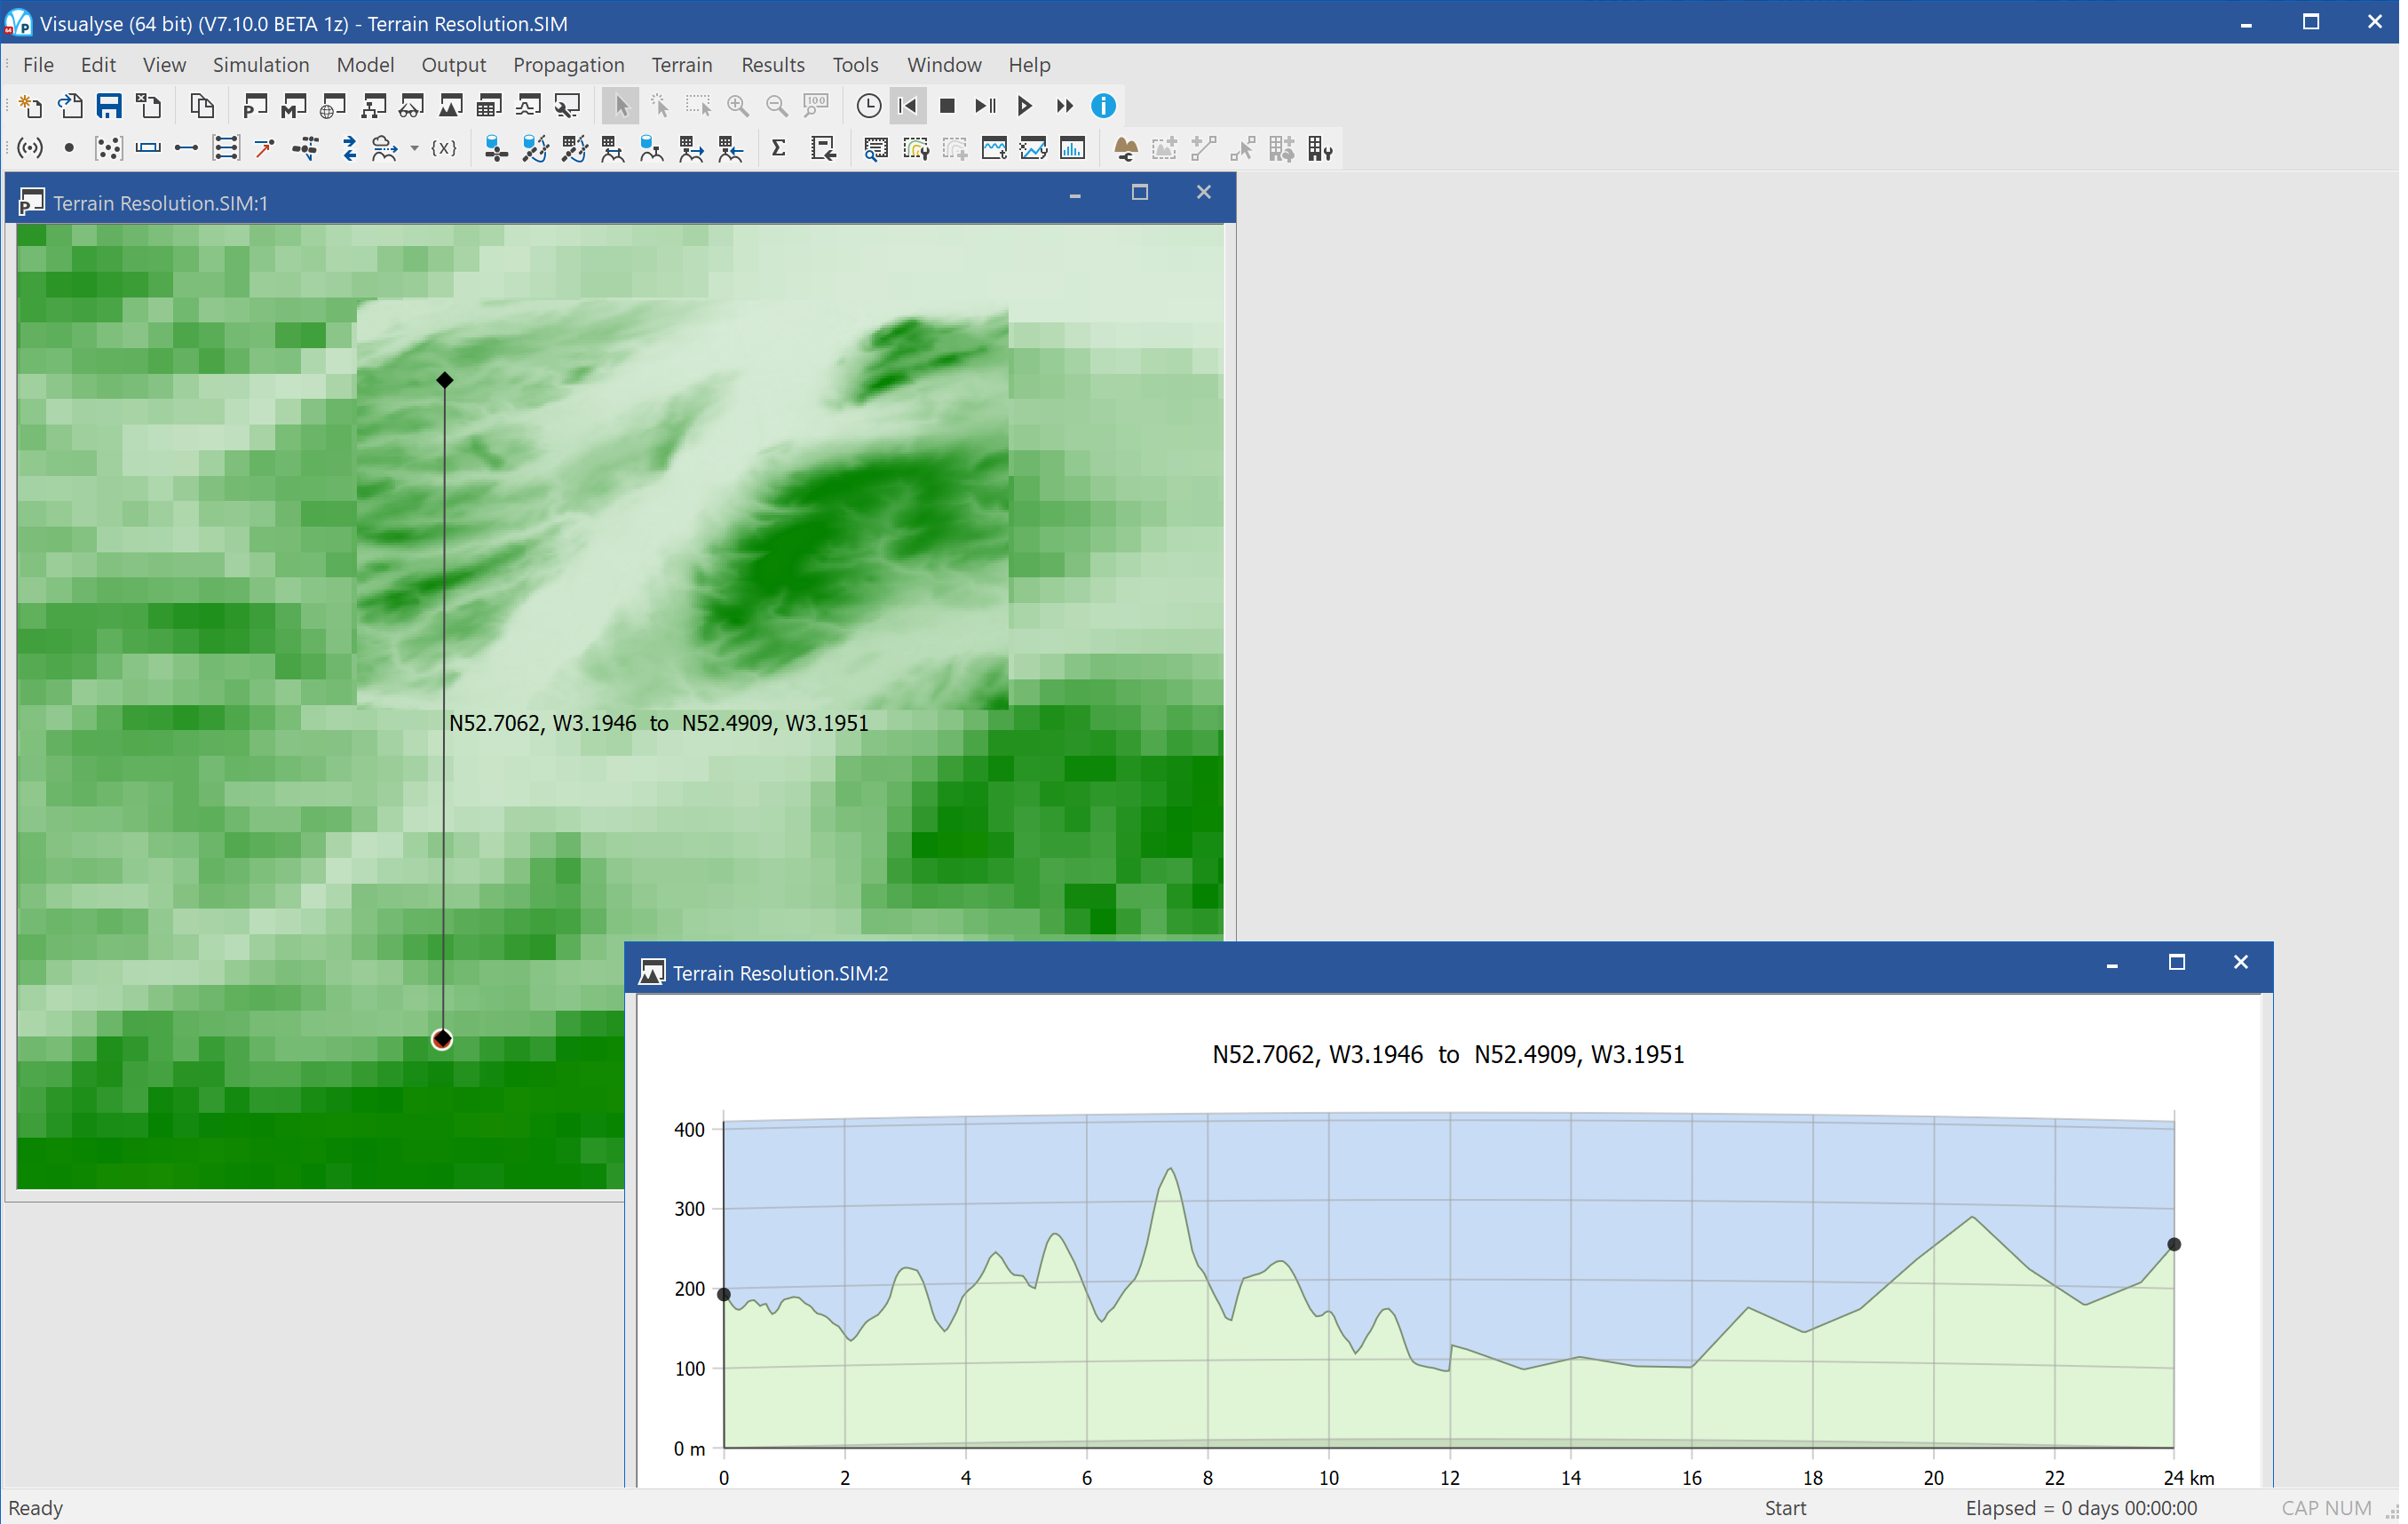
Tip: This feature can be used to model locations in high detail to specify objects such as buildings. A surface (i.e. terrain plus buildings) database can be created and read into Visualyse Professional using the general terrain file format.
This can then be used within propagation models such as ITU-R Rec.P.452 – see the example file “Urban GSO S-DARS Coverage.SIM” in the “Satellite Terrestrial" directory.
Changing the Path Profile Defaults
The path profile describes how the terrain varies along the great circle path between any two points, as in the example below.
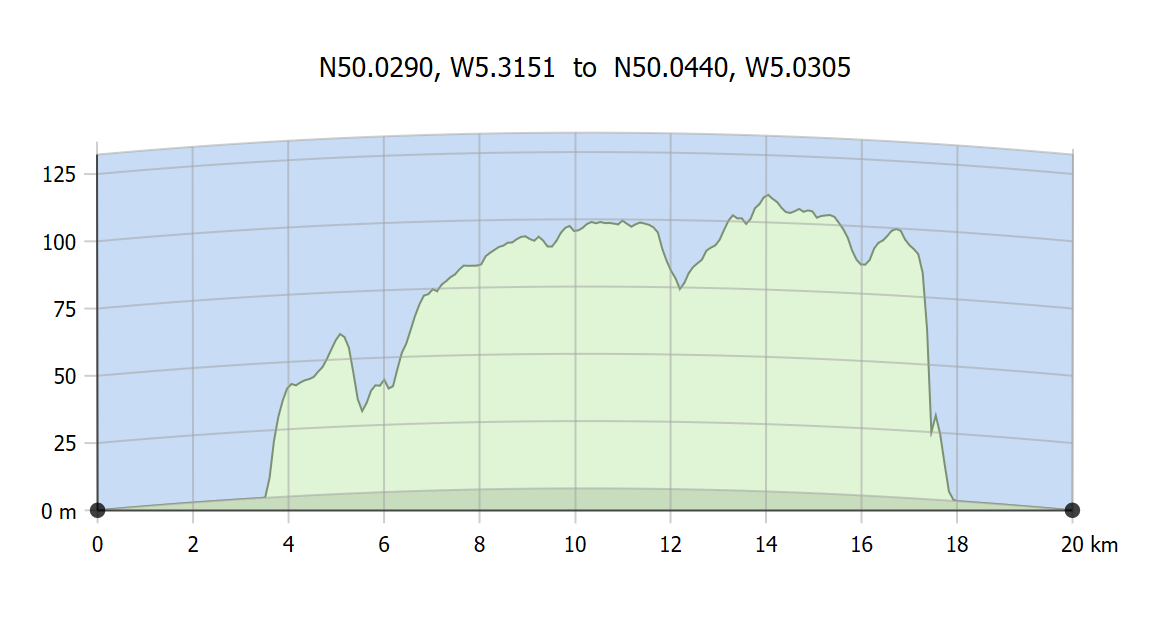
The heights along the path profile are extracted from the terrain database using bi-linear interpolation at equal spacings along the line using a parameter called the path resolution, as shown in the figure below:
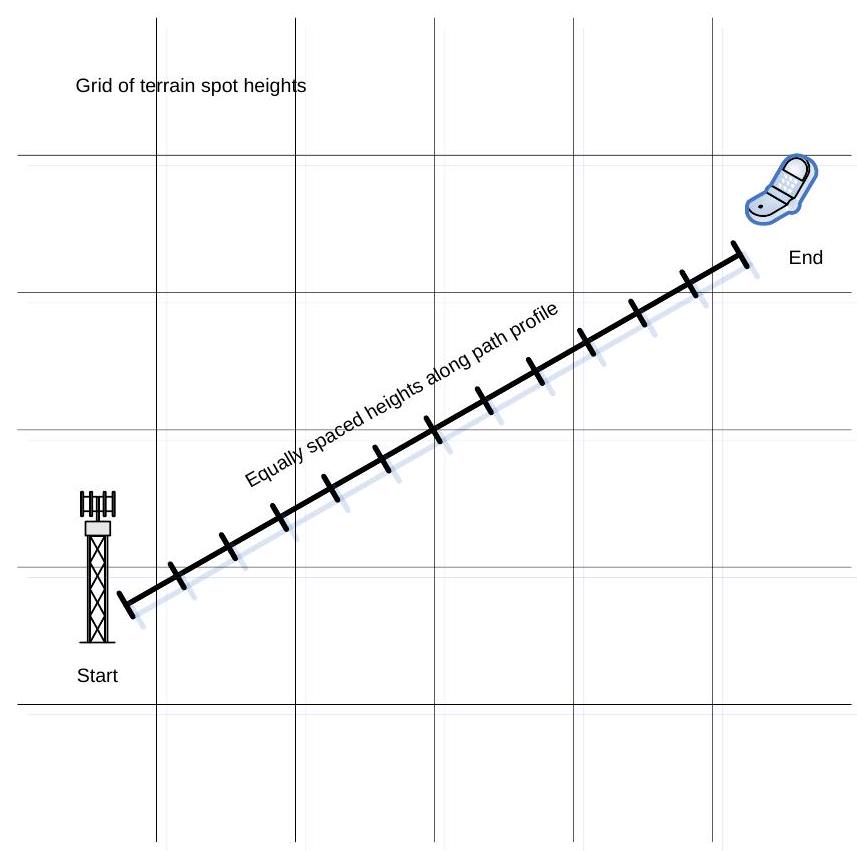
This value can make a significant difference to the results and so is set for each simulation under the “Terrain” menu. In addition it is possible to set the default value to use for all new simulation using the “Path Profile Defaults” option under the “File” menu’s “Terrain Settings” dialog.
The dialog is shown in the figure below.
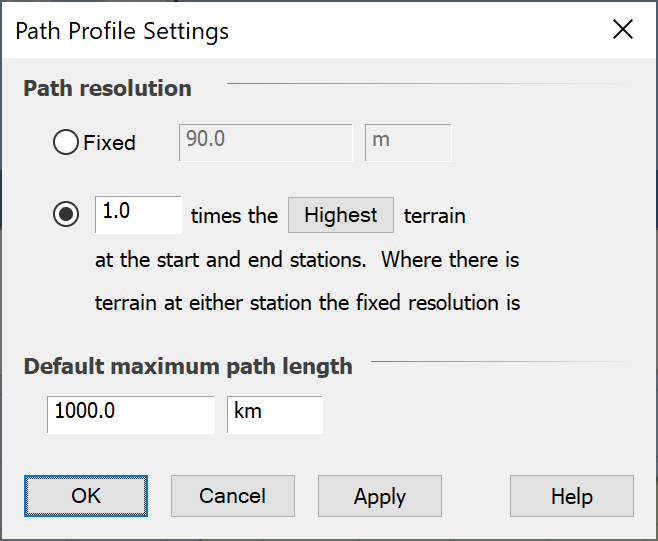
There are options to use a fixed path resolution or to use a fraction of the highest / lowest terrain resolution.
Maximum Path Length
In addition it is possible to set the maximum path length: this is used in some of the propagation models to define the point beyond which a constant should be used, as the distance is so large that the signal strength will negligible.
Tip: It is usually best to set the maximum distance to be a large number e.g. 1,000 km.
This applies to the following propagation models:
- Recommendations ITU-R P.452
- Recommendations ITU-R P.526 (which also has a maximum path length)
- Recommendations ITU-R P.1812
- Recommendations ITU-R P.2001
- Longley-Rice
Changing the Default Terrain Colours
This option allows you to set the default mapping to use between terrain heights and colour to use on a map or 3D view when opening a new simulation.
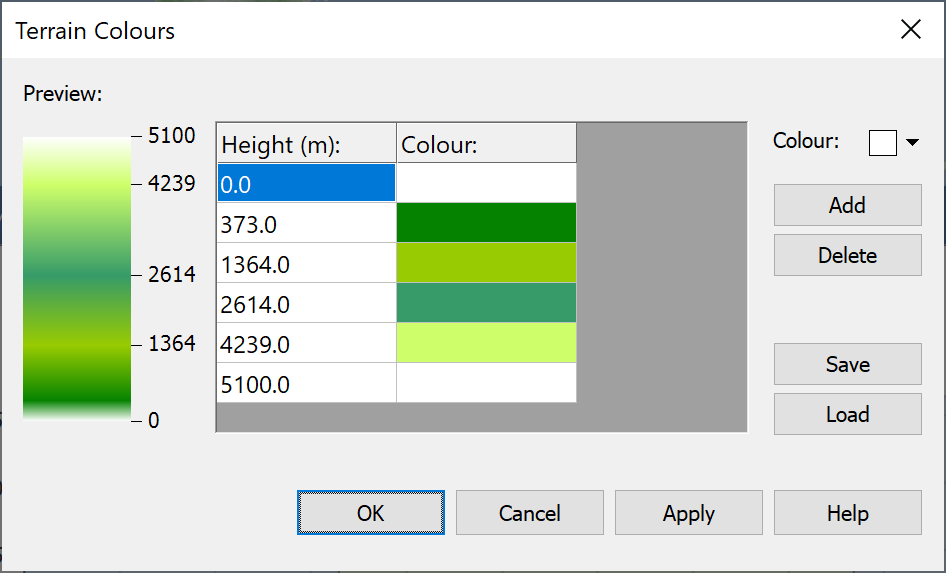
Having opened a new simulation, the mapping between terrain heights and colours is set and stored within that simulation and can be changed via the “Terrain” menu.
To map between terrain heights and colours, you need to set a number of break points where specific heights are mapped to specific colours. Between these break points, the colours are spread out equally in height.
You can edit the height and colour by selecting each respectively. New entries in the table can be created by clicking on “Add” and existing ones deleted by selecting them and then clicking on “Delete”.
A preview is available to the left of the dialog, and colour schemes you are happy with can be saved for use in other simulations to a Visualyse terrain colour file with extension “vtc”.
Terrain Data Regions
Selecting Terrain Data Regions
Terrain databases can be extremely large and it would represent a significant overhead to load the complete database. In addition there are times when you want to calculate propagation loss without use of a terrain database – for example when doing smooth Earth calculations.
Therefore it is necessary to specify on a simulation by simulation basis whether you want to use terrain data and if so what geographic area should be loaded. This is then the “Terrain Region” and can be shown on the maps and 3D view and also used within propagation calculations.
Terrain regions must come from just one of the terrain databases that have been configured on that PC. The data in the region can come from multiple files within the database, as in the figure below.
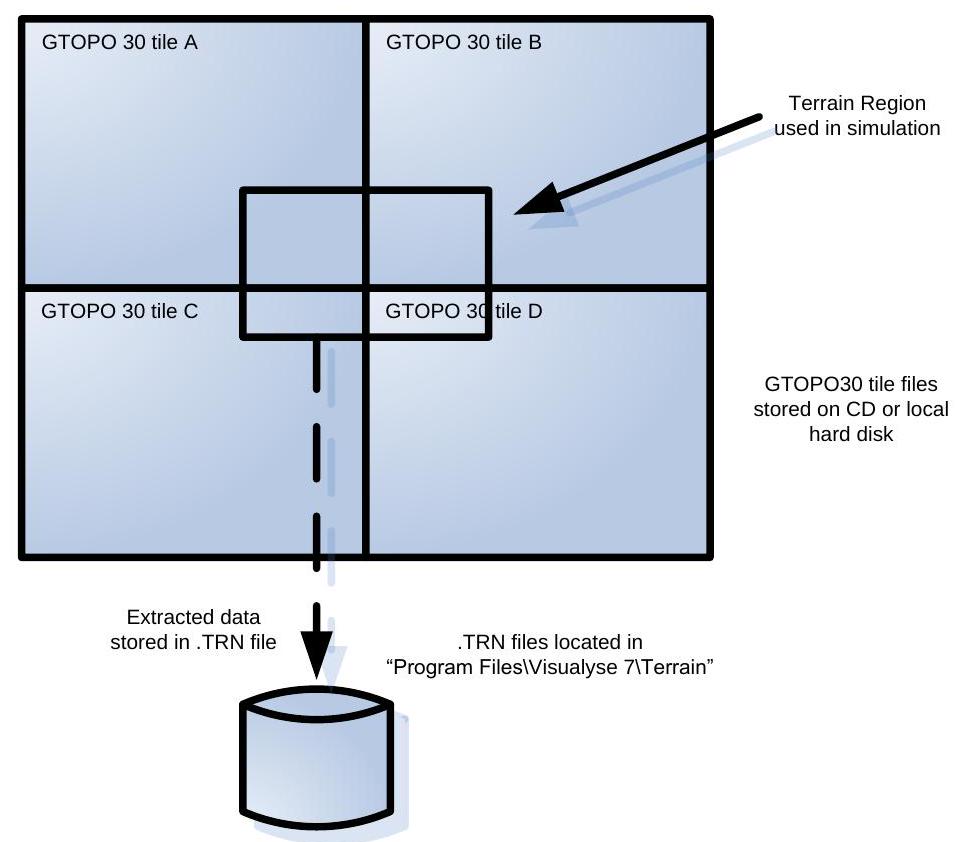
In this case and also for raw SRTM data, a new .TRN file is generated that contains the extracted terrain data needed for the simulation. This can be stored and used direction in other simulations.
For other terrain interfaces, such as the converted SRTM data available from Transfinite, the simulation simply stores references to the terrain data. This means there is no need to save the extracted terrain data in a new file, which saves both time and hard disk space.
Terrain regions can be created in one of two ways:
- Using the mouse to select the area of interest as in the following section
- Specifying the area explicitly using the Terrain Manager (see below)
Interactive Creation of Terrain Regions
You can select an area within which to load terrain data by selecting the “New Terrain Region” icon on the tool bar ![]() and then using drag and drop to select the region of interest on the map or 3D views.
and then using drag and drop to select the region of interest on the map or 3D views.
This interactive tool can also be activated using the “Terrain” menu option “New Terrain Region”.
If there are multiple data sources that have data for the region chosen, you must select it from the list presented, as in the figure below.
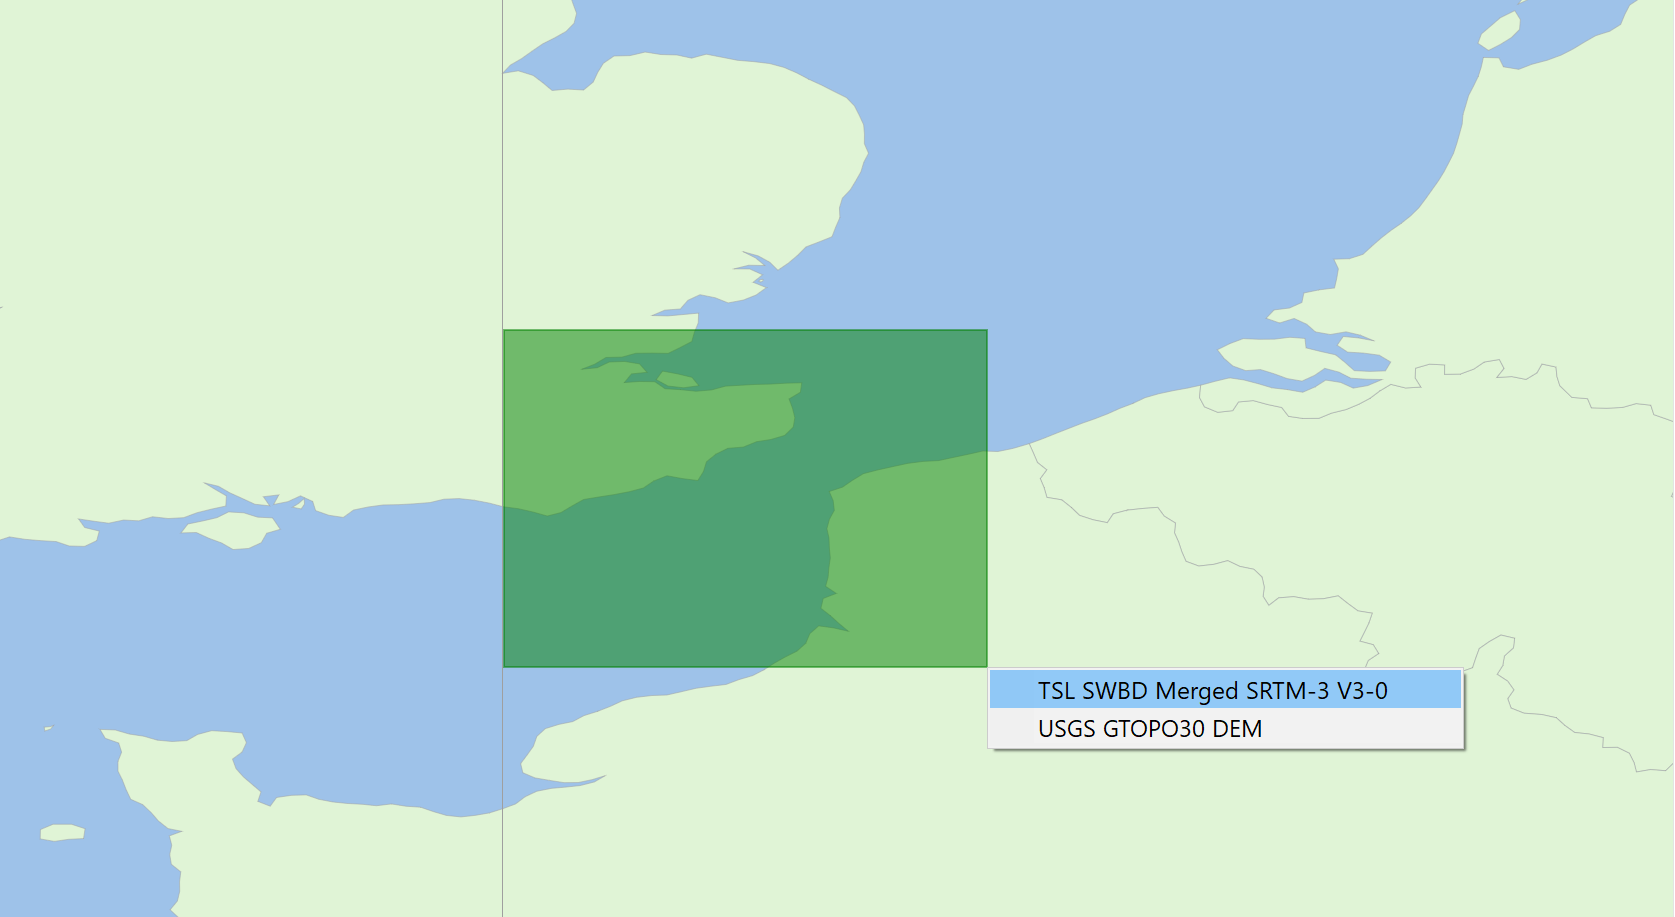
Terrain Region Manager
The Terrain Region Manager (below) can be used to create, edit, and delete terrain regions. It can also be used to save and load terrain regions where copyright permits.
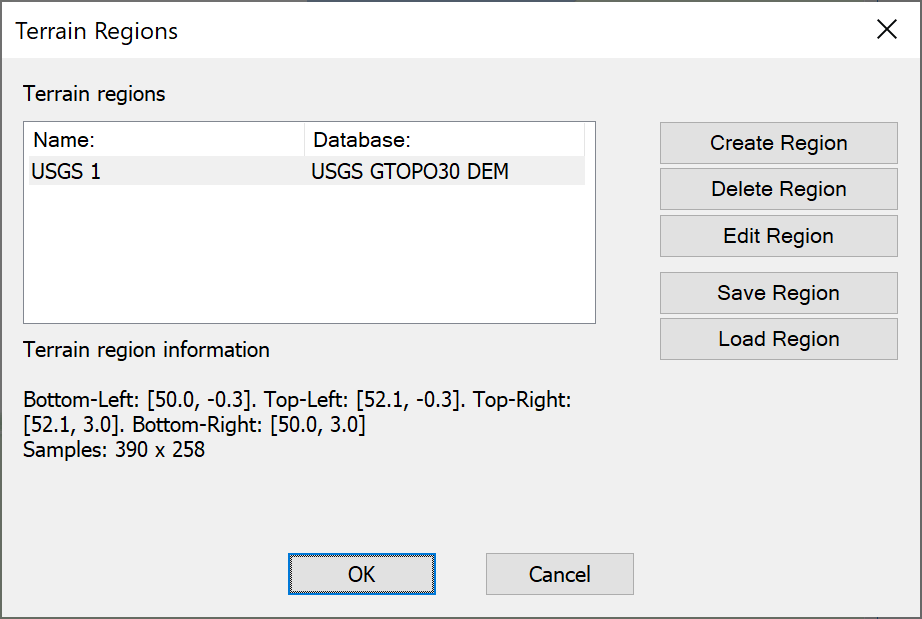
The list on the left-hand side shows the currently loaded terrain regions in the simulation and the data source used. If you select one, information about that terrain region is shown at the bottom.
You can use the option “Create Region” to customise a terrain region, within specific lat/long box or one that uses the minimum size region to enclose all relevant stations.
The Create Region dialog is shown below: it can also use to modify an existing terrain region.
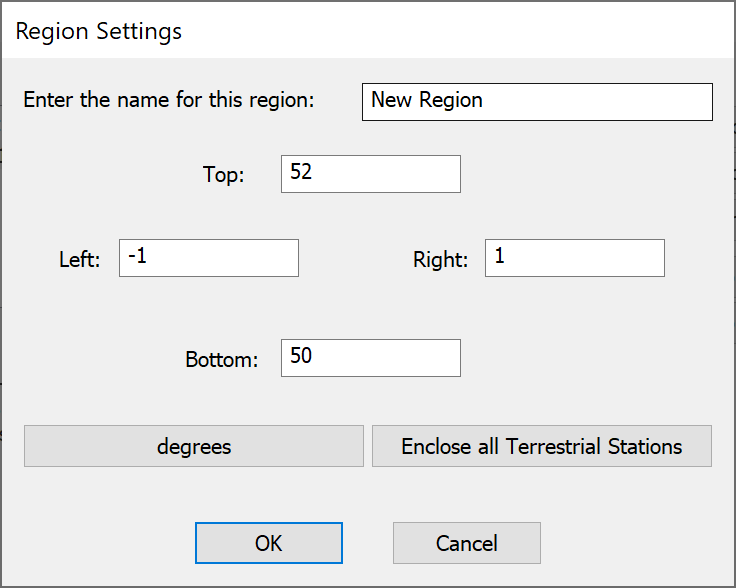
You can specify or change:
- The name to use to display the terrain region
- The maximum latitude of the terrain region
- The minimum latitude of the terrain region
- The maximum longitude of the terrain region
- The minimum longitude of the terrain region
You can change the units to show or specify the regions extent in radians or using degrees, minutes, seconds with format:
[N/S/E/W] DD:MM’SS.SS”
Another button can be used to create a terrain region that just covers the locations of all the stations currently in the simulation.
If there are multiple terrain data sources that could be used to create that region then you will be asked to select which one to use, as in the figure below.
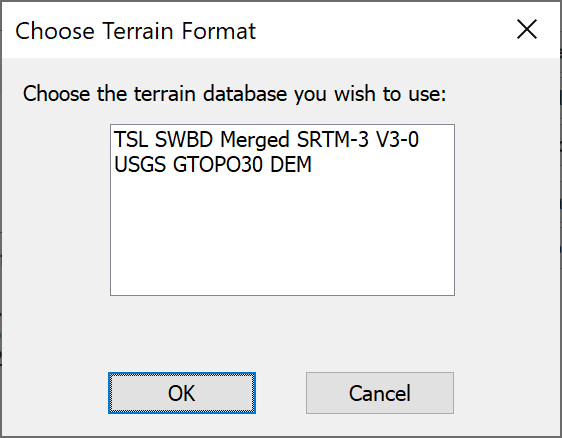
Path Profiles Parameters and Terrain Colours
As described in Changing the Path Profile Defaults and Changing the Default Terrain Colours, the default path profile parameters and terrain colours are set via the “File” menu option “Terrain settings…” Within each simulation file you can have different parameters and colours and these can be accessed by the “Terrain” menu options “Path Profile Settings…” and “Terrain Colours…” respectively.
Path Profiles
Path Profile View
An important use of terrain data is the ability to extract and process terrain spot heights along the great circle line between a transmitter and receiver, whether wanted or interfering. This line of spot heights is called the path profile, and can be displayed using the path profile view, similar to that below:
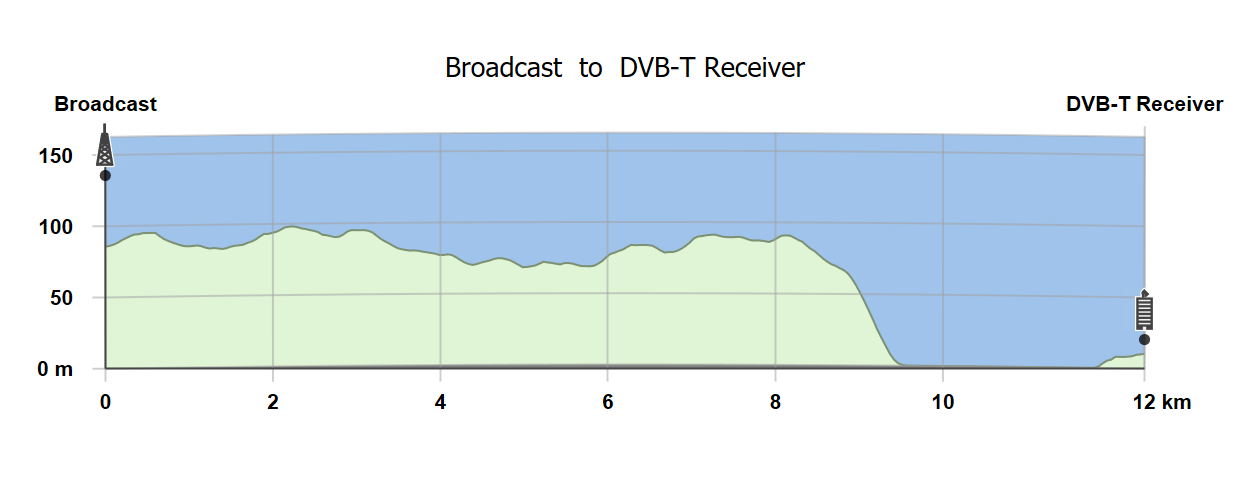
This section describes how to create and configure path profiles views.
Creating Path Profiles
A new path profile view can be created using the toolbar by selecting the path profile icon, ![]() :
:
An alternative way to create a new path profile window is via the menu options, as shown below.

These two options will create a new path profile view which can then be configured to select the two points to use as the path profile start and end points.
An alternative way to create a path profile is to interactively select the start/end point using the mouse. In this case select either of the maps or 3D views and select the icon ![]() .
.
Then click on the start location on the map and hold the mouse button down and drag to the end point and then release. A new path profile window will be created already configured to select the required start / and end points.
Path Profile Options
The path profile configuration options can be selected by right clicking within the path profile view which brings up the following menu:
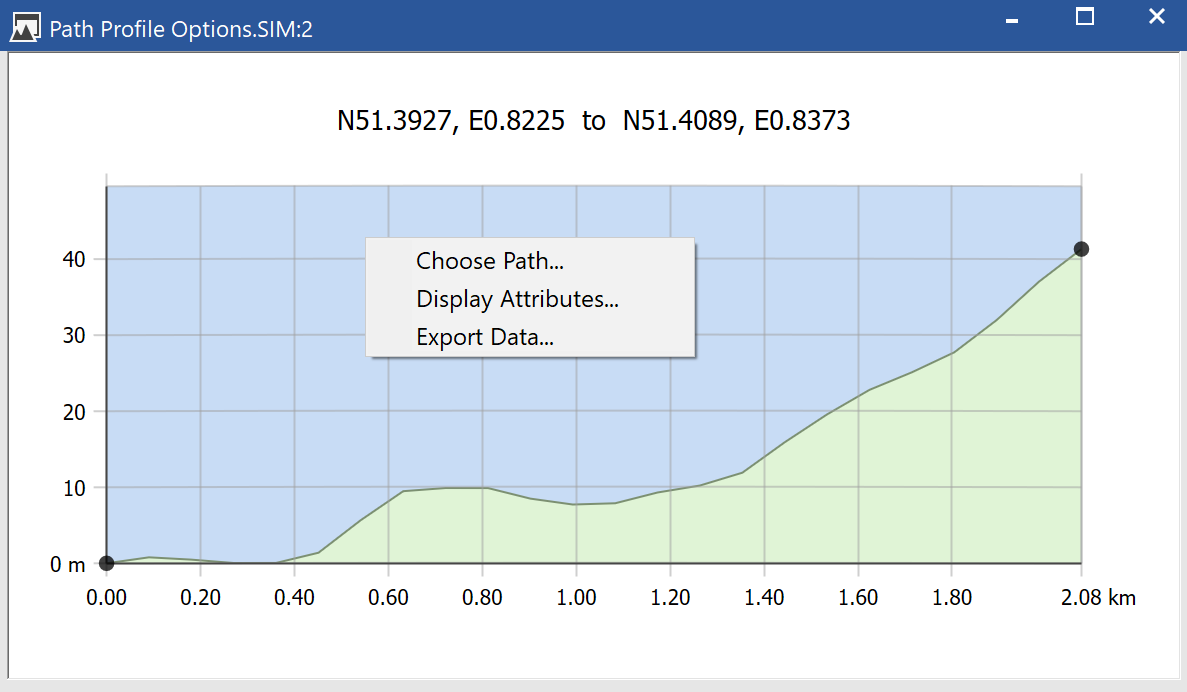
The first two options can also be accessed via the “Edit” menu options “View Properties” and “Plot data”.
Configuring Path Profiles
The start and end points of a path profile can be selected using the path definition dialog shown below.
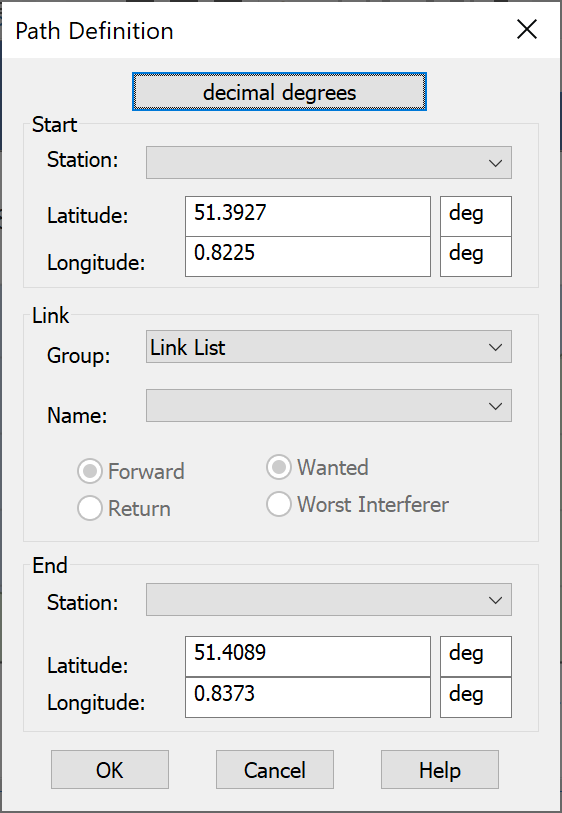
There are three ways of specifying path profile start and end points:
- By selecting a station from drop down list of those in the simulation
- By selecting the points (latitude, longitude) directly using decimal degrees, radians or degrees, minutes, seconds (selected via button at the top).
- By being one end of a link’s wanted or worst interfering path from a drop down list of links either in the simulation or within a specific link group
Note selecting the option to show the path profile of the worst interferer can have additional uses as the path profile line can be shown on the maps and 3D view. Hence it can be used to quickly highlight which interfering transmitter is the worst single entry.
Configuring Path Profile Displays
The path profile display dialog allows significant configuration options, as shown in the figures below.
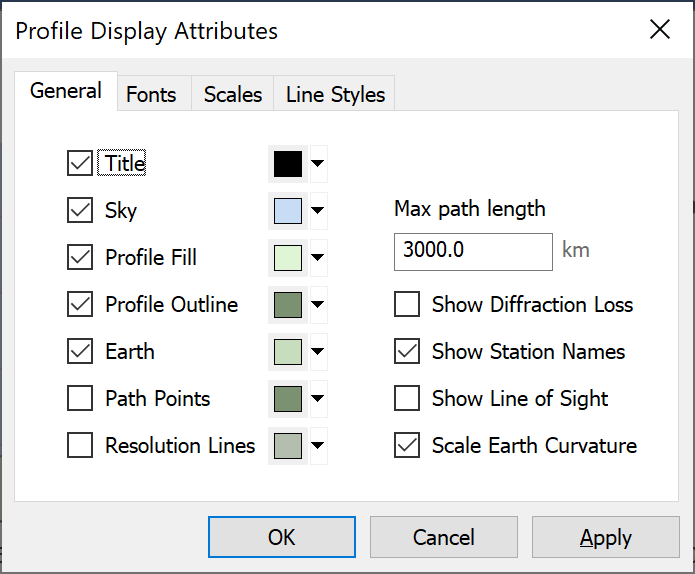 | 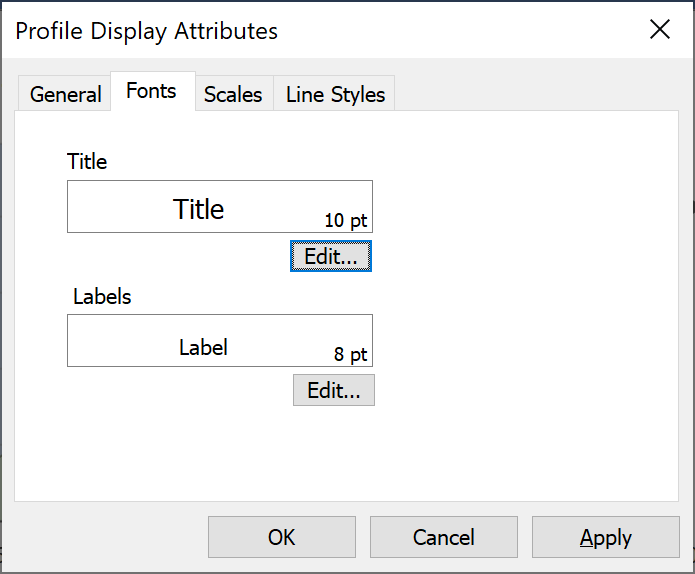 |
|---|---|
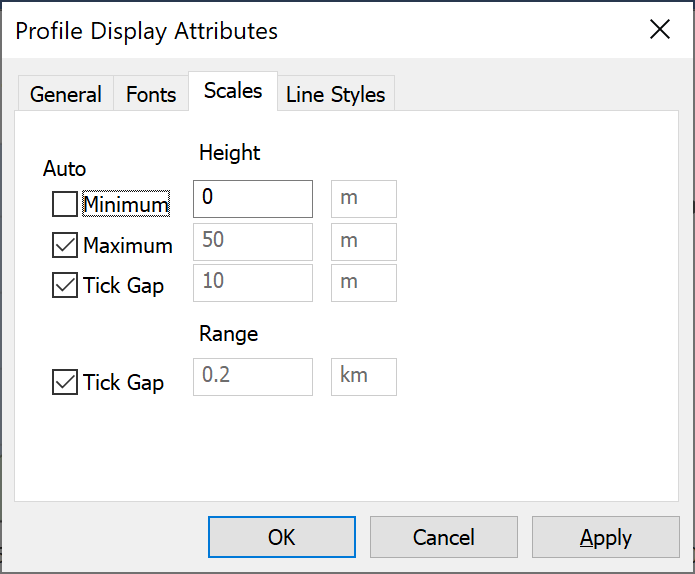 | 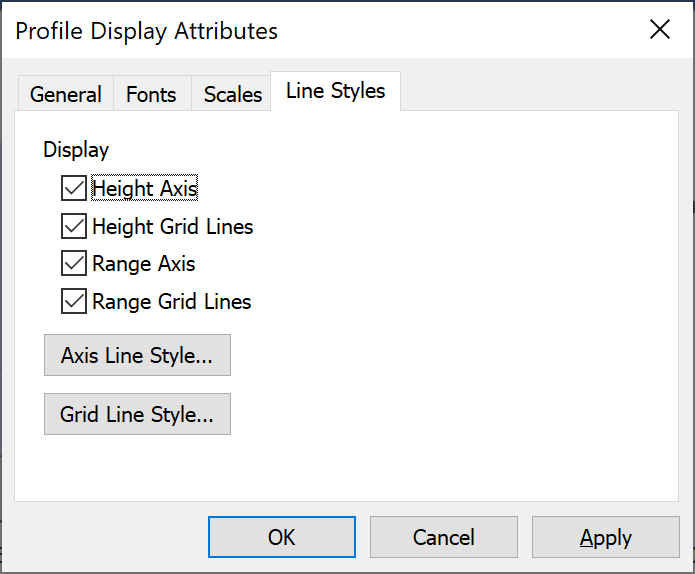 |
Exporting Path Profile Data
The path profile can be exported in comma separated values or CSV format by selecting the option “Export data…” from the right click pop-up menu.
It then prompts for a file to save to which will contain the path profile data in the form of a CSV text file containing for each point along the path:
- Latitude (decimal degrees)
- Longitude (decimal degrees)
- Distance from start point (km)
- Height above sea level of terrain (m)
- IDWM Zone (A1, A2, B)
Showing Path Profiles on Maps and 3D View
The currently open path profiles can be displayed upon either of the maps or the 3D view as shown in the figure below.
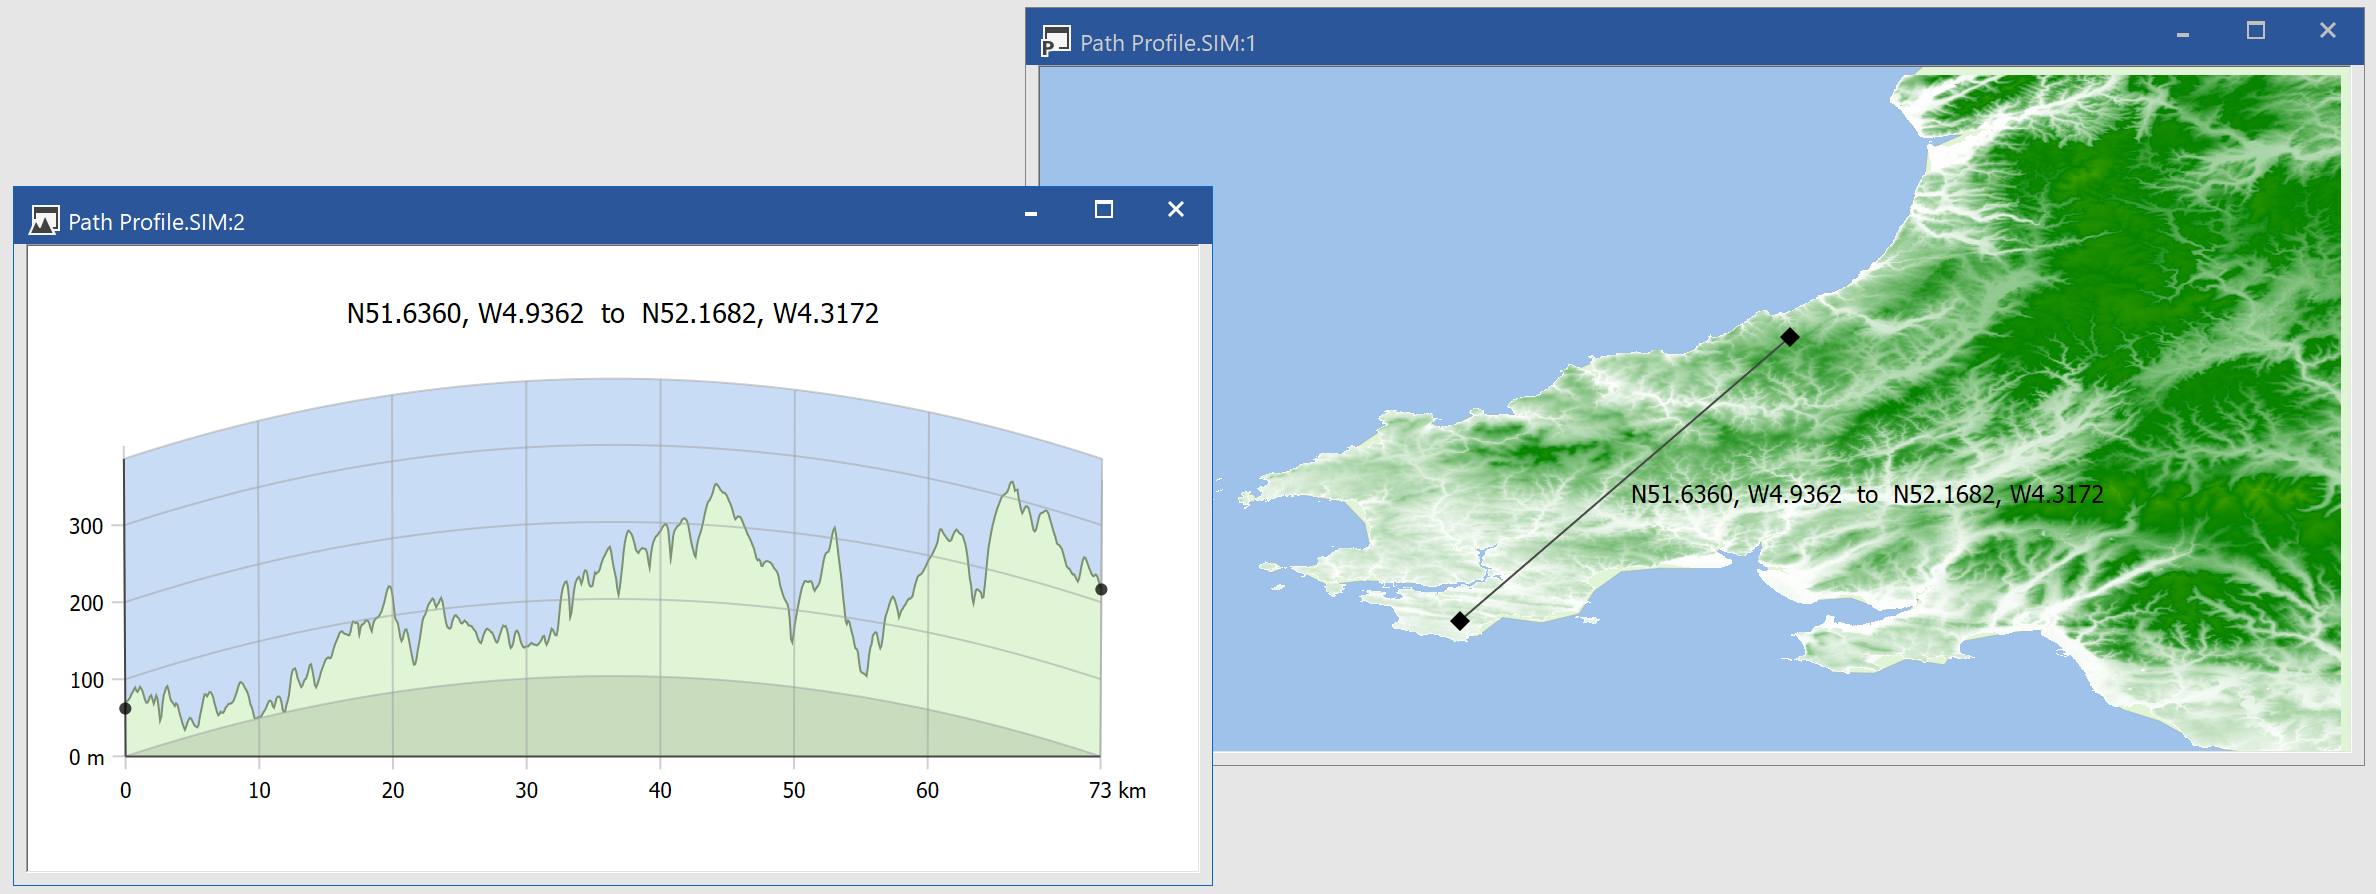
This is useful to get additional feel as to the terrain data by showing a slice through it and the location of the slice on a map.
The path profile is shown as a line with labels which can be configured – for example to change the line colour, text, font etc. The controls are shown below – more information is available on the section of the User Guide on View Properties.
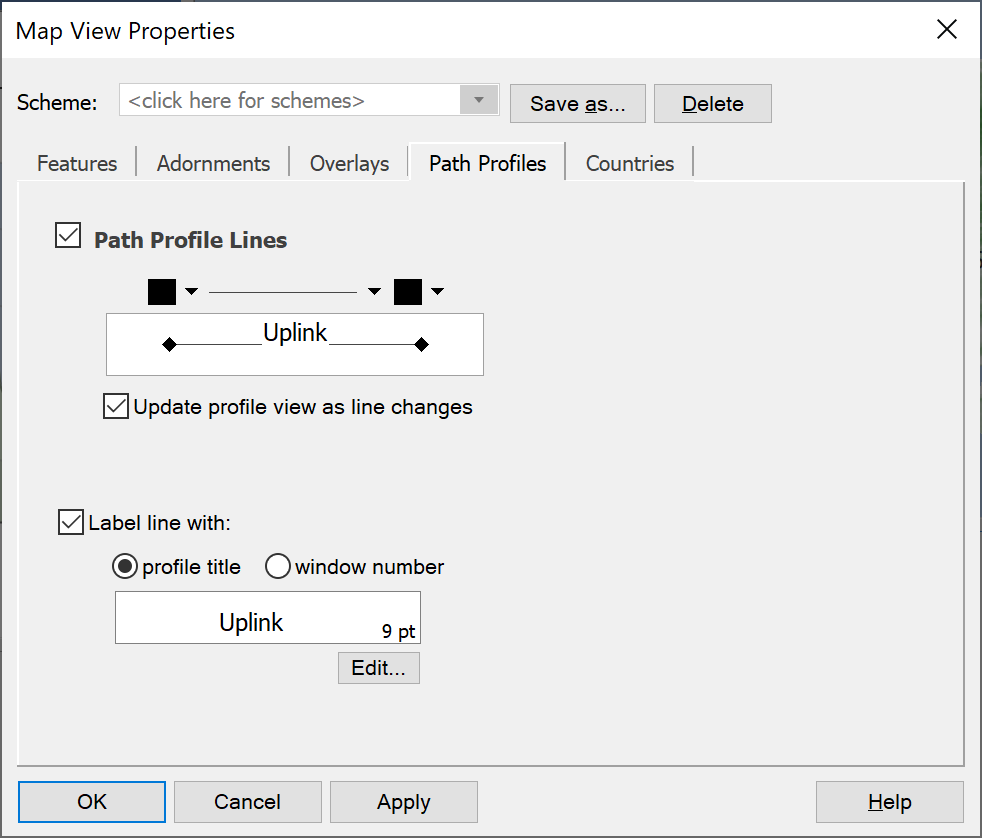
Moving Path Profiles
Path profiles can be moved using the mouse by selecting the “Edit path profile” option on the tool bar, ![]()
After selecting the “Edit path profile” option, it is possible to select one end of a path profile and move it around. The path profile view will update in real time as the path profile end point is moved.
Using Terrain Data
The terrain data can be used within Visualyse Professional to calculate path loss on a link as part of the propagation modelling. This is described in more detail in other parts of the User Guide.
Terrain data can be used within the path loss calculations as part of the following propagation models:
- Recommendation ITU-R P.452
- Recommendation ITU-R P.526
- Recommendation ITU-R P.1546
- Recommendation ITU-R P.1812
- Recommendation ITU-R P.2001
- Longley-Rice
By default, if there is terrain data available it will be used within these models.
Showing Terrain Data
The terrain regions loaded can be shown on any map or 3D view. Each pixel is displayed using the colour selected in the Terrain Colours dialog.
The terrain data comprises another “overlay” along with clutter data, user defined overlays (such as maps) and area analysis.
The management of the overlays is described in more detail in the view configuration sections of the User Guide.
The following should be noted:
- It is easy to overload the view with too many overlays: select the ones you want and hide others
- The most important overlays should be highest on the list and less important ones lower down
- The level of transparency of each overlay can be used to show more or less of the lower layers
- Colours of land use pixels can be selected to avoid clashing with other overlays. For example in the example below the area analysis of coverage from a base station is in green and yellow, hence these colours are not used in the selection of terrain colours.
Clutter Loss Modelling
This section describes clutter loss modelling, which is part of the functionality of the Terrain Module.
Introduction
One of the factors that can influence the received signal is the clutter loss. For example consider the scenario in the figure below.
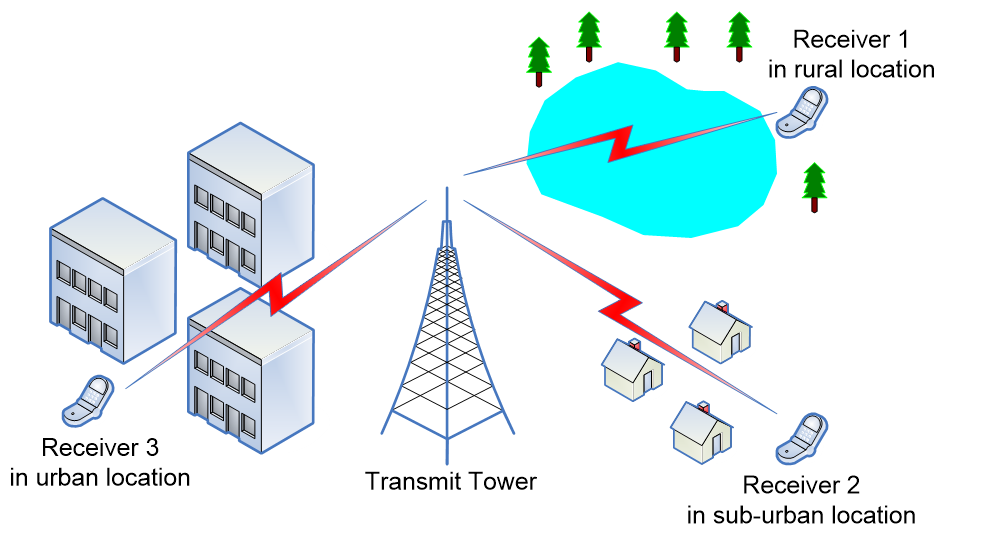
A transmitter’s signal is being detected at three receivers. Each is the same distance from the transmit tower, but is located in three very different environments.
The first is in a rural area by a lake: here there are no obstructions and so the signal received is likely to be strong.
The second receiver is in a suburban location. There are some obstructions, houses, but they are low and widely separated. The signal is likely to be lower than that in the rural areas but not much lower.
Finally the third receiver is in an urban location. It is surrounded by tall buildings that will significantly degrade the signal. It is likely to have the lowest received signal.
Thus it can be seen that the structures at each location can have an impact on how the signal is received.
In Visualyse Professional Version 7 this effect is included via:
- A database that identifies the land-use category for each location
- Calculations within the propagation model that works out a clutter loss based upon the land-use field
This section describes how to interface to and configure land-use database, and then use that information within calculations.
If a land-use database is not available the parameters can be entered directly by hand: in this case they will not vary across a geographic area.
The result is an improvement in the accuracy of predictions of signal strengths, whether wanted or interfering, by including not just terrain effects but also terminal clutter losses. An example of the impact of clutter on signal strengths can be seen in the mobile phone base station prediction coverage in the figure below.
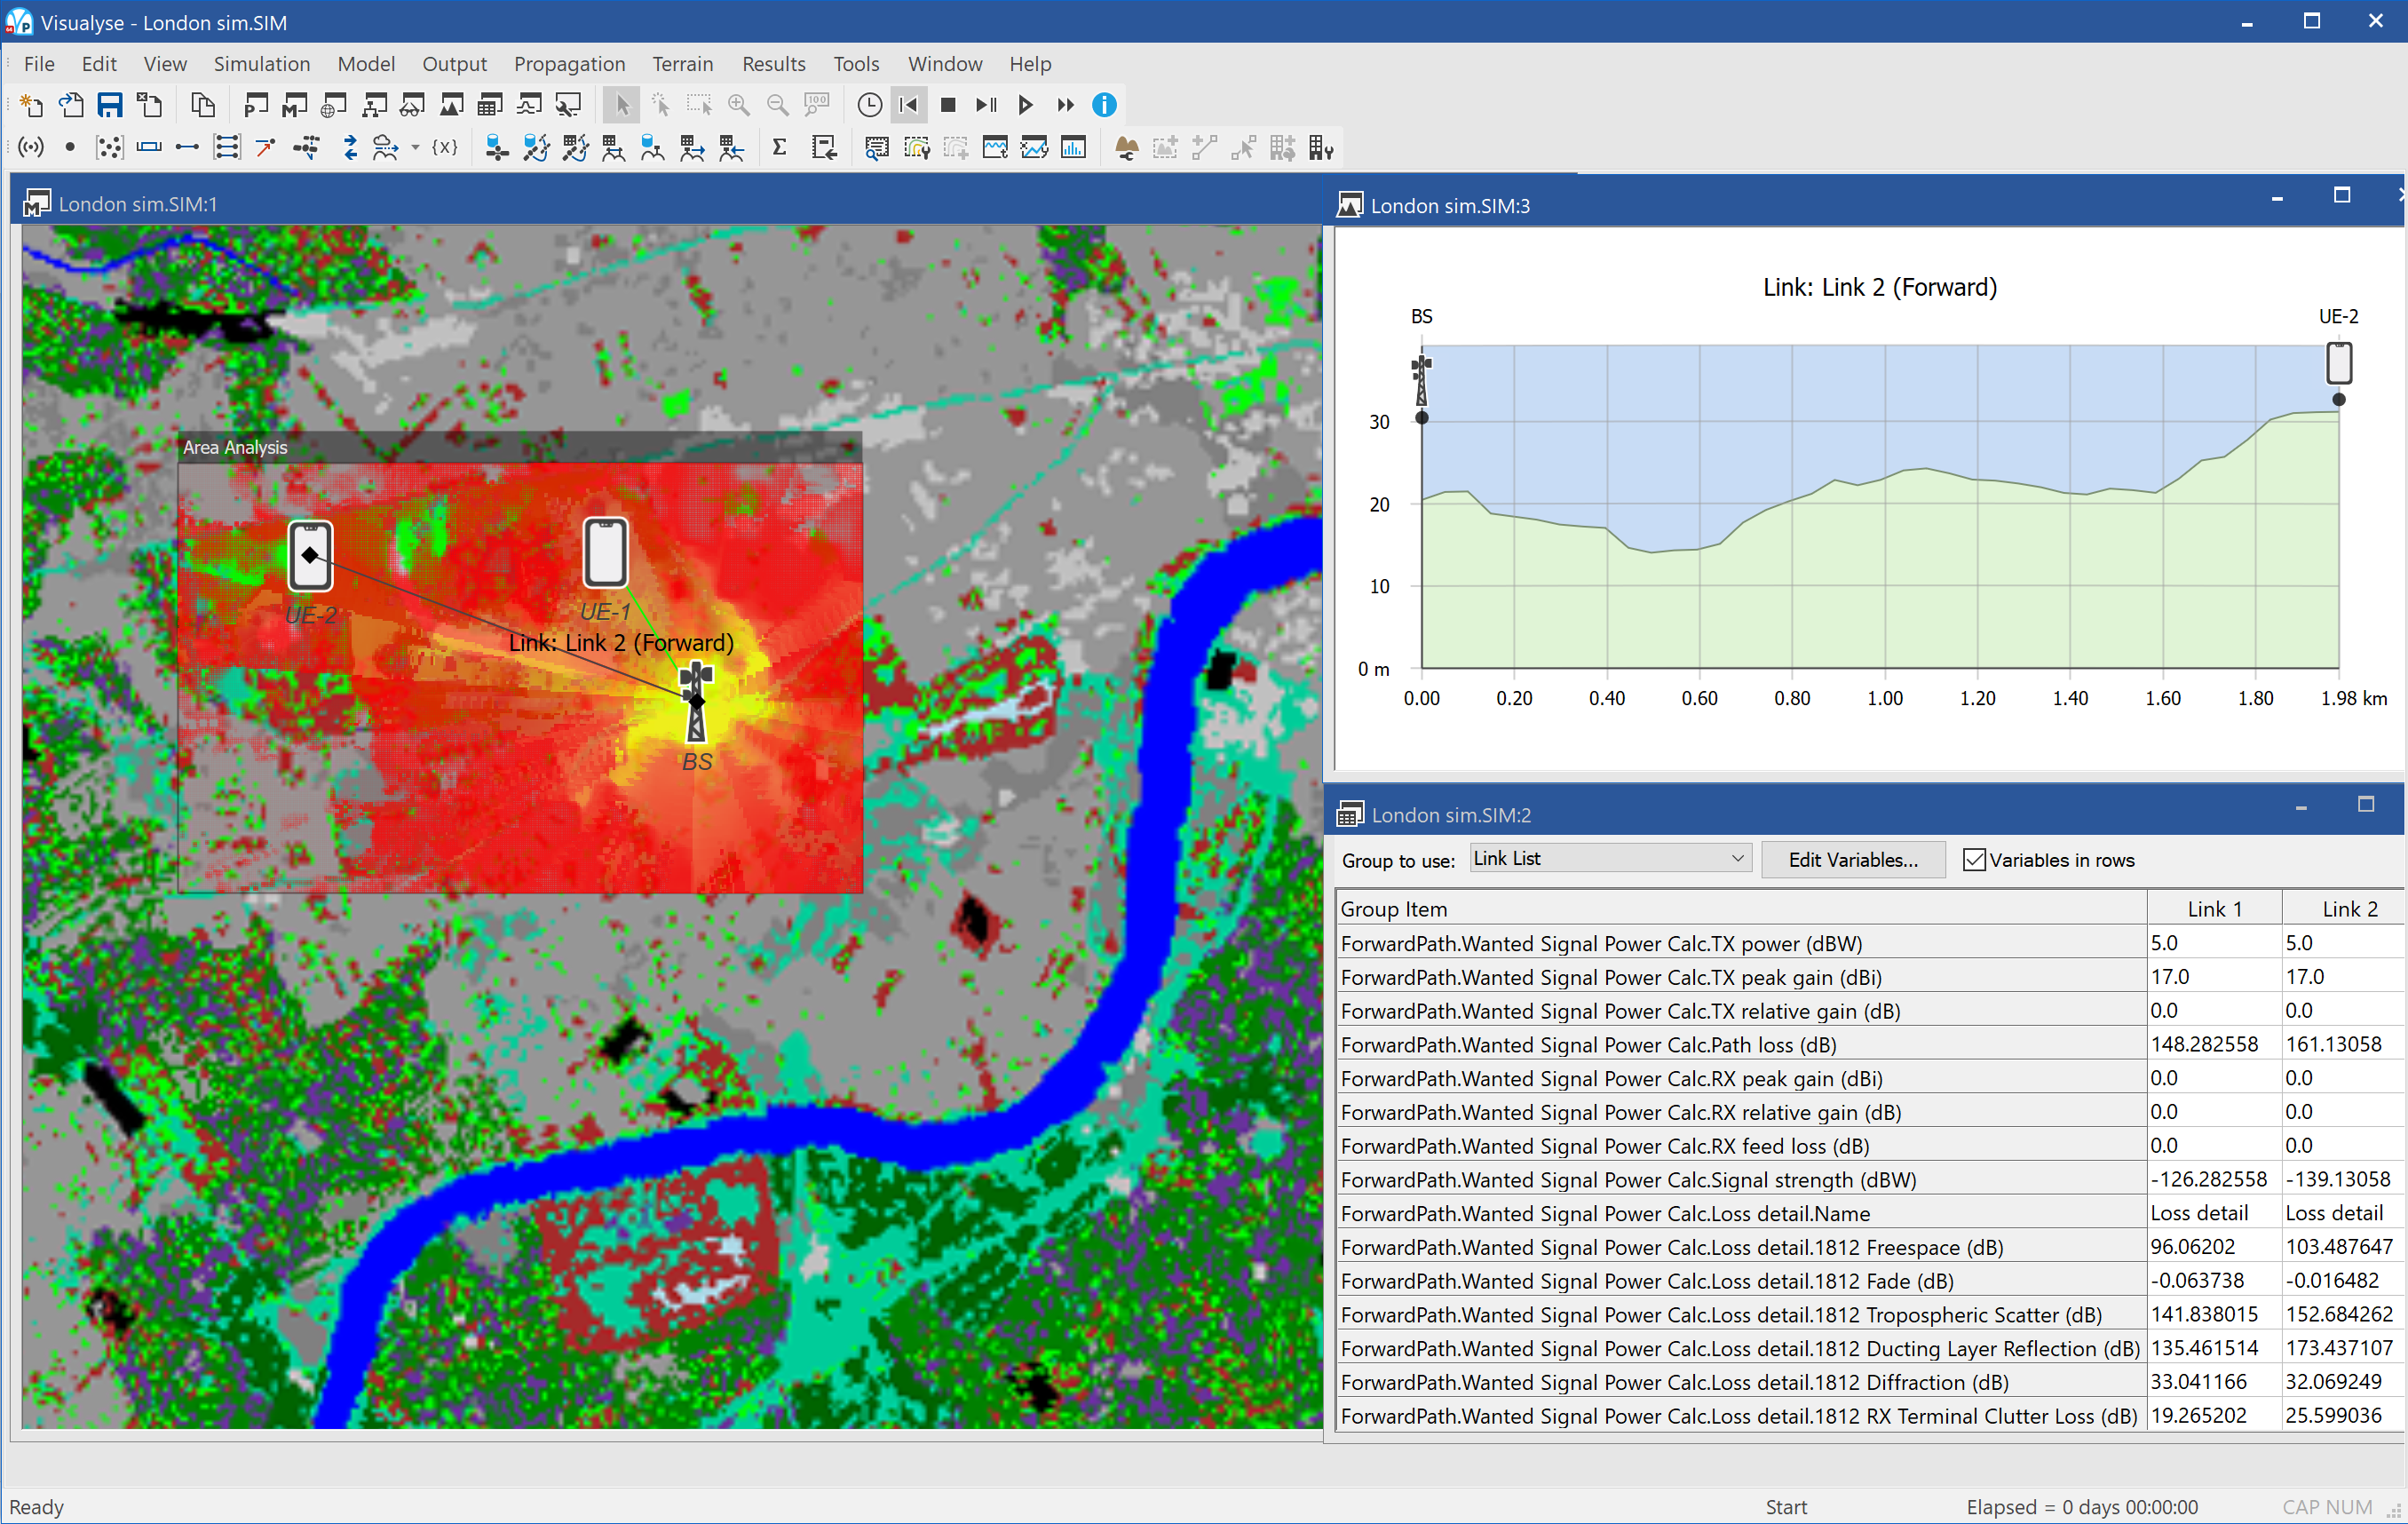
This example shows coverage in an urban area (London – the blue line is the Thames). It can be seen how the signal propagates further in open spaces such as the park to the north east and south west of the base station (Hyde Park and Green Park respectively). In addition some of the major roads can be seen and the graphic illustrates how the received signal can be greater along them.
Clutter Features in Visualyse Professional
To include clutter modelling in Visualyse Professional you need to be aware of all the various components and where they can be found on the menus. This section gives an overview of all clutter related features in Visualyse Professional.
Land Use Database Interface
The starting point for using clutter is to interface to one or more sources of land-use data. This can be found on the “File” menu under “Land Use Data Sources” and is described in more detail in Land Use Database Interface.
Land Use Region
When Visualyse Professional has been configured to interface to a land use database, it must then be told whether to load the data and over which geographic locations. This is done in a similar way to terrain regions in that you select a geographic region for which you want data loaded. This can be done interactively after selecting the toolbar cursor option or using the “Land Use Region Manager…” that can be found under the “Terrain” menu option.
More information is given in Land Use Regions.
Propagation Models
With a land use region loaded it can be used within link calculations via the propagation model, either via one of the propagation environments or via a link specific propagation model. The land use data can be used within the following models:
- Recommendation ITU-R P.452
- Recommendation ITU-R P.1546
- Recommendation ITU-R P.1812
- Extra losses
If a land use database is not available then values can be entered by hand. More information is given in Using Land Use Data.
Watch Window
The resulting clutter loss calculated using the propagation model and the land use data can be seen in the watch window along with the other propagation loss fields and will be included in the received signal strength calculation (whether wanted or interfering).
Maps and 3D View
The land use region can be displayed on the Plate Carrée and Mercator maps, and on the 3D View. Each land use code can be displayed by a different colour and shown as one of the overlays found under the View Properties dialog. The land use data overlay can be configured like any of the other overlays, including:
- Changing display order
- Changing transparency level
- Changing tint colour
The colour to use for each land use code is set via the land use database “Configure source” dialog that can be accessed from the “File” menu option “Land Use Data Sources”.
More information is given in Showing Land Use Data.
Land Use Database Interface
Interface Management
The first step to using land use data in Visualyse Professional Version 7 is to configure the interfaces to the sources of data. This is a “Visualyse” level operation in that the changes you make here will impact all simulations you open.
The interface will depend upon the land use database available to you and provided by us. We have provided an example clutter database together with associated interface and plan to develop more in the future: if you have a specific requirement please do not hesitate to contact us.
The example land use database interface is based upon UK specific coordinates as described in more detail in the Technical Annex.
The interface will depend upon the land use databases available to you and provided by us. At the time of writing the following interfaces were shipped by default.
-
Generic Clutter Data – variable resolution and coverage.
Uses the file format as described in the Technical Annex, so if you can convert your data into this format it can be read into Visualyse Professional.
-
Generic GeoTIFF Clutter Data (Generic GeoTIFF) - variable resolution and coverage.
Note: data in this format is loaded by first adding the “Generic GeoTIFF” database in “Land Use Data Sources” then opening “Land Use Region Manager”, selecting “Load Region”, choosing "GeoTIFF Format (*.tif)” from the file type and then selecting an appropriate GeoTIFF file. This land use format does not support the click-drag terrain interface.
-
Generic GRC Clutter Data- variable resolution and coverage.
Note: data in this format is loaded by first adding the “Generic GRC” database in “Land Use Data Sources” then opening “Land Use Region Manager”, selecting “Load Region”, choosing "GRC” Format (*.grc)” from the file type and then selecting an appropriate GRC file. This land use format does not support the click-drag terrain interface.
-
Generic GRD Clutter Data - variable resolution and coverage.
Note: data in this format is loaded by first adding the “Generic GRD” database in “Land Use Data Sources” then opening “Land Use Region Manager”, selecting “Load Region”, choosing "GRD Format (*.grd)” from the file type and then selecting an appropriate GRD file. This land use format does not support the click-drag terrain interface.
-
Ofcom Clutter Data - 50m data for the U.K
This data is for Ofcom (UK) use only and not generally available.
-
OS Binary Clutter Data (OS 50m) - 50m terrain database for the U.K
This is legacy data included for backwards compatibility.
Note that the example land use data supplied with Visualyse Professional is copyright Infoterra Ltd. For additional land use data please do not hesitate to contact us to discuss your requirements.
The “File” menu option “Land Use Data Sources…” opens the following dialog:
This dialog can be used to:
- Add an interface to a new source of land use data
- Delete an existing interface to land use data
- Edit an existing interface to land use data
- Configure the source of land use data (change definitions of land-use codes, colours to display on map etc.)
These are discussed in more detail in the sections below.
Adding a source of Land Use Data
If you click on the “Add Source…” button a list of available land use database interfaces will be shown, as in the figure below.
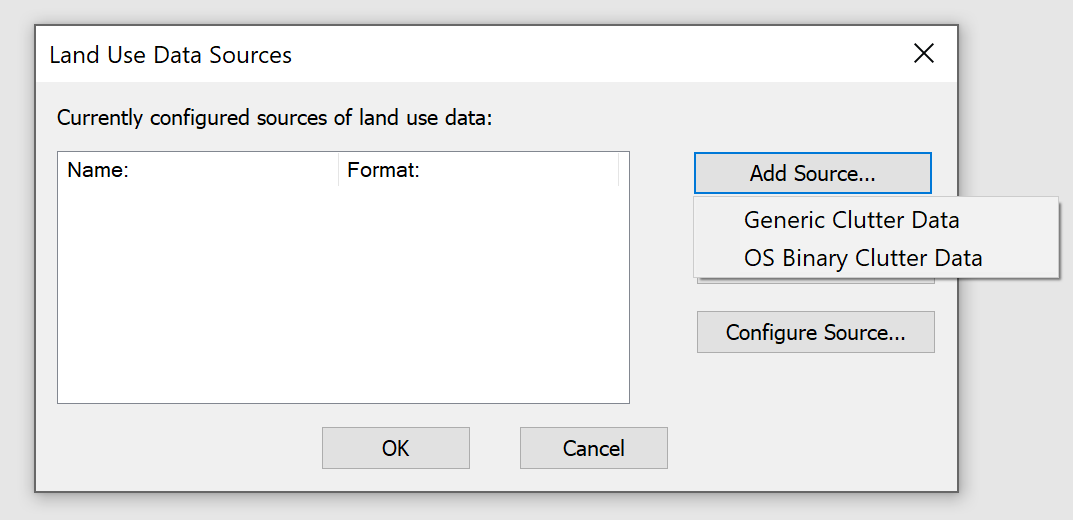
The list is generated from the land use database interface DLLs that are found in the “\Visualyse 7\Program\Clutter DLLs” directory by Visualyse Professional when it starts.
If you select the interface you wish to add you will then be given the option to select what name to call that source of land use data and configuration options such as directory or path to where the data can be found, as in the two figures below.
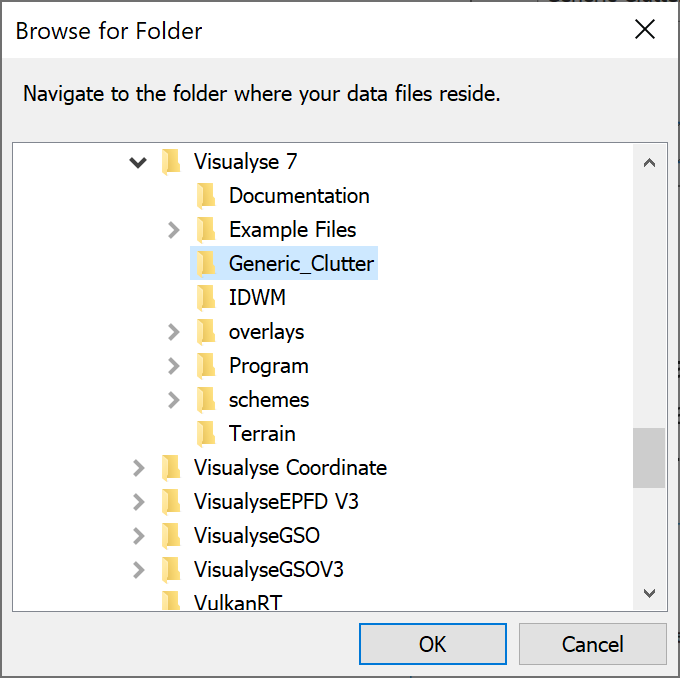
The land use data source will then be added to the list of those available.
Deleting Source of Land Use Data
You can remove an interface to a land use database by selecting it from the list and clicking on the “Delete Source…” button. A dialog will ask you to confirm, as shown below.
Note deleting a land use source will also impact on your ability to load files that referred to that source of clutter data and that any configuration options would have to be re-set.
Edit Source of Land Use Data
This option allows you to rename a source of land-use data and / or alter the directory identifying where the data is stored.
Configuration of Land Use Data
Land use databases typically contain for each pixel within a geographic area a code describing how it is used. Examples of typical types of land usage include:
- High City
- City
- High Urban
- Urban
- High Suburban
- Suburban
- etc.
The definition of what comprises the differences between these categories is not standardised, and different land use databases can have subtle and not so subtle variations.
Hence it is necessary to define a translation mapping between these codes and how they are used within the various propagation models and also to specify how they are displayed on the map. This is done via the land use data configuration dialog, as in the figure below
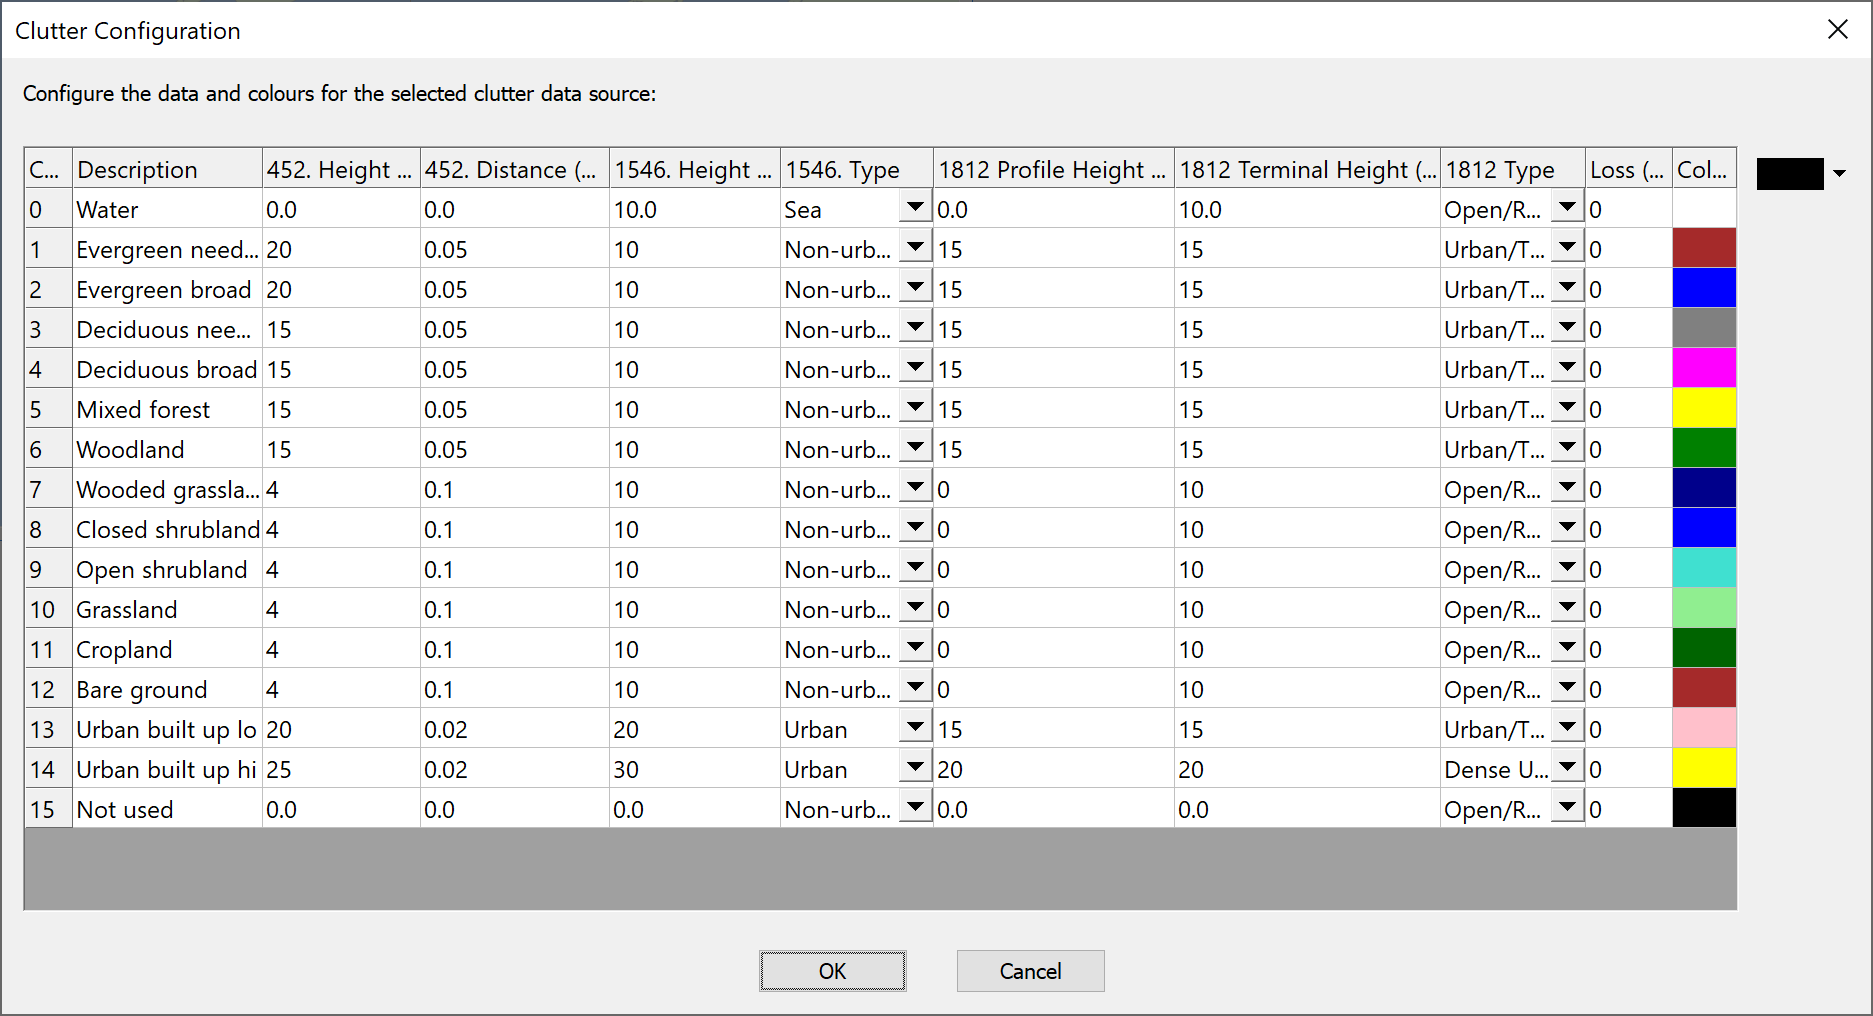
This dialog can be used to specify for each land use code:
- The parameters to use within Rec. ITU-R P.452, namely height and distance of obstacle
- The parameters to use within Rec. ITU-R P.1546, namely height of clutter and type (urban or non-urban)
- The parameters to use within Rec. ITU-R P.1812, namely height of clutter and type (urban or non-urban)
- The loss to use within the extra propagation models
- The colour to show this land use category on the maps and 3D view
Note this configuration data should be selected as being consistent with the source of data. As the values used will affect the results of the simulation, care must be made that all PCs that run the simulation have the same land use configuration options. To facilitate this the Export and Import buttons enable the settings to be Saved/Loaded to a CSV file.
Land Use Regions
Selecting Land Use Regions
Land use databases can be extremely large and it would represent a significant overhead to load the complete database. In addition there are times when you want to calculate propagation loss without use of a clutter database – for example when doing smooth Earth calculations.
Therefore it is necessary to specify on a simulation by simulation basis whether you want to use land use data and if so what geographic area should be loaded. This is then the “Land Use Region” and can be shown on the maps and 3D view and also used within propagation calculations.
Land use regions can be created in one of two ways:
- Using the mouse to select the area of interest as in the following section
- Specifying the area explicitly using the Land Use Manager (see below)
Interactive Creation of Land Use Regions
You can select an area within which to load land use data by selecting the “New Clutter Region” icon on the tool bar ![]() and then using drag and drop to select the region of interest on the map or 3D views.
and then using drag and drop to select the region of interest on the map or 3D views.
If you have more than one land use data source available for the area selected, you will be shown a list and should select the most appropriate one. If no land use data is available from any of the available sources you will see a warning message similar to the one below.
Land Use Region Manager
This dialog, as shown below, is on the “Terrain” menu and can be used to manage clutter regions.
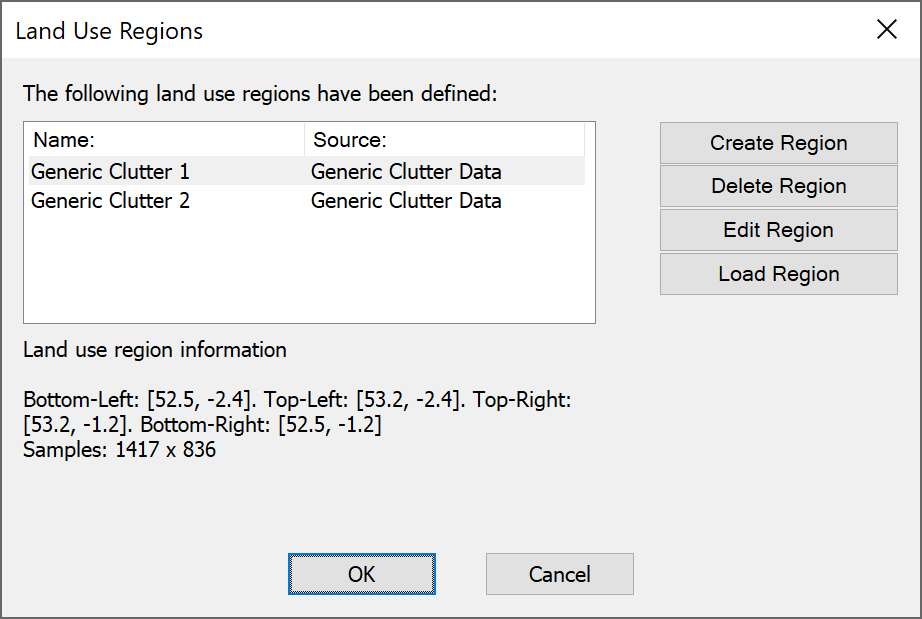
On the left is a list of land use regions currently loaded in the simulation, while on the right buttons to create, delete, and edit a region. The parameters of the currently selected land use region are shown in the information section at the bottom.
New regions can be created and existing ones edited using the following dialog:
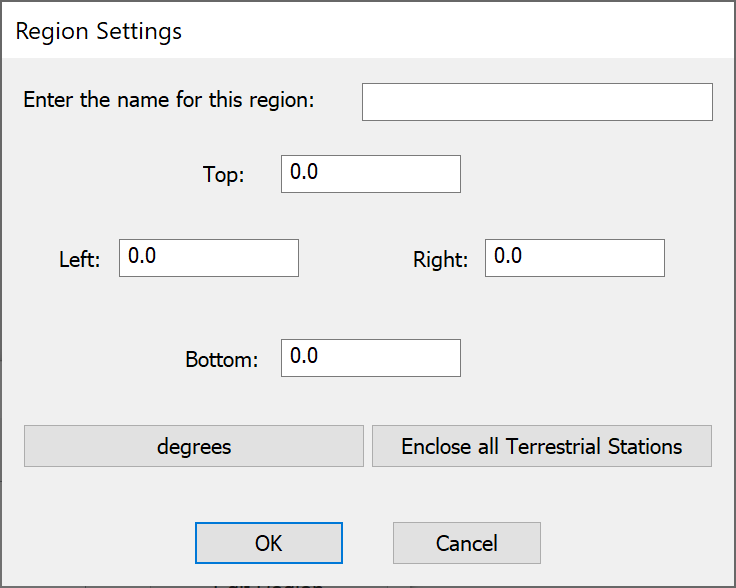
You can specify or change:
- The name to use to display the land use region
- The maximum latitude of the land use region
- The minimum latitude of the land use region
- The maximum longitude of the land use region
- The minimum longitude of the land use region
You can change the units to show or specify the regions extent in radians or using degrees, minutes, seconds with format:
[N/S/E/W] DD:MM’SS.SS”
Another button can be used to create a land use region that just covers the locations of all the stations currently in the simulation.
Using Land Use Data
The land use data can be used within Visualyse Professional to calculate clutter loss on a link as part of the propagation modelling. This is described in more detail in other parts of the User Guide.
Clutter loss calculations can be part of the following propagation models:
- Recommendation ITU-R P.452
- Recommendation ITU-R P.1546
- Recommendation ITU-R P.1812
- Extra loss models
For ITU-R P.452 you can either get Visualyse Professional to calculate the clutter loss using the land use database or enter the distance and height to clutter at either ends of the link explicitly, using controls as in the figure below:
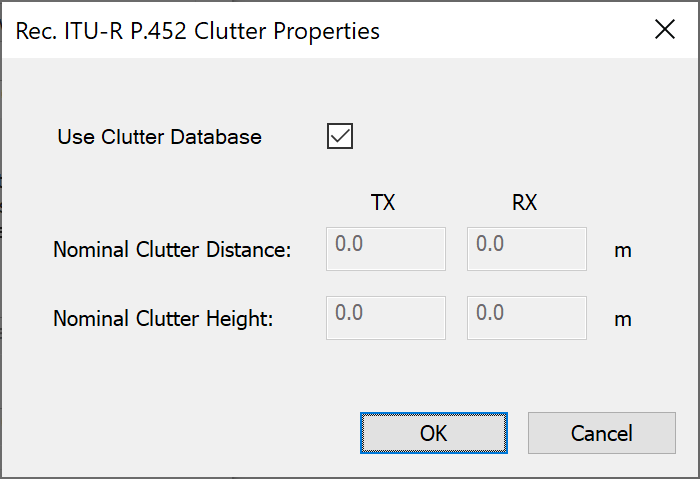
For ITU-R P.1546 you can either get Visualyse Professional to calculate the clutter loss at the receiver using the land use database or enter the environment and clutter height explicitly, using controls as in the figure below:
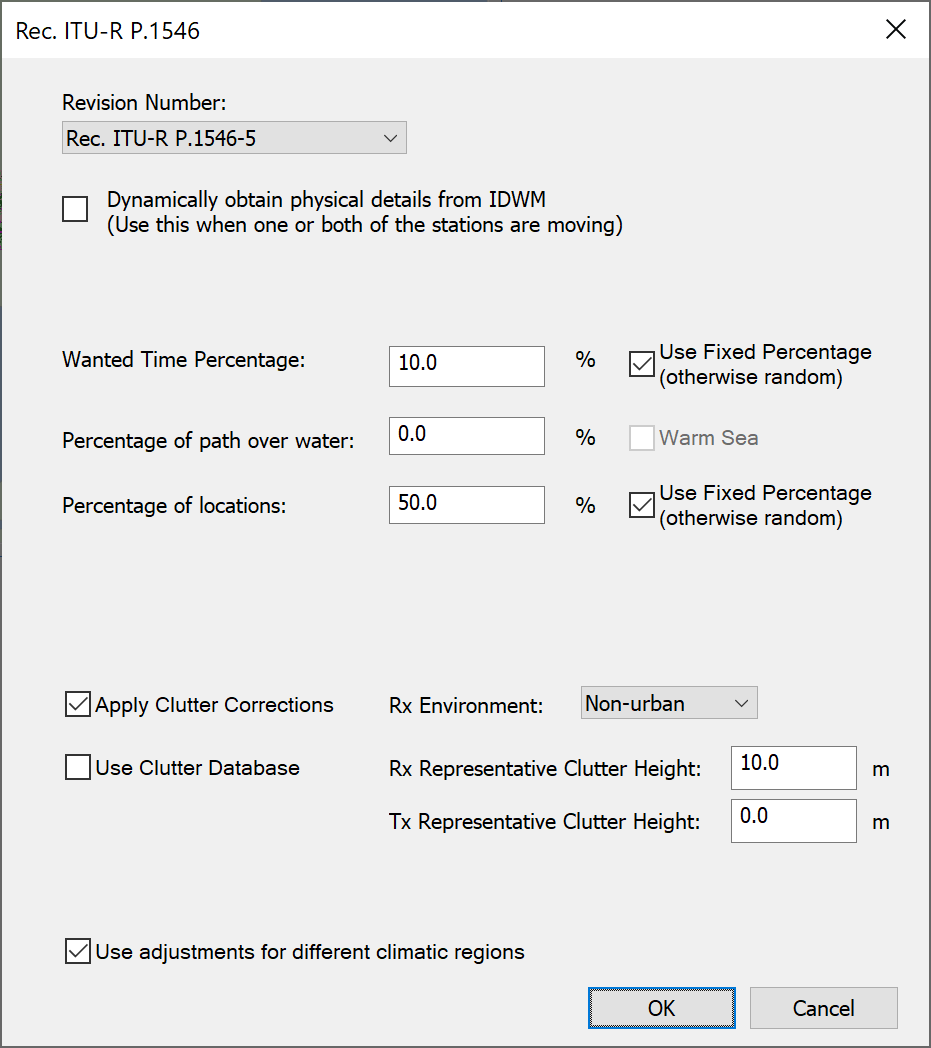
Recommendation ITU-R P.1812 has the similar configuration options as P.1546, as shown below.
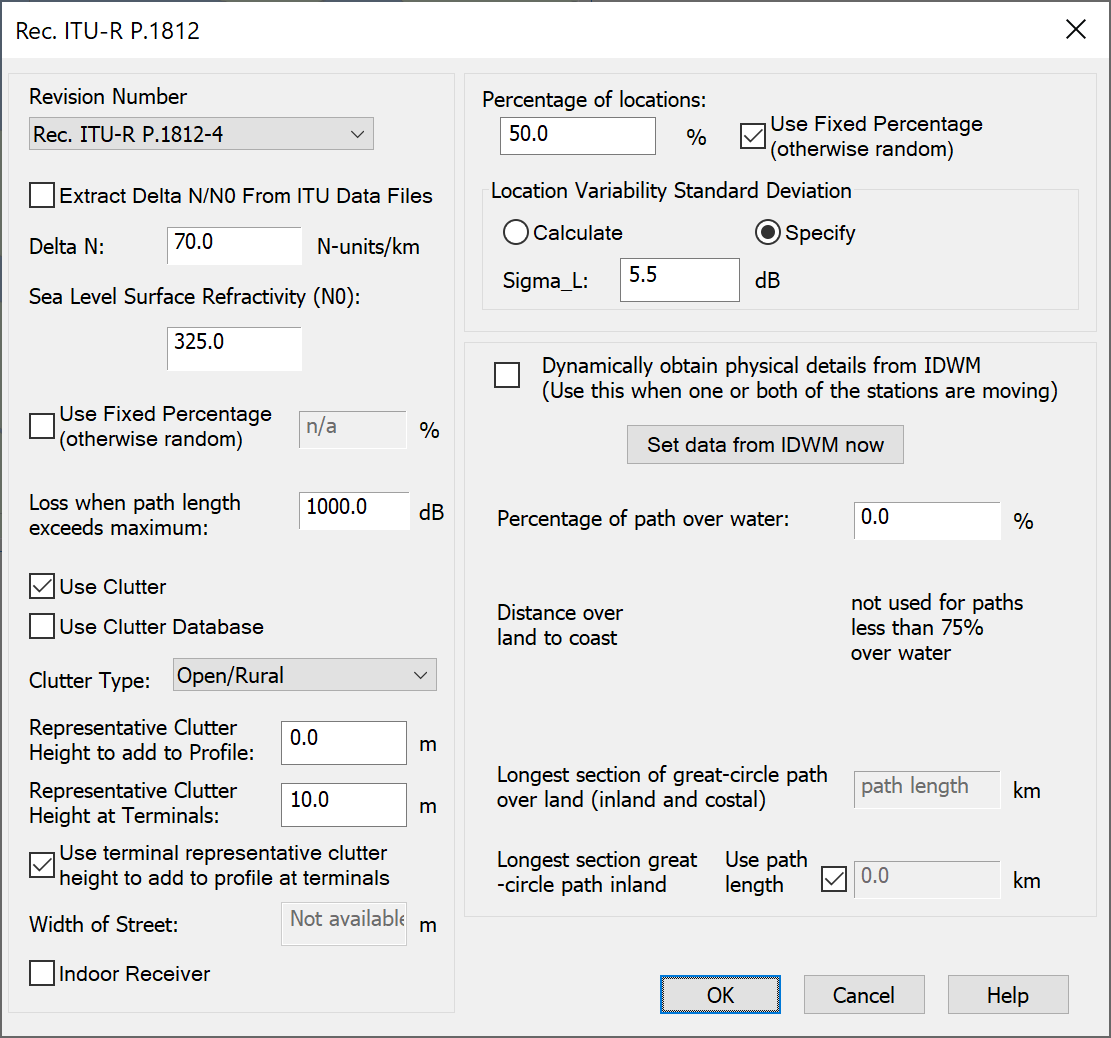
The configuration options for the extra loss models are shown below:
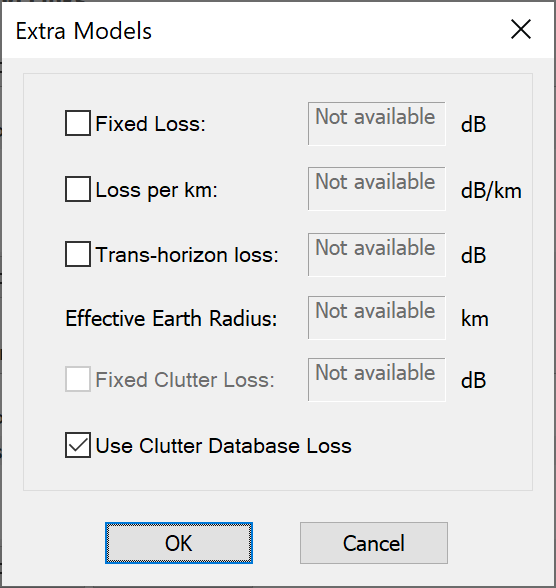
The extra loss model can be used to include user defined clutter loss models. If the value is calculated for a known receiver height for each land use category it can be entered in the configuration dialog and then accessed via look-up using the extra loss “Use clutter database loss” option.
The clutter loss is stored within the path loss field and can then be displayed in watch windows as in the figure below.
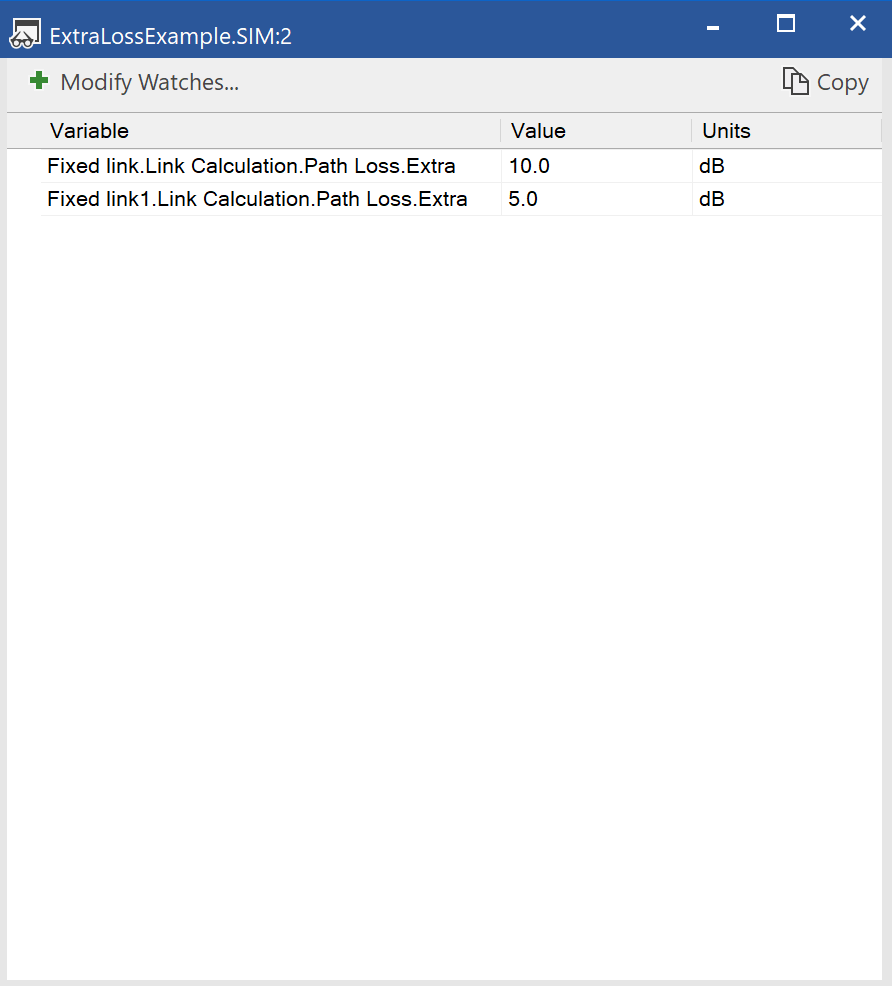
Showing Land Use Data
The land use regions loaded can be shown on any map or 3D view. Each pixel is displayed using the colour selected in the configuration dialog.
The land use data comprises another “overlay” along with terrain data, user defined overlays (such as maps) and area analysis.
The management of the overlays is described in more detail in the view configuration sections of the User Guide.
The following should be noted:
- It is easy to overload the view with too many overlays: select the ones you want and hide others
- The most important overlays should be highest on the list and less important ones lower down
- The level of transparency of each overlay can be used to show more or less of the lower layers
- Colours of land use pixels can be selected to avoid clashing with other overlays. For example in the example below the area analysis of coverage from a base station is in red and yellow, hence these colours are not used in the selection of land use colours.
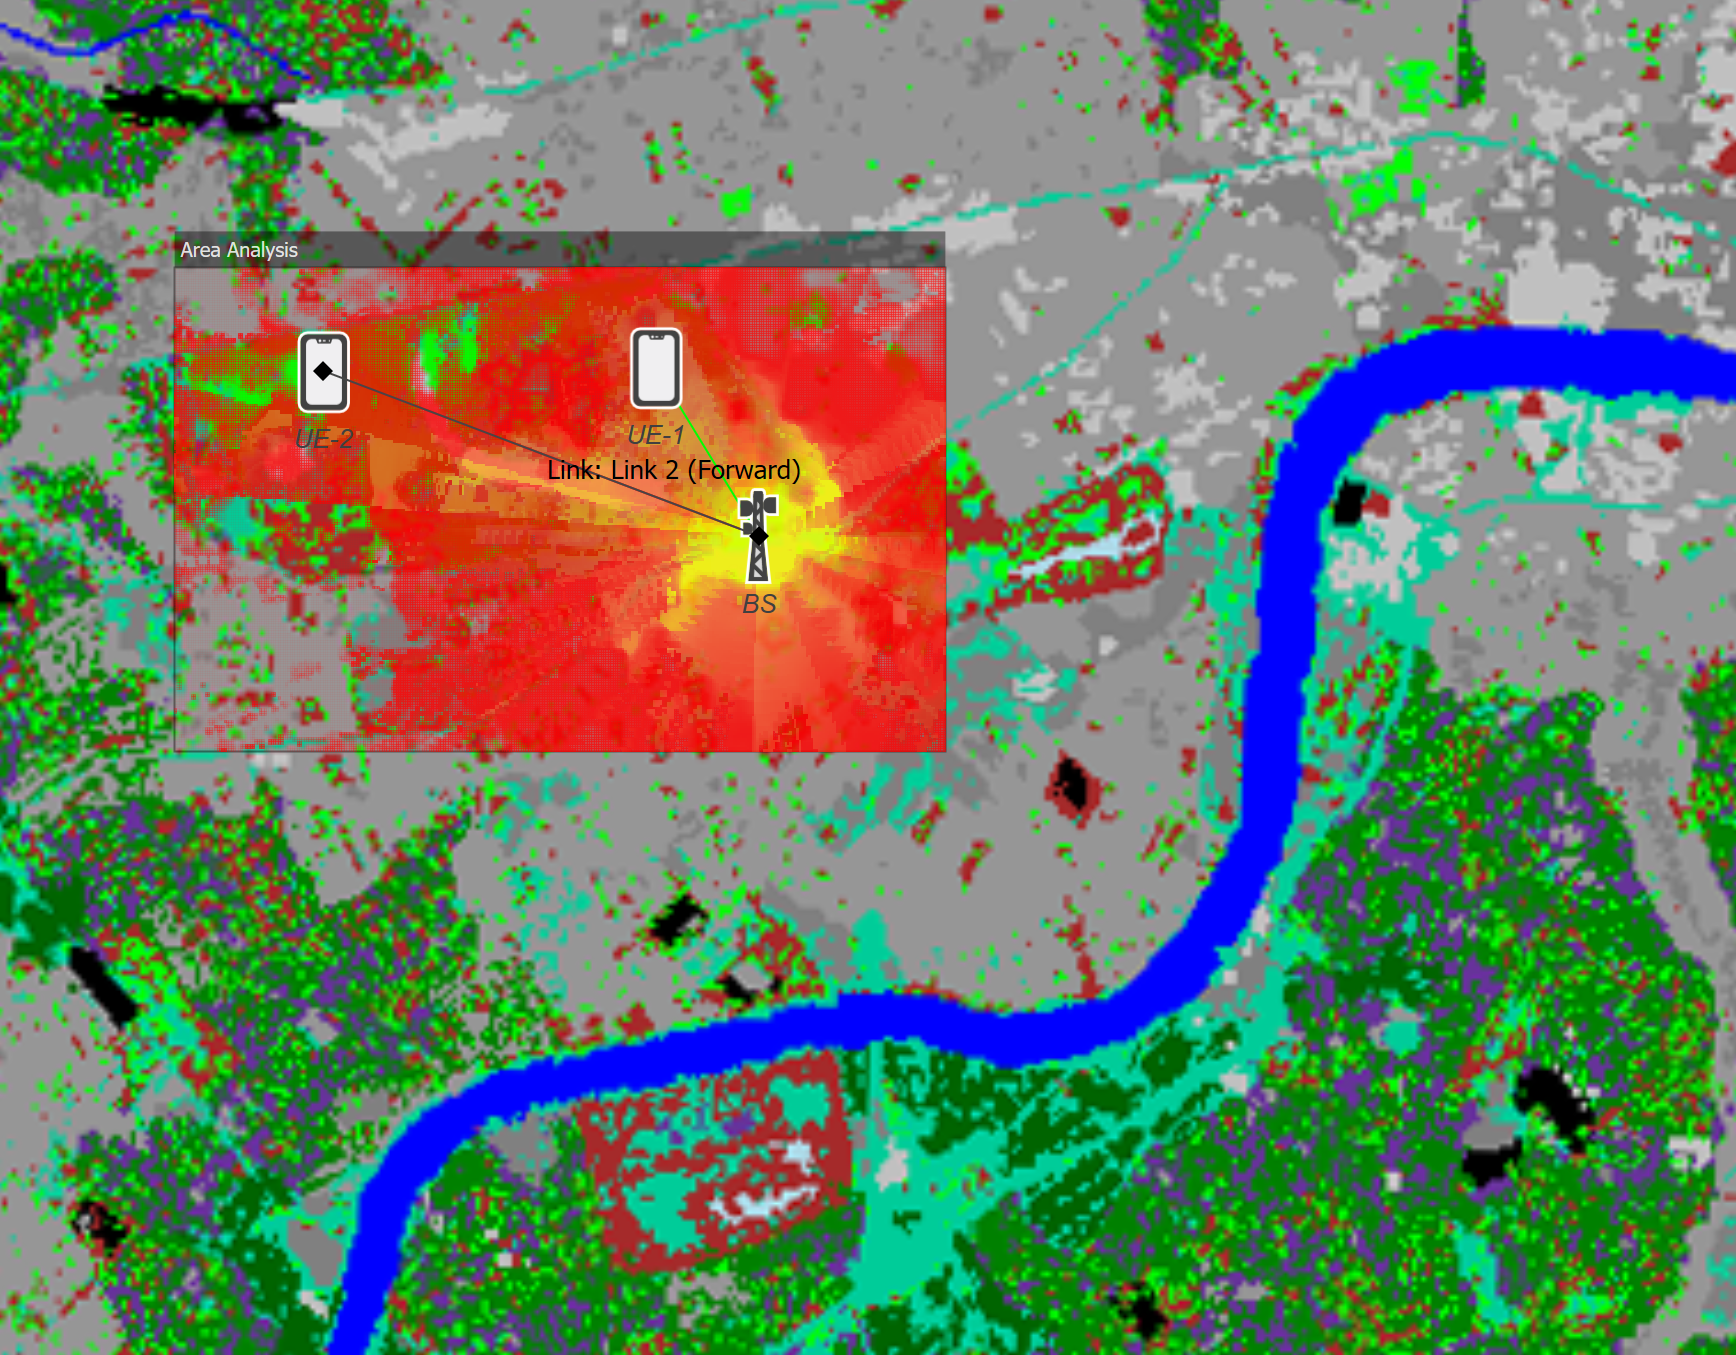
This example shows coverage in an urban area (London – the blue line is the Thames). It can be seen how the signal propagates further in open spaces such as the park to the north east and south west of the base station (Hyde Park and Green Park respectively). In addition, some of the major roads can be seen.
Traffic Module
Introduction
Communication links are not always active, but can switch on and off over a period of time. For example, in a terrestrial mobile system, the link between a mobile phone and the nearest base station is sometimes on and sometimes off. The state of the link depends on several factors:
-
Is the owner of the phone making a call?
-
Is the mobile phone located inside an exclusion zone where transmissions are prohibited?
-
Can the nearest base station handle the call or is it already serving the maximum number of users?
The transmit characteristics of a link can also change over time. For example, in a mobile satellite system, the transmissions from a particular satellite beam may vary in bandwidth and power. These parameters will change according to:
-
The number of handsets using the beam
-
The access method, which can be one of (CDMA, TDMA or FDMA)
-
The maximum operating bandwidth.
Variations in link activity will obviously have an effect on interference calculations. It is therefore useful to be able to model these variations. This is what the Traffic Module is all about.
What is traffic?
Traffic is just another way of saying the amount of activity on a link. This activity can, for example, be caused by:
- Fluctuations in the output from a station (e.g. data link transmissions using TDMA)
- Changes in the number of users of a stations resources (e.g. handsets using beams on an mobile satellite service network)
An example of traffic modelling can be found in the example file “Traffic and Exclusion Zones” which is in the “Others” directory. This shows a simulation where there is an exclusion zone of 5 km around a radio astronomy site and a mobile network base station operating just outside. The mobile’ locations are randomised using the Define Variable Module and the Traffic Module used to give each one an activity factor of 25%.
Modelling Link Activity
The Traffic Module allows you to model link activity at two levels.
At the basic level, you can take a Visualyse Professional link and switch it on and off. The switching process can be determined by several different methods (these are described later). The amount of traffic on the link is ignored. The link is either on or off, it’s as simple as that.
At the advanced level, links can also be switched on and off. However, when the links are on, the amount of traffic can be considered. This traffic level can vary according to time of day or a defined distribution.
Modelling at the basic level would be used for links where the traffic level does not vary or where the variations are insignificant enough to be ignored. For example, uplinks to a satellite in a fixed satellite service (FSS) system may switch on and off throughout the day. However, on these occasions the traffic will always be the same, and the link will transmit at the same power level.
Advanced level modelling would be used for links where the amount of traffic does vary. For example, in a mobile satellite service (MSS) system, the number of active handsets changes over time. This affects the power output from the server satellite and thus any interference that this may cause.
Traffic Objects and Load Links
The Traffic Module is based upon:
- Traffic object: can be used by any link to determine whether the link should be switched on or off. All you need to do is create a traffic object, configure it, and then assign it to your link.
- Load link: load links are used in conjunction with traffic objects to determine the amount of traffic on a link.
If you want to model variations in the level of traffic, you need to use a load link instead of one of the other types of link. In this case, the traffic object will also define the traffic level when the link is switched on.
Sections 6.2 and 6.3 describe these two types of objects in detail.
Traffic Objects
Managing Traffic Objects
Traffic objects are part of the simulation, stored in the .sim file, and managed via a list where they can be created, deleted, duplicated, and modified.
The traffic list can be accessed via the “Model” menu option “Traffic” or by the toolbar icon ![]()
Selecting any of these will open the traffic list, as shown below.
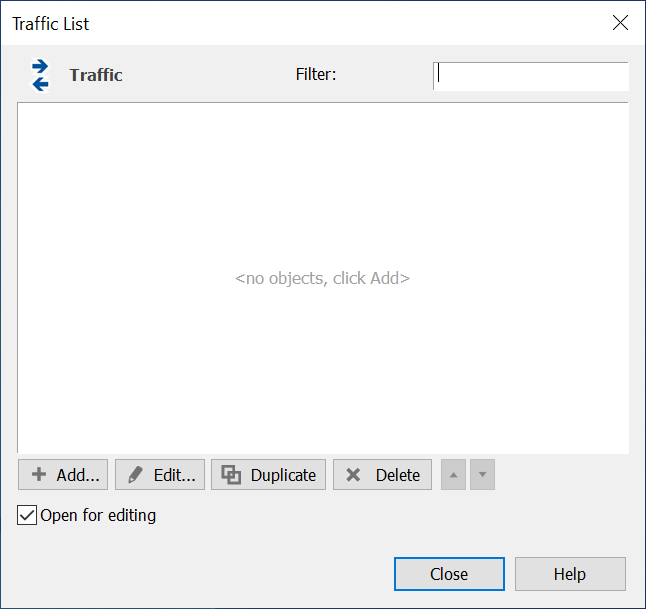
There are four methods for using a traffic object to switch links on/off and to determine traffic levels:
- On
- State Machine
- TDD
- Trigger level
The ability to set the maximum number of active links that can use a single traffic object is available via the option at the top of the Traffic dialog.
In addition, traffic objects can be used to define exclusion zones. These options are described further in the following sections.
Traffic Method On
The On method simply switches the link on permanently. If your link is a load link, then the traffic level used will always be 100%.
The edit dialog for a traffic object is shown below.
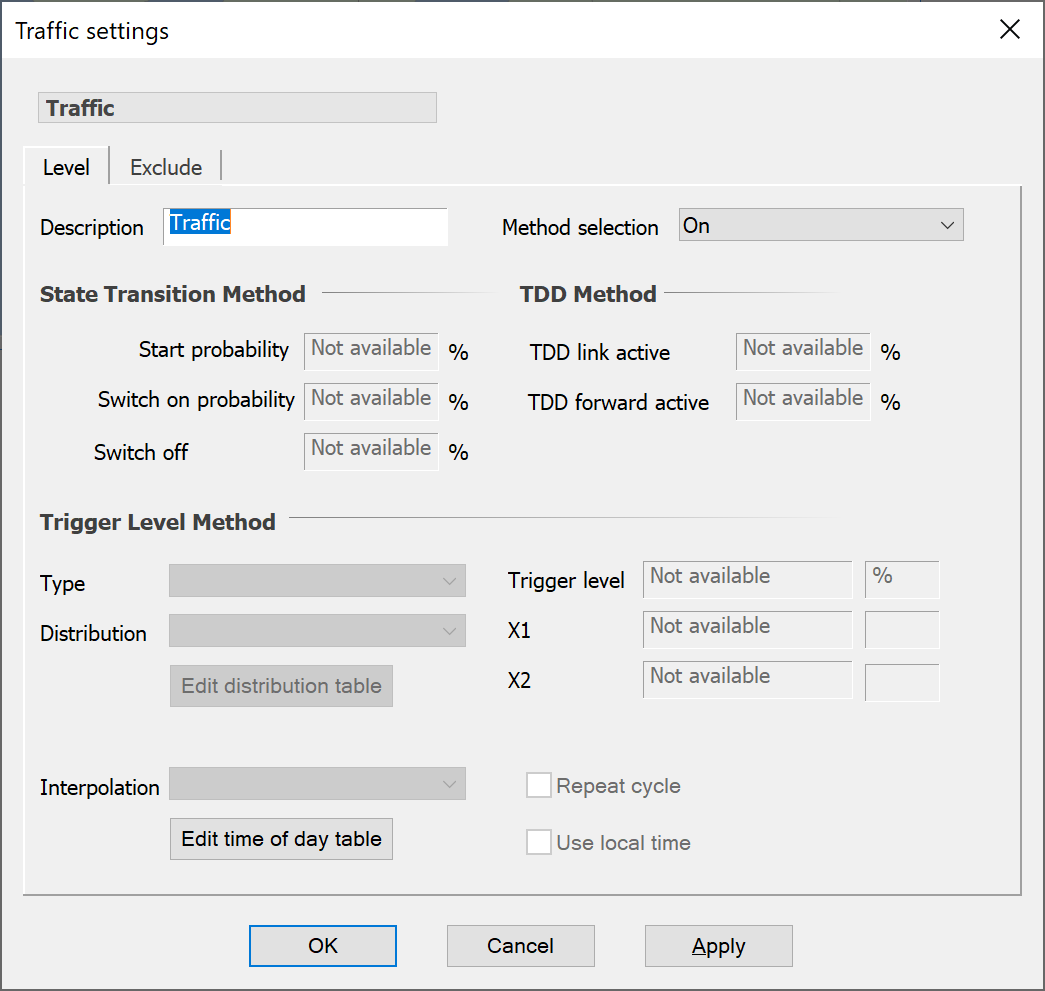
To use the “On” method, simply click on the method list in the method selection area and choose On.
Traffic Method State Machine
A link has two states. It can either be on or off. This method uses probabilities to determine when a link moves from one state to another.
There is a probability of moving from State = On to State = Off and a probability of moving from State = Off to State = On.At the start of a run, the link is in an undetermined state. Hence an additional probability, the probability that the link starts on, is required to determine the initial state of the link.
The state transition diagram is shown in the figure below.
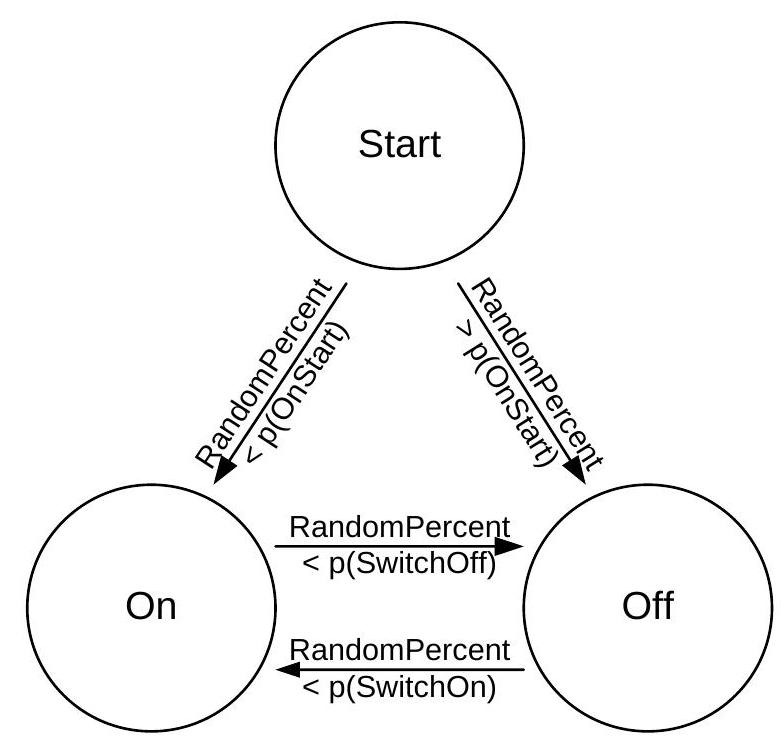
Note that all the probabilities are expressed as percentages.
For the state machine method, if you are using this object with a load link, the traffic level is always 100% when the link is switched on.
If you edit a traffic object, you will be able to see the controls that define this behaviour, as in the figure below:
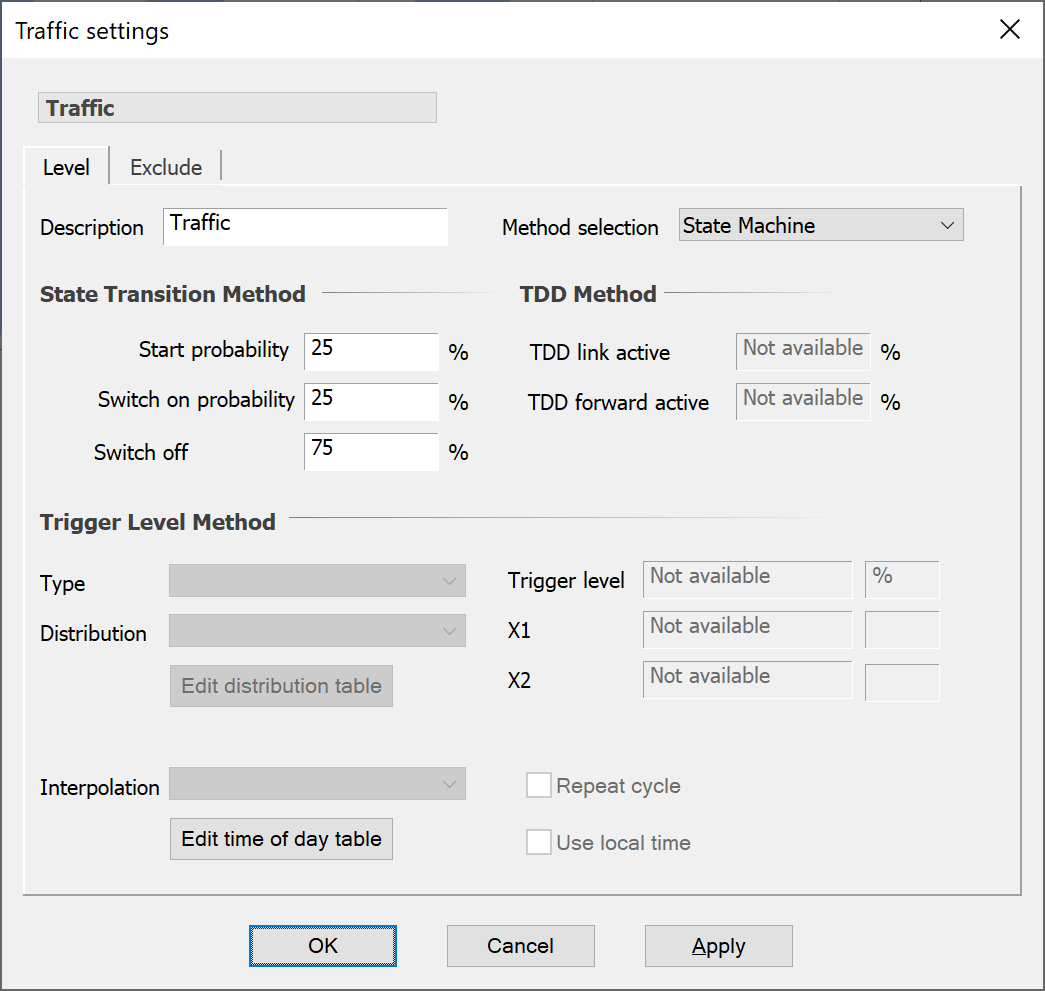
A number of possible methods can be used to select the values to use. The simplest is that if the probability that a link should be active is q (as a percentage), then the values should be set to:
Another possible approach to selecting the values to use is to include a call duration and average number of links required to be active using:
Both these approaches should give the same mean number of links active when applied to sufficiently large number: the principle difference is the average call duration.
Note that the state machine approach generates “calls” with duration having a binomial distribution, whereby the probability of length n-steps = p(Switch Off)^n.
Traffic Method TDD
Mobile networks require two communication directions, the downlink (from the BS to UE) and the uplink (from the UE to the BS). These two paths can either be:
- At different frequencies, typically using a paired block arrangement, potentially both transmitting at the same time
- In the same frequency block but at different times.
These two arrangements, frequency division duplex (FDD) and time division duplex (TDD) are shown diagrammatically in the figure below:
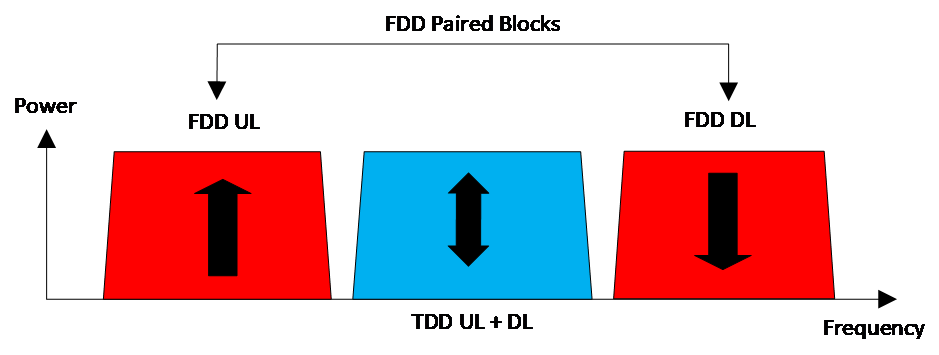
In Visualyse Professional, the frequencies can be entered on a fixed and dynamic links on the startend (forward) and endstart directions (return), and these can be either different (for FDD) or the same (for TDD).
However, a key difference between FDD and TDD is that FDD allows both the UE and BS to transmit simultaneously while typically TDD operation only permits one of these stations to be active at the same time.
A new feature in the Traffic Module allows this TDD behaviour to be modelled. The user interface (shown below) allows the following to be defined:
- Likelihood as a percentage that the link is active in any direction (whether forward or return)
- Likelihood as a percentage that the link, if active, is active in the forward or startend direction
- When activated the TDD Synchronised options enable, at each time step, all links that use this Traffic object to have the same state in terms of Active and or Direction.
The likelihood that the link is active in each direction is then:
Forward TDD link active TDD forward active
Return TDD link active TDD forward active
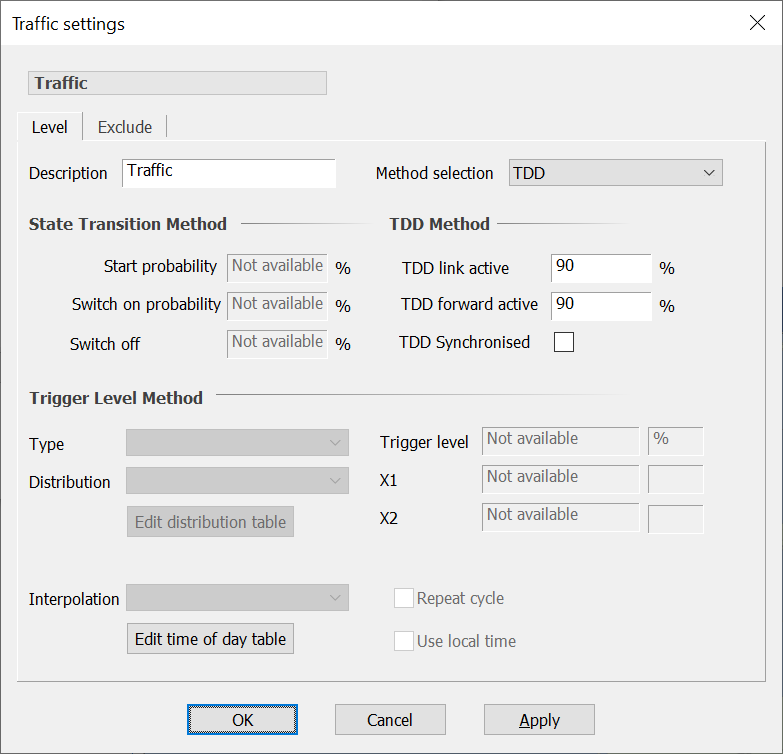
This traffic object can then be selected on the fixed or dynamic links traffic tab:

For other link types:
- Transmit links and TDD traffic models: the link will be active if the forward direction is active
- Receive links and TDD traffic models: the link will be active if the forward direction is active
- Load links: the TDD model will not have an impact
Note that if one direction is active then the tx/rx stations will be configured (i.e. antennas pointed) in both directions but the signal only calculated in the direction that is active.
Traffic Method Trigger Level
This method uses either a time of day profile or a distribution to determine the level of traffic at each time step. The traffic level is then compared to a trigger level in order to determine whether the link is on or off.
If the traffic level exceeds the trigger level, a link using the traffic object will be switched on. If the traffic level falls below the trigger level, a link using the traffic will be switched off.
Note that if the traffic object is used by many links, switching is determined for each link individually.
There are three trigger level methods:
- Time of day: a threshold is set and at each time step compared against the level in a time of day table: if the table is above the threshold then the link is considered active else the link is idle
- Distribution vs. Time of day: at each time step a random number is generated according to a pre-defined distribution and compared against the level in a time of day table. If the random number is above the table the link is considered active else the link is idle
- Distribution vs. Fixed: a threshold is set and at each time step a random number is generated according to a pre-defined distribution. If the random number is above the threshold the link is considered active else the link is idle
Each of these options is described in more detail below.
Time of Day
This method uses a table that defines the traffic level at various times throughout the day.
The key stages are:
-
In the traffic object, select “Trigger level” from “Method selection”
-
Select in “Type” the option “Time of Day”
-
Enter the threshold as a percentage
-
Enter a time of day table, with time in minutes since midnight and level as a percentage, as in the figure below
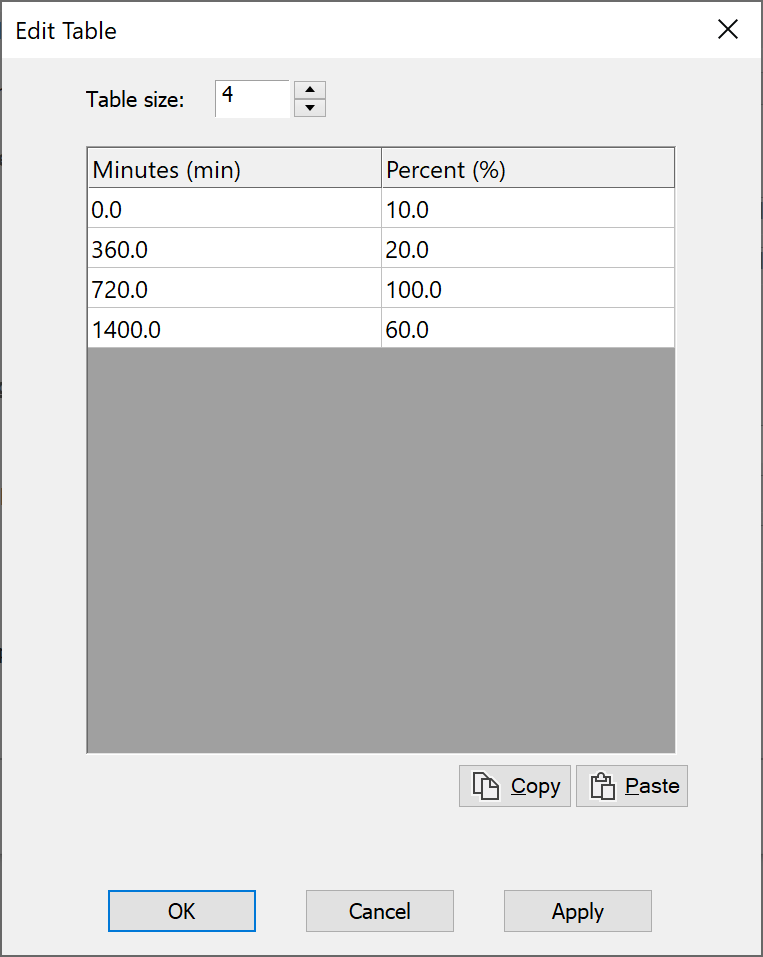
-
Select what to do when reach the last time in the table using the “Repeat cycle option”
-
Select whether to use simulation time (UTC) or the transmit station’s local time
Because the table represents traffic levels for a discrete set of times, you need specify how the level is calculated in between these times. This is done using an interpolation method, selected from the Interpolation list.
Visualyse Professional provides the following interpolation methods:
- Linear: this is standard linear interpolation. If the required value does not lie in between two entries in the table, the value for the nearest entry is used.
- Linear Extrapolate: this is the same as Linear, except that when the required value does not lie in between two entries in the table, extrapolation outside the bounds of the table is allowed.
- Linear Check Equal: this is the same as Linear. However, if the required value falls between two entries which have the same value then the two previous and two following entries are used to generate two lines which are then used to determine the required value.
- Linear Check Equal Extrapolate: this is a combination of Linear Check Equal and Linear Extrapolate.
- Polynomial: a polynomial is computed from the entries in the table. The interpolated value is then calculated from the polynomial.
- Cubic Spline: a cubic spline is computed from the entries in the table and the interpolated value is calculated from this.
- Largest: when the required value falls between two entries, then the largest value of the two entries is used.
- Smallest: when the required value falls between two entries, then the smallest value of the two entries is used.
If you want the traffic level to change only when a time in the table is reached, choose largest or smallest. However, if you want the traffic level to change steadily from one time in the table to the next, choose one of the other interpolation methods.
After the last time in the table has been reached, the process can be repeated, starting at the first time again. To do this, make sure that the “Repeat Cycle” box is checked.
The times in the table are just numbers of minutes and therefore need to be referred to some specific time. This time can either be the start of the simulation or midnight on the start day. To use the start of the simulation as the reference time, make sure that the “Use Local Time” box is checked. To use midnight on the start day as the reference time, make sure that the “Use Local Time” box is not checked.
To define when a link is switched on and off, all you need to do is provide a trigger level. The default value is zero, which means that any link that uses this traffic will always be switched on with a traffic level defined by the time of day profile.
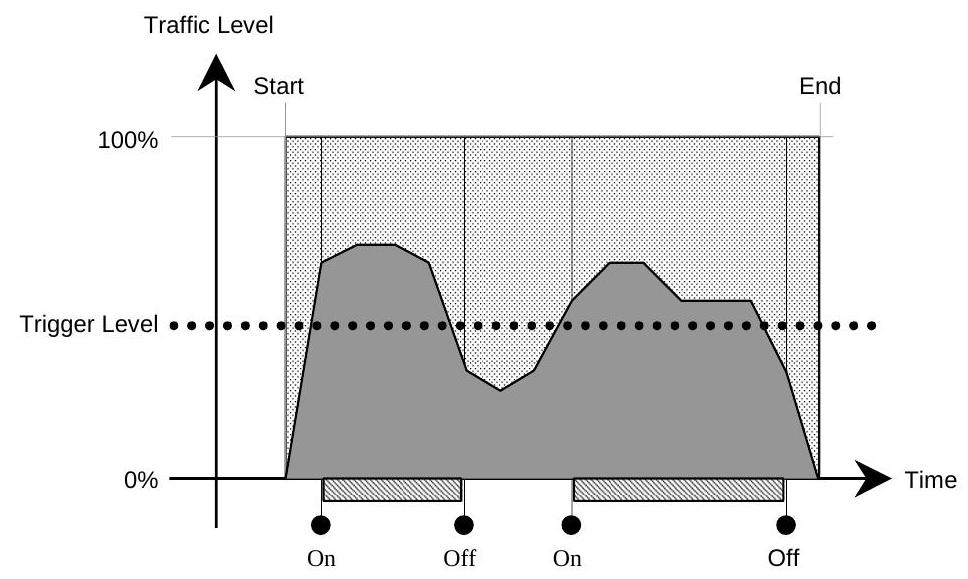
By increasing the trigger level, you restrict the activity of the link to periods when the traffic level exceeds the trigger level.
If you are using this method to provide a traffic level for a load link, then you can effectively ignore the trigger level by setting it to zero. The state of the link would then be determined solely by the time of day profile; the link would be off during periods when the traffic level is zero.
If you are using this method simply to switch a link on and off, then you can choose any traffic levels you wish for your time of day profile. The state of the link is determined by comparing the traffic level to the trigger level, so the actual value does not matter.
For example, the two diagrams below illustrate two different time of day profiles, each with a different trigger level. Both provide the same behaviour when they are used to switch a link on and off.
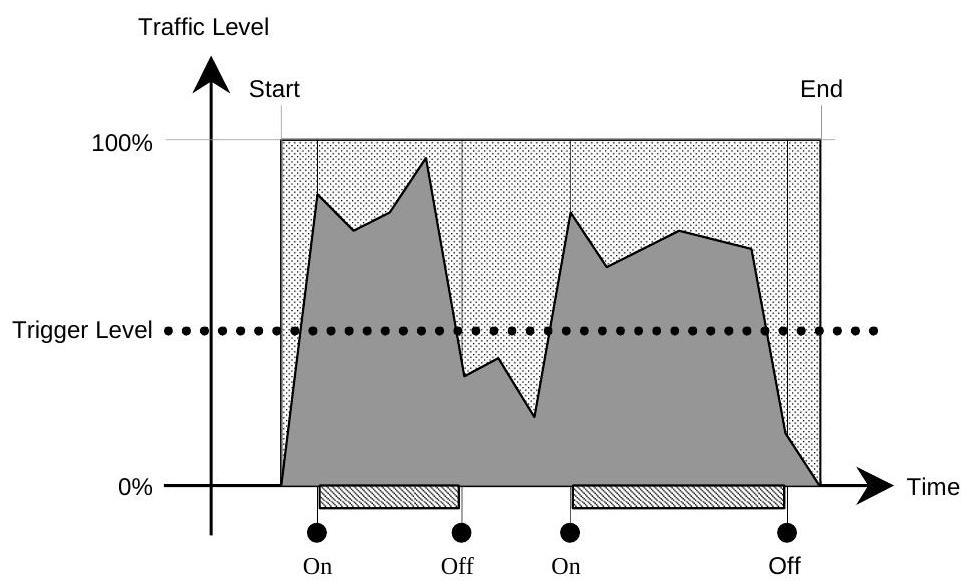
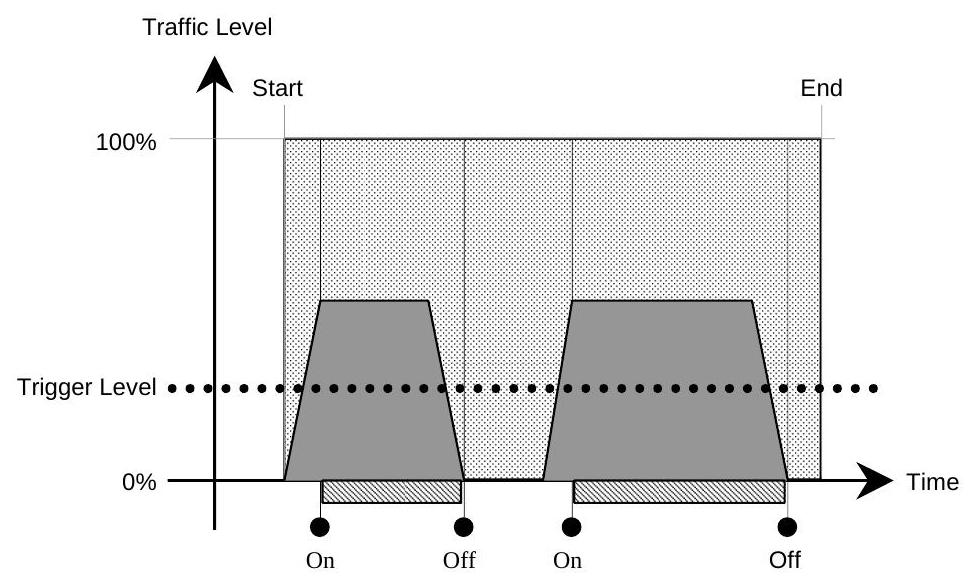
Distribution vs. Time of Day
This method is very similar to the Time of Day method described above. It uses the exactly the same Time of Day table to define variations in traffic levels.
The difference is in the way that the trigger level is specified. Instead of using a fixed value, the value is sampled from a distribution. Hence rather than the link being deterministic, always being active / idle at the same times, the process is more randomised, with the threshold altering the probability that the link is active.
The key stages are:
- In the traffic object, select “Trigger level” from “Method selection”
- Select in “Type” the option “Distribution vs. Time of Day”
- Select a distribution from one of the options as described below
- Enter parameters for the distribution (i.e. mean & standard deviation, or as required)
- Enter a time of day table, with time in minutes since midnight and level as a percentage, as in the previous example
- Select what to do when reach the last time in the table using the “Repeat cycle option”
- Select whether to use simulation time (UTC) or the transmit station’s local time
The trigger level distribution is based on one of 10 different types of distribution. These are:
- Linear
- Normal
- Triangular
- Poisson
- Log Normal - Erlang
- Exponential
- Gamma
- Rayleigh
- Table
Once you have chosen the type of distribution, you then need to define it. The two fields below the “Trigger Level” field will change to reflect the information that is required.
Almost all of the distribution types require a mean value and most of these require a variance as well. For Erlang distributions you will have to provide a k value and for gamma distributions, alpha and beta will be required.
The operation of this method is illustrated in the diagram below.
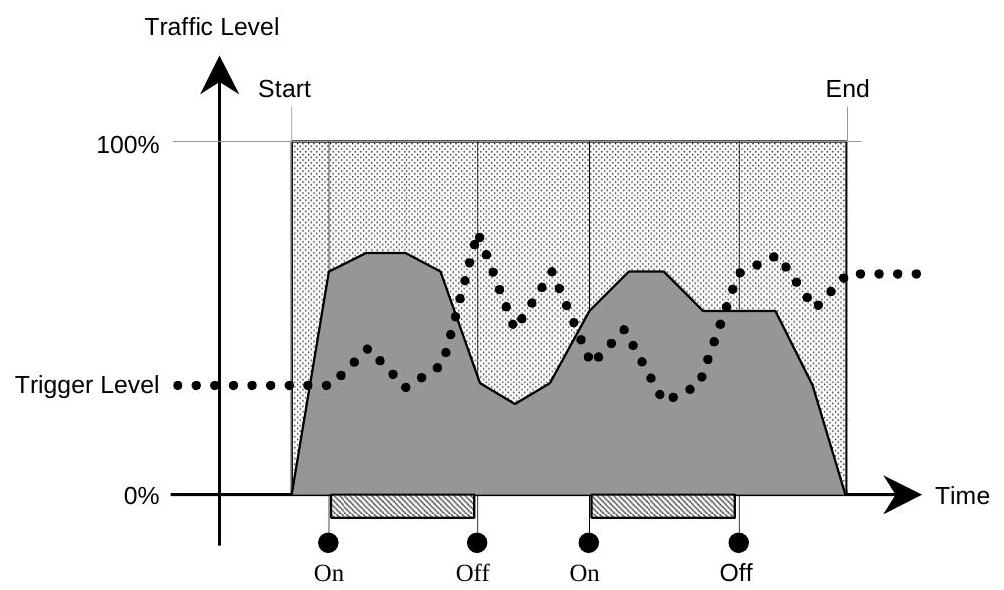
Distribution vs. Fixed
This method samples the traffic level from a distribution. Activation of links is the same as for previous methods: the traffic level must be above a fixed trigger level in order for a link to be switched on.
The key stages are:
- In the traffic object, select “Trigger level” from “Method selection”
- Select in “Type” the option “Distribution vs. Fixed”
- Enter the threshold as a percentage
- Select a distribution and parameters from the list as for the previous example
The diagram below shows an example of how this method works.
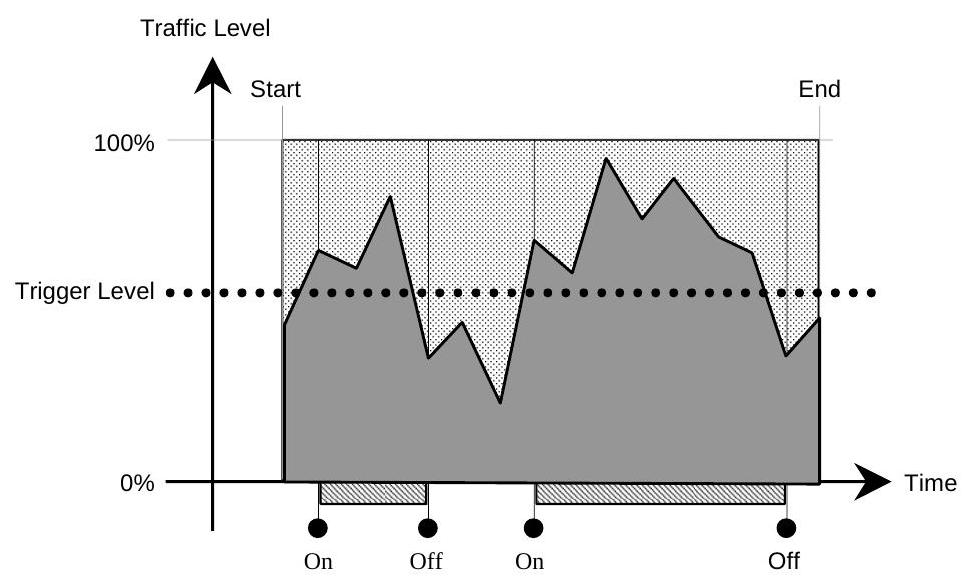
While this effectively is just a convoluted way of defining the probability that the link is active, when combined with load links it can be used to build statistical models of traffic levels using the various distributions.
Exclusion Zones
A traffic object can also be used to prevent transmissions in certain defined areas. These areas are called exclusion zones.
An exclusion zone is defined by a radial distance and a group of stations. If you imagine a sphere of the specified radius, around each station in the group, then the exclusion zone is the volume of space occupied by all the spheres.
Any link that uses the traffic will be switched off if the start or end station lies within the exclusion zone.
To use an exclusion zone:
-
Create a group of stations around which you want to prevent transmissions. These can be marker stations or stations which are used in your interference scenario
-
Edit the traffic object you want to use an exclusion zone with
-
Click the exclude tab (shown below)
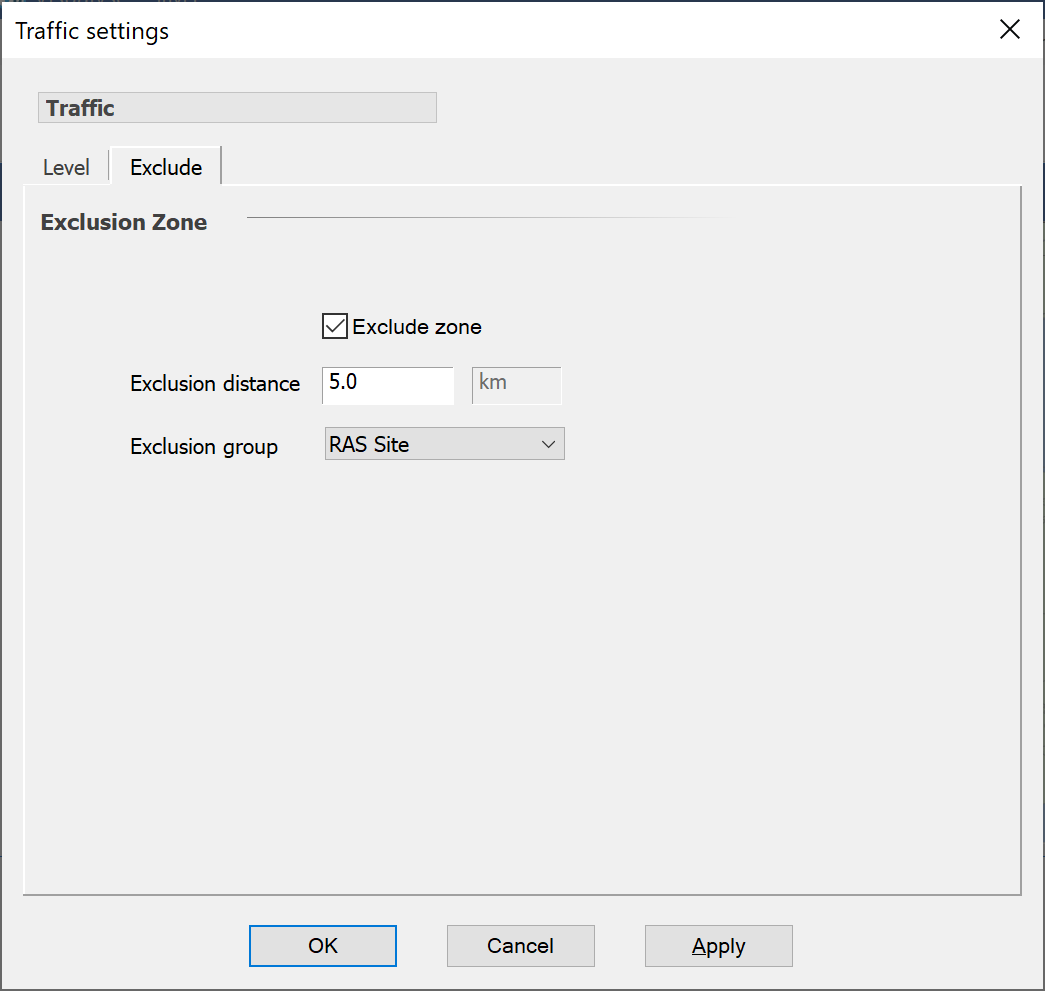
-
Make sure that the Exclusion method has selected one of the following: “< Min”, “> Max”, “< Min or > Max” or “> Min and < Max”
-
Type the radius for the spheres in the appropriate Distance min / Distance max box
-
In the exclusion group list, select the group of stations you want to use.
You can switch the exclusion zone off by editing the traffic object and making sure that the Exclusion method has “Any” selected.
You can use the exclusion zone on its own without the traffic object switching the link on / off by using the traffic method = on.
Associating Traffic Objects with Links
To use traffic on a link, whether to switch it on/off or impose and exclusion zone, select the “Traffic” tab, enable traffic, and then select the appropriate model, as in the figure below.
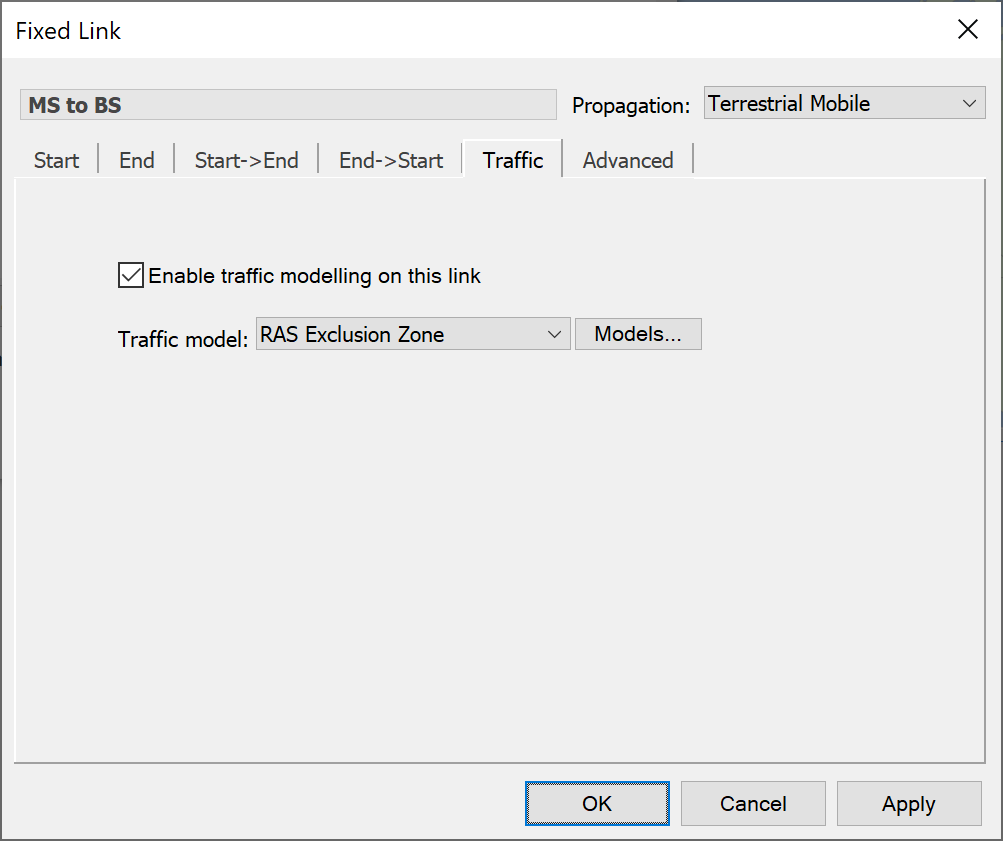
Once associated with a link, a traffic object serves two purposes:
- It determines whether a link is on or off
- If the link is a load link, it determines the traffic level for the link
Any number of links can be associated with a single traffic object.
If a number of links share a traffic object, the state and traffic level is determined individually for each link; one link could be off, another could be on. If the links are load links, the traffic levels for the ones that are switched on could all be different.
There are additional parameters when using traffic objects with transmit links: this is discussed further in Using Traffic Load below.
Load Links
Advanced level modelling of traffic is achieved by using load links. Load links are used to model systems whose link characteristics vary according to traffic levels.
This section describes how to create and use load links. The process of traffic loading is explained in detail.
Overview
Before going into the detail of how load links work, it is useful to have a high level picture of what load links are and what their purpose is.
A load link is similar to a dynamic link in that:
- It has a start and an end station,
- The start station can be named or it can be the end station of another link,
- The end station can be named or it can be selected from a group of stations using a tracking strategy.
However, load links have no transmitting or receiving capabilities. They have no carrier, no powers and no propagation characteristics.
Their purpose is not to provide a signal, but to determine the amount of traffic flow or throughput between the start station and end station. This is achieved by a process called traffic loading: the subject of the next section.
Traffic loading is done in two stages:
- Generation of traffic: determines the potential throughput from the start station
- Traffic Allocation: tries to load this throughput onto the end station
The end result of traffic loading is a load value for each station. This value can be used in its own right as a metric of network loading, or by a transmit link to change transmit characteristics such as bandwidths and powers.
The idea is that you create load links to manage the traffic flow and then create transmit links for all the stations you are interested in. The transmit link provides the signal that can be used in interference calculations.
Example of Traffic Loading
The figure below shows an example where a base station with two antennas is serving four users.
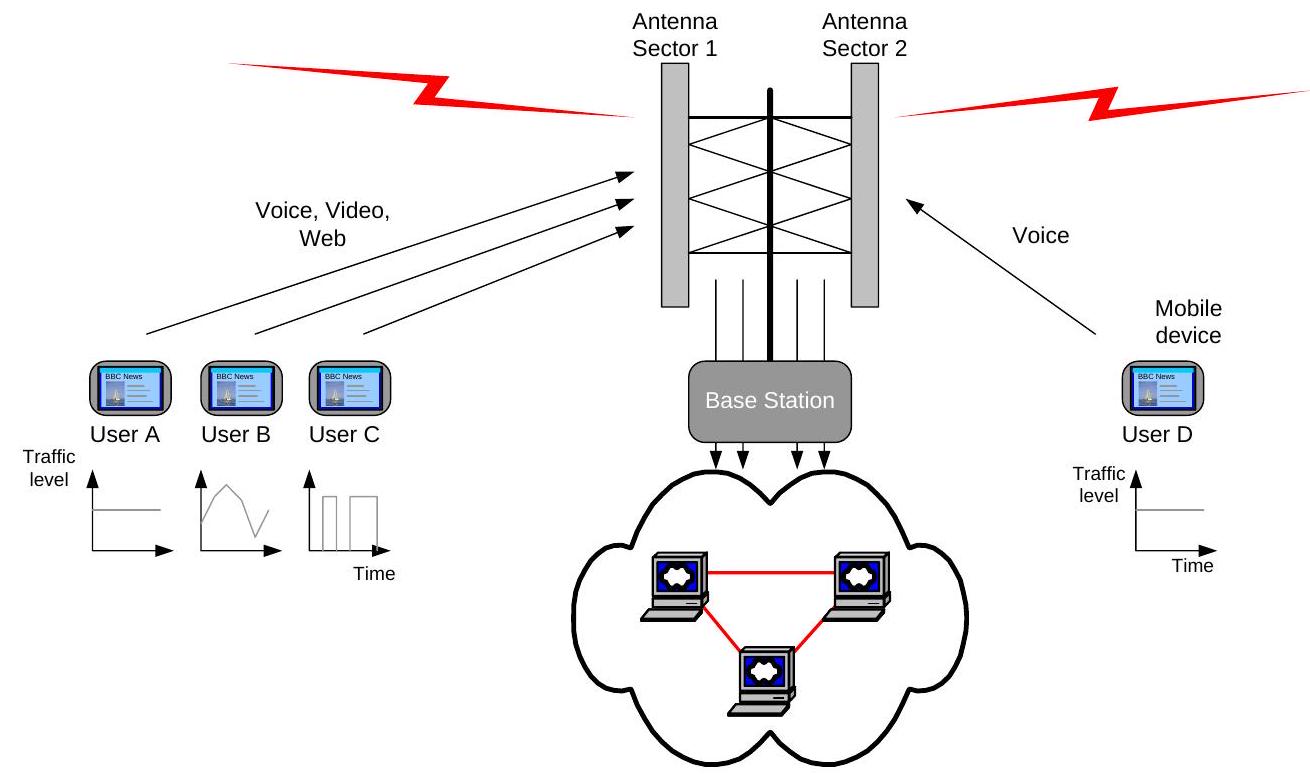
The amount of traffic generated per user varies in time and will depend upon the service type (e.g. voice, data etc.). The traffic level at each time step can be derived from:
- If no traffic object is selected: the station maximum throughput level: in this case it is fixed for the duration of the run, i.e. constant traffic
- If a traffic object is selected: the station maximum throughput level times the percentage of maximum loading specified by the traffic object. In this case the traffic level can vary during the simulation depending upon the model used.
This traffic level is thus associated with the station and can be varied during the simulation using the traffic object.
The load link is then used to manage how this traffic is routed between stations: the start/end pages are used to define the topology – i.e. where traffic flows. This can be to a specific station or assumed to be split between more than one, depending upon whether the load link is configured to use “Multiple Allocation” method.
Multiple load links can be used to accumulate traffic from many stations, which could have different traffic levels and time of day variations. In the example above for example “Antenna Sector 1” receives traffic from three stations - Users A, B, and C - while Antenna Sector 2 receives traffic from just one station, namely User D.
This aggregation must take account of constraints within the network that will limit the maximum that can be handled. These constraints can be at the station level (for example due to limited backhaul) or on an antenna by antenna basis (maximum codes, EIRP etc. within that sector).
Hence it is possible to define in Visualyse Professional the maximum traffic that can be handled by each antenna and station. The aggregation of the load link respects both those limits, and if exceeded there will be traffic unallocated – i.e. from the user’s viewpoint this represents degradation in the quality of service available.
The places to find the key traffic loading parameters are:
- Generation of traffic key parameters:
- Load link’s start station object’s “Maximum throughput”
- Load link’s traffic object (if specified) percentage level
- Allocation of traffic key parameters:
- Load link’s end station selection algorithm
- Multiple allocation algorithm (if specified)
- Maximum “Load” of start station and its antenna’s “Maximum load”
- Maximum “Load” of end station and its antenna’s “Maximum load”
The currently traffic levels can be viewed in the watch window under station and antenna. Any traffic that could not be allocated can be identified in the watch window under the load link.
The outputs from the load links can be twofold:
- Determination of the quality of service using the “load left” to identify if the current network is insufficiently sized to handle the requirements of its users
- The level of interference specified using transmit links can take account of the load level on the associated stations and antennas.
The figure below shows the overall process: note that not all stages are required – for example it is possible to use load links without a traffic object.

The various stages are:
- The traffic level for this time step for this start station is calculated as a percentage of maximum using a traffic object
- This percentage is used with the maximum throughput of the start station to calculate the throughput for this time step for this start station
- The load link’s tracking strategy is used to work out a set of possible stations to assign this load to
- The load link’s assignment algorithm is used to allocate the throughput for this time step for this start station to one or more of the end stations and their antennas & beams
- A transmit link uses its carrier parameters to convert the loading on each of the beams of the stations within the station group into blocks of spectrum with defined (EIRP, bandwidth)
- These blocks of (EIRP, bandwidth) are then used to calculate the interference into a victim, which will therefore take into account the traffic and loading algorithms in the previous steps
Managing Load Link Objects
Load link objects are part of the simulation, stored in the .sim file, and managed via a list where they can be created, deleted, duplicated, and modified.
The load link list can be accessed via the “Model” menu option “Traffic. This will open the load link list, as shown below.
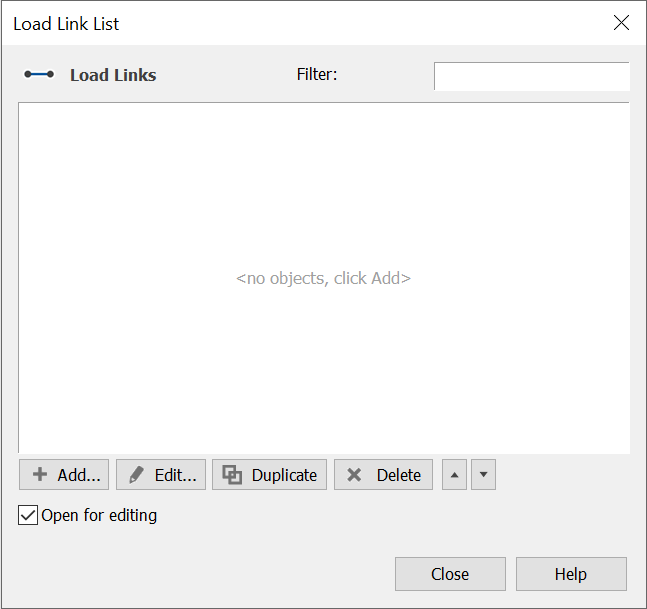
As with all Visualyse Professional objects the name is used to identify it and must be unique for that type of object.
There are four parts to the definition of a load link:
- Start station definition
- End station definition
- Traffic
- Allocation
The start and end stations are specified in the same way as for dynamic links. If you want to know how to do this, you should refer to the user guide for the main program or look in the on-line help system.
You can also choose whether to use a traffic object with the load link using the tab as in the figure below.
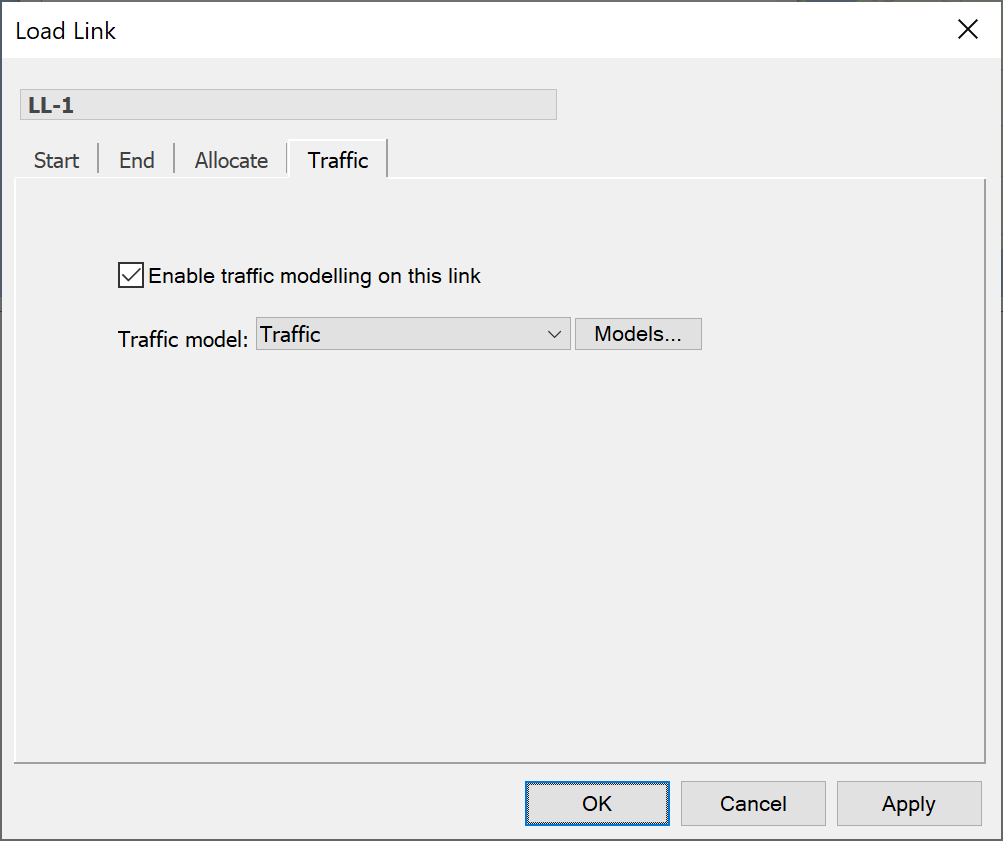
For now we’ll ignore the traffic allocation method. This is an advanced option and will be explained in a later section.
Traffic Loading
Traffic loading is done in two stages:
- Stage 1 determines the potential throughput from the start station
- Stage 2 tries to load this throughput onto the end station
Stage 1
Every station has a maximum throughput. This throughput value can be used to represent data or users depending on the type of system you are modelling.
To change the maximum throughput for a station, simply edit the station and click the “Traffic” tab (shown below).
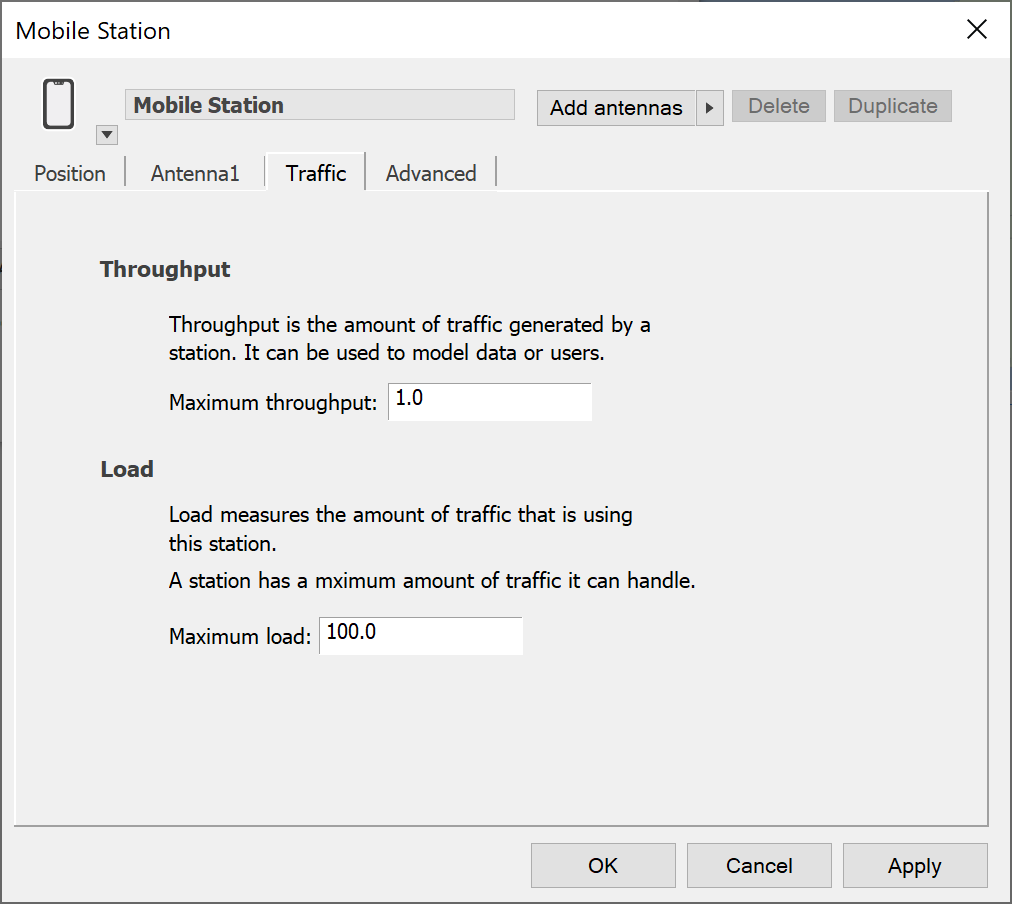
In the “Max Throughput” box, type a value for the throughput.
The load link now needs to determine the throughput from the start station that could potentially be loaded onto the end station. The word potentially is used here because sometimes not all the throughput can be loaded onto the end station. The factors that govern this are explained fully when Stage 2 is discussed.
If the load link uses a traffic object, the potential throughput is calculated as follows:
- The traffic object provides a percentage traffic level based on the traffic method that has been specified.
- The traffic level is then multiplied by the maximum throughput for the start station to obtain the potential throughput.
If the load link doesn’t use a traffic object, the maximum throughput is used.
Stage 2
Once the potential throughput has been established, the load link tries to ‘load’ the throughput onto the end station beam.
The load link can load the beams on multiple end stations (see Loading Multiple Beams). However, to keep things simple let’s assume that the load link has a single named end station.
There are four factors that govern how much throughput can be loaded onto the end station beam. These are:
- the spare load capacity at the start station
- the spare load capacity at the start station antenna / beam
- the spare load capacity at the end station antenna / beam
- the spare load capacity at the end station
We’ll deal with the beams first.
The spare capacity of the beam of an antenna is determined by two properties: maximum load and current load. The beam determines maximum load. This is a restriction on the amount of throughput that can be loaded onto a beam.
To change the maximum load for a beam, edit the relevant antenna, select the beam in question, and then select “Advanced” value in the “Maximum Load” field (shown below for an equation type antenna).
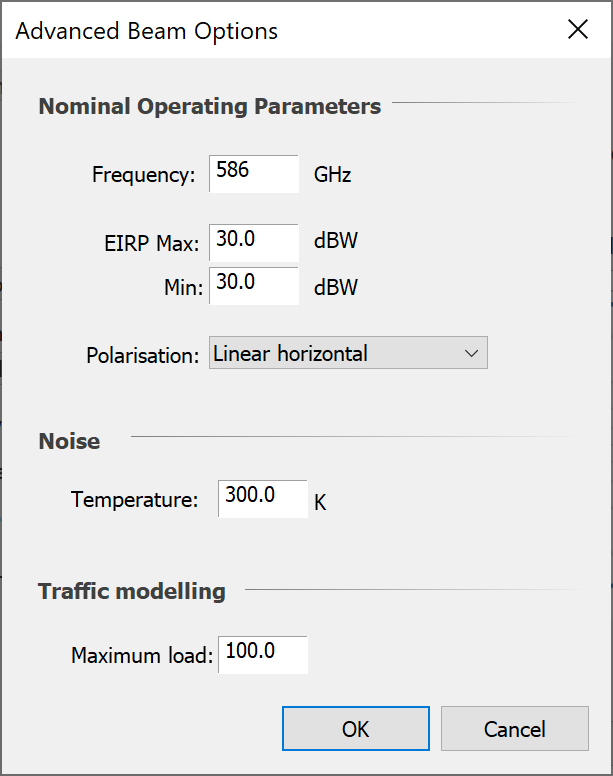
Current load only becomes an issue when multiple load links are loading the same beam of the same antenna. The spare capacity of an antenna’s beam is then the difference between the maximum load and the current load.
The spare capacity for a station is calculated in the same way as it is calculated for a beam. Stations have a maximum load: to view or change this value, simply edit the station and click the traffic tab.
The current load for a station can be displayed by opening a watch window and selecting the stations’ traffic sub-object. The station load is just the sum of the loads on each of its antennas and their beams.
Once a load link has determined the spare capacities of the start and end stations and their beams, it can then attempt the loading process.
The amount of throughput that becomes load is the minimum of all four capacities. This throughput is added to the load values for the start station and the end station beams.
The process is best clarified with an example. The following table shows a possible loading scenario. Load values are quoted for each stage of the loading process.
| Start Station | Start Beam | End Beam | End Station | |
|---|---|---|---|---|
| Stage 1 | ||||
| Max Throughput | 10 | |||
| Traffic Level | 40% | |||
| Potential Throughput | 4 | |||
| Max Load | 8 | 6 | 3 | 4 |
| Load (from previous links) | 4 | 3 | 0 | 2 |
| Spare Capacity | 4 | 3 | 3 | 2 |
| Stage 2 | ||||
| Actual throughput | 2 | |||
| Load (after adding this link) | 6 | 5 | 2 | 4 |
You can see that although the potential throughput is 4, the amount that can be loaded onto the end beam is limited by the spare load capacity of the end station.
Using Traffic Load
The previous section described how variations in traffic levels are modelled by loading stations and beams. This section describes how to use the load on a beam to determine the characteristics of a signal
You will recall from the overview section that once you have a set of load links which load stations and beams with traffic, you then need to create transmit links for all the stations you are interested in. The transmit link provides the signal and there are several ways that the signal may change according to load.
You should already be familiar with transmit links: they have a start station, but no end station. This is specified on the transmit station tab (shown below).
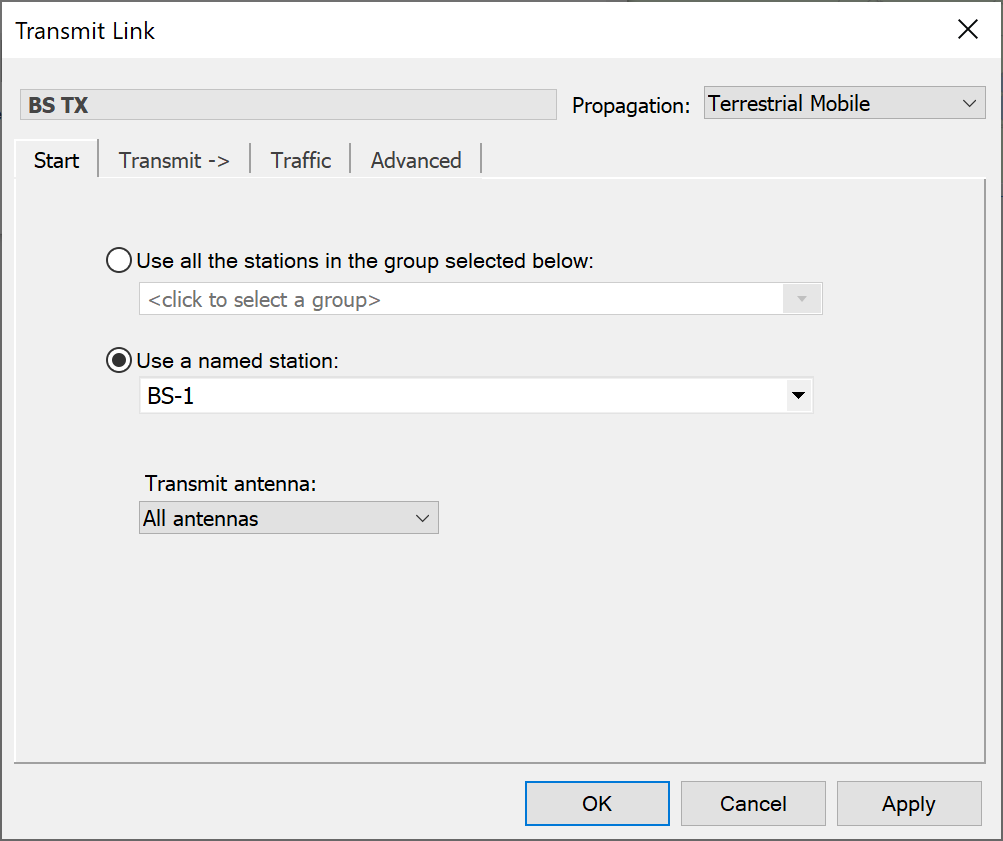
For more information on specifying these parts of a transmit link, see the links and interference paths section of the main user guide.
In order to change the way a transmit link responds to load, you need to click the traffic tab (shown below).
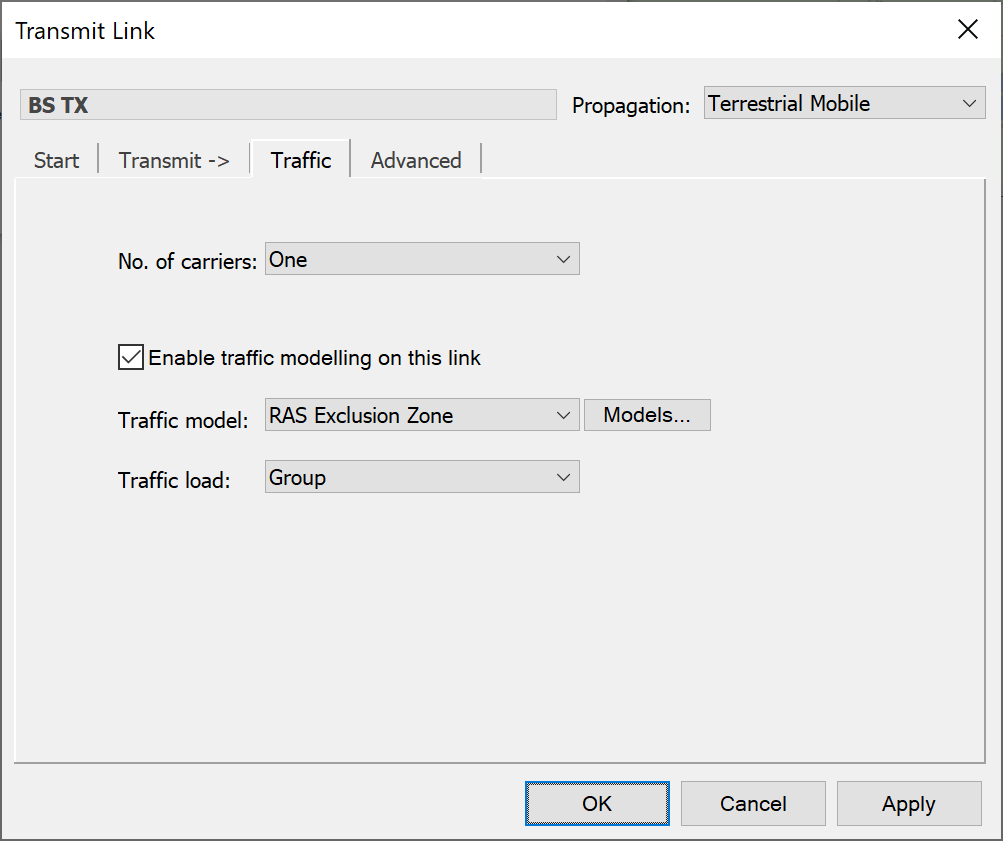
There are four ways of specifying whether and how to use the load on the transmit beam. These are selected from the “No. of Carriers” list.
Single Carrier is the default option. This does not take load into account.
Beam Load uses the load on the transmit beam as calculated by any load links.
Maximum uses the “Max Load” value for the transmit antenna’s beam instead of the its current load
Traffic is similar to maximum, but the load is multiplied by the traffic level from a given traffic object.
Station Users: this uses the Station’s “Maximum Load” field to determine the transmit power. For more information, please see the White Paper on using Population Data in Visualyse Professional.
If you choose the traffic option, you need to specify a traffic object.
To do this, first make sure that the “Enable traffic modelling on this link” box is checked. In the traffic model list, select one of the traffic objects. Finally, in the Traffic load box, choose the level at which the traffic level should be applied.
Remember that a transmit link can apply to anything from a whole group of stations, antennas and beams right down to a single beam on one station.
The “Traffic load” option defines the position in the group-station-antenna-beam hierarchy at which individual traffic levels should be applied.
For example, if you choose “Group”, the same traffic level will be applied to the maximum load for every beam on every antenna for all stations in the transmit group.
If you choose “Antenna”, the same traffic level will be applied to the maximum load for all beams in a given antenna. However, each antenna will use a different traffic level.
The Effect of Load on a Signal
The two properties of a transmit signal that are affected by variations in load are the bandwidth and the EIRP.
The way that the load affects these properties depends mainly on the link’s carrier.
Remember that carriers are blocks of allocated and occupied bandwidth, which have a defined polarisation type. The occupied bandwidth is where most of the signal is transmitted. However, the signal tails off at the edge of this range and can interfere with other signals.
The carrier therefore has an allocated bandwidth that encloses the emissions at the edge of the occupied bandwidth. This relationship is shown in the diagram below.
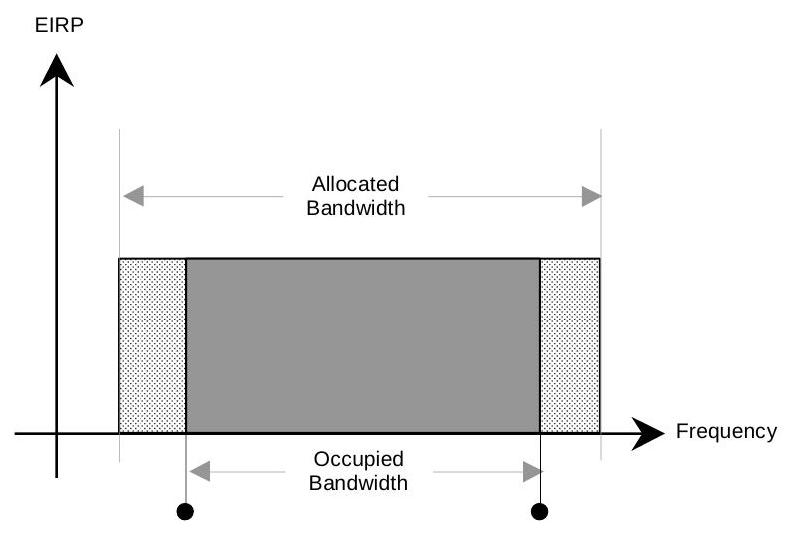
The carrier defines the access method for the link. This is the most significant factor in determining how the signal responds to changes in load.
To change the access method for a carrier:
-
Edit the carrier and select “Traffic”. The following dialog is displayed.
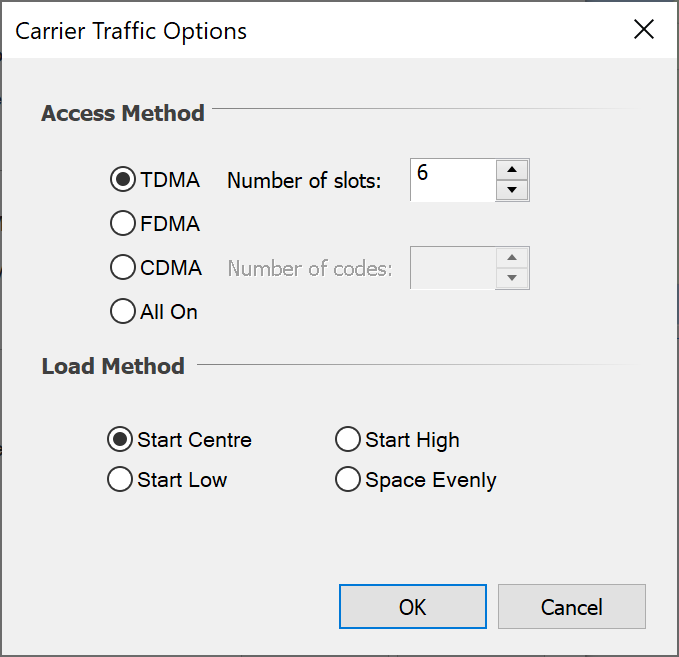
-
Select an access method from TDMA, FDMA, and CDMA
-
If selected TDMA, then enter number of slots
-
If selected CDMA, then enter number of codes
-
Select a loading method
There are three access methods: TDMA, CDMA and FDMA. The next three sections look at how the signal changes for each access mode, and also the implications of the loading methods.
TDMA
TDMA stands for Time Division Multiple Access. It allows several separate digital transmission channels to be used within the same carrier bandwidth. The time over which a signal is transmitted is split up into equal length frames. Each frame is then split into a fixed number of slots.
The individual channels are allocated a slot for each time frame. No two messages are actually being transmitted at the same time. Instead the channels share the bandwidth by transmitting at different times.
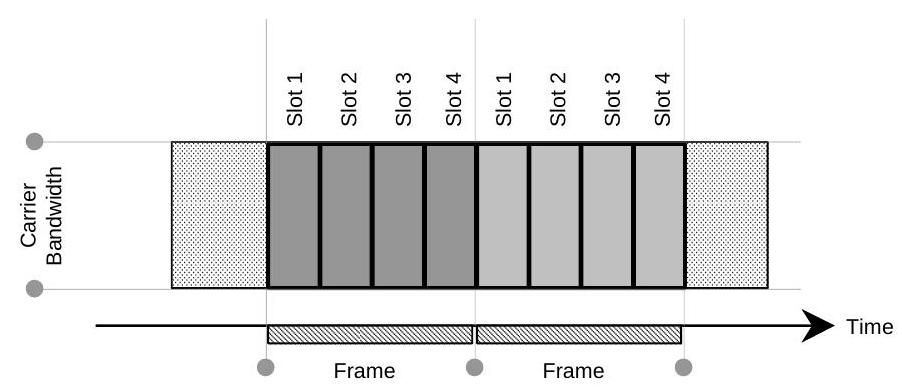
The total bandwidth of a TDMA transmission is determined by the number of carriers. Each carrier can handle one time frame worth of slots and each slot or can accommodate 1 unit of load. The number of carriers required to handle a particular load is therefore:
The central frequency for these carriers is determined by the load method for the carrier, the transmit antenna’s beam’ maximum load and the central frequency for the link.
The maximum number of carriers can be calculated by substituting the transmit antenna maximum load into the formula above.
You will recall from the section on traffic loading that an antenna has a maximum load and that this is used to limit the load on any associated beams.
You can view or edit the maximum load for a beam by editing the corresponding antenna and looking at the “Maximum Load” field under the “Advanced” options. This is shown below for a single beam antenna defined via contours.
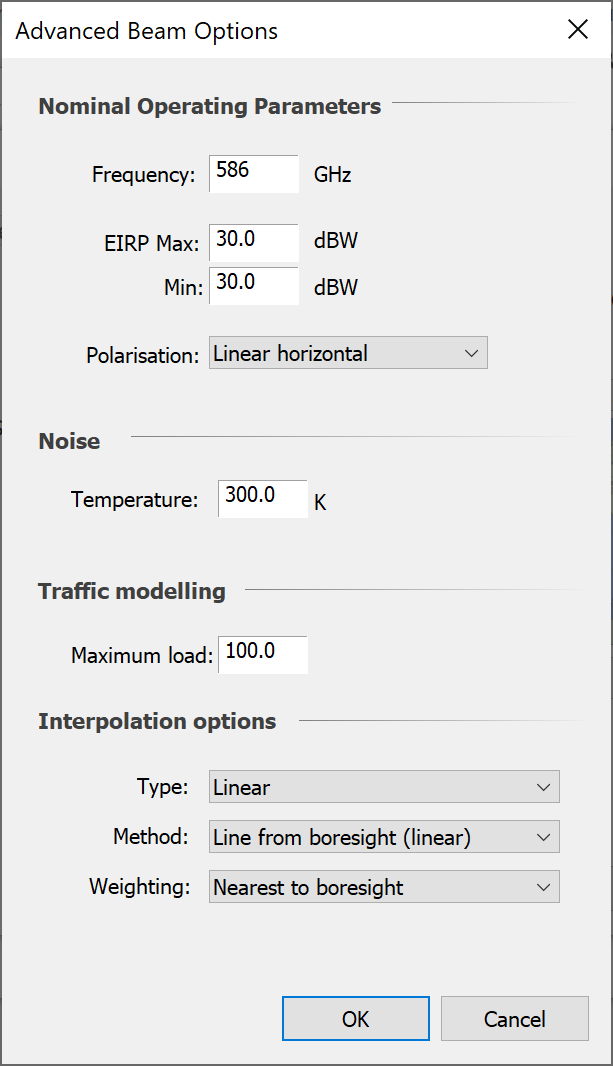
The total bandwidth for the maximum number of carriers gives the maximum bandwidth for the link. This is shown in the diagram below.

The load method for the carrier then provides four methods for stacking the carriers within the maximum bandwidth.
To change the load method for a carrier:
-
Edit the carrier for the link and click on “Traffic”. The following options are displayed:
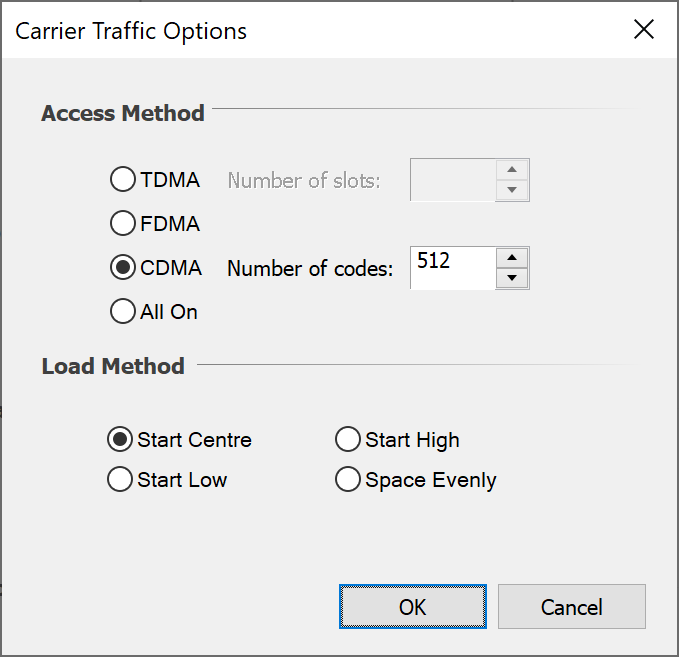
-
In the Load Method list, select one of the four methods. These are described below.
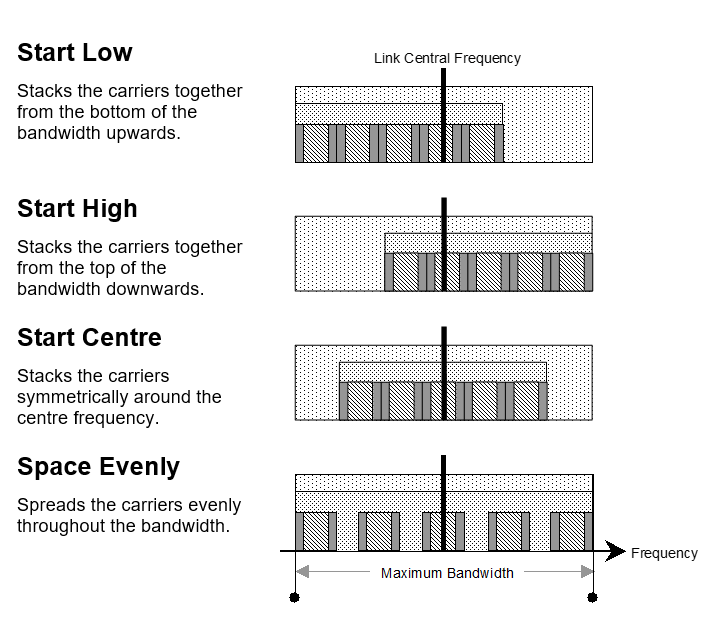
EIRP varies according to the number of carriers and not the load at the transmit beam. This is because a TDMA signal always uses the spare slots in a time frame if there are fewer messages than slots.
The variation of EIRP with load is as shown in the graph below.
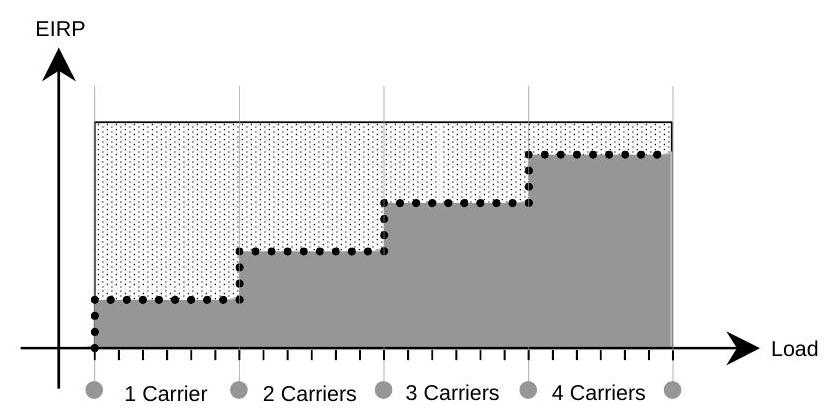
You will notice that the EIRP only increases when an additional carrier is required.
CDMA
CDMA stands for Code Division Multiple Access. The method uses unique code sequences to produce a set of orthogonal signals that provide distinct digital transmission channels within the same carrier bandwidth.
These signals are distinguishable even though they share the same frequency bands and the same time intervals.
The number of codes for a CDMA signal is defined by the carrier of the link.
A single carrier can support a maximum number of codes. When the demand for channels exceeds the maximum number of codes, additional carriers are required. This determines the total bandwidth of the CDMA signal.
The number of carriers required to handle a particular load is therefore:
The central frequency for these carriers is determined in exactly the same way as for TDMA carriers. The result is a set of carriers stacked within the maximum bandwidth of the link as determined by the maximum load for the transmit antenna’s beam.
The main difference between TDMA and CDMA transmissions is the way that EIRP varies with load.
The orthogonal signals produced by a CDMA transmitter are noise-like in their appearance. The EIRP therefore needs to be increased for each additional channel.
The variation of EIRP with load is as shown in the graph below. The variation for an equivalent TDMA signal has been superimposed in order to make a comparison.

FDMA Signals
FDMA stands for Frequency Division Multiple Access. This allows a large number of channels to share access to a group of frequency bands without interference by assigning specific frequencies within the group of frequencies to each channel.
The shared frequency bandwidth is the maximum load of the transmit Beam Type multiplied by the bandwidth of the carrier for the link. The central frequency is the central frequency for the link.
Each channel uses a single carrier and these can appear randomly within the share frequency band as shown below.

Instead of simulating all these carriers individually, Visualyse Professional models the whole FDMA transmission as a wide band signal with a power level that is proportional to the number of carriers.
The graph of EIRP against load is therefore a similar shape to the graph for CDMA.
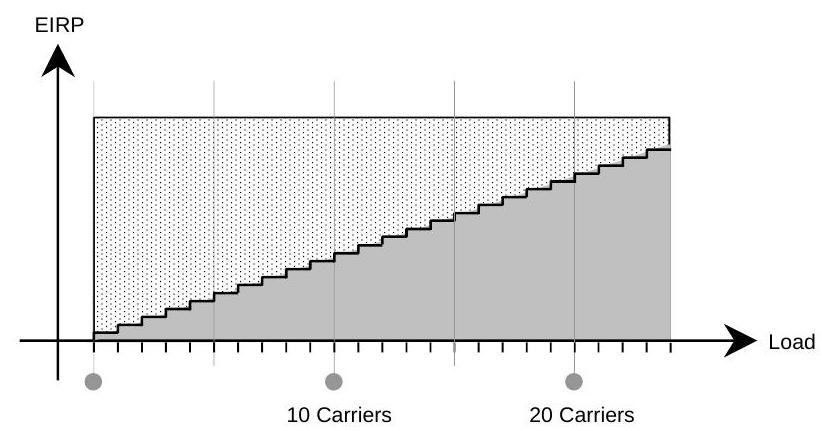
Loading Multiple Beams
Traffic Loading described how a load link can be used to load the throughput from a station onto a single beam on another station. In this case as much of the throughput as possible is used to load the end station beam.
However, sometimes you may wish to spread the load among individual beams on a number of end stations.
For example, an Earth Station with a maximum throughput of 10 could be used to model handsets transmitting from a particular area on the ground. The maximum throughput represents the maximum number of handsets that are expected to be transmitting at any one time.
The handsets communicate with a constellation of non-geostationary satellites. Each satellite can service a maximum of 5 handsets at a time.
The usage of satellites by handsets can be modelled by creating a load link from the Earth Station to the constellation of satellites. A tracking strategy would be used to select the highest elevation satellite.
However, if more than 8 handsets are transmitting, only five of them can use the highest elevation satellite. The other 3 handsets would have to use the next satellite that meets the conditions of the tracking strategy.
The load link can model this behaviour by loading the beams on more than one station. The next section explains how this behaviour is defined.
The first point to note is that a load link can only load a single beam on any one station. Multiple beam loading is therefore achieved by spreading the load across a number of stations. For each station, a single beam is used.
To do this, the load link must select its end station from a group. In addition, the end station must be selected using a tracking strategy object and not one of the predefined tracking strategies.
The reason for this is that the tracking strategy object compiles a list of candidate stations by applying its reduction criteria. It is the beams on these stations that receive the load.
To use a tracking strategy object to select the end station:
-
Edit the load link.
-
Click the “End” tab.
-
Click on “Add or Edit…” and then create a user defined tracking strategy
-
Under “Tracking strategy” select the newly created one
The picture below shows an example of how the dialog should look.
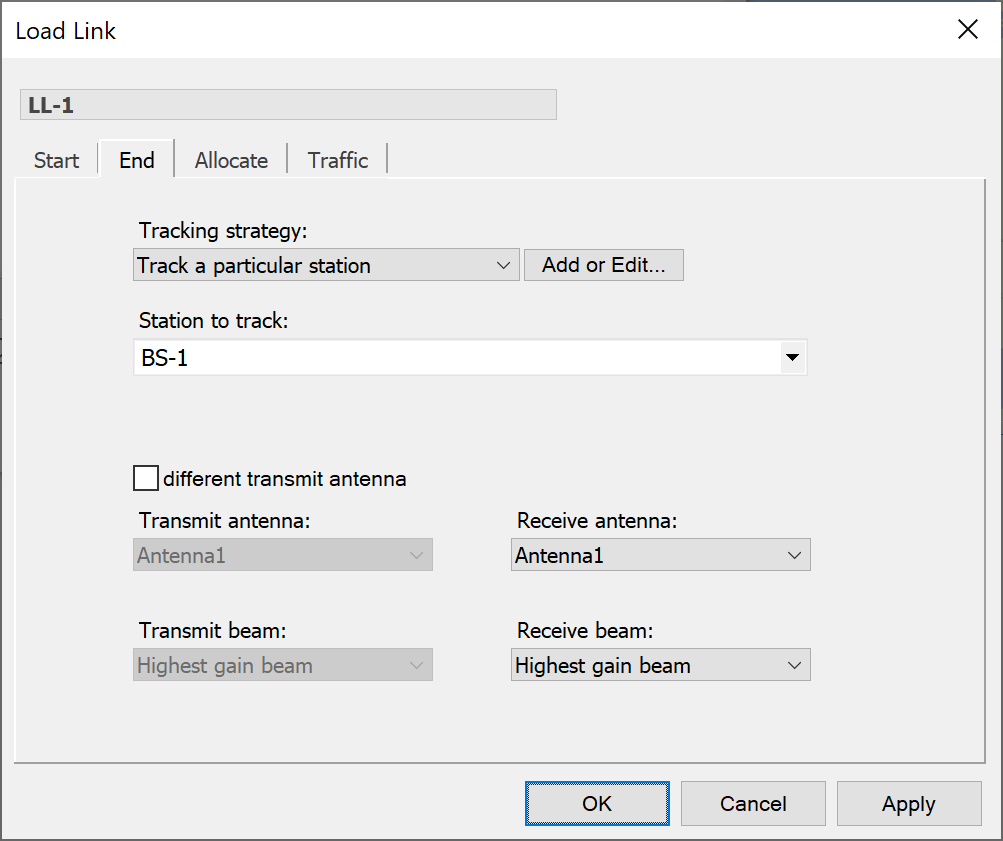
Finally, in the group list, select a group from which to select an end station together with the antenna / beam selection methods.
You must make sure that your tracking strategy object does not reduce the candidate list to just one station. If this happens, the throughput will be allocated to just one station.
To ensure that a tracking strategy uses the entire candidate list:
-
Edit the tracking strategy
-
Under selection method, select “Advanced” and then click on “Edit…”
-
Make sure that the check boxes are not checked (as shown below).
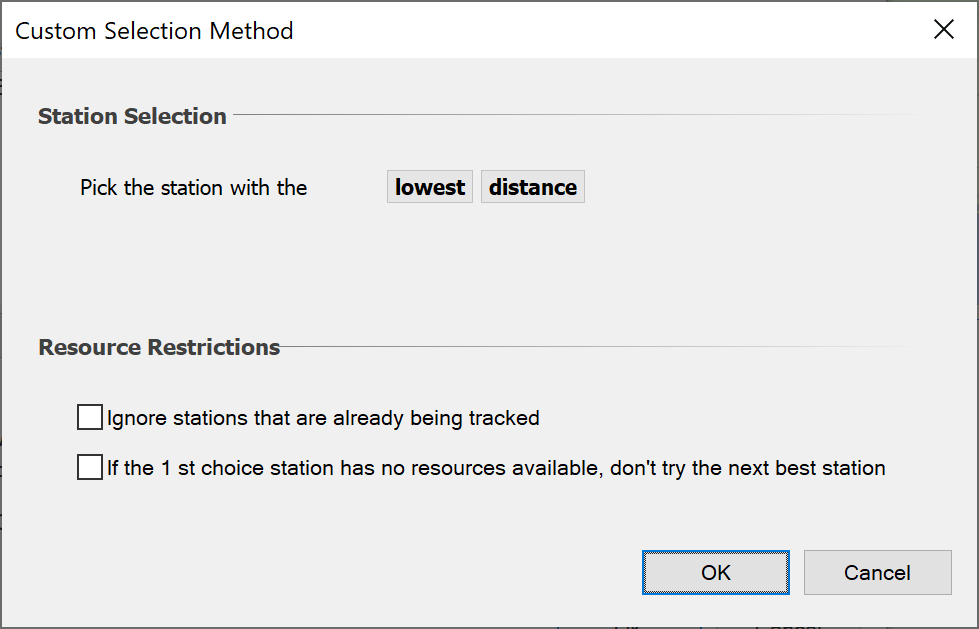
Having set up the tracking strategy and end station selection for your load link, the final step is to decide how load is allocated to multiple beams.
To enable allocation of load to multiple beams:
-
Edit the load link
-
Click the “Allocate” tab.
-
Make sure that the Multiple Allocation box is checked (as shown below).
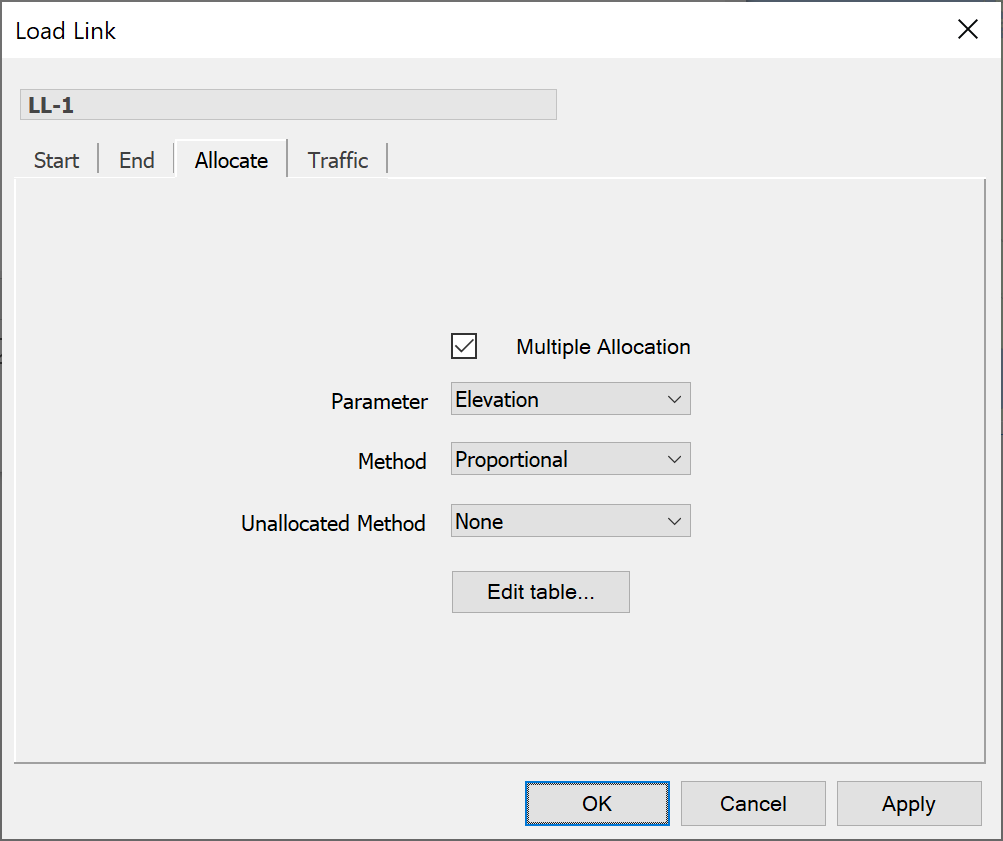
Before we go any further, let’s just recap on the process of throughput allocation to multiple beams:
- The load link is configured so that the end stations are selected from a group of stations according to a tracking strategy.
- The tracking strategy compiles a list of candidate stations.
- The load link selects which antenna and beam to use.
- The throughput from the start station is then divided into parts that are then allocated to the specified beam on each candidate station.
There are a number of ways of dividing up the load from the start station and sharing it amongst the candidate stations. This is determined by the parameter, method and unallocated method controls (these are visible in the picture above).
The method list provides four ways of sharing the load amongst the candidate stations.
| Method | Description | |
|---|---|---|
| Equal | - | allocates traffic equally amongst the stations |
| Proportional | - | shares the traffic load according to distance or elevation |
| Biased | - | shares the traffic such that there is a bias towards the highest elevation or nearest station |
| Table | - | uses tabulated data to define the sharing of traffic load between stations |
If you choose the proportional, biased or table methods, you need to decide whether you want to use distance or elevation. This is specified in the parameter list.
The load for the station is totalload factor .
For each method, factor is calculated as follows:
| Method | Weighting | Factor |
|---|---|---|
| Equal | number of stations | factor |
| Proportional | factor | |
| Biased | factor | |
| Table | factor |
The unallocated method list determines what happens to throughput, which cannot be loaded onto a particular beam. This can occur if the current load plus the additional load exceeds the maximum for the beam.
The excess load can either be discarded or it can be diverted to a beam on another candidate station that has available loading. To discard the unallocated load, choose “None” from the unallocated method list. To divert the load to a beam on another candidate station, choose “Available loading” from the unallocated method list.
You can look at the discarded load for a load link using the watch window. To do this, select the load link from the “Add watch” options.
You can also collect statistics for the load left attribute. You can plot it on a graph or log it to a file just like any other object attribute.
Load Links on Watch Windows
The principle way to see output from the load link calculations is via the watch window. In addition the watch window can also be used to show the inputs into the algorithm for reporting process.
The key locations to look are:
Under station, for each beam of each antenna:
Load: current load on that beam
Under station, under the traffic:
Maximum throughput: throughput if traffic object is 100%
Maximum load: capacity of this station
Load: current traffic through this station
Under each load link:
Load left: traffic that could not be allocated
Load Links Tutorial
Introduction
This section gives a worked example that shows how load links can be used and combined with traffic objects.
The simulation considers a scenario involving a base station being loaded by traffic from mobile users, using constraints within traffic and load link objects. This is used in traffic modelling and also to calculate interference into a sensitive radio astronomy receiver in an adjacent band.
The simulation will be built in stages as follows:
- Base station, mobiles and carriers
- Load link, traffic and watch window
- TX link, RX link, and interference path
Note that familiarity with Visualyse Professional is assumed to the extent that users are confident in the steps required to create key elements. When parameters are not mentioned they can be assumed to be left as the default values.
Stage 1: Basic Simulation
Open a blank simulation to work with. The first stage involves building the mobile network – i.e. the base station and its mobile users, in the follow steps:
- Create the antennas
- Create the stations, together with their groups and define variables
- Add the carriers
- Configure a view
Antennas
The simulation should already have a single zero gain isotropic antenna which will be used for the mobiles and radio astronomy service. It is therefore only necessary to create an antenna for the base station as follows:
Type: Multiple Identical Beams
Arrangement:
Name: BS 3 sector
Number beams: 3
Azimuths: (0, 120, -120)
Elevations: (-1, -1, -1)
All beams:
Beam type: elliptical
Beam pattern: parabolic
Peak gain: 15 dBi
Semi-major axis: 120°
Semi-minor axis: 5°
Use gain floor: yes
Gain floor: -20 dB
Advanced:
Maximum load: 2
Station Groups:
For convenience all stations are contained within a group. Create three empty groups and add stations as follows:
Group 1:
Name: Base Stations
Add a terrestrial fixed station and configure as follows:
Name: BS-1
Lat/Long/Height: (51.0°, 0.0°, 20m)
Antenna: BS 3 sector
Group 2:
Name: Mobiles
Add a mobile station and configure as follows:
Name: MS-1
Height: 1.5 m
Antenna: Zero gain antenna
Duplicate MS-1 five times to make six mobiles
Create a new define variable to Monte Carlo the position of a terrestrial station over a service area.
Group: Mobiles
Central station: BS-1
Service area radius: 5 km
Service area type: hexagons
Group 3:
Name: RAS
Add a terrestrial fixed station and configure as follows:
Name: RAS
Lat/Long/Height: (51.05°, 0.0°, 20m)
Antenna: Zero gain antenna
Carriers
The simulation should already have a standard 1 MHz carrier defined. Create another with parameters:
Name: WCDMA
Bandwidth: 5 MHz
Traffic:
Access method: CDMA
Number codes: 512
Views:
Open a Mercator view and jump to the UK. On the properties disable show beams and on the overlay tab, active the “20 km square grid at 51N 0E” user defined overlay while switching off all others. Zoom in so the window shows the stations and the grid.
Running the simulation:
The result should be a view similar to this:
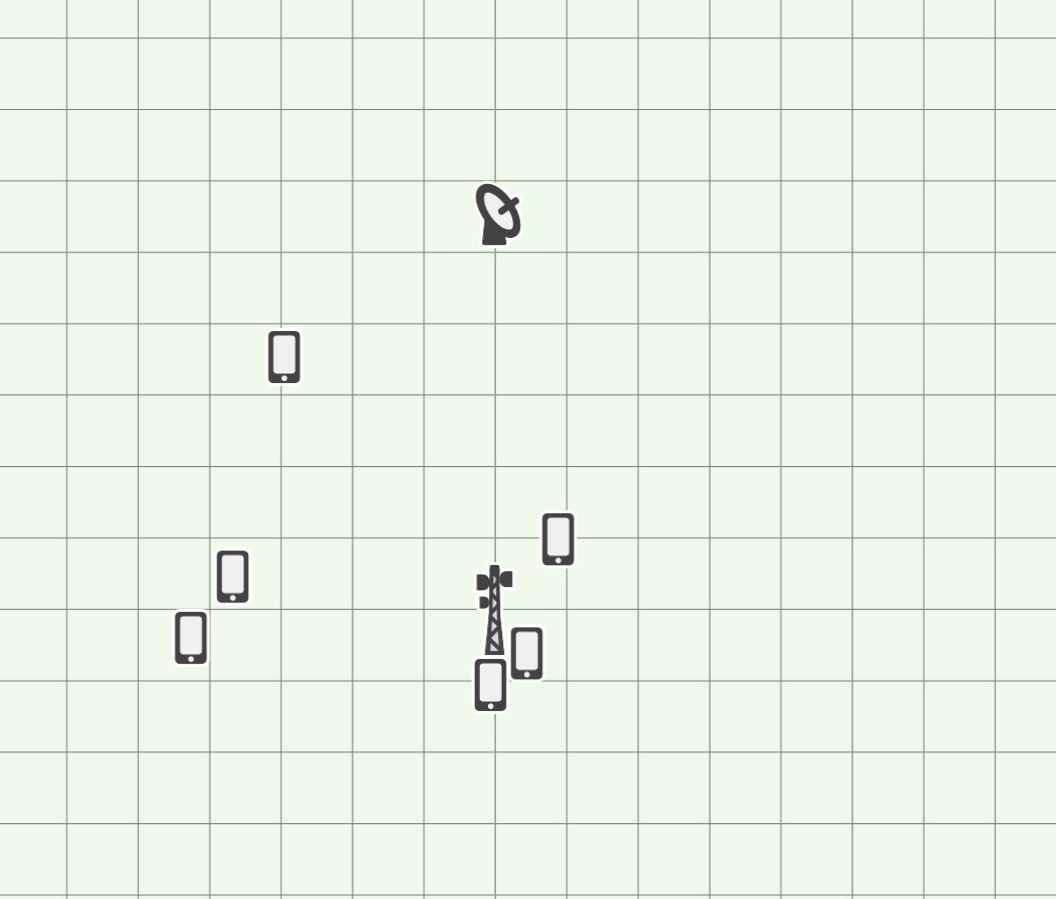
If you run the simulation you should see the locations of the six mobiles change from time step to time step.
This models a single cell mobile network with six users that can be located anywhere in its hexagonal service area. With three sectors there will be on average 2 users per sector, and but as the locations are randomised there could be times where there are more or less users within each sector.
Save this file as “Traffic tutorial.sim”.
Stage 2: Traffic and Load Links
The next stage involves loading the base station with traffic from the users in the following steps:
- Create the traffic object
- Create the load links
- Open and configure a watch window and data vs. time graph
Traffic:
Create a traffic object which will by default be simply on: this will be changed at a later stage.
Load Links:
Open up the load link list and create a load link with following parameters:
Name: LL-1
Start:
Named station: MS-1
End:
Tracking strategy: Named
Station: BS-1
Antenna: Antenna-1
Beam: Highest gain beam
Traffic:
Enable traffic: True
Traffic model: Traffic
Having done this, duplicate the load link five times and change the start station to be (MS-2 to MS-6).
Watch window and Data vs. Time Graph:
Open up a watch window and add the following:
- BS.BS-1.Traffic.Load
- LL-1.Load Left
- LL-2.Load Left
- LL-3.Load Left
- LL-4.Load Left
- LL-5.Load Left
- LL-6.Load Left
Open a Data vs. time graph and select the variable “BS.BS-1.Traffic.Load”.
Running the simulation:
The load left field shows if there is traffic that could not be allocated due to constraints within the model. In most cases the maximum load on the antenna and stations is the default value of 100, apart from the maximum load on each of the sectors of the base station antenna which is set to 2.
Hence in many cases the randomisation of the locations of the mobiles means there is more than 2 within that sector and hence the 3rd mobile will be unable to allocate its traffic. Therefore as you run the simulation you will see non-zero values for the “Load left” – in particular for those at the bottom of the list which are allocated last.
The aggregate traffic can be seen in the base station “Load”: if all user’s traffic is allocated this would be six, but often it is less than this, as can be seen in the plot below of traffic at BS-1 vs. time.
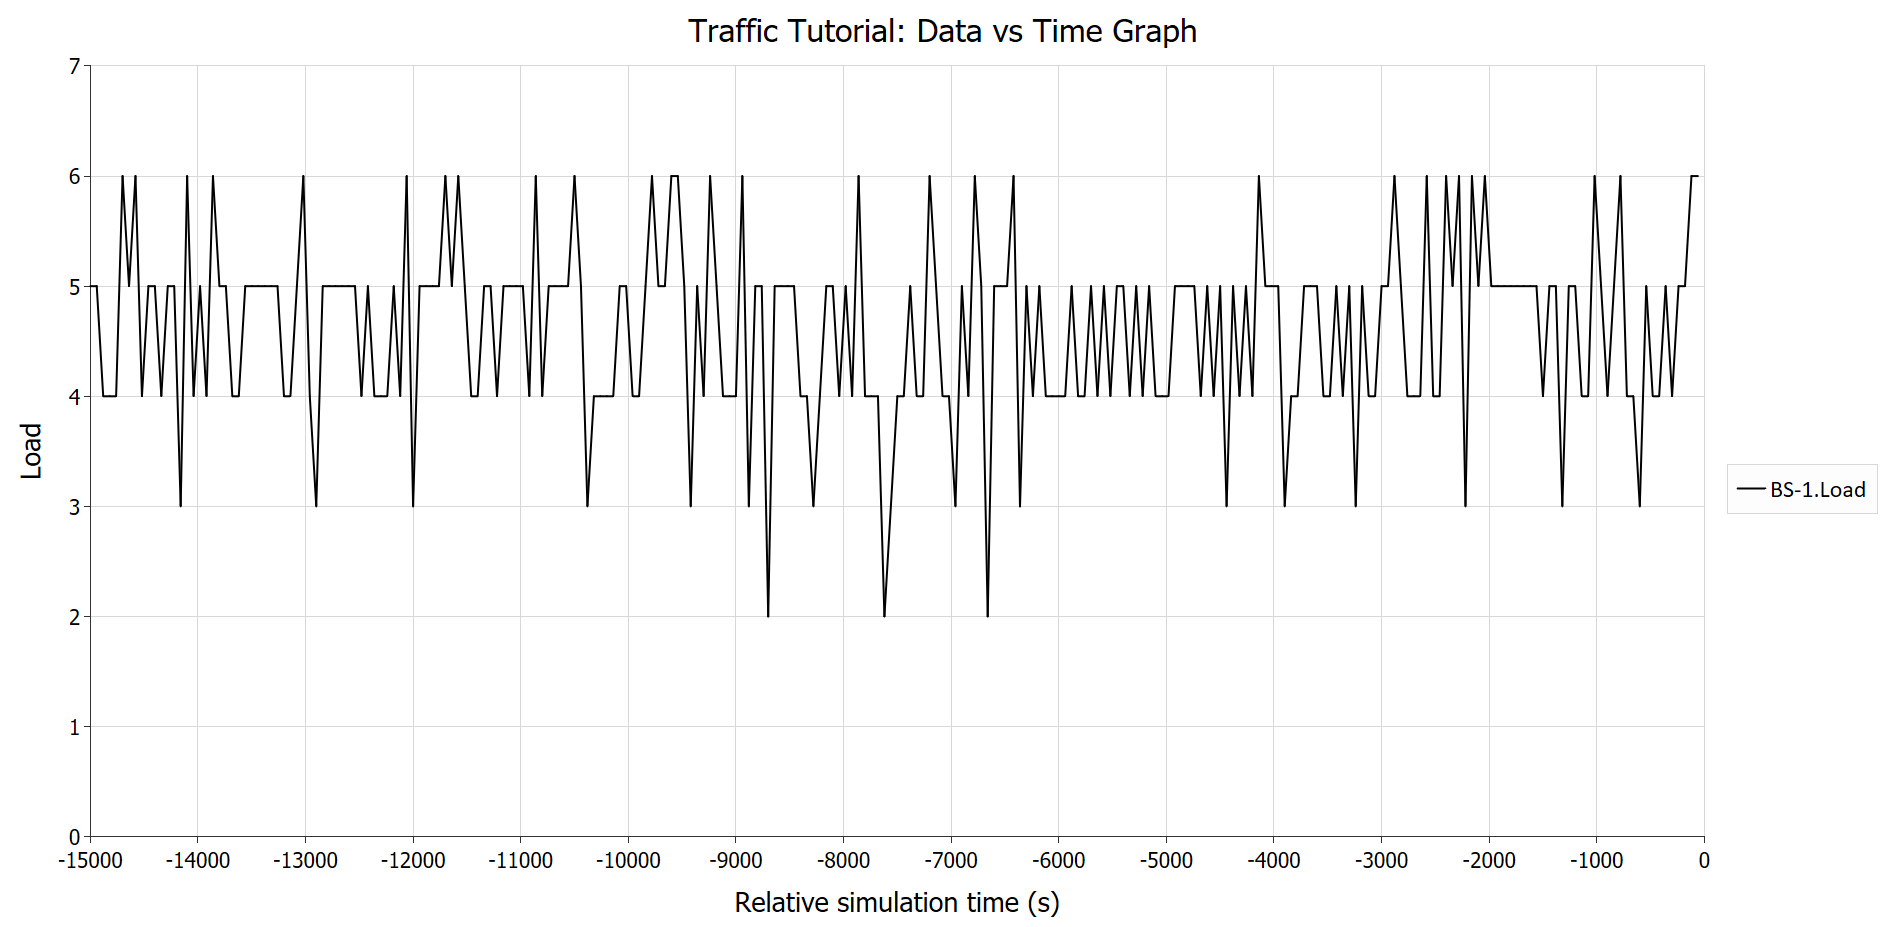
This can be used to analyse quality of service requirements – for example by calculating statistics of failed call requests.
Stage 3: Interference Path
The final stage involves creating the links and interference paths:
- Create the links
- Create the interference path with statistics
- Update the watch window and open a statistics view
Links:
To model the radio astronomy site, open up the link list and create a receive link with following parameters:
Name: RAS RX
Type: Space <-> Earth
End:
Station: RAS
Receive:
Frequency: 611 MHz
Then create the following transmit link to model emissions from the base station in an adjacent band:
Name: BS TX
Type: Terrestrial mobile
Start:
Named station: BS-1
Antennas: All antennas
Transmit:
Carrier: WCDMA
Frequency: 617 MHz
Power: -10 dBW
Traffic:
Number of carriers: Beam load
The traffic field “Number of carriers” = “Beam load” means the transmit power in each sector will depend upon the loading for that antenna. Each user’s downlink is assumed to transmit at -10 dBW1 and because the carrier is defined as using CDMA as the access method, the power from each user will aggregate. Hence if there are two users per sector the transmit power will be -7 dBW.
Finally configure the “Terrestrial Mobile” propagation model to use Hata / COST 231 for interfering paths, setting the environment to be open.
Interference Path and Statistics:
Create an interference path with following options:
Wanted link: RAS RX
Interfering link: BS TX
Advanced:
Check overlap: false
Other adjustments: 45 dB
Bandwidth adjustment: none
This sets up the interference path for an adjacent band scenario with 45 dB of attenuation compared to the systems operating co-frequency.
Under statistics, select threshold type = “I”, level -143 dBW2, and activate collect histogram with 1 dB bins.
Watch Window and Statistics Graph:
Add the following to the existing watch window:
- RAS RX.All Interferers.No. of Interferers
- RAS RX.All Interferers.I
- RAS RX.Statistics.I statistics.Percentage bad steps
- RAS RX.Statistics.I statistics.Worst value
- RAS RX.Worst Interferer.Interfering Power
- RAS RX.Worst Interferer.Interfering Relative Gain
Then open a new distribution chart and show a histogram of the interference.
The resulting simulation should look something like this at the end of the run:
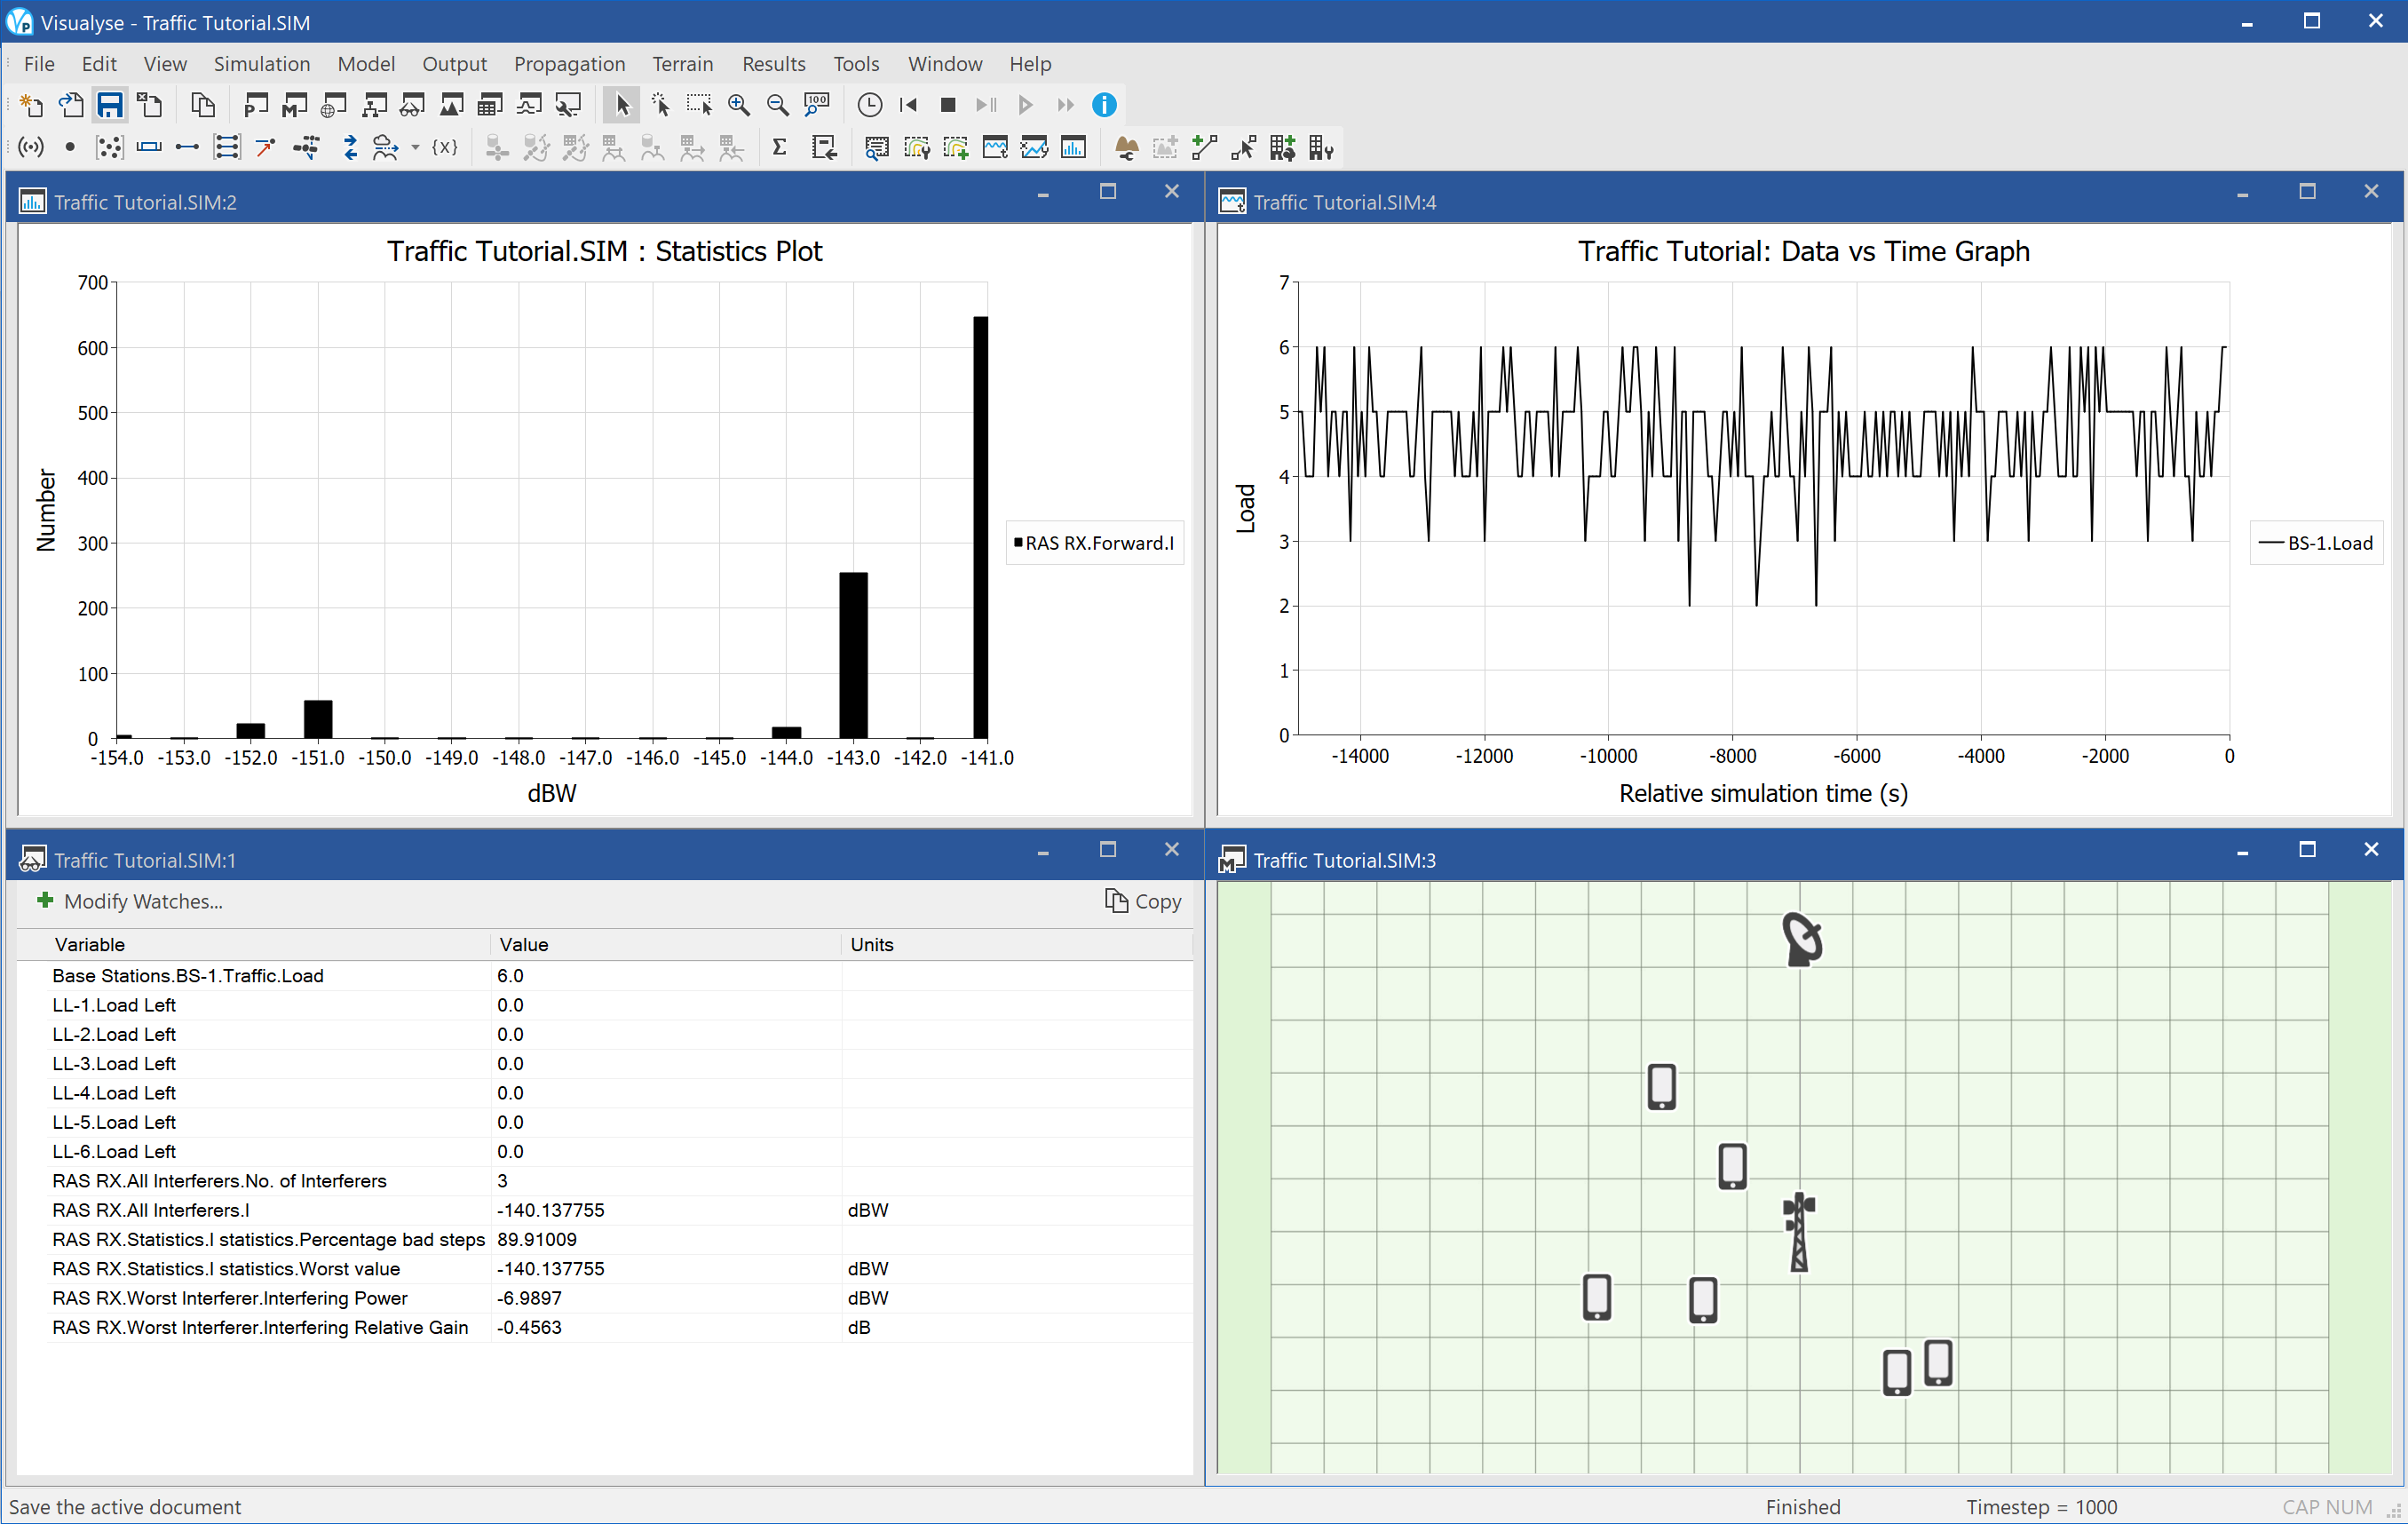
Running the Simulation
Having created the basic simulation it is possible to undertake some analysis.
Notice that as the location of each of the mobiles is randomised the number in each sector varies from none to up to six. As the limit of loading per beam is two, this means that in situations where there is three or more mobiles within a sector there will be traffic that cannot be allocated
Hence the load link’s “Load left” is often non-zero – in particular for the last few load links to be allocated. The first two load links should always be able to allocate their traffic.
The traffic at the base station will therefore vary, depending on whether the sector limit is met. The traffic will only reach 6 units if there are exactly 2 users in each sector.
As the traffic per sector varies in the range (0 – 2) the interference at the radio astronomy site varies. The field “No. of interferers” refers to number of sectors i.e. antenna beams that are causing interference. As at times some sectors will be empty the number can drop below 3. It will never reach zero as the users should at all times be in one of the three sectors!
The number of users per sector will impact the EIRP of that sector: look at the transmit power of the worst interfering link budget and it will be either -10 dBW (one user) or -6.9 dBW (two users)
If there are no users in the sector pointing towards the radio astronomy site then interference will come from the side lobes of the other two sectors – typically 12 dB lower.
Over the 1,000 time step run the probability of interference should calculated to be about 90% with worst value -140 dBW (actual numbers could be slightly different depending upon random number seed).
Variations on the Simulation
The basic simulation can be varied in a number of ways. Try re-setting the simulation to its start and then carrying out the following changes one by one:
Remove the sector load limit
Change the “BS 3 sector” antenna maximum load to 100 and re-run: all load links will be able to allocate all their traffic and hence the base station traffic will always be six. The highest interfering level increases to 137.7 dBW to reflect situations where the sector pointing towards the radio astronomy site has more than 2 mobiles.
Set a base station sector limit
Set the maximum traffic to the base station as being 4: in this case the last two load links will always have traffic unallocated as the previous ones will fully use up the total for the station. Both the percentage of steps bad and worst interfering level will decrease due to this additional constraint.
Add a high traffic user
Set the maximum through-put for mobile “MS-1” to be 10 (e.g. representing high speed data rather than voice): this is greater traffic than the base station can manage, and so this mobile will have 6 units unallocated and all other load links will be unable to allocate any traffic. The histogram will show two bars – one when MS-1 is in the sector pointing towards the radio astronomy site and another twice as frequent for the other two sectors.
Add traffic modelling
Set the maximum load for the base station to 12 so not all load links can be active at once. However also change the traffic object to use a state machine model with probability active/on/off as 50%. This will increase the variation in users active and result in probability of interference reduced to around 30%.
Include exclusion zone
In the traffic object include a 3 km exclusion zone around the radio astronomy site where mobiles must switch off. This reduces the probability of interference to around 18 %
Modify mobile network
To reduce the interference even further, increase the downtilt on the base station’s antenna to 3° and reduce the power per user to -14 dBW and re-run the simulation. The probability of interference should in this case be under 1%: this could be an acceptable level.
Summary
This tutorial has shown how the load links can be used to model traffic within a network and how that in turn can be used to model interference into other systems.
This basic simulation could be extended in many other ways. For example there could be a larger deployment with more base stations and mobiles. In these situations there could be alternative routes for the traffic – not just the nearest base station but also the 2nd nearest could be considered. Hence the traffic identified in this simulation as “Load left” could be routed to another base station. This can be included by using the load link’s “Allocate” functions.
By including these additional factors a more detailed model of complex networks can be generated, improving the ability for communication systems to share the radio spectrum.
-
i.e. fixed EIRP / carrier. This field could be further randomised – for example to include variations due to power control ↩
-
Note this number, like the other parameters of this simulation, is completely arbitrary! ↩
Acronyms and Abbreviations
Acronyms and Abbreviations
| Acronym / Abbreviation | Description |
|---|---|
| AGD | Australian Geodetic Datum |
| AMS | Annual Maintenance and Support |
| AMT | Aeronautical Mobile Telemetry |
| BS | Base Station |
| BT | Bluetooth |
| CDMA | Code Division Multiple Access |
| CSV | Comma Separated Values |
| DEM | Digital Elevation Model |
| EIRP | Equivalent Isotropic Radiated Power |
| FDMA | Frequency Division Multiple Access |
| FS | Fixed Service |
| FSS | Fixed Satellite Service |
| GPS | Global Positioning System |
| GSO | Geostationary Orbit |
| IDWM | ITU Digitised World Map |
| ITU | International Telecommunications Union |
| MS | Mobile Station |
| MSS | Mobile Satellite Service |
| OS | Ordnance Survey |
| RAS | Radio Astronomy Service |
| RX | Receive |
| S-DARS | Satellite – Digital Audio Radio Service |
| SRTM | Shuttle Radar Topography Mission |
| SWBD | SRTM Water Body Data |
| TDMA | Time Division Multiple Access |
| TX | Transmit |
| UK | United Kingdom |
| USGS | United States Geological Survey |
| UTC | Universal Coordinated Time |
| WCDMA | Wideband Code Division Multiple Access |
| WGS84 | World Geodetic System |
Tutorial
This document will walk you step-by-step through the creation of a simulation file as a tutorial exercise. In doing so you will get an idea of how Visualyse Professional works and how it can be used to model a wide variety of radio communication scenarios.
This document should be read together with rest of the Visualyse Professional document set, including:
- User Guide
- Technical Annex Document
- Demonstration Files Document
Visualyse Professional can be used to analyse a very wide range of scenarios – as can be seen by the long list of example files in the Demonstration Document. These can include studies involving a wide range of different types of stations and services, including broadcasting, mobile, fixed, GSO satellite, non-GSO satellite, aircraft, ships, etc.
In the example files, we try to cover many of the different types of service and station in at least one of the simulations. In this document, we have just the one scenario, so we have chosen one that includes both satellite and terrestrial services.
It is based upon one of the study topics that were discussed at the World Radiocommunications Conference (WRC) in November 2007, namely Agenda Item 1.4, which was concerned with finding additional spectrum for the development of terrestrial mobile broadband services such as 3G, LTE, and WiMAX. Various predictions were given, based on several scenarios for the development of the markets for mobile service - up to 1 GHz requirement was suggested in some scenarios.
One possible frequency band that was considered as potentially feasible was the 800 MHz currently used by the satellite community between 3.4 - 4.2 GHz. This band is particularly suitable for terrestrial cellular systems and is in a ‘sweet spot’ as far as propagation and capacity are concerned. However, it is a crucial band for satellite networks in many countries around the world.
In this document, we will look at the implications of deploying a WiMAX network, co-frequency, around an existing Fixed Satellite Service (FSS) earth station.
Important Note
This document is based upon example parameters and is not derived from any actual or proposed systems known by Transfinite. While the numbers used are representative, they and the results generated cannot be guaranteed.
Suggestion
We have located the stations to be around Sydney in Australia – the simulation should still “work” if moved to other places if that would be more convenient for you.
Quick Overview of the Exercise
Agenda Item 1.4 was to:
“consider frequency-related matters for the future development of IMT-2000 and systems beyond IMT-2000 taking into account the results of ITU-R studies in accordance with Resolution 228 (Rev.WRC-03)”
Agenda Item 1.4 covers many potential sharing scenarios and frequency bands: this tutorial considers C band sharing with satellite Earth Stations in particular.
Visualyse Professional can be used to study the types of constraint that may need to be placed on IMT-2000 systems in order to mitigate interference in these scenarios.
In our exercise, we will model a WiMAX network operating in the vicinity of a satellite earth station. WiMAX parameters are assumed to be consistent with IMT-2000 standards given in ITU-R Rec.M.14571.
Area Analysis
We will use Visualyse Professional’s powerful area analysis tool to create a colour coded plot showing locations where an earth station would experience excess interference from a specific WiMAX base station.
Note this could also be used the other way around – for example show locations around an earth station where a WiMAX base station could not be located.
Area analysis can be used to show these colour coded plots or contours of any link parameters (e.g. received signal, interference C/I, PFD etc.) as in the two figures below.
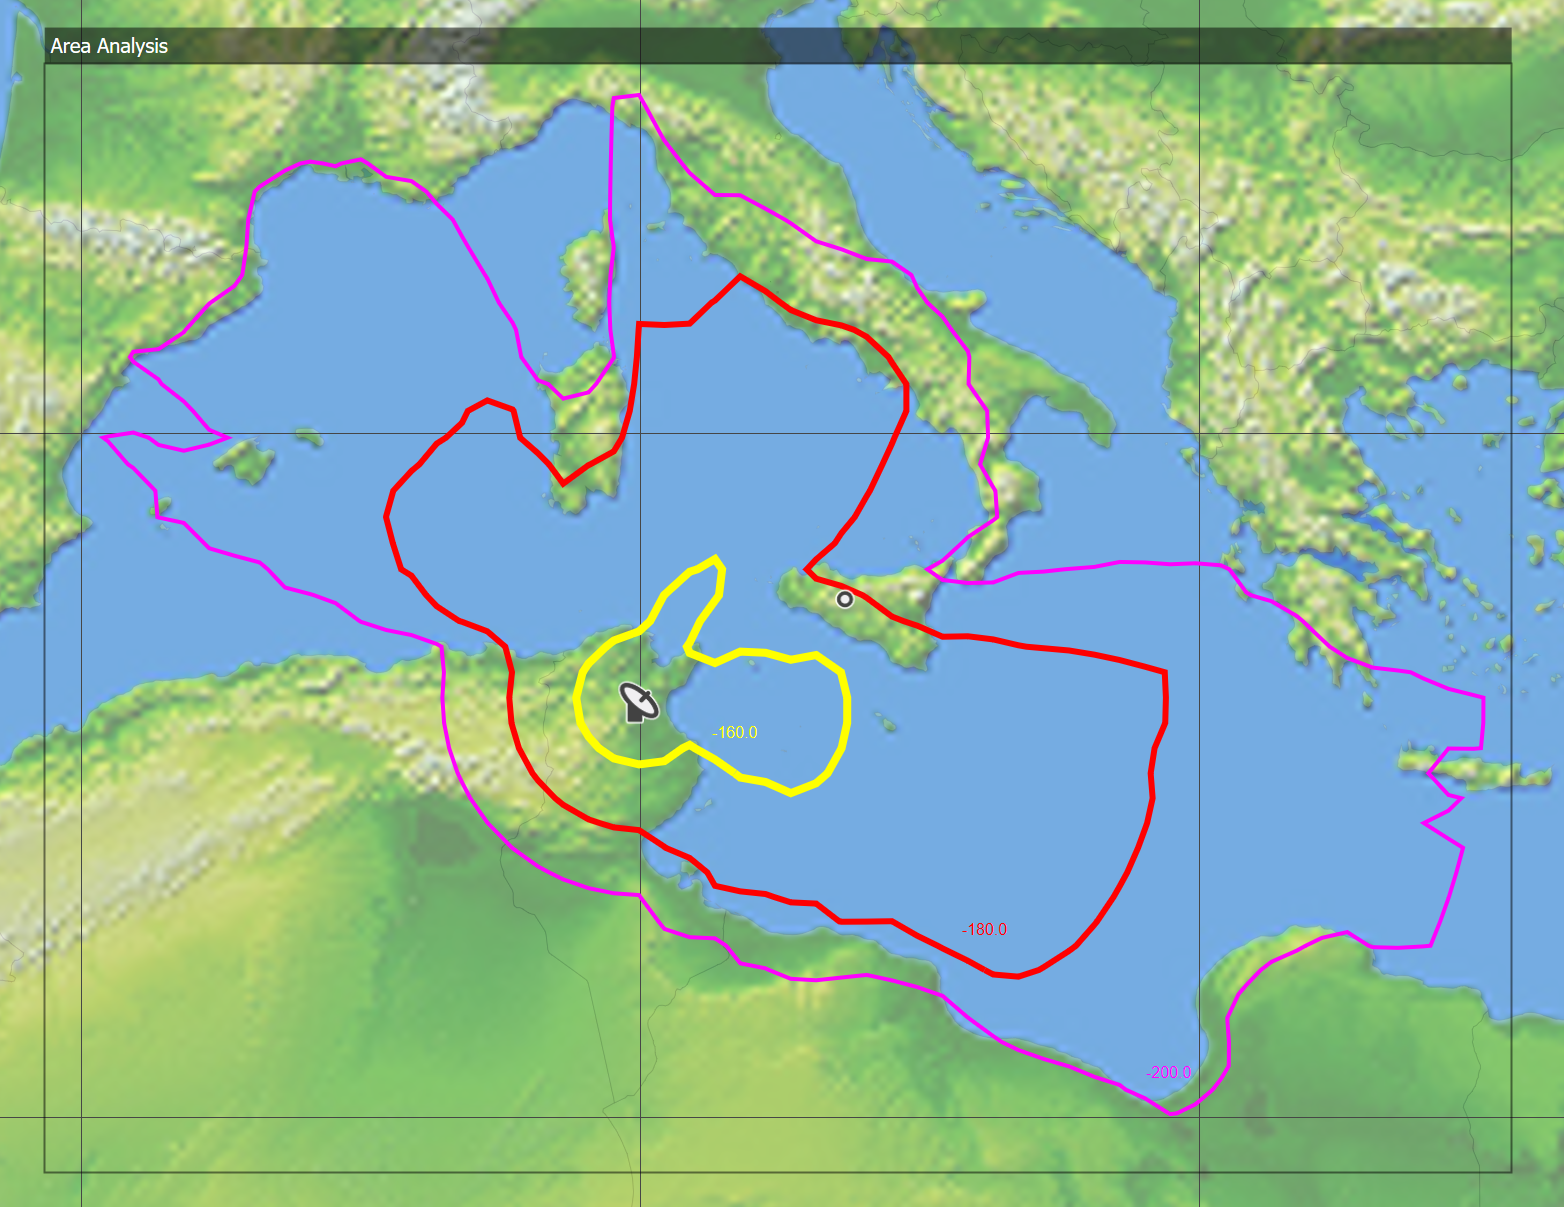
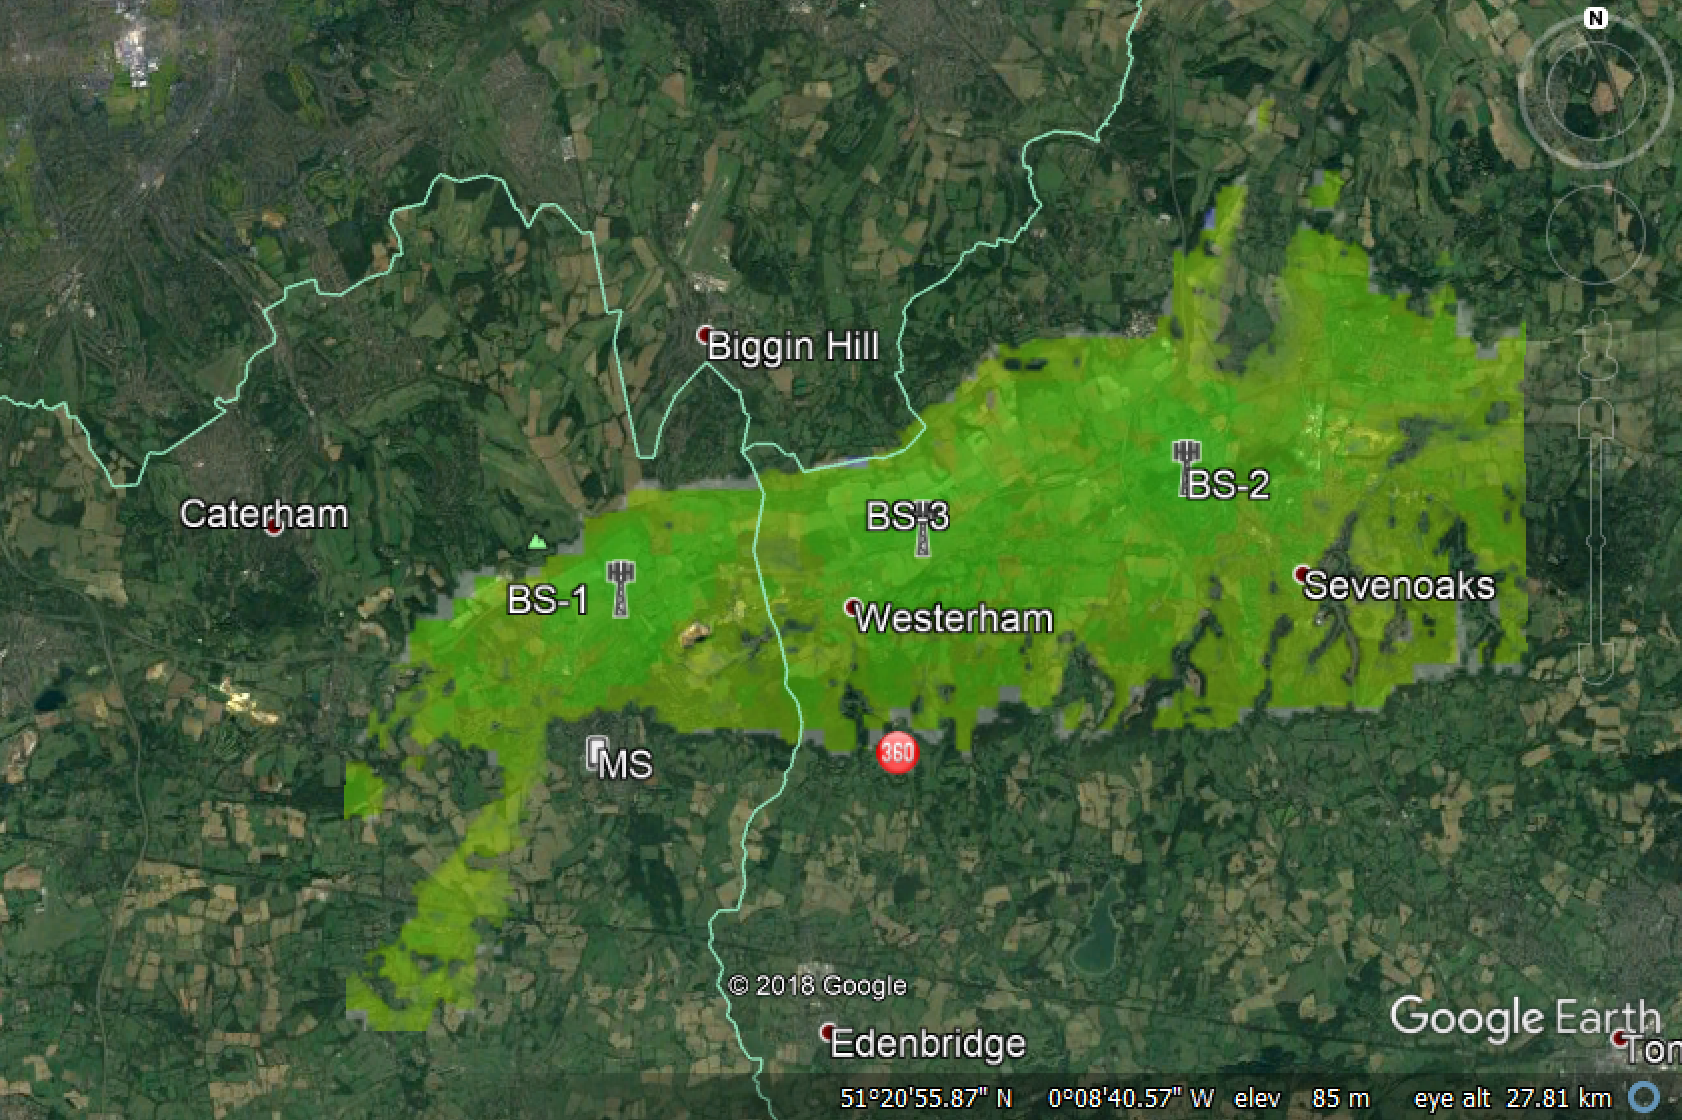
As a quick look-ahead, the figure below shows the exclusion zone that results from basic analysis under the assumption of path loss occurring for 50% time in Recommendation ITU-R 452-16.
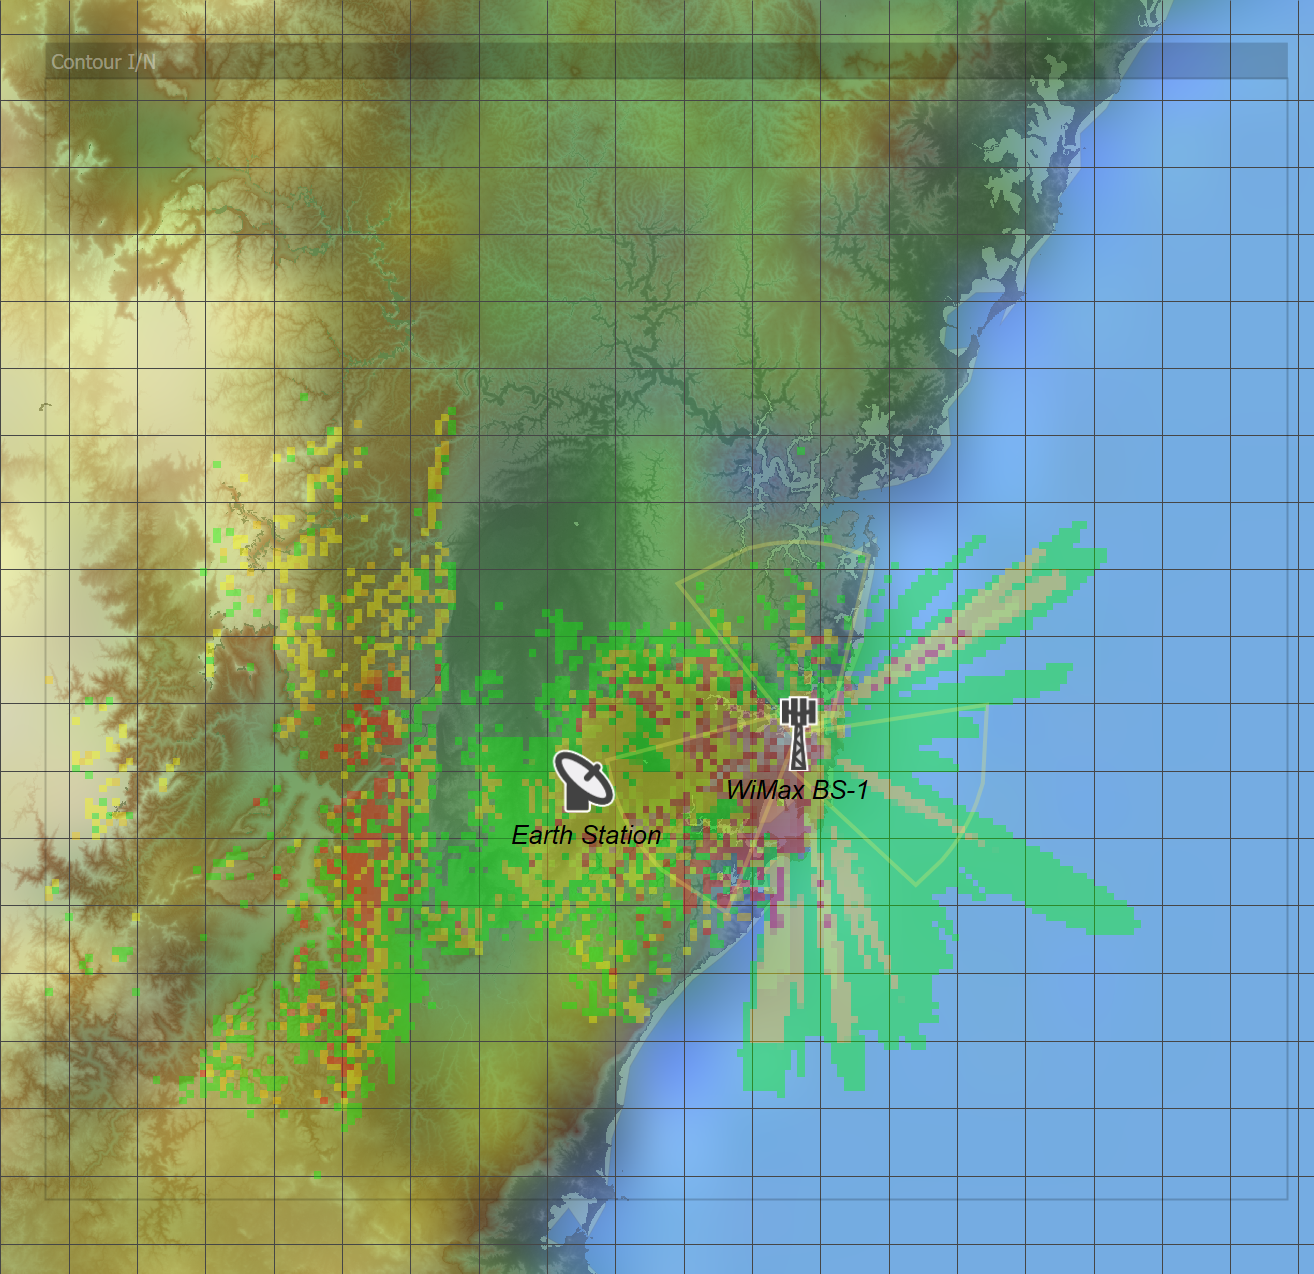
Key Modelling Features
The key features of Visualyse Professional that will be used in this model are:
Antenna Gain Patterns – in our model we have used ITU-R Rec. S.465 for the earth stations. For the WiMAX system, we have used both ITU-R Rec. S.1245 and as an option a gain table. This latter option allows you to enter specific antenna performance that is not included in Visualyse Professional’s large list of roll-off masks.
The WiMAX base station antenna is modelled with multiple sectors – this is reflected in the shape of the exclusion zone around the base station in the figure above.
Antenna Pointing – Visualyse Professional allows you to point antennas based on azimuth and elevation of the antenna mechanical boresight. In this simulation, these are defined directly and for the base station the downtilt is an important parameter. In other simulations, antennas may be pointed towards other stations or can be made to scan between defined angles.
Propagation Models – in this type of scenario the propagation model used and the model parameters are of vital importance. This is an area where the power of Visualyse Professional becomes apparent. The baseline scenario uses Recommendation ITU-R P.452 with no terrain, under assumptions of long term interference conditions (i.e. 50% of time). Below there is discussion of the impact of varying model scenarios.
You can also vary the rain rate, but by default this is determined per Recommendation 837 using the IDWM database.
Deploying the WiMAX Network – Visualyse Professional allows you to define deployments of many stations in several ways. In this case, we have imported the locations at defined latitudes and longitudes or use the hexagon deployment facility in the Service Area Wizard.
In other scenarios, you could move stations randomly over a defined area using the Define Variable module (allowing you to do statistical analysis using location as Monte-Carlo variable).
Propagation Model Variations and Nuances
Propagation loss is the key factor in determining the size of exclusion zone around a station. In Recommendation 452-16 anomalous propagation modes dominate for short time scales and this leads to relatively low path loss and large exclusion zones.
Normally, planning criteria for earth stations are required to address short term statistics for availability and this may require, under worst case assumptions, short term statistics for interference.
Hence our baseline uses 50 % of time. However, the earth station performance is defined in terms of C/I and the 0.1% statistics could be driven by fading on the satellite link.
Technically, we should perform a numerical correlation between C and I, which we can do in Visualyse Professional. However, to illustrate the effect, we have re-run the static analysis for 0.1%, 1% and 20% time in the propagation model.
As the percentage time varies from 0.1% to 1% and to 20% the exclusion zone size decreases accordingly.
 |  |  |
|---|---|---|
| 0.1 % | 1% | 20% |
Note these figures assumed the same I/N threshold: in practice, there are different ones for short term and long term. But it shows how important it is that the threshold and percentage of time used in the propagation model are correctly selected.
Terrain
Another important factor in the propagation is the effect of terrain. Visualyse Professional allows you to use any latitude / longitude / height terrain data with a minimum of fuss.
Introducing terrain can have a radical effect on the exclusion zone and whilst this may not be used in initial planning / coordination triggering, it can certainly be used in site specific coordination.
If you have the Terrain Module you can extend the final simulation by adding terrain and seeing the impact on the exclusion zone.
If you do not have the Terrain Module you can still see the effect by removing your dongle and loading up the relevant example file. If Visualyse Professional does not find a dongle it runs in demonstration mode which gives limited access to all the Modules.
-
This is particularly appropriate given that WiMAX has been accepted as a radio interface for IMT-2000 within the ITU framework ↩
Building the Simulation Files
Plan of Action
Now we will build a simulation from scratch. The following steps outline the approach needed:
-
Create the WiMAX Network
- Make a sectored antenna
- Create single base station
- Create and configure a transmit link
-
Define the FSS earth station:
- Make a single beam antenna
- Create a single station
- Create and configure a receive link
-
Set up the interference calculation from WiMAX into the Earth Station (ES)
The resulting file is useful in its own right as it gives an example of the sort of simulation that can be used to coordinate a single specific base station with an earth station.
-
Set-up an area analysis showing the exclusion zone around the WiMAX base station:
- Define the threshold criterion
- Use the area analysis to show points below the threshold in a different colour from points above the threshold.
Once the simulation is set up there are several things that you can do with it – for example use mitigation to reduce the exclusion zone.
In addition, it can be useful to consider the effect of multiple base stations and so the final stage is to set up a hexagonal grid of base stations to determine the coverage of the network.
Finding Your Way Around
The basic simulation will comprise two systems, the satellite Earth station and a WiMAX base station.
In Visualyse Professional systems and scenarios are built from the basic building blocks including Antennas, Stations, Station Groups, Carriers, Links, Link Groups, Propagation Environments, Interference Paths, plus other more specialised ones. Note you do not always need all of these blocks!
In this case, you will need to make:
Antennas: Two: one for the Earth station and one for the base station
Stations: Three: the Earth station, the GSO satellite it is pointing at, and the base station
Carriers: Two: one for the satellite downlink and another for the WiMAX downlink
Links: Two: a transmit link to define emissions from the WiMAX base station and a receive link for the satellite Earth station
Interference Paths: One: from the WiMAX Transmit link to the Earth station receive link
All these can be found on Visualyse Professional’s Model menu, which brings you to list managers that can be used to add, delete, modify, and duplicate items of that type.
Often if you click on “Add” you will be given the option to specify what sort of object you want to configure – for example the screen shot below shows the list to manage stations and what happens if you click “Add”.
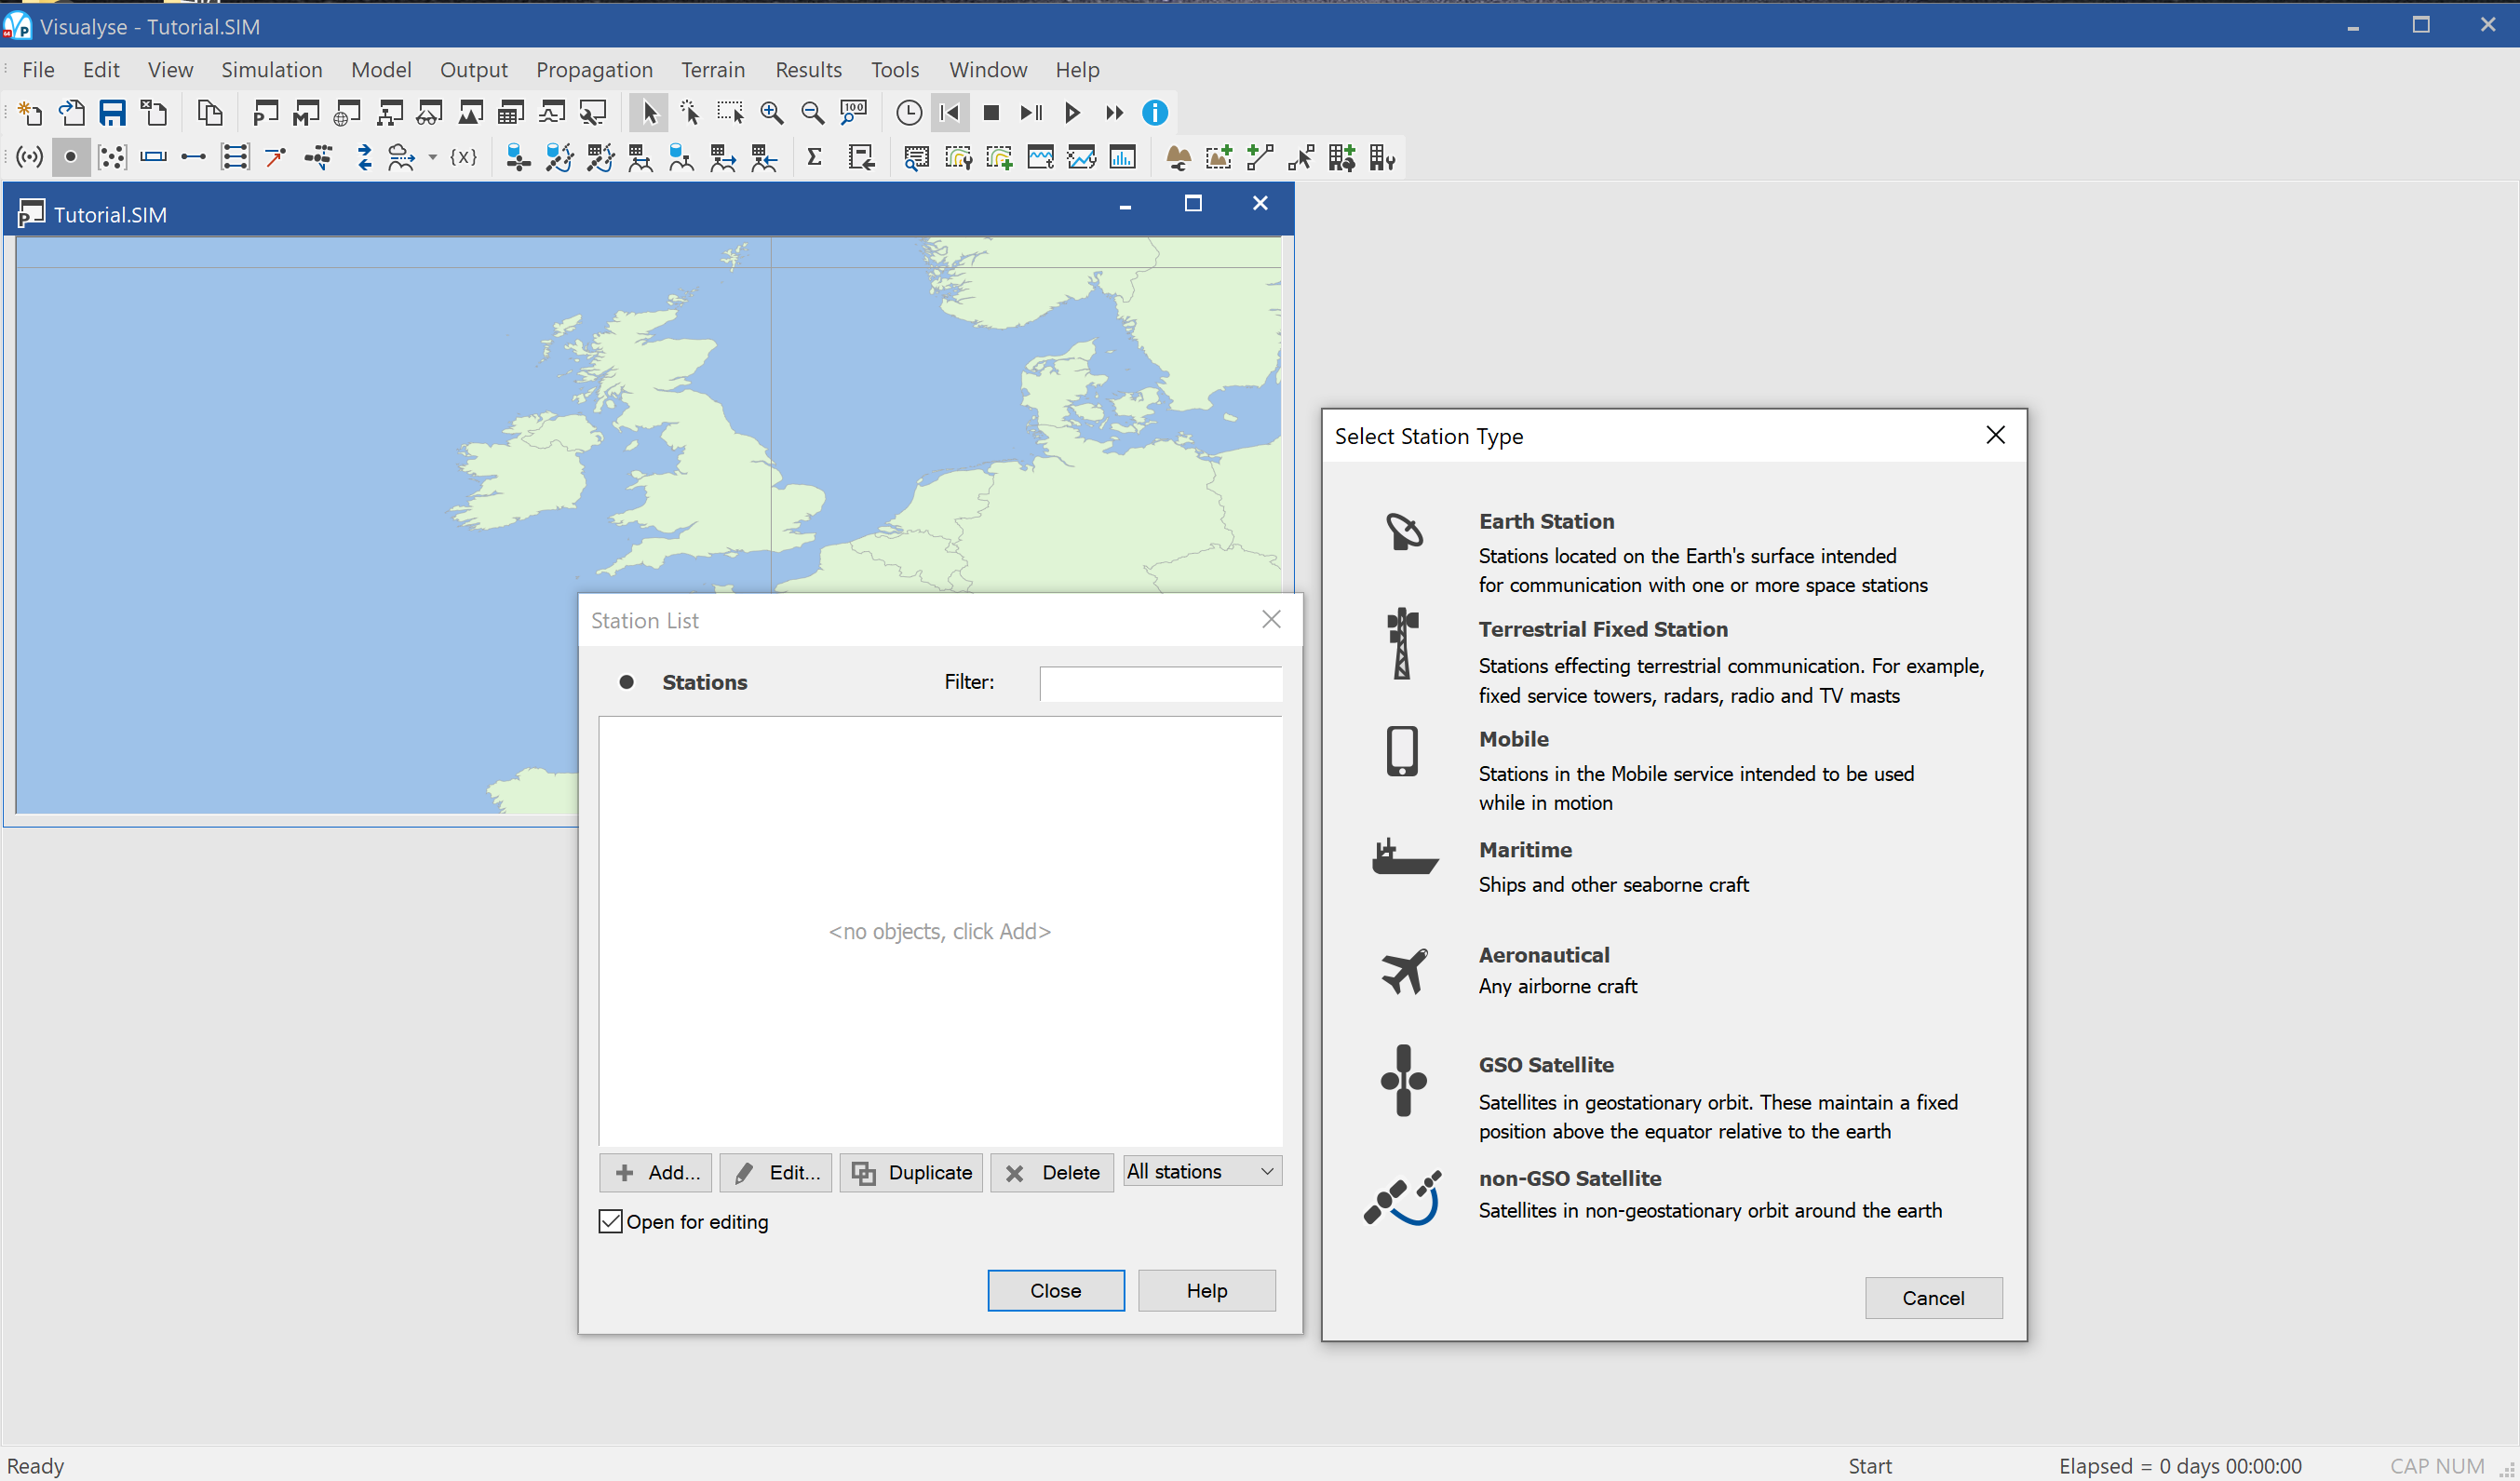
You will also need to configure:
Propagation Environments: Configure the propagation models for Terrestrial Fixed links such as from the WiMAX base station to Earth station path
These can be found under the “Propagation” menu.
Input Parameters
WiMAX Parameters
For this exercise, we will use the following document as a reference for our WiMAX system.
Reference 1: Mobile WiMAX – Part I: A Technical Overview and Performance Evaluation, prepared on Behalf of the WiMAX Forum February 21, 2006
In the first instance, we want to extract the essential features of a WiMAX network needed to make Visualyse Professional models of the sharing scenario.
We start with the base station network. As noted above we are going to model two WiMAX scenarios:
- Single entry interference from a single base station
- Aggregate interference from a deployment of multiple base stations
A key fact for the aggregate cases comes from Reference 1 (p28) relates to frequency re-use.
The sub-channel reuse planning can be dynamically optimized across sectors or cells based on network load and interference conditions on a frame by frame basis. All the cells and sectors therefore, can operate on the same frequency channel without the need for frequency planning.
Hence when we consider the possible aggregate interference from multiple base stations we can assume all co-frequency, and therefore we need to have a representative deployment.
It can be time consuming to fully engineer a network with good coverage with the minimum of base stations, so it is often the case that simplifying assumptions are used.
One such assumption is that the base stations are regularly spaced on a grid – Visualyse Professional can do this so it’s a good starting point.
Alternatively, we can do a rough engineering job by moving stations by hand to optimise the network coverage.
A final option is to import station locations from an excel spreadsheet – perhaps sourced from an assignment databases.
We can try all three in different groups. Using different approaches, each valid to some degree, is a good way to check the sensitivity of the conclusions from the analysis.
Reference 1 gives us a starting point for the base station to base station distance of 2.8 km – that and other parameters are given in the table below.
| Parameter | Value |
|---|---|
| Number of 3-Sector Cells | 19 |
| Operating Frequency | 2500 MHz |
| Duplex | TDD |
| Channel Bandwidth | 10 MHz |
| BS-to-BS Distance | 2.8 kilometres |
| Minimum Mobile-to-BS Distance | 36 meters |
| Antenna Pattern | 70° (-3 dB) with 20 dB front-to-back ratio |
| BS Height | 32 meters |
| Mobile Terminal Height | 1.5 meters |
| BS Antenna Gain | 15 dBi |
| MS Antenna Gain | -1 dBi |
| BS Maximum Power Amplifier Power | 43 dBm |
| Mobile Terminal Maximum PA Power | 23 dBm |
| # of BS Tx/Rx Antenna | Tx: 2 or 4; Rx: 2 or 4 |
| # of MS Tx/Rx Antenna | Tx: 1; Rx: 2 |
| BS Noise Figure | 4 dB |
| MS Noise Figure | 7 dB |
Note use of dBm for the transmit power rather than dBW as entered into Visualyse Professional.
Satellite ES Parameters
Several satellite operators provide services in C band. The parameters used below are generic not specific to one network.
Building a Basic Simulation
The first stage is to create a simulation that models interference at a single point.
Stage 1 - Defining a Single Base Station
The following bullet points outline the steps you need to take and the parameters you need to input
- You need to create a single antenna with three identical beams. So, you need to add an antenna and select ‘Multiple Identical Beams’.
- Reference 1 is quite sketchy about the details of the beam performance – a fairly normal situation for future planned systems standards that need to cover a wide group of implementation.
- The information we have is that the gain is 12 dB, the beamwidth 140 and the front-back ratio is 20 dB.
- We have used the parameters below
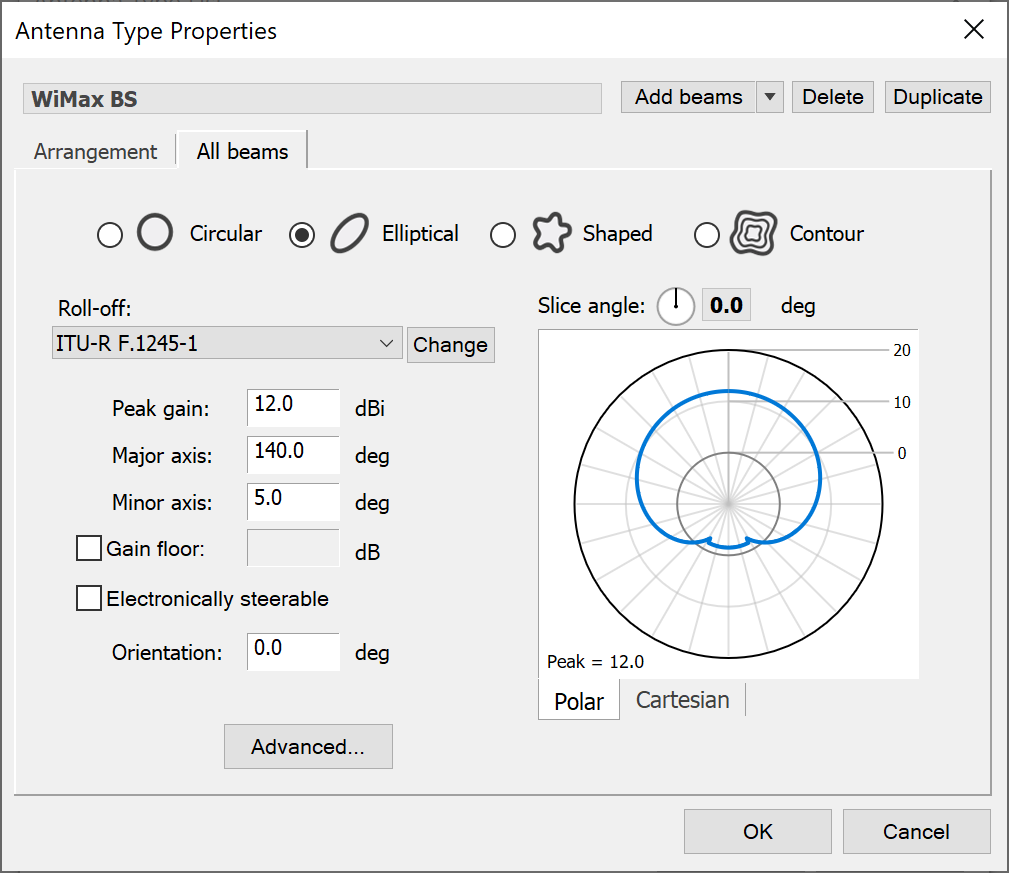
- Note use of elliptical pattern with beamwidth 140 horizontal and 5 vertical
- The beam arrangement is such that there are three equally spaced sectors – this is achieved by setting the pointing angles as shown below (note that each beam has a 2.5 downtilt).
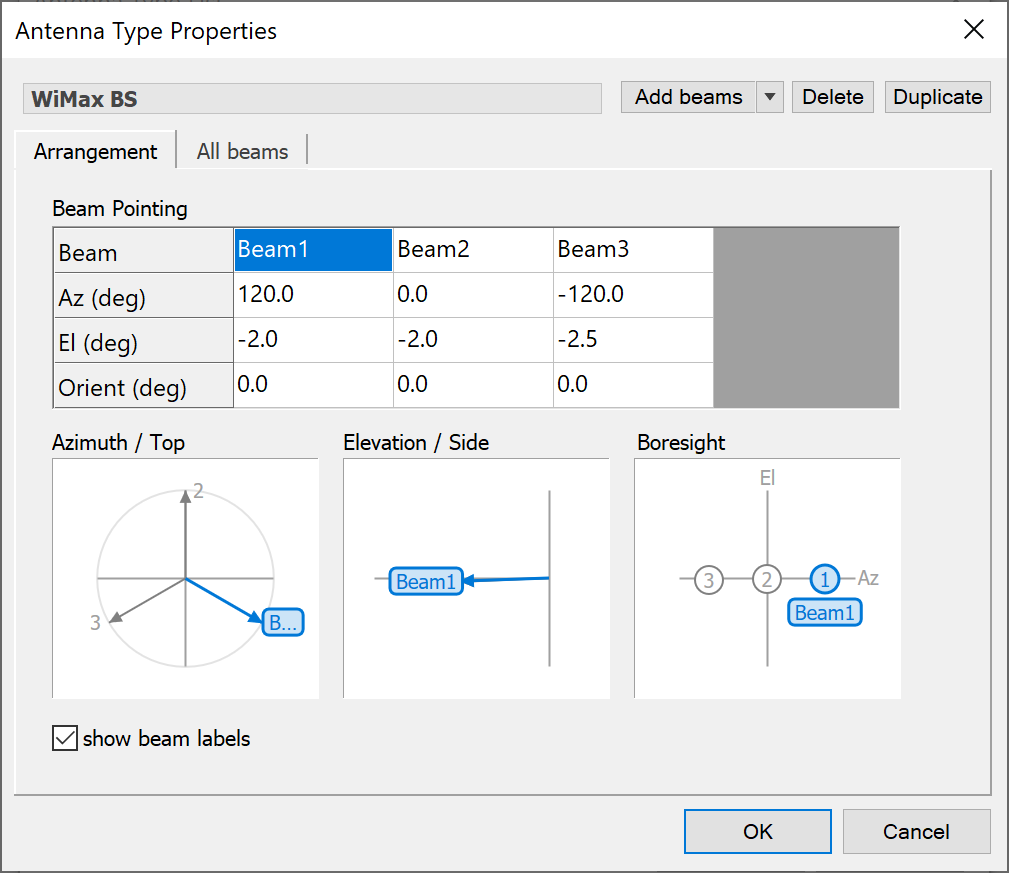
-
Once the antenna is created, make a terrestrial station at the following location:
- Latitude = -33.88
- Longitude = 151.21
- Height = 32 m as per Table 7 of Ref 1.
-
Add the antenna to it – the key parameter is in pointing the antenna. The antenna tab should look like this
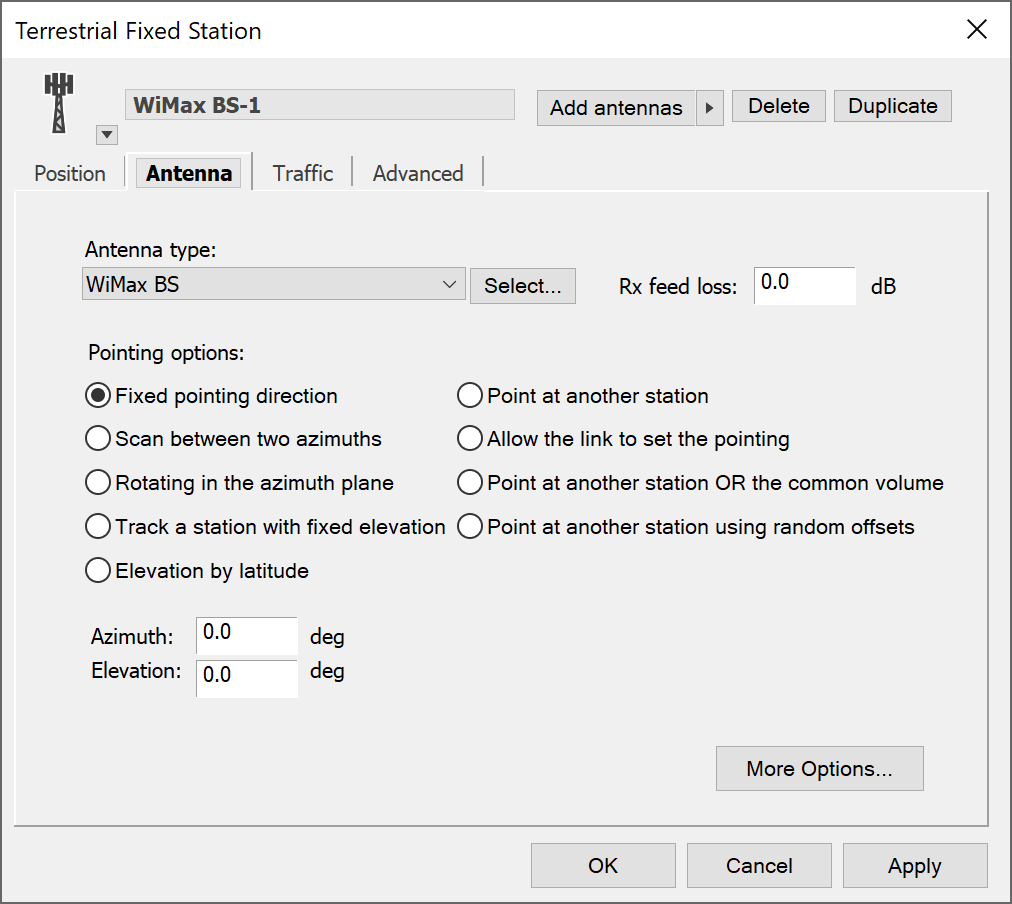
- Open a Mercator view, right click and select properties to open the view configuration and make sure:
- Features tab: Beams and Station icons are enabled
- Adornments: a grid resolution of 1° is selected
- Overlays tab: The Mercator Earth Medium overlay is enabled
- Then centre the map on the stations and zoom in using the mouse wheel until the view looks a bit like this:
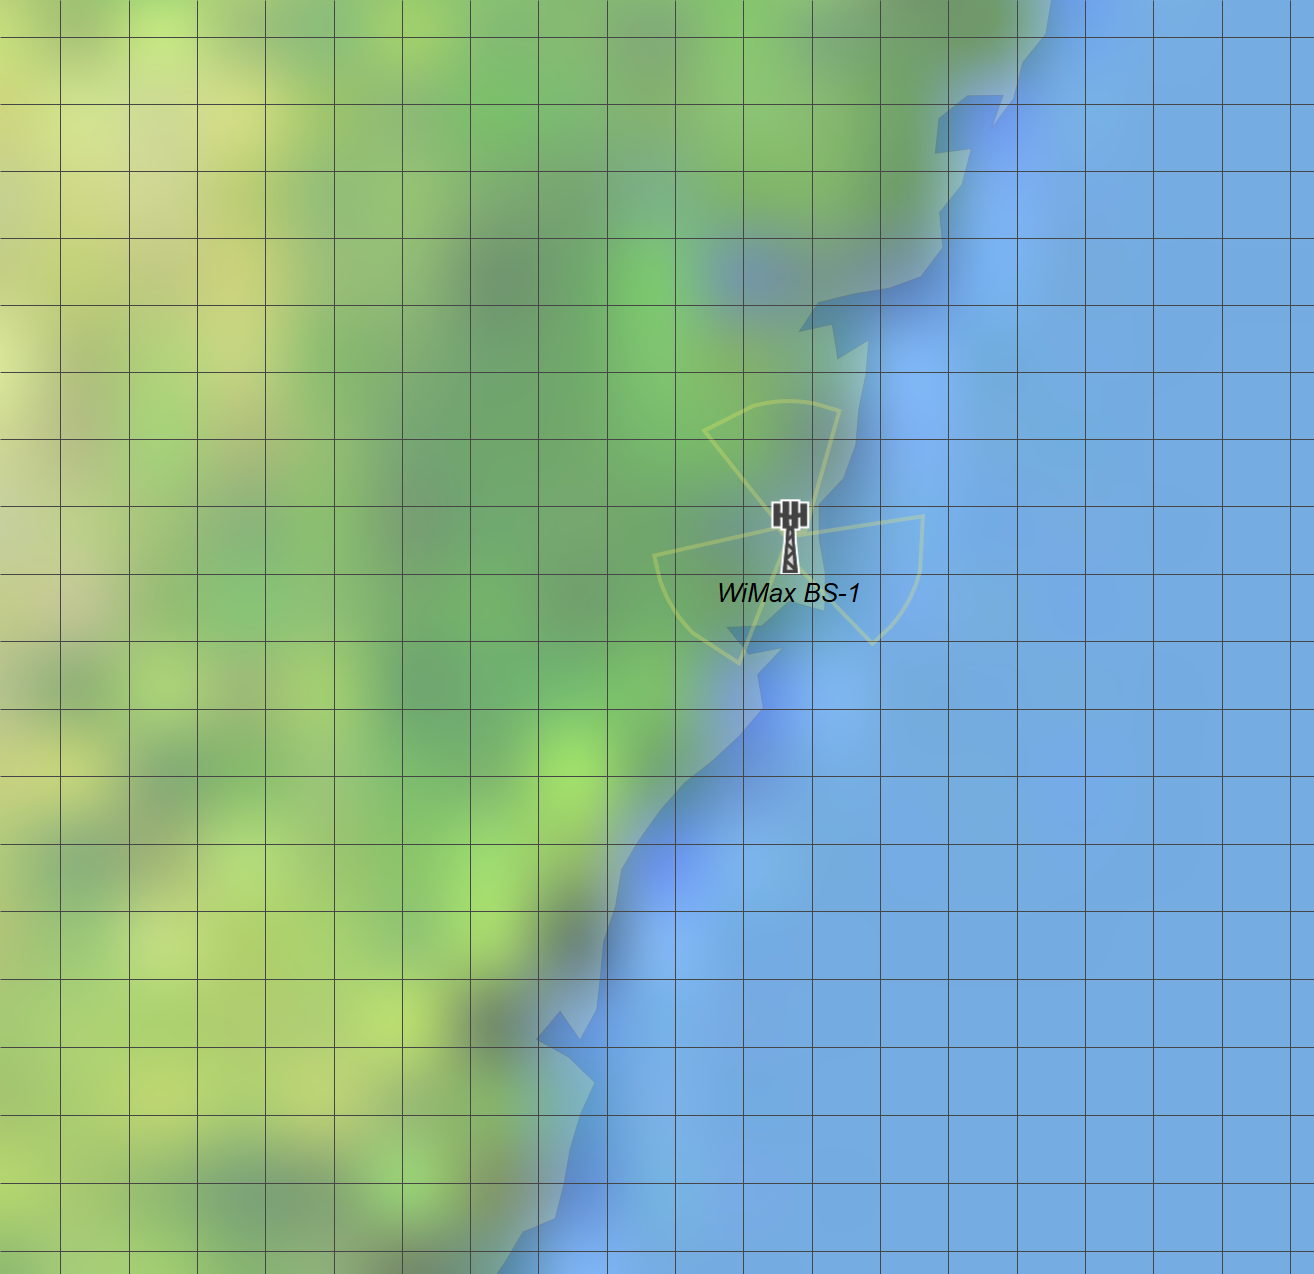
Now the question is how to define the emissions from base station and which propagation models and parameters to use.
- First create a carrier for the WiMAX with bandwidth 10 MHz and using linear polarisation
- Set up a transmit link as follows:
- Transmit all beams of the WiMAX station
- Select the 10 MHz carrier
- Set the frequency to 3.6 GHz
- Set the transmit power to 13 dBW (43 dBm)
- Set propagation environment to terrestrial mobile
We must then configure the terrestrial mobile propagation models.
The propagation model and parameters can have a huge impact as discussed above. In this case leave the model as Rec.P.452, but configure to set a fixed percentage time as in the figure below.
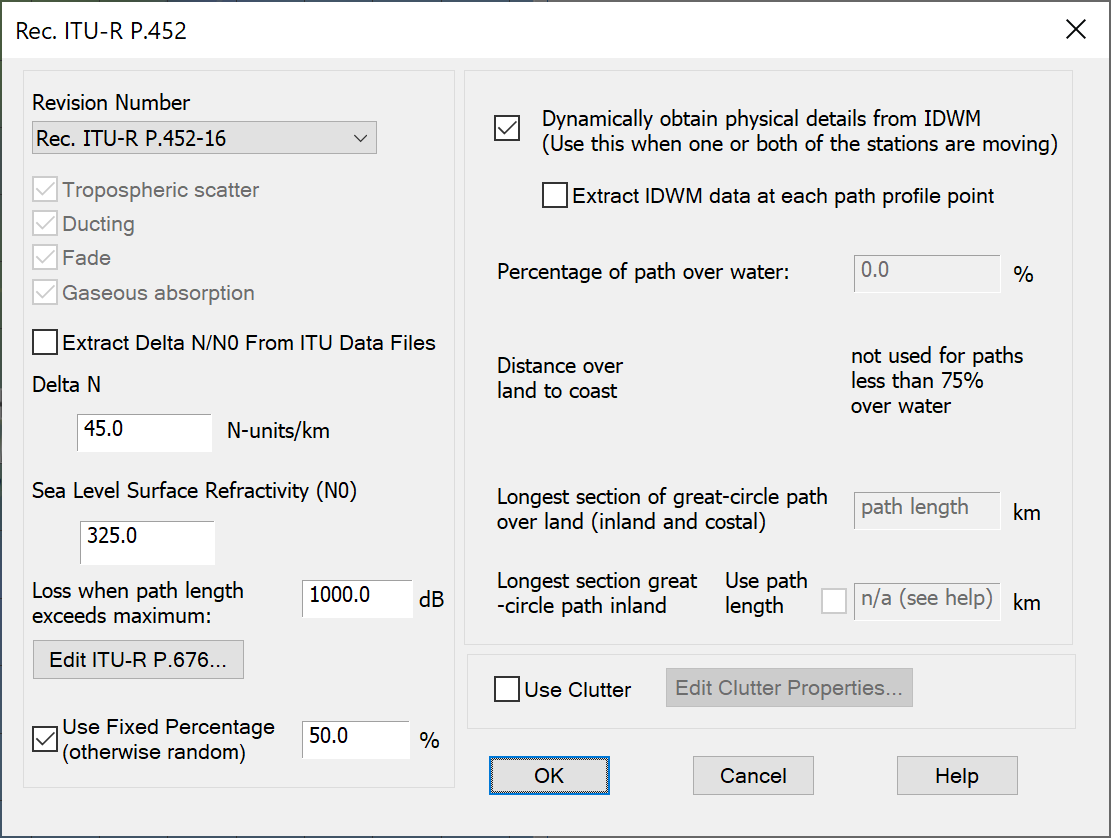
Note: We are using IDWM to tell ITU-R Rec.P.452 which paths are over sea and which over land, and hence need the IDWM Module. If you do not have this Module the simulation will still work, but with slightly different propagation over water.
Essentially this stage is now complete – you have defined a template base station. Save this work as Stage 1.
Stage 2 - Defining the Earth Station
Create a satellite ES with parameters such as:
Antenna: single circular beam antenna defined by dish size and efficiency,
- Antenna dish size = 3 m
- Antenna efficiency = 0.6
- Antenna gain pattern = Rec.S.465
GSO Satellite (to point the ES at)
- Position = 150E (this gives an elevation angle of about 17 degrees at the ES)
Earth Station:
- Position = (-33.94, 150.87)
- Height above terrain = 5m
- Add an antenna with pointing = at GSO satellite
Carrier – we will use a reference 1 MHz carrier to do the I/N calculations, hence:
- Bandwidth = 1 MHz
- Polarisation = Linear Horizontal
Having done that, create a receive link at the ES with the following:
- Frequency = 3.6 GHz
- RX Temp = 250K
- 1 MHz reference bandwidth (BW) carrier
Having done this there should be two stations as in the figure below:
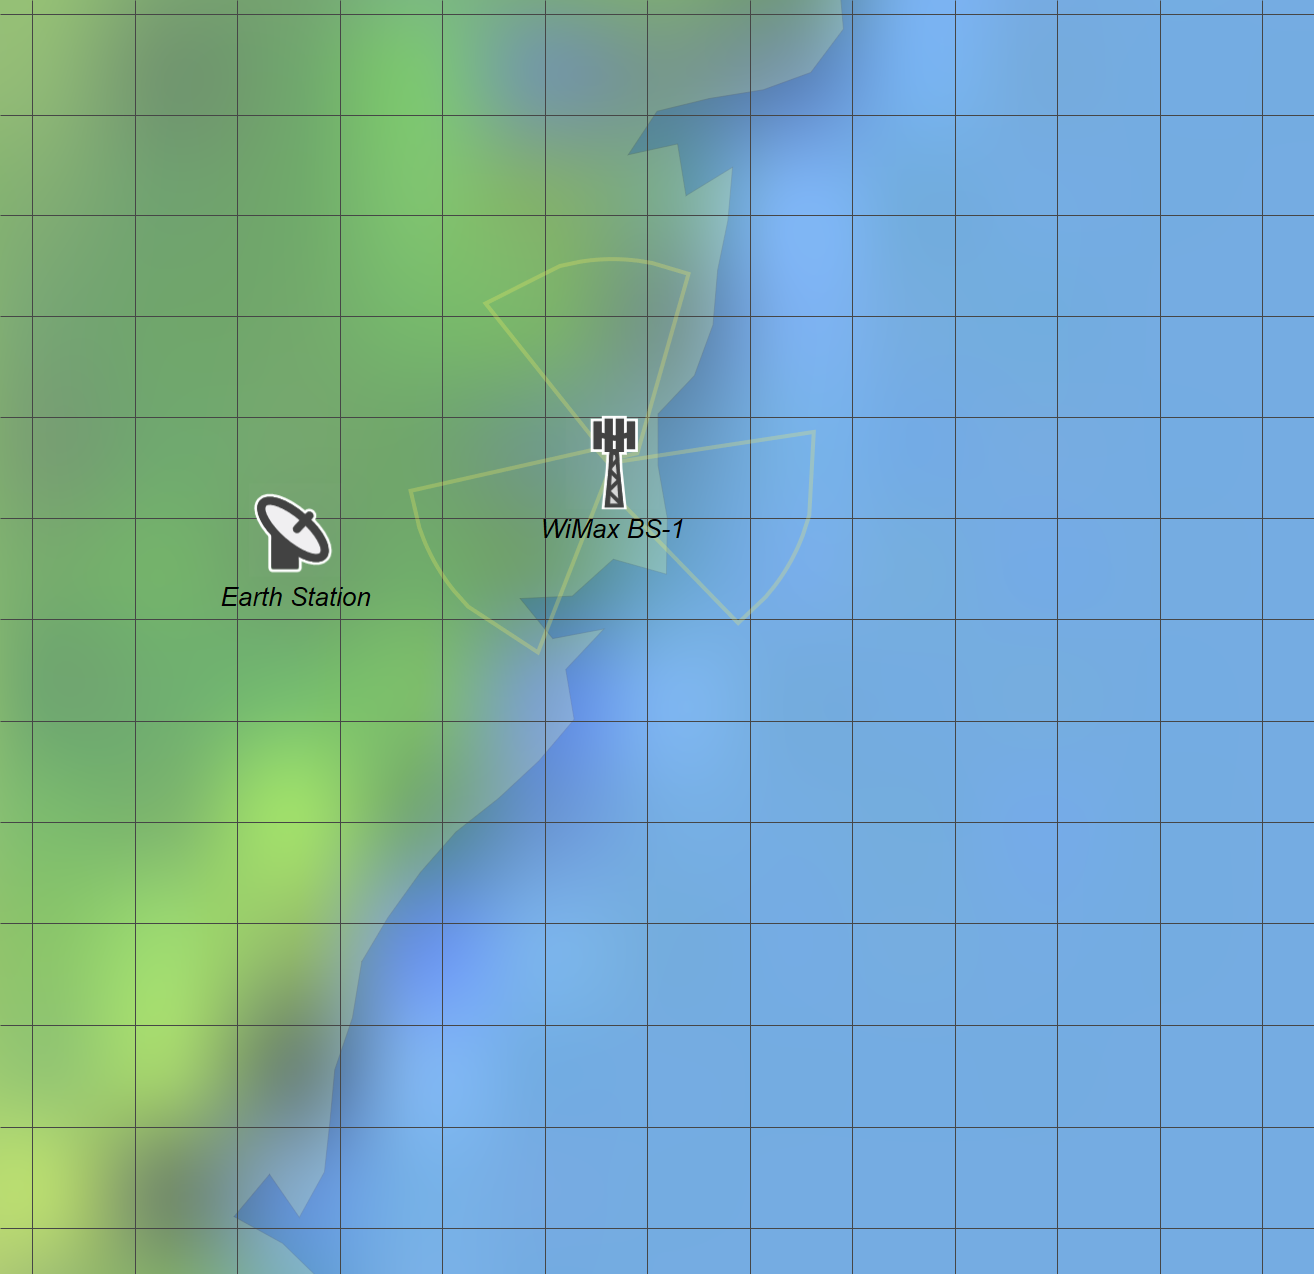
Stage 3 - Defining the Simulation
Having created the TX and RX links it is necessary to configure the rest of the simulation, and create:
Interference Path:
- Victim = ES RX link
- Interferer = WiMAX TX link
- Options = leave at default
Statistics:
- Activate I/N statistics with threshold -10 dB
Then option a watch window to look at the interfering worst single entry link budget into the ES and a terrain path profile to measure the distance between the two. The result should look at bit like this:
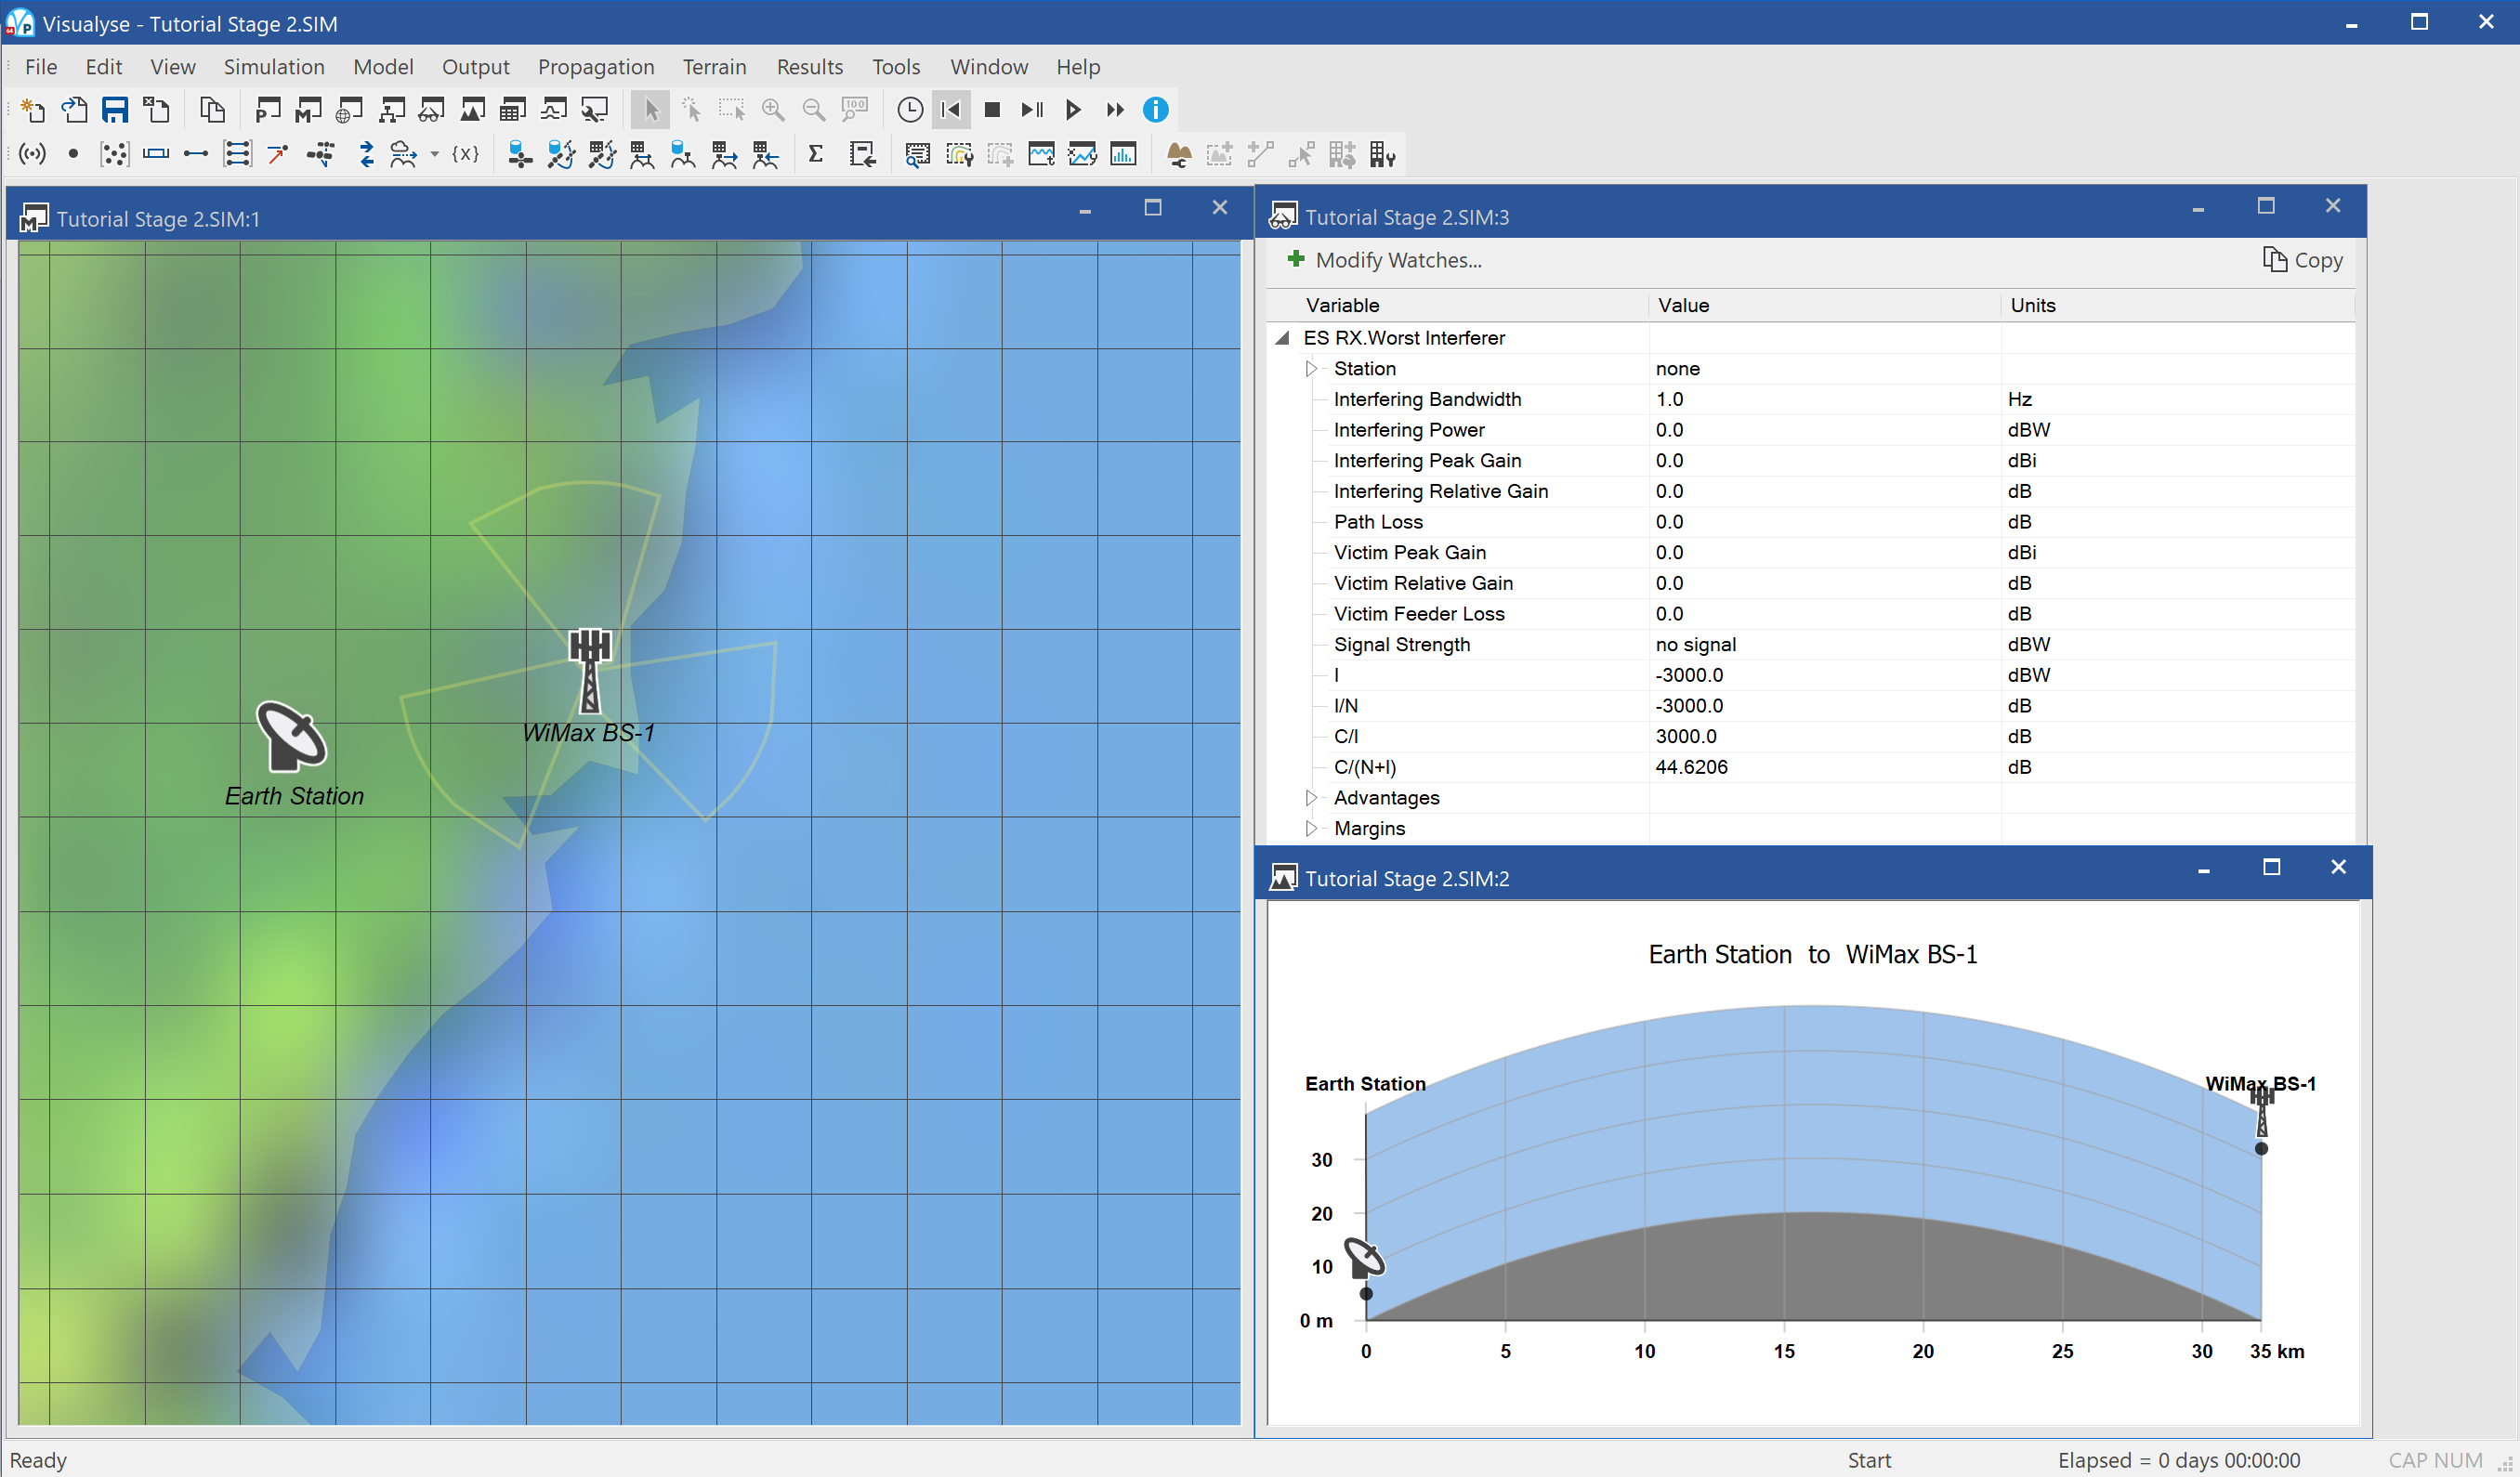
Note that the I/N exceeds the threshold even though the stations are separated by about 32 km.
This file can be saved as Stage 3.
This simulation file could be the basis of a study to coordinate the deployment of a single base station against an Earth Station. Having created the baseline file, you could vary the:
WiMAX Network:
- Antenna downtilt
- Antenna pattern (e.g. use measured data)
- Antenna azimuths
- Number of antennas
- Transmit power
Earth Station:
- Dish size
- Interference threshold
- Availability requirement (and hence % used in Rec.P.452)
Area Analysis
The next phase is to repeat the analysis undertaken at a single point (above) over an area and showing how it varies. This is done using the Visualyse Professional Area Analysis tool.
There are many ways in which the Area Analysis can be used – two of interest are to:
- Vary the location of the WiMAX base station to see how the interference at the Earth station would vary depending upon its location and define exclusion zones around the Earth station where WiMAX could not be deployed
- Vary the location of the Earth station to see how the interference it receives would vary depending upon its location, and hence define exclusion zones where an Earth station could not be deployed because of a WiMAX base station
In this case, we are going to do the second of these and vary the location of the Earth station.
To create the Area Analysis, select map view, click on the icon from the toolbar, then click in the top left of the map and drag across to the bottom right.
Within the properties select:
- Station to move = Earth Station
- Victim Link = ES Link
- Attribute to plot = the aggregate interference I/N
- Display type = colour block plots
- Plot resolution = 1 km
The completed dialog should look something like this:
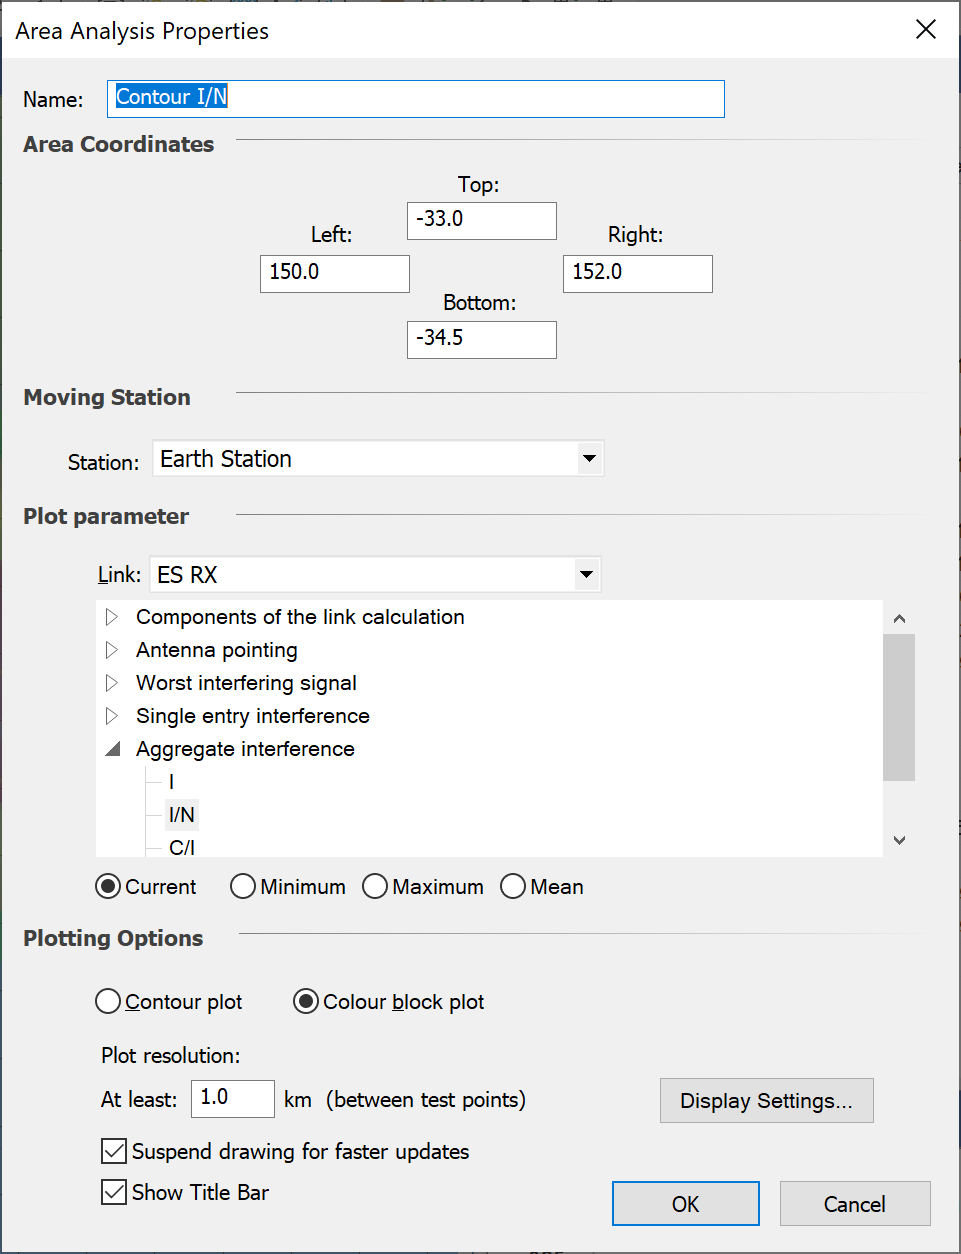
Then click on the display settings so that:
- I/N less than -20 show is not shown
- I/N between -20 and -10 is shown as green
- I/N between -10 and 0 show as orange
- I/N between 0 and 10 dB show as yellow
- I/N above 10 dB show as red
To do this, configure the control as follows:
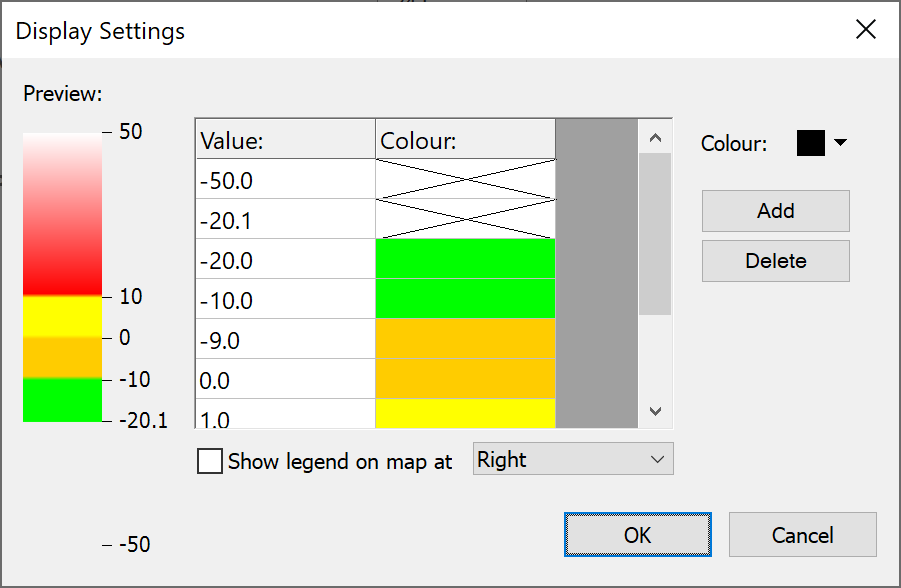
Having done this, you should see an area analysis that plots and colour codes the I/N from the WiMAX into the ES as in the figure below.
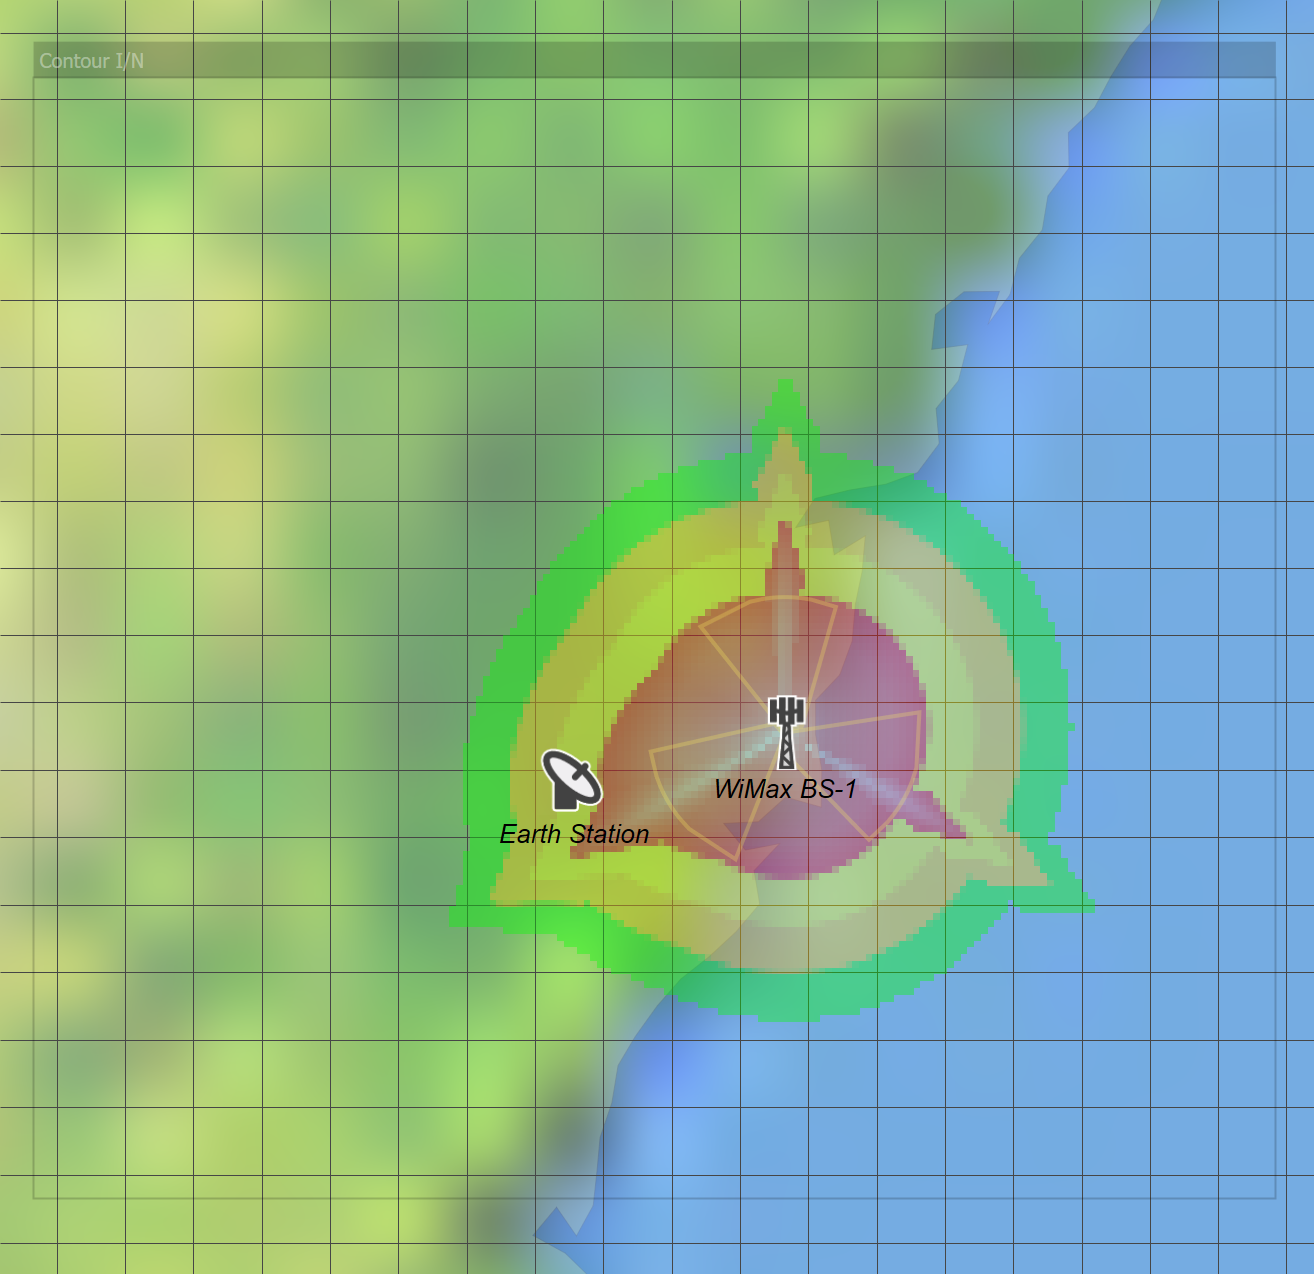
It can be seen that a large area is excluded.
A scale has been created via a grid about 10 km x 10 km by making the latitude/longitude resolution 0.09 degrees in latitude and 0.11 in longitude.
The Area Analysis has been moved to the top of the list of overlays and set semi-transparent so the underlying map can still be seen.
Note that the pattern is not symmetric! This is because the ES is pointing at the satellite at longitude 150 which is towards the North East: hence when it is to the South West it has slightly higher gain towards the WiMAX base station.
Save this simulation as Stage 4.
Consider making some, or all, of the variations on this simulation as in the table below:
| Parameter | Baseline | Variation |
|---|---|---|
| WiMAX antenna downtilt | -2.5 | 0 or 5 |
| WiMAX antenna azimuths | -120, 0, 120 | 60, 180, -60 |
| WiMAX antenna gain pattern | Rec.1245 | Table |
| WiMAX station height | 35m | 20m |
| Earth Station dish size | 3m | 1.5m or 4.5m |
| GSO satellite longitude | 94.2 | 149 |
| Rec.P.452 % time (1) | 50 % | 0.1 or 0.01% |
| Additional losses (clutter) | None | 20 dB |
| Terrain | Smooth Earth | Terrain |
| Polarisation advantage | None | Include |
Notes:
- When using other percentages of time remember that the I/N threshold will also change
Spot which increases or decreases the interfered area!
For comparison, the figure below shows a similar plot with terrain
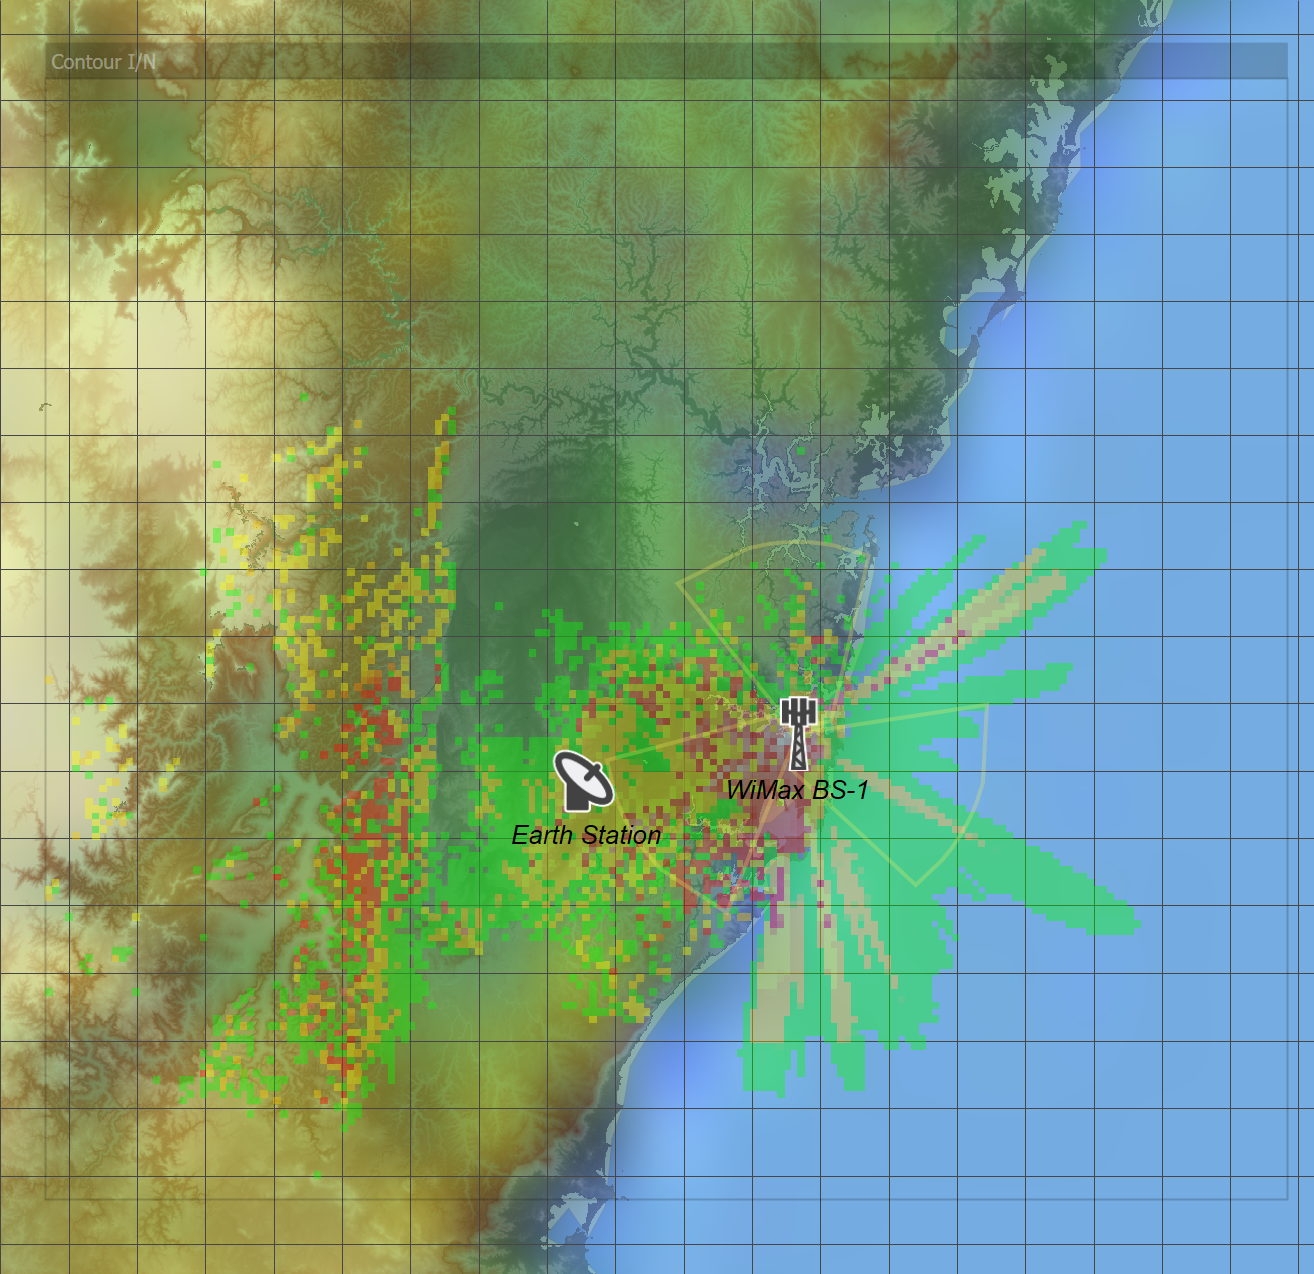
It can be seen that interference in most directions has decreased though it has increased at a minority of points.
It is noticeable how the direction of increased interference is consistent with the azimuth of the GSO satellite as seen by earth station.
Note: This file is given in the example files together with test terrain data. So, if you do not have the Terrain Module you can still see the impact of terrain by removing your dongle and loading this file in demonstration mode.
Other overlays can be displayed on the map view – such as any map data you have access to. If you have no map data, you can also export the Area Analysis into Google Earth as in the figure below.
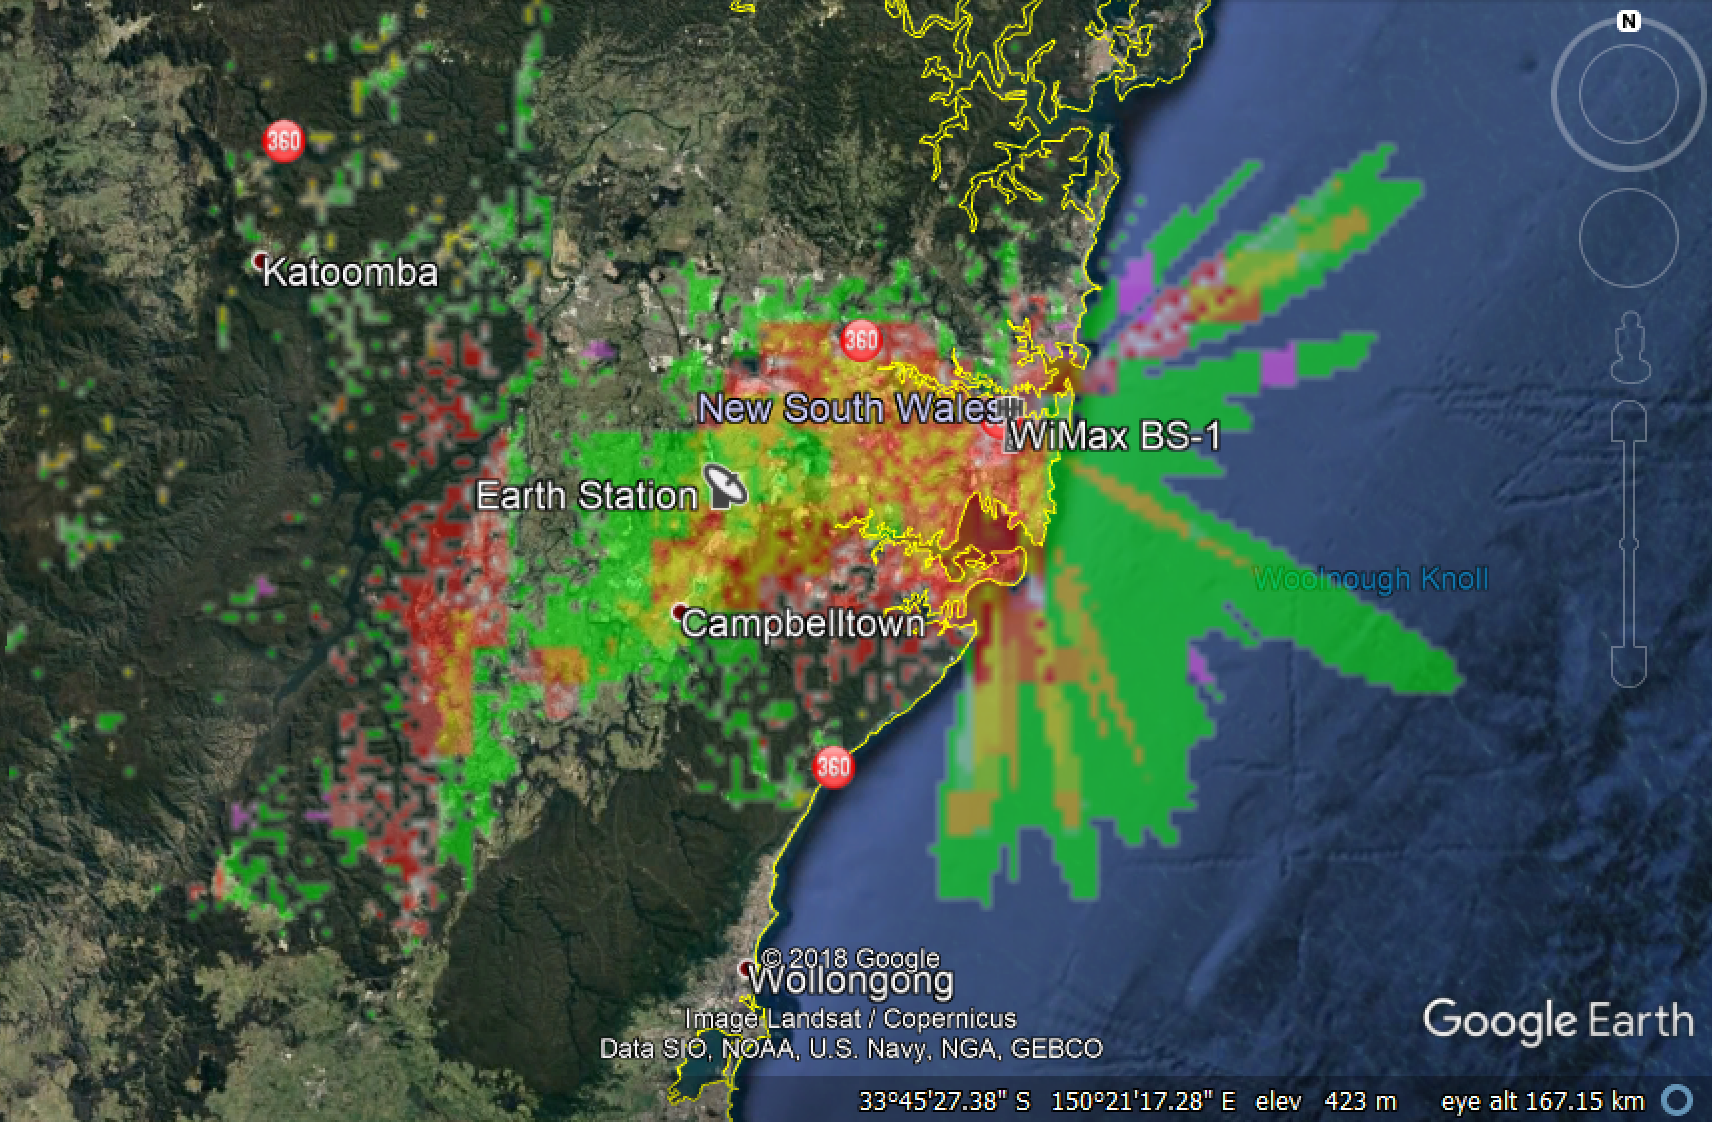
Additional Analysis
This section gives a flavour of the additional analysis that could be done from the files generated without going through the details step by step.
Site Specific Coordination
As well as helping to identify general problems and sharing constraints, Visualyse Professional is also well suited to allowing you to investigate site specific coordination problems.
The figure below shows three useful views
- The map view – explicitly showing the sectored coverage of the WiMAX base station
- The interference link budget to the WiMAX base station
- The terrain profile along the interference path.
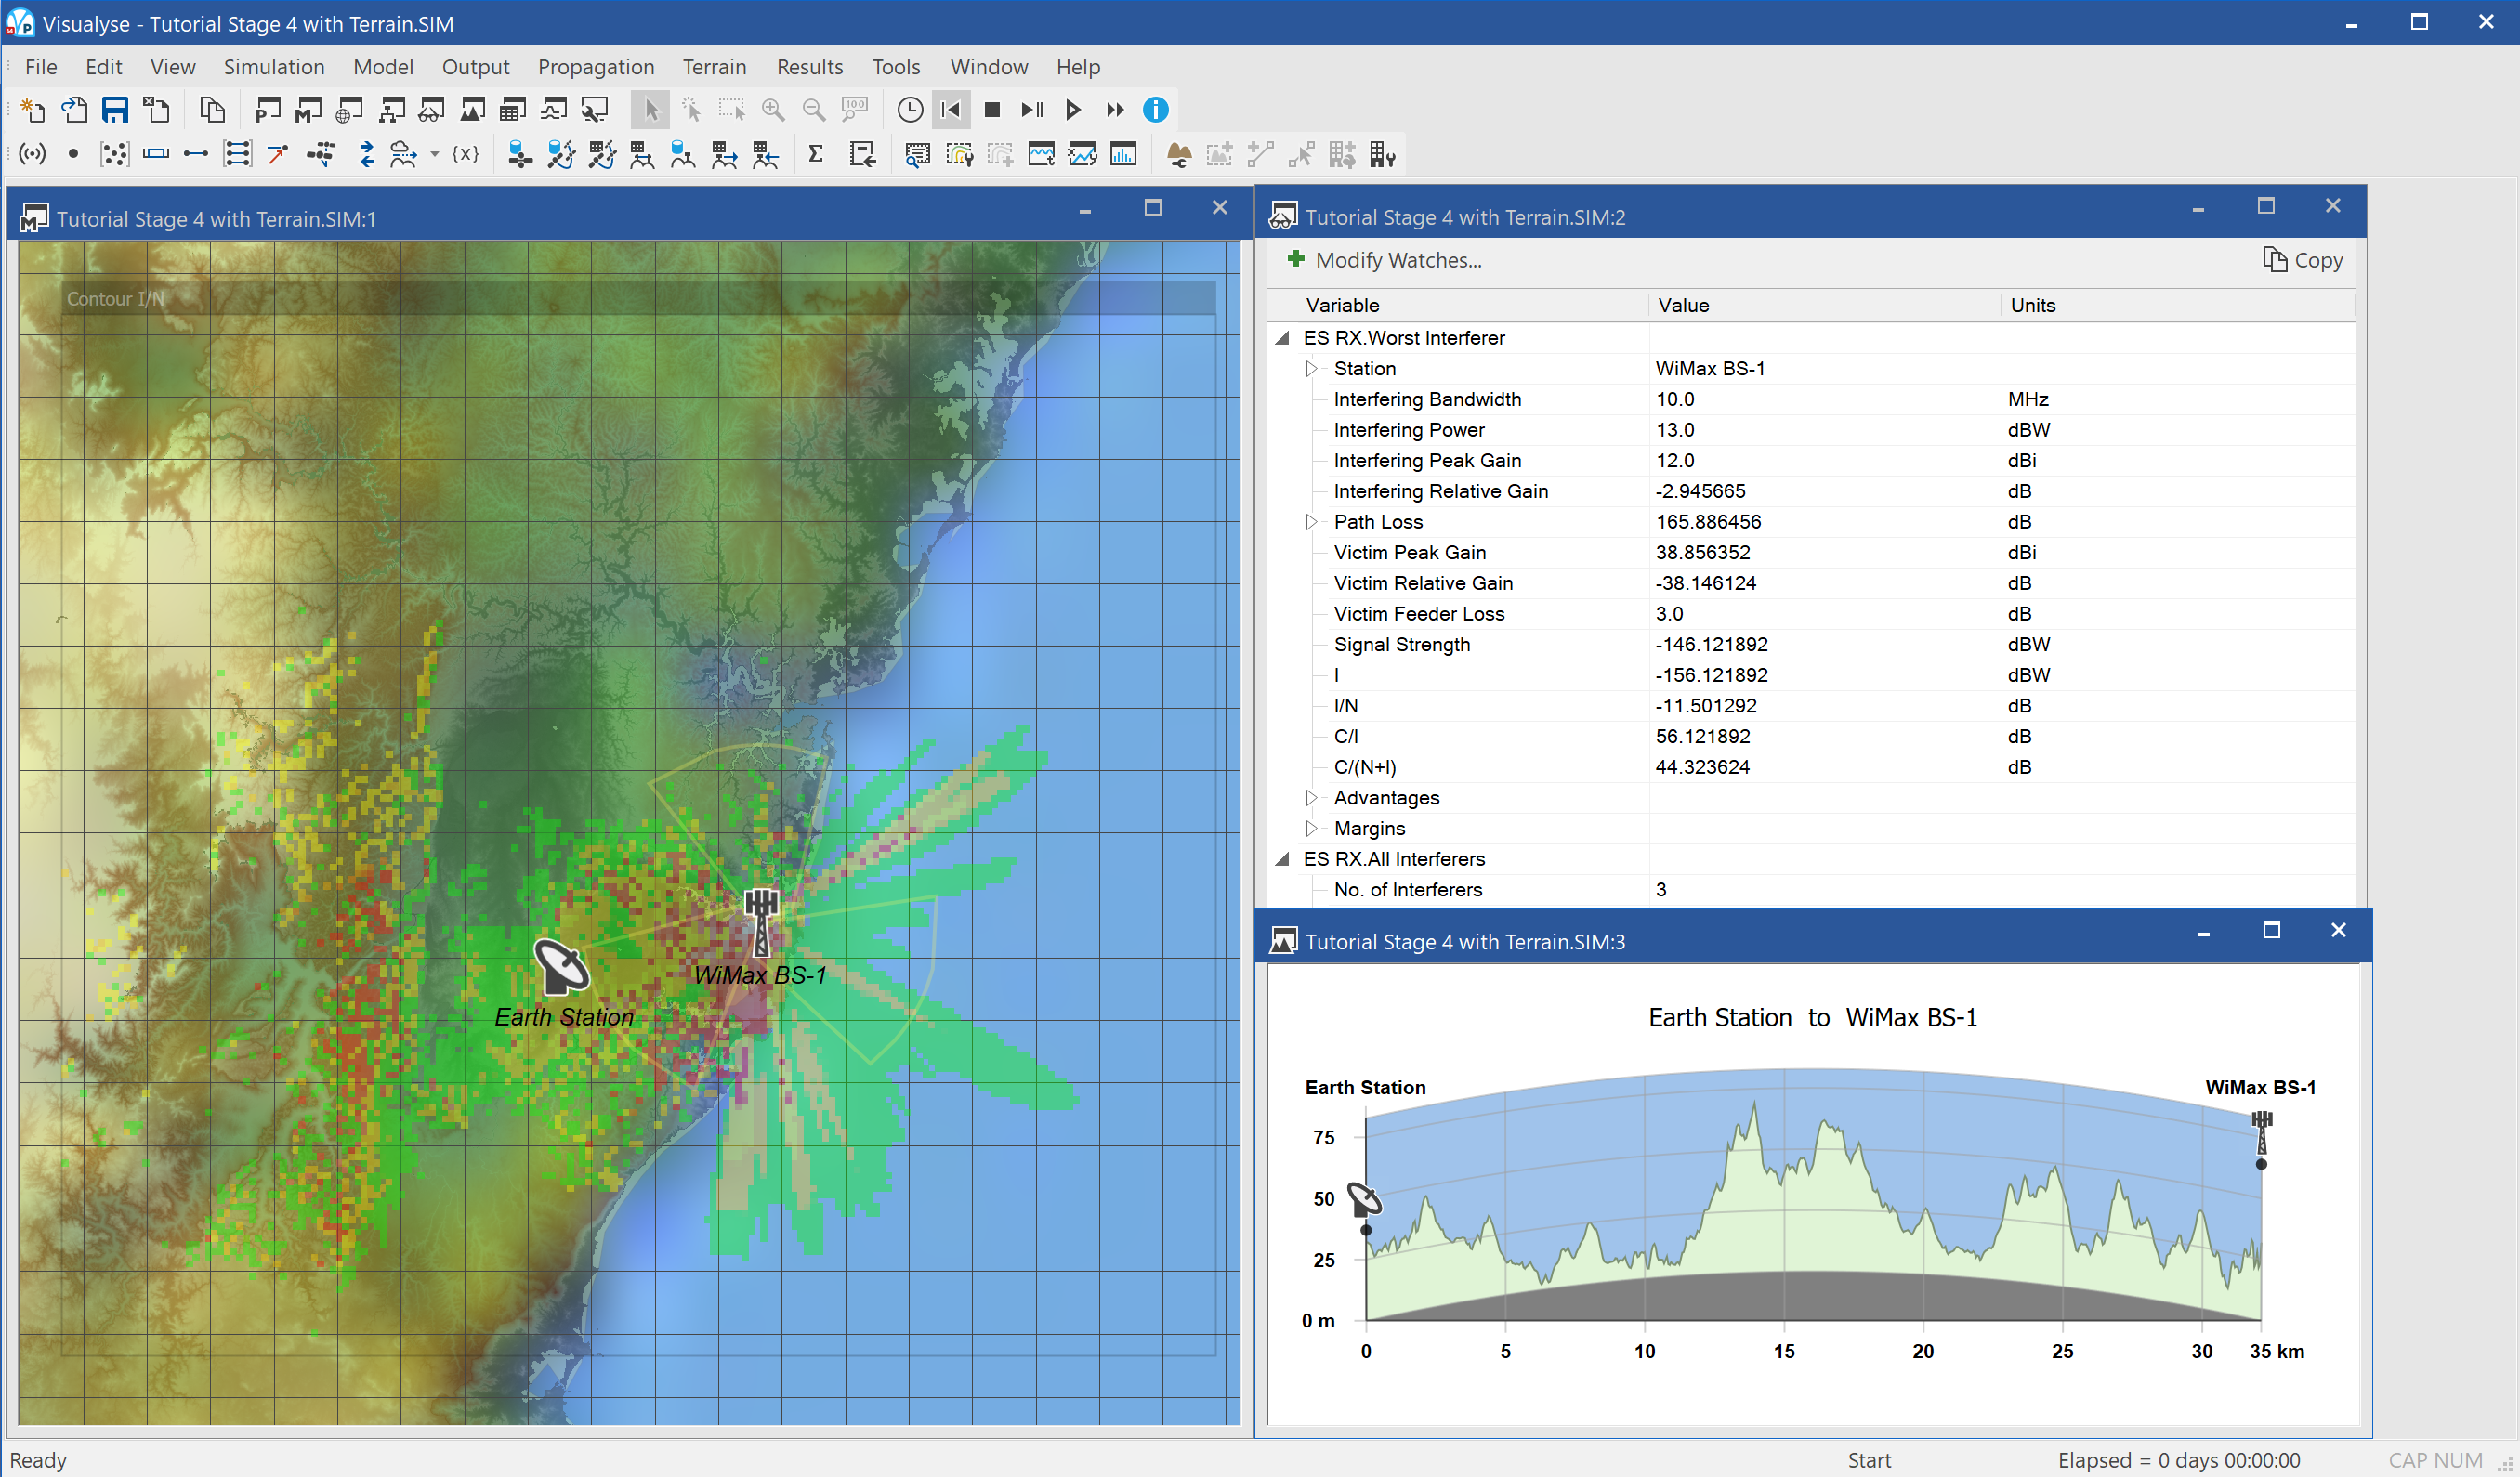
Visualyse is the ideal tool for What If? analysis – allowing you to see the impact of varying key parameters.
In this case, we could think of the following mitigation options which can be assessed easily in Visualyse.
- Move ES
- Move BS
- BS antenna downtilt
- BS antenna pointing
- BS power reduction
- ES site shielding
- Increase ES dish size
- Take account of terrain
- Reduce satellite link availability requirement or increase the permitted interference level
- Include the effect of power control by undertaking Monte Carlo analysis that convolves its effect with the variation in propagation
Question: what others could be used?
Analysis of Coverage of a WiMAX Network
In this part of the exercise we need to know three key parameters
- Density and extent of deployment of base stations
- EIRP of base stations
- Coverage requirement (in terms of received power threshold or something else)
Ref 1 gives parameters of a typical network as having 19 three-sector cells with a BS-BS distance of 2.8 km.
In the Visualyse Professional Grid Service Area wizard you can directly input the station to station distance for a regular hexagon grid. Hence with not too much effort you can set the geographic extent of the grid such that you have 20 stations separated by exactly 2.8 km on a regular hexagonal grid.
Rename the existing WiMAX base station as “Ref WiMax BS”. Then create a Station Group using the Service Area Wizard and with this base station as the template.
On the following page, enter the following latitude and longitude range:
| Max | Min | |
|---|---|---|
| Latitude | -33.83 | -33.93 |
| Longitude | +151.26 | +151.10 |
The Service Area Wizard stages are shown below:
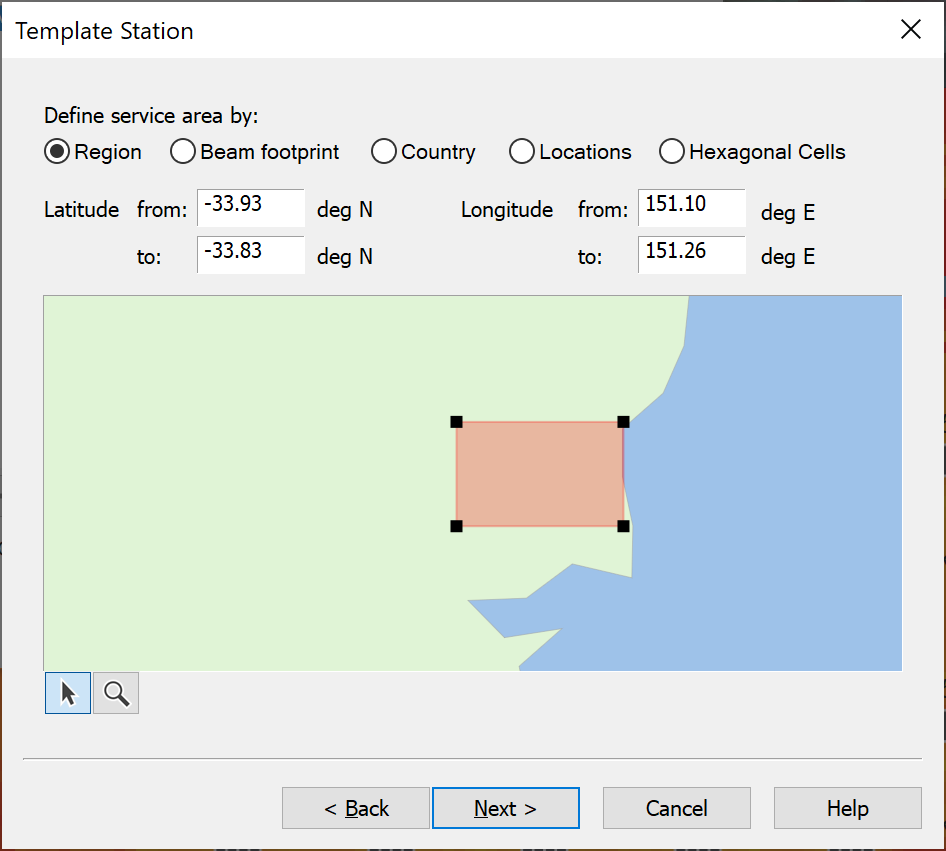
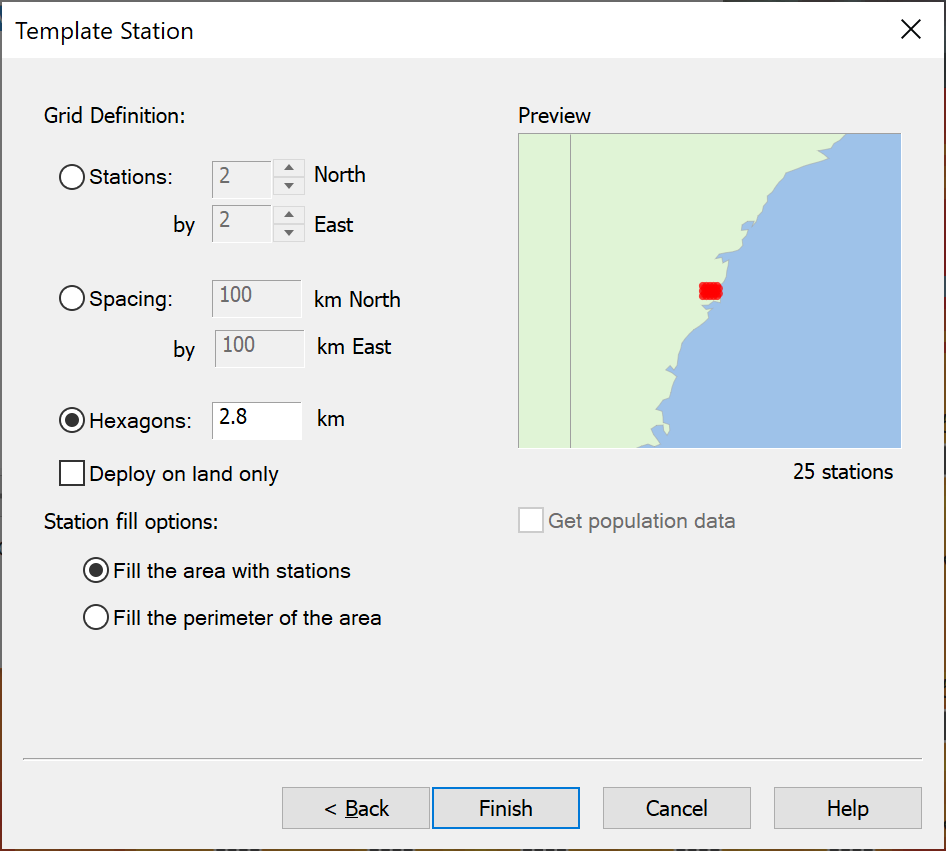
Once you have created a group of stations representing your WiMAX network, and added terrain data, you should have a window that looks something like this
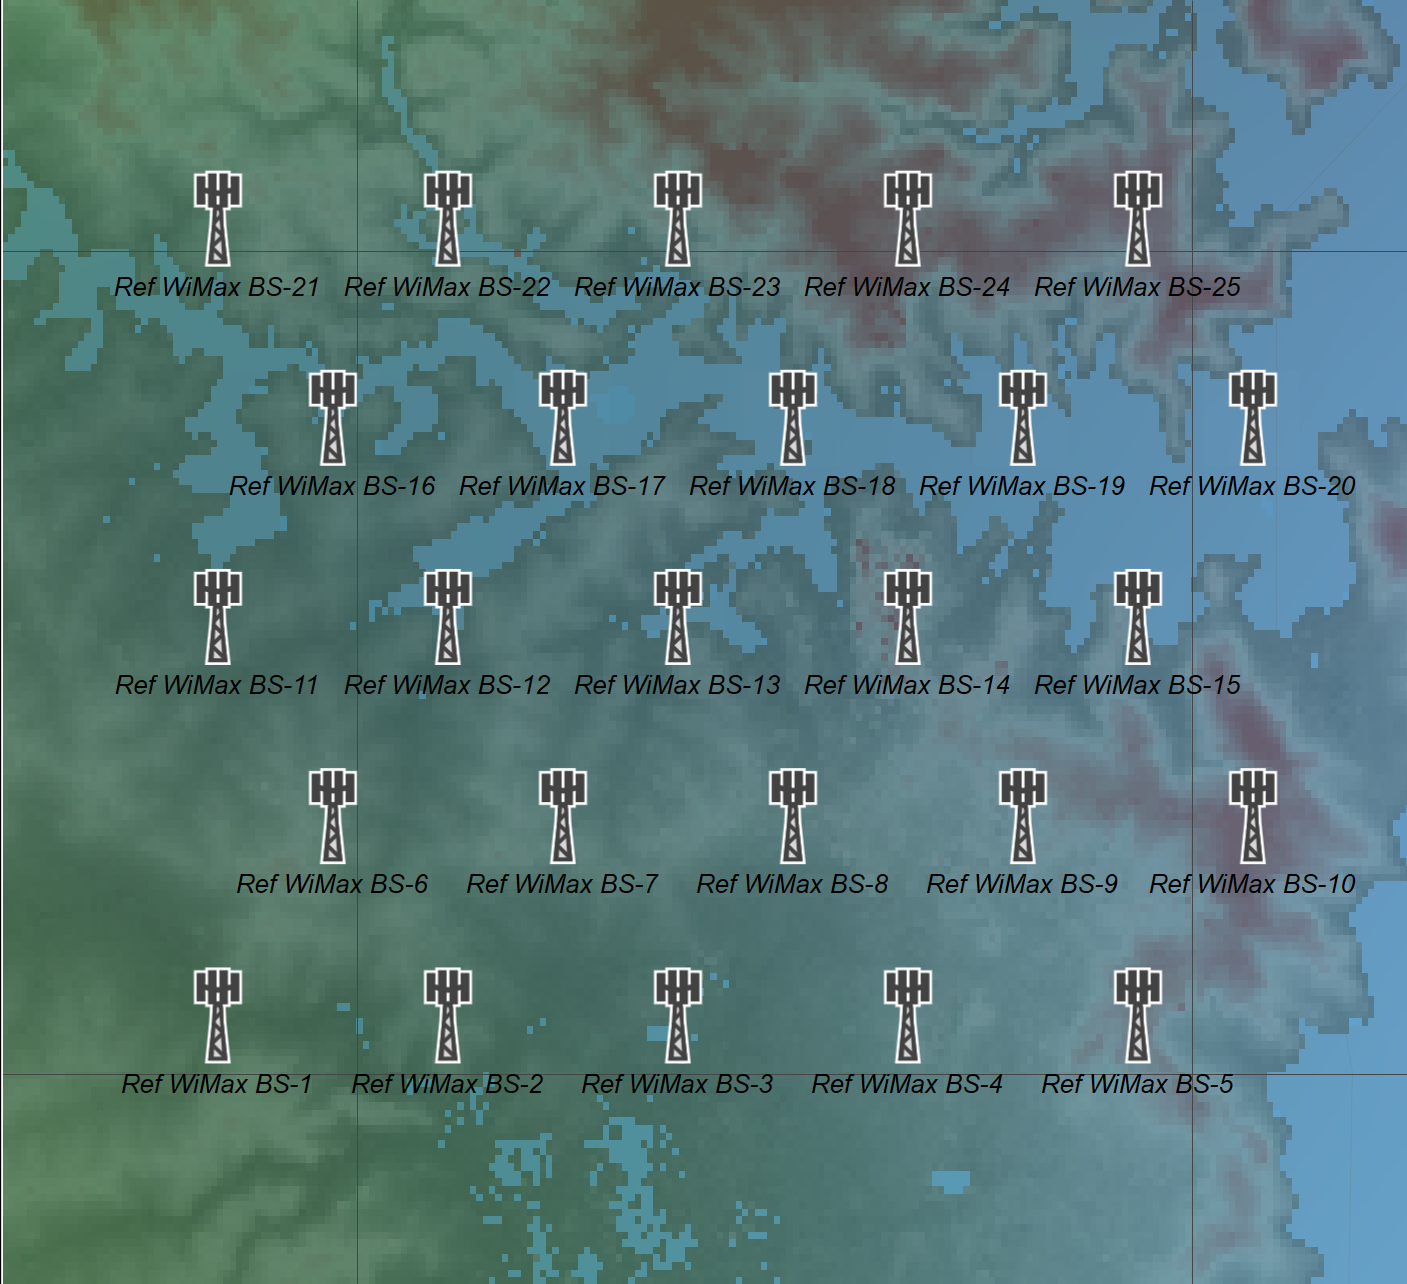
The next stage is to consider whether this network will provide reasonable coverage for mobile WiMAX, and so we need to know what the network design aim is.
Section 5 of reference one gives us example link budgets, from which we can derive the required signal level or SNR. It also gives a simpler measure i.e. maximum allowable path loss to the cell edge.
A figure of -128.2 dBW is given as the requirement for downlink data rates of 5.76 Mbps and uplink rates of 115 Kbps – so let’s use this figure. In addition, we added 25 dB to model loss due to clutter and indoor – outdoor propagation.
Therefore, the necessary steps are:
- Create a mobile station as a test point at height 1.5m with isotropic antenna of 0 dB gain
- Modify the receive link to use this mobile station and the WiMAX carrier (instead of the earth station and 1 MHz carrier)
- Modify the transmit link to use the group with all the WiMAX base stations (rather than the single reference base station)
- Modify the propagation environment for terrestrial mobile systems to have an additional loss of 25 dB
- Create an area analysis covering the locations of the base stations with resolution 0.2 km and block plot colour threshold of -128.2 dBW.
Using the Area Analysis tool to plot received signal at an isotropic antenna it is possible to show the coverage that looks something like this.
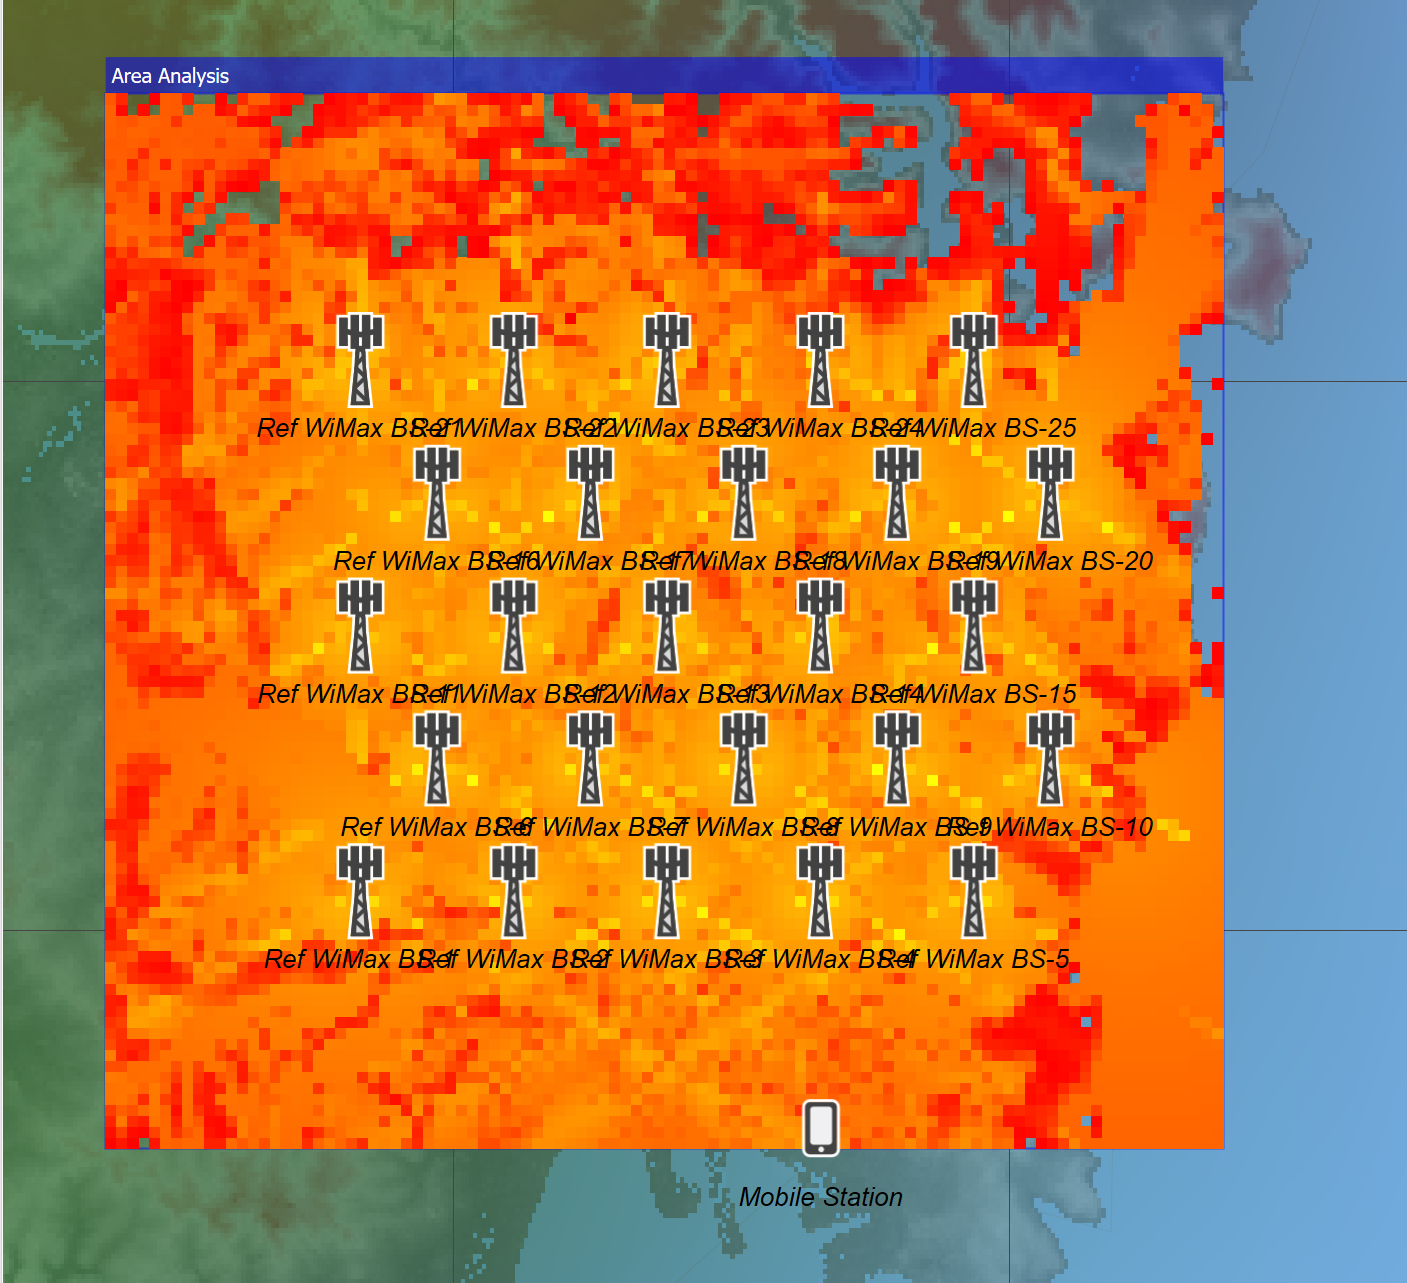
Note it is very hard to get uniform signal coverage when terrain is involved! However, in this case there is good coverage apart from a few holes. Again, this would benefit from overlay of maps if available or alternatively the coverage plot could be exported to Google Earth.
This analysis was done with 90m terrain database and constant clutter loss: more detailed analysis could use higher resolution terrain data and a land-use database.
This baseline could then be used to optimise coverage by moving the base stations.
One of the main constraints on coverage is the limited number of locations where base stations could be located – and not in Sydney Harbour! Therefore, an alternative way of defining their deployment is using the Service Area wizard with CSV file containing list of (latitudes, longitudes) for the locations to use as below:
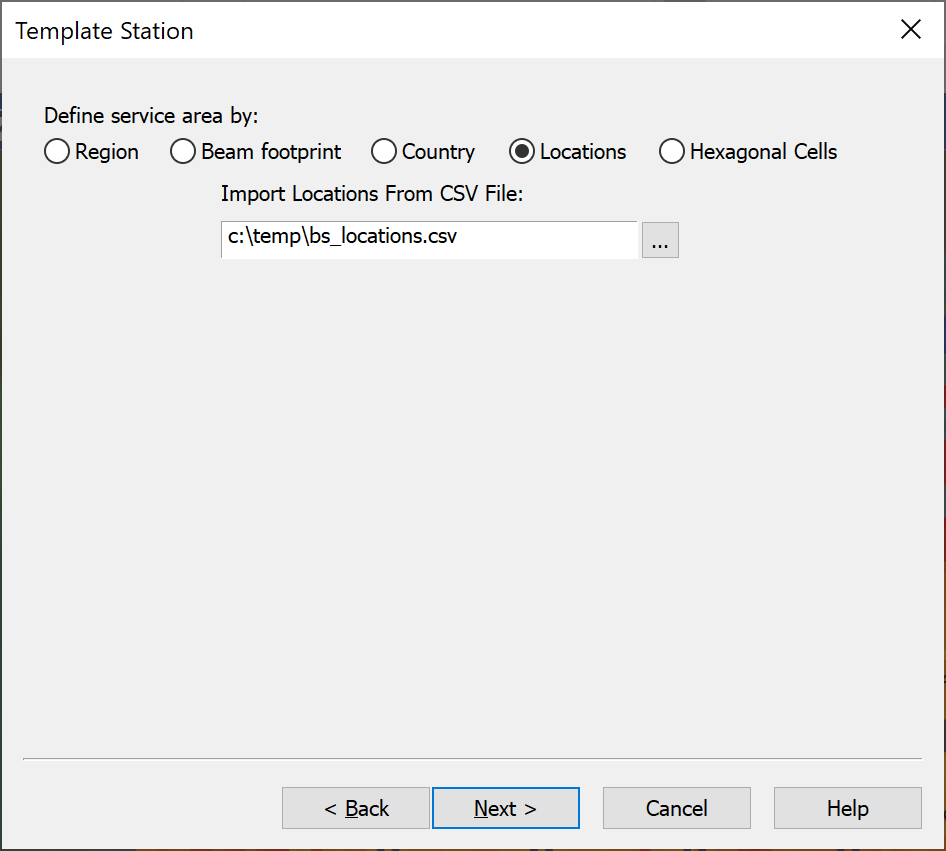
This simulation file can then be used in further analysis – for example to repeat the analysis above and identify the areas that would be excluded for use by an Earth station due to aggregate interference from the WiMAX network.
Acronyms and Abbreviations
| Acronym / Abbreviation | Description |
|---|---|
| BS | Base Station |
| BW | Bandwidth |
| CSV | Comma Separated Values |
| EIRP | Equivalent Isotropic Radiated Power |
| ES | Earth Station |
| FSS | Fixed Satellite Service |
| GSO | Geostationary Orbit |
| ITU | International Telecommunications Union |
| IDWM | ITU Digitised World Map |
| IMT | International Mobile Telecommunications |
| LTE | Long Term Evolution |
| MS | Mobile Station |
| PFD | Power Flux Density |
| RX | Receive |
| SNR | Signal to Noise Ratio |
| TDD | Time Division Duplex |
| TX | Transmit |
| WRC | World Radiocommunications Conference |
Example Files
This document describes the example files supplied with the Version 7 of Visualyse Professional. They have been selected to give an idea how Visualyse Professional can model a range of radio systems and sharing scenarios.
Visualyse Professional Version 7 is a very flexible tool to study interference between radio systems, in particular radio communication systems. We have grouped the example files into the following categories:
- Aeronautical
- Digital Dividend
- Earth station coordination
- Fixed planning and coordination
- GSO to GSO Satellite
- Maritime
- Military
- Network Coverage
- Non-GSO Satellites
- Others
- PCS/AWS
- Radiolocation
- Satellite & Terrestrial
- Short range devices
- Space Science Service
Some files require one or more of the Modules that enhance the main product:
At the start of each section there is a table which shows the modules needed for that example file. In the case of the Terrain Module it is also necessary to have the right terrain data file available, so these are also listed. The terrain files should be in the Visualyse 7/Terrain directory.
If you have a full version of Visualyse Professional you can also look at these files: however, should the example file use a Module for which you do not have a license, the demonstration might work incorrectly. In this case remove your dongle so that you operate in Demonstration Mode.
Hint: You can change the parameters to see how that would impact the results, but only at the start. You might have to reset the simulation to start: “Rewind” button on the control bar.
Note: These simulation files have in places been simplified for clarity.
Visualyse Professional
Visualyse Professional is the most widely used study tool within the ITU-R for interference analysis and radio compatibility with over 200 papers produced using it.
Visualyse Professional helps you model complex radio communication systems, including terrestrial, aeronautical, maritime and satellite, including:
- Sophisticated antenna modelling, including single beam, multiple beam, symmetric beams (as in the figure below), and fixed, random, tracking, rotating pointing methods
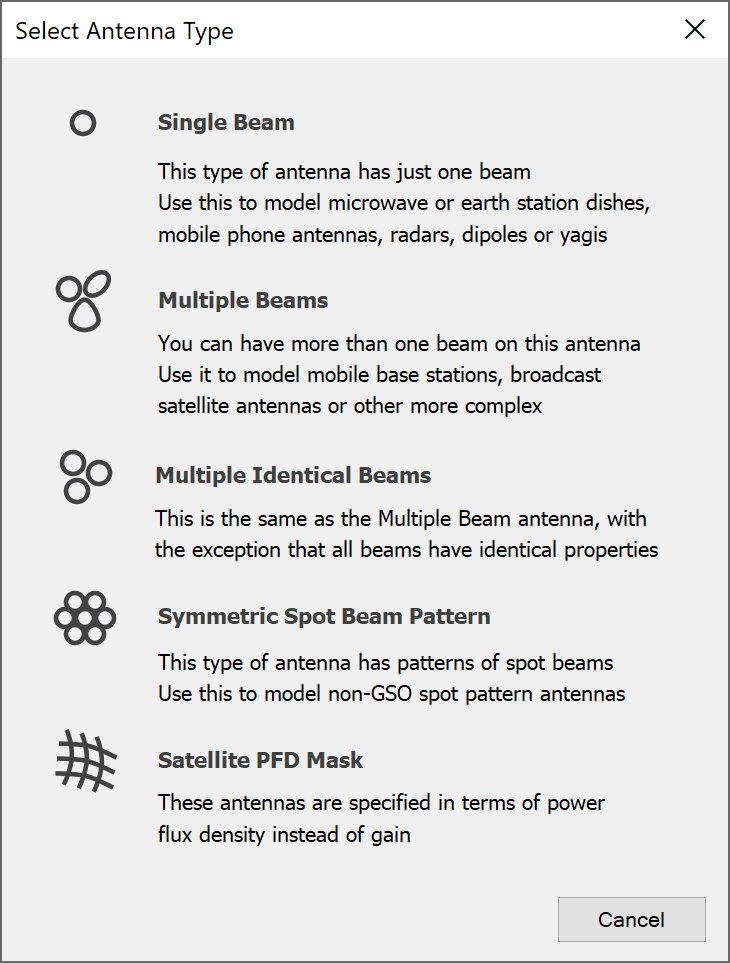
- Detailed gain pattern modelling – e.g. ITU-R Recs, shaped and GIMS contour beams, as in the figures below:
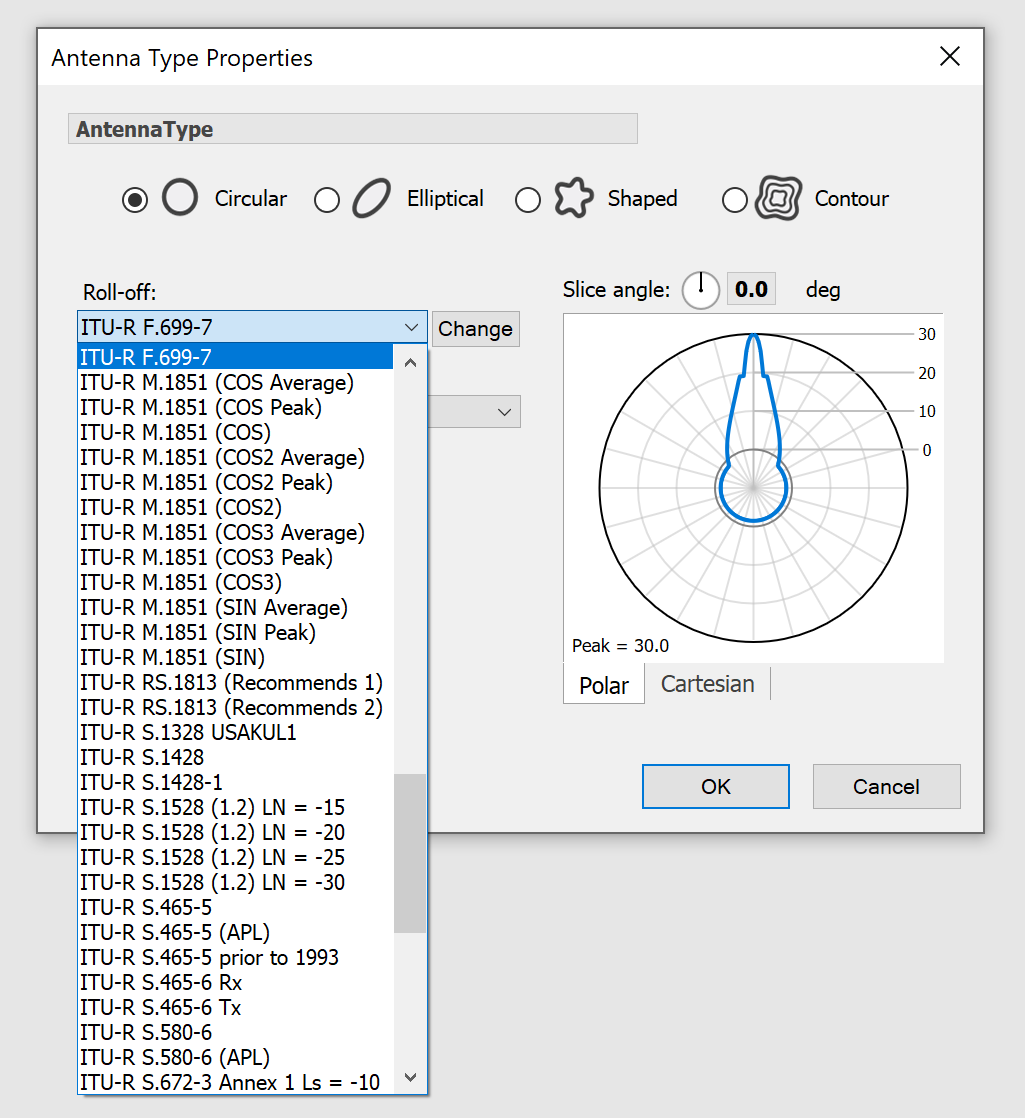
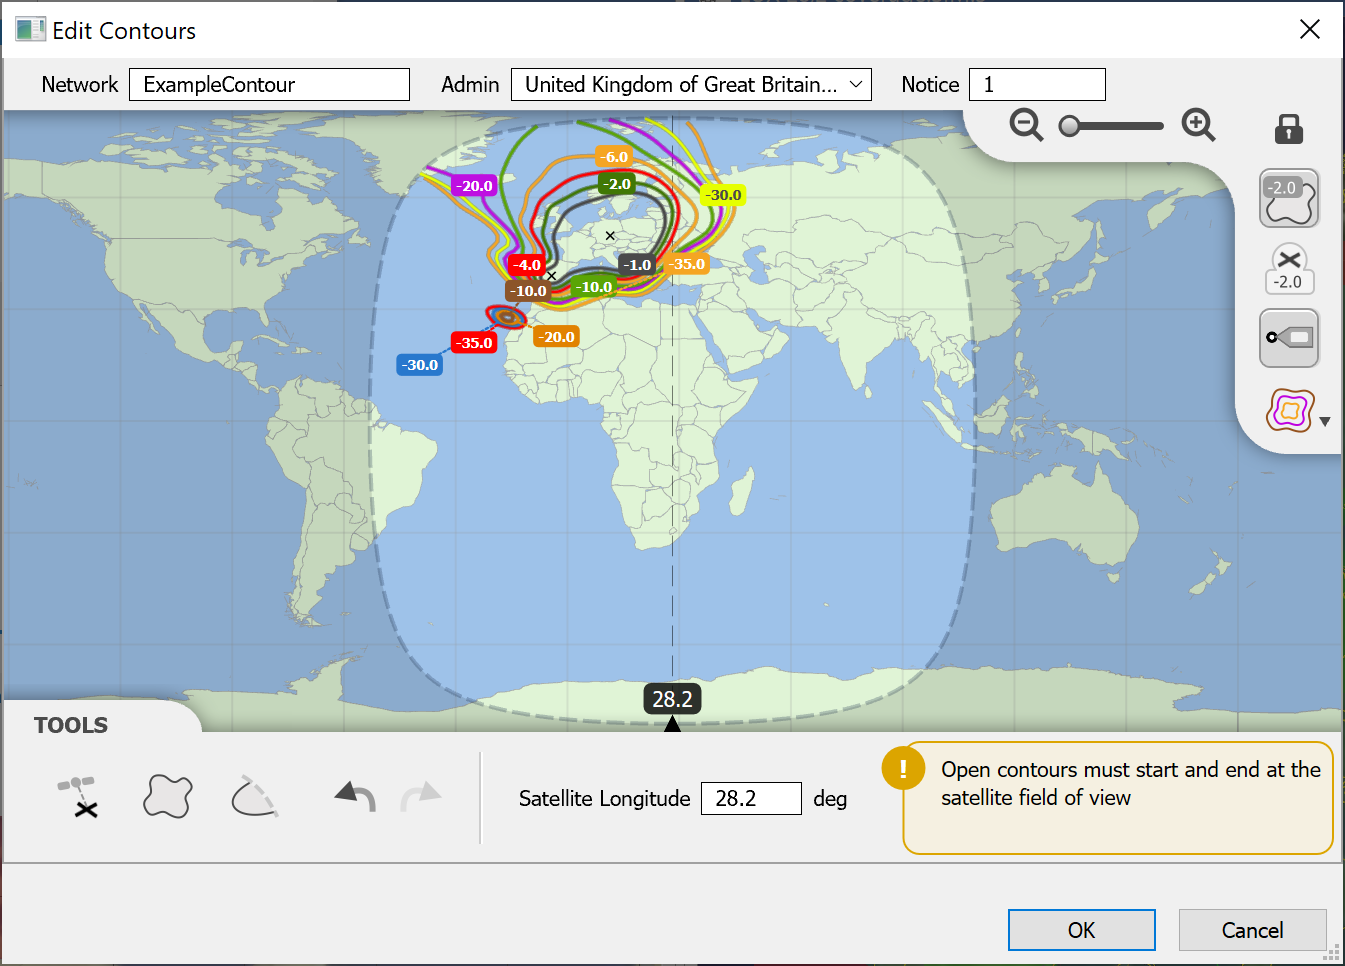
- Library of propagation models including terrestrial mobile, fixed & broadcasting, and earth to/from space, including those in the figure below.
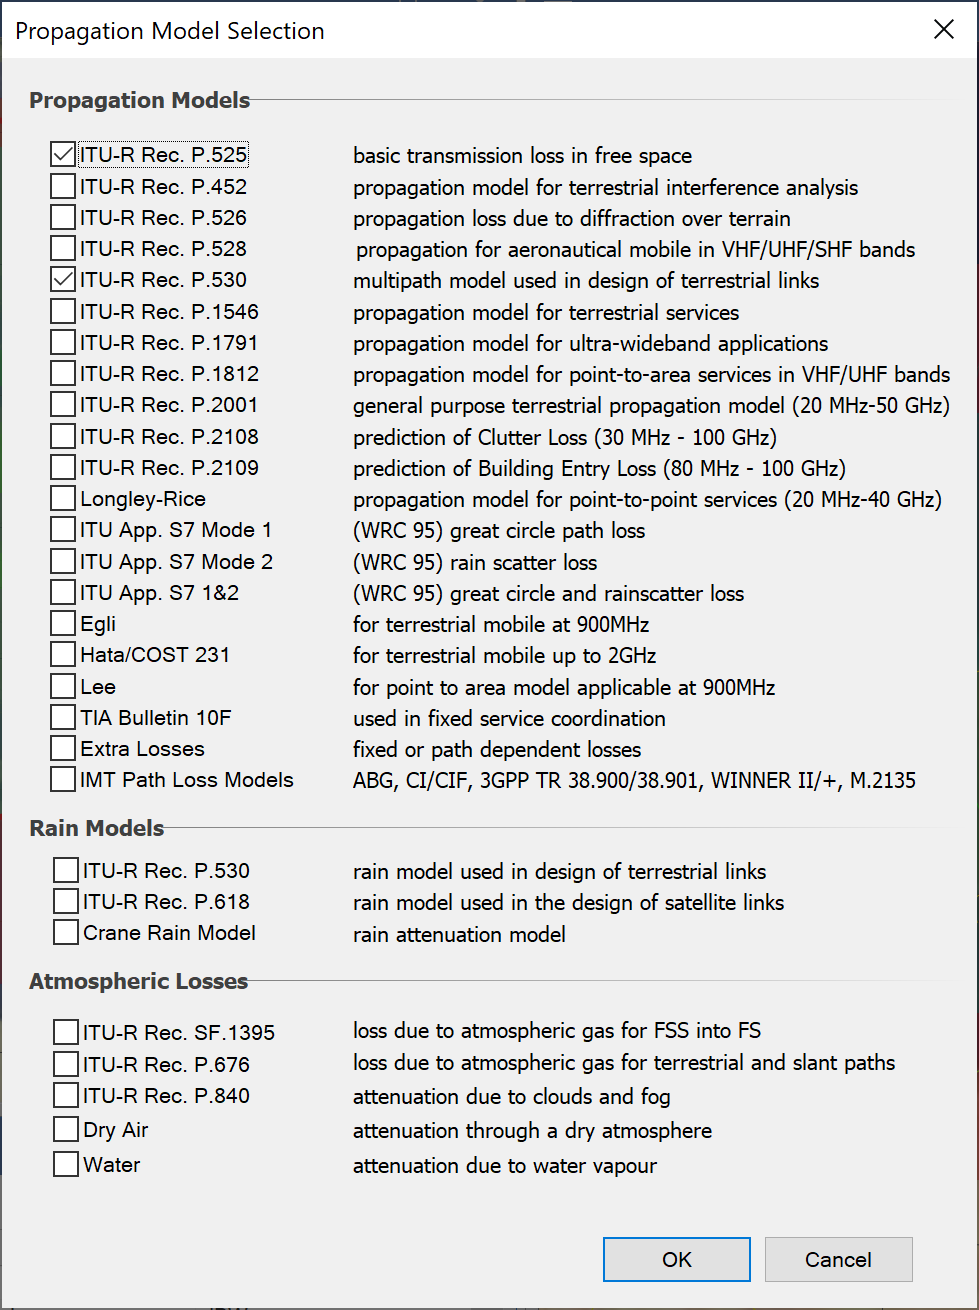
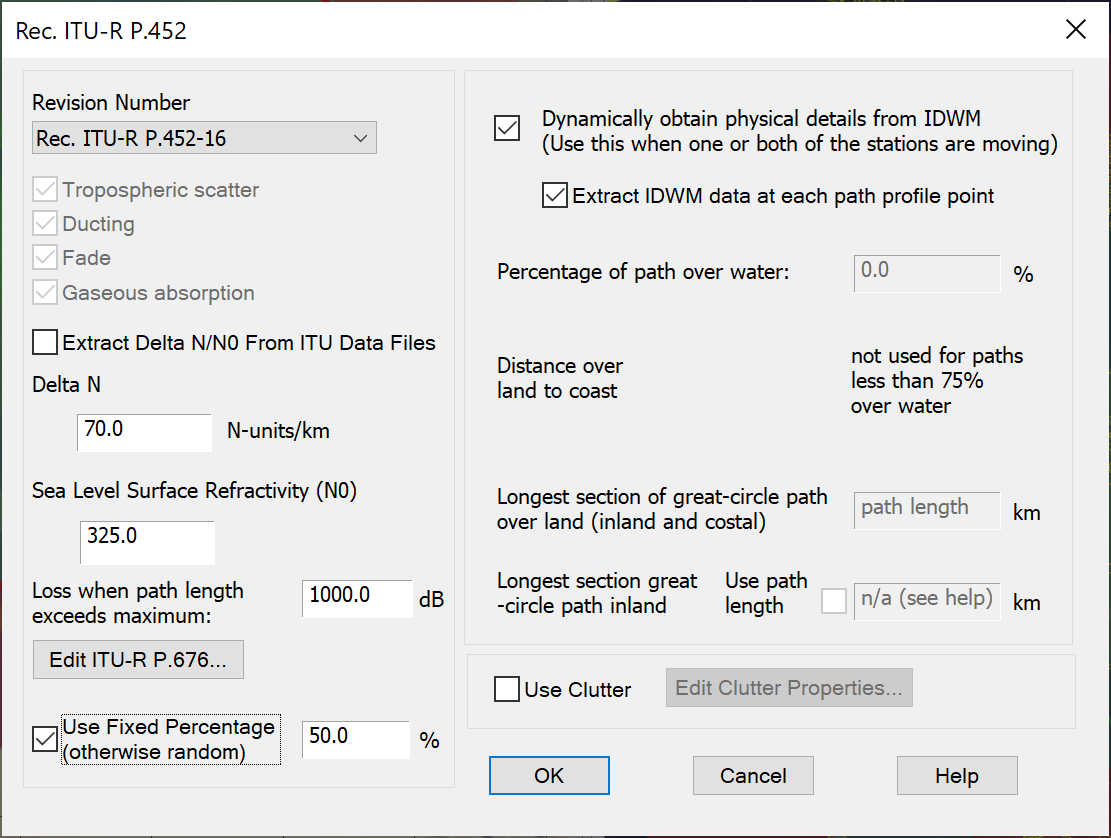
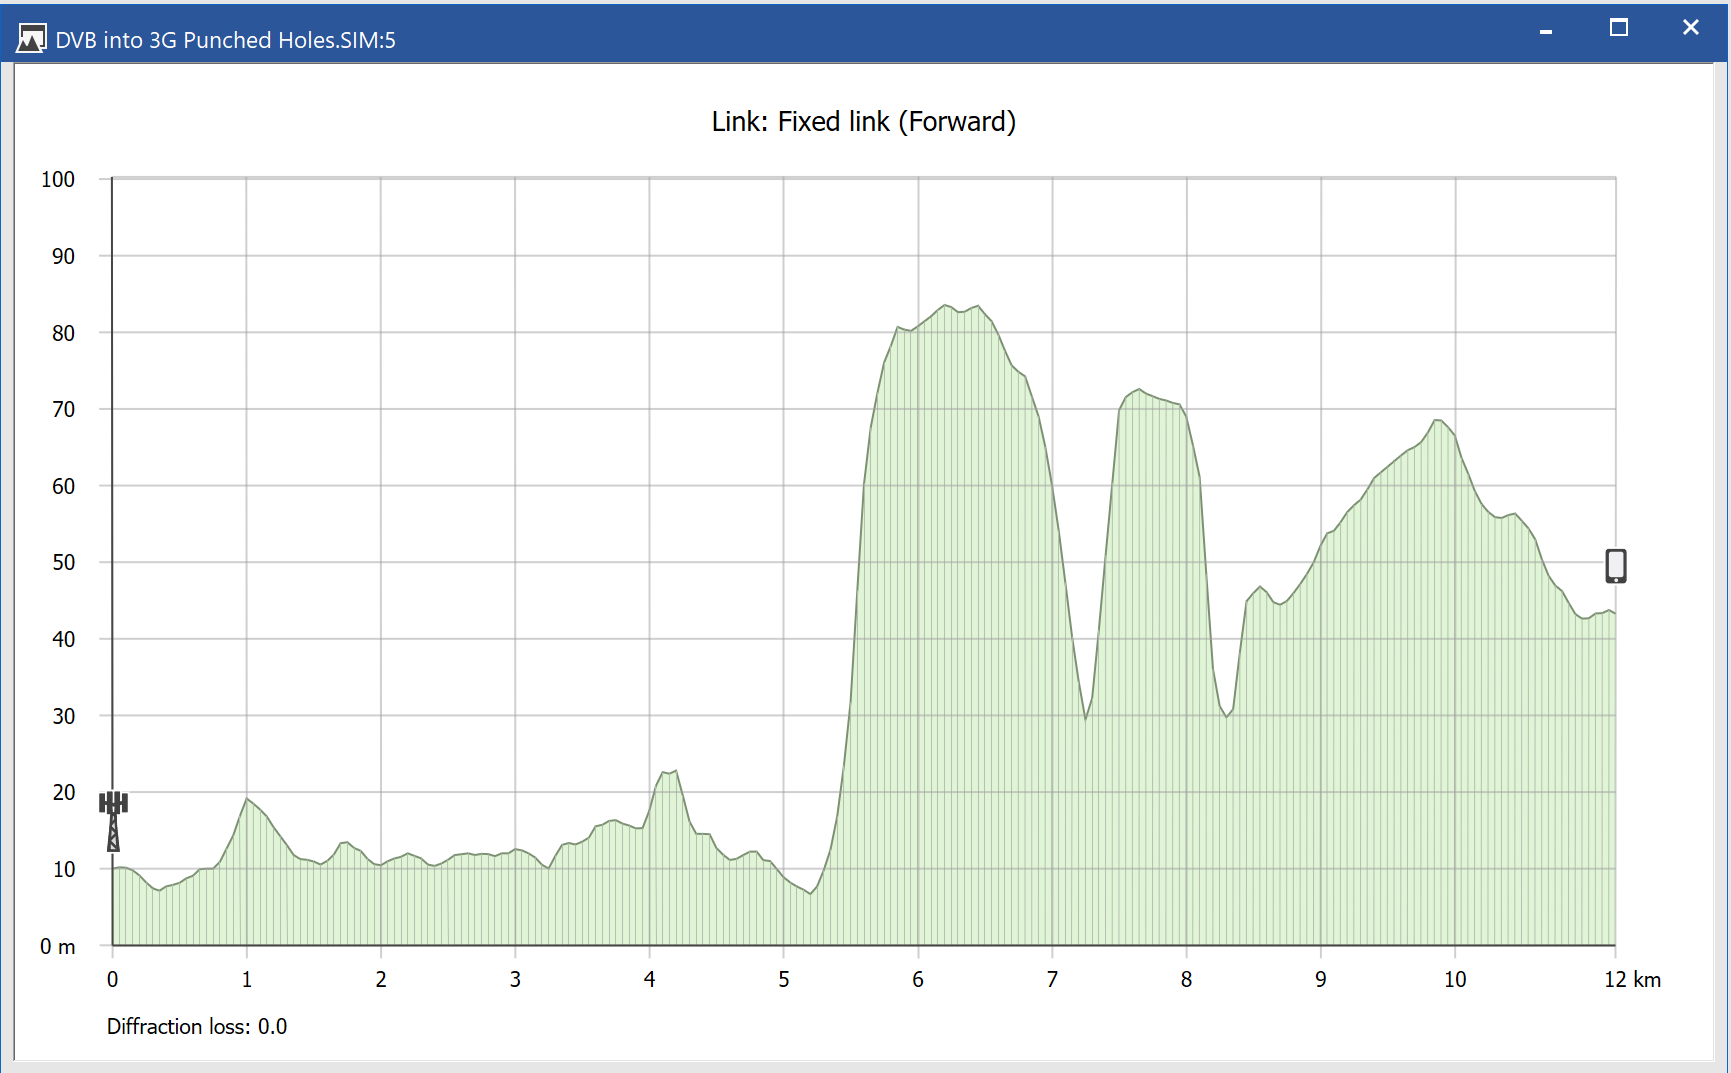
- Dynamics of mobile stations, ships, aircraft and satellites (GSO, HEO, and non-GSO)
- Access to intermediate calculations including link budgets, terrain path profiles, and geometry
- Link performance criteria including C, I, C/I, I/N, C/(N+I), PFD, EPFD, FDP, plus statistics where required
- Data import tools for station locations, fixed links, SRS for GSO and non-GSO satellites, and terrestrial IFIC data
- Monte Carlo any variable or use a sequence of pre-defined values
- Interface to terrain and land-use databases, and use within propagation models
- Ability to see impact of varying the location of a station of almost any of the results (i.e. to plot coverage, elevation angles, interference etc.)
Aeronautical
This section contains the following examples:
- Aeronautical satellite service
- Aircraft into FS stations
- Aircraft with pre-set track across US and interference from FS
- AMT vs. Globalstar
- Modelling air traffic routes
Aeronautical satellite service
| Action: | Run simulation |
| Modules used: | None |
| Terrain regions: | None |
| Frequency band: | L |
| Station types: | GSO Satellite, Aeronautical |
| Propagation models: | Free space, ITU-R Rec.P.676 |
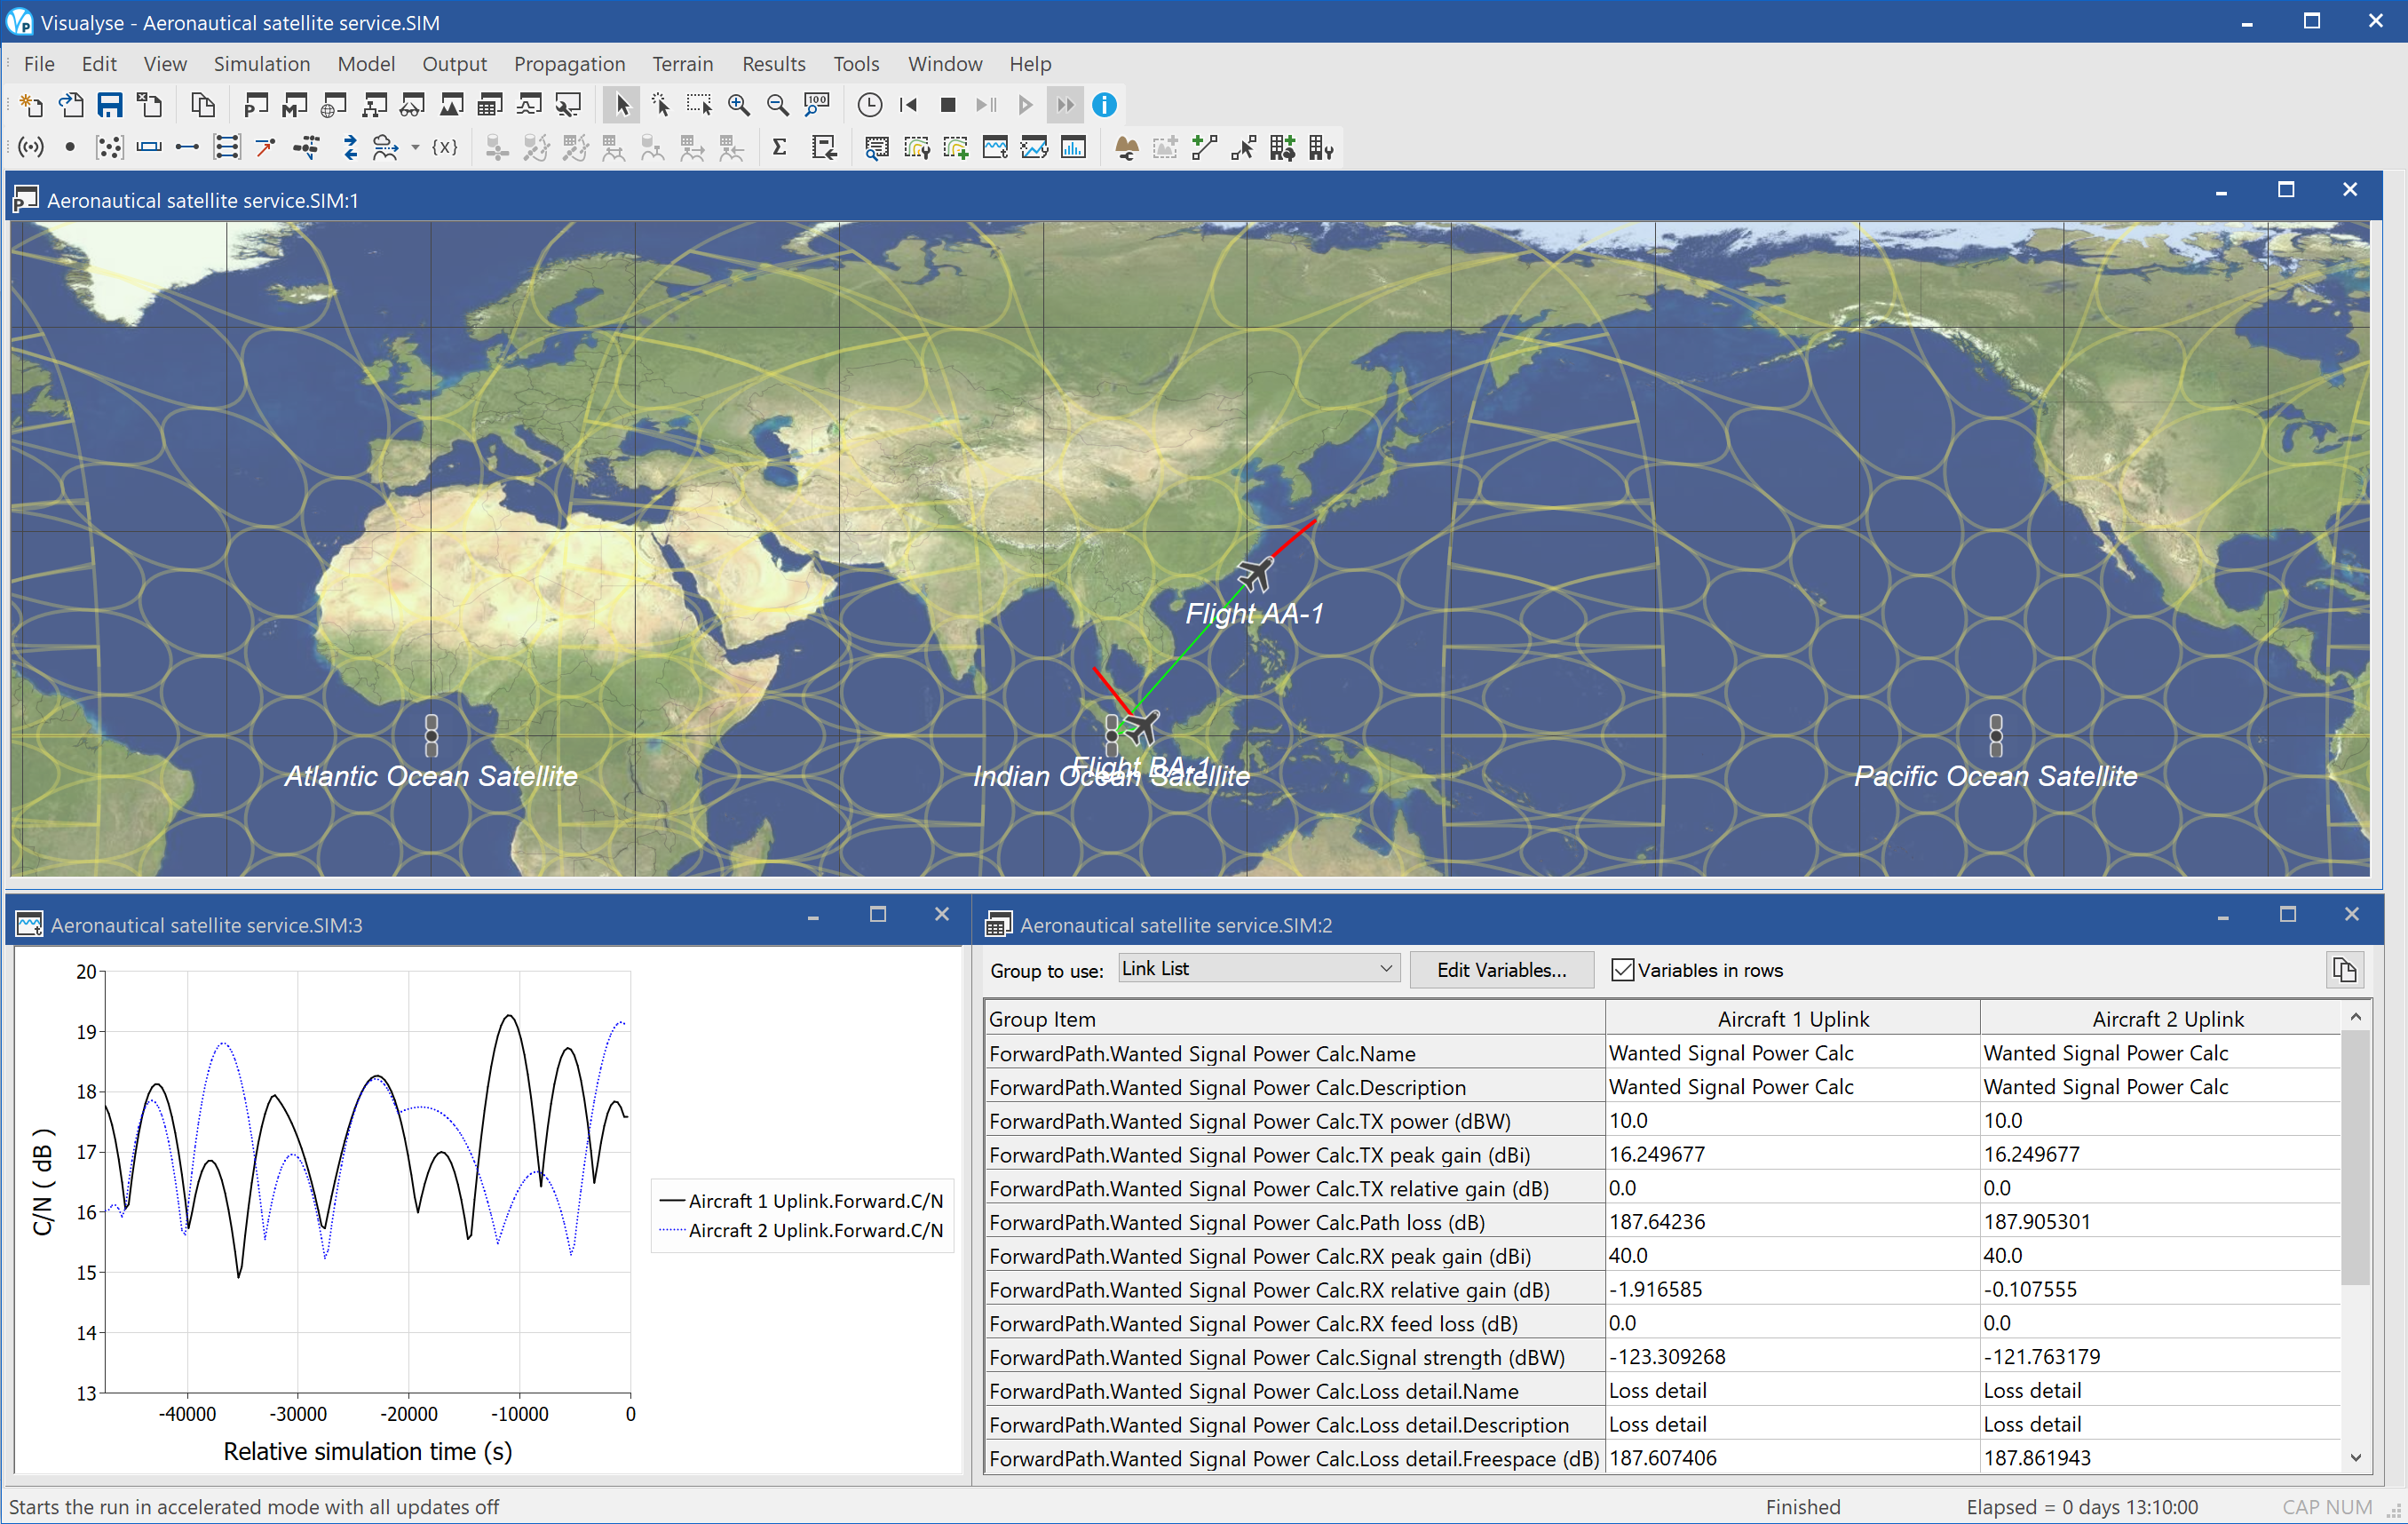
This example shows Visualyse Professional modelling communication between aircraft and GSO satellites.
The simulation uses a dynamic modelling whereby the planes are “flown” across the world from Europe/US to Asia. During the route, they access broadband services via a network of GSO satellites, one for each ocean region.
To provide the high gain needed to close the link, the GSO satellite uses an antenna that generates 89 thin spot beams covering the field of view. As the aircraft moves it must hand-over between these beams.
Visualyse Professional is calculating the C/N of the uplink as the aircraft moves and switches between beam assuming free space path loss and gaseous absorption in ITU-R Rec.P.676.
The figure above shows the simulation with three views open:
- Plate Carrée map view (top) showing the aircraft, the satellites, the satellite spot beams, the links, and the tracks of the aircraft
- Quick graph (bottom left) showing the how the C/N for each link varies with time. As the aircraft moves this plot will follow the peaks and troughs of the currently active beam
- Table view (bottom right) showing the link budget and satellite spot beam used at the present time step.
Aircraft into FS stations
| Action: | Run simulation |
| Modules used: | None |
| Terrain regions: | None |
| Frequency band: | Ku |
| Station types: | Aeronautical, Fixed |
| Propagation models: | Free space, ITU-R Rec.P.530, Diffraction at visible horizon |
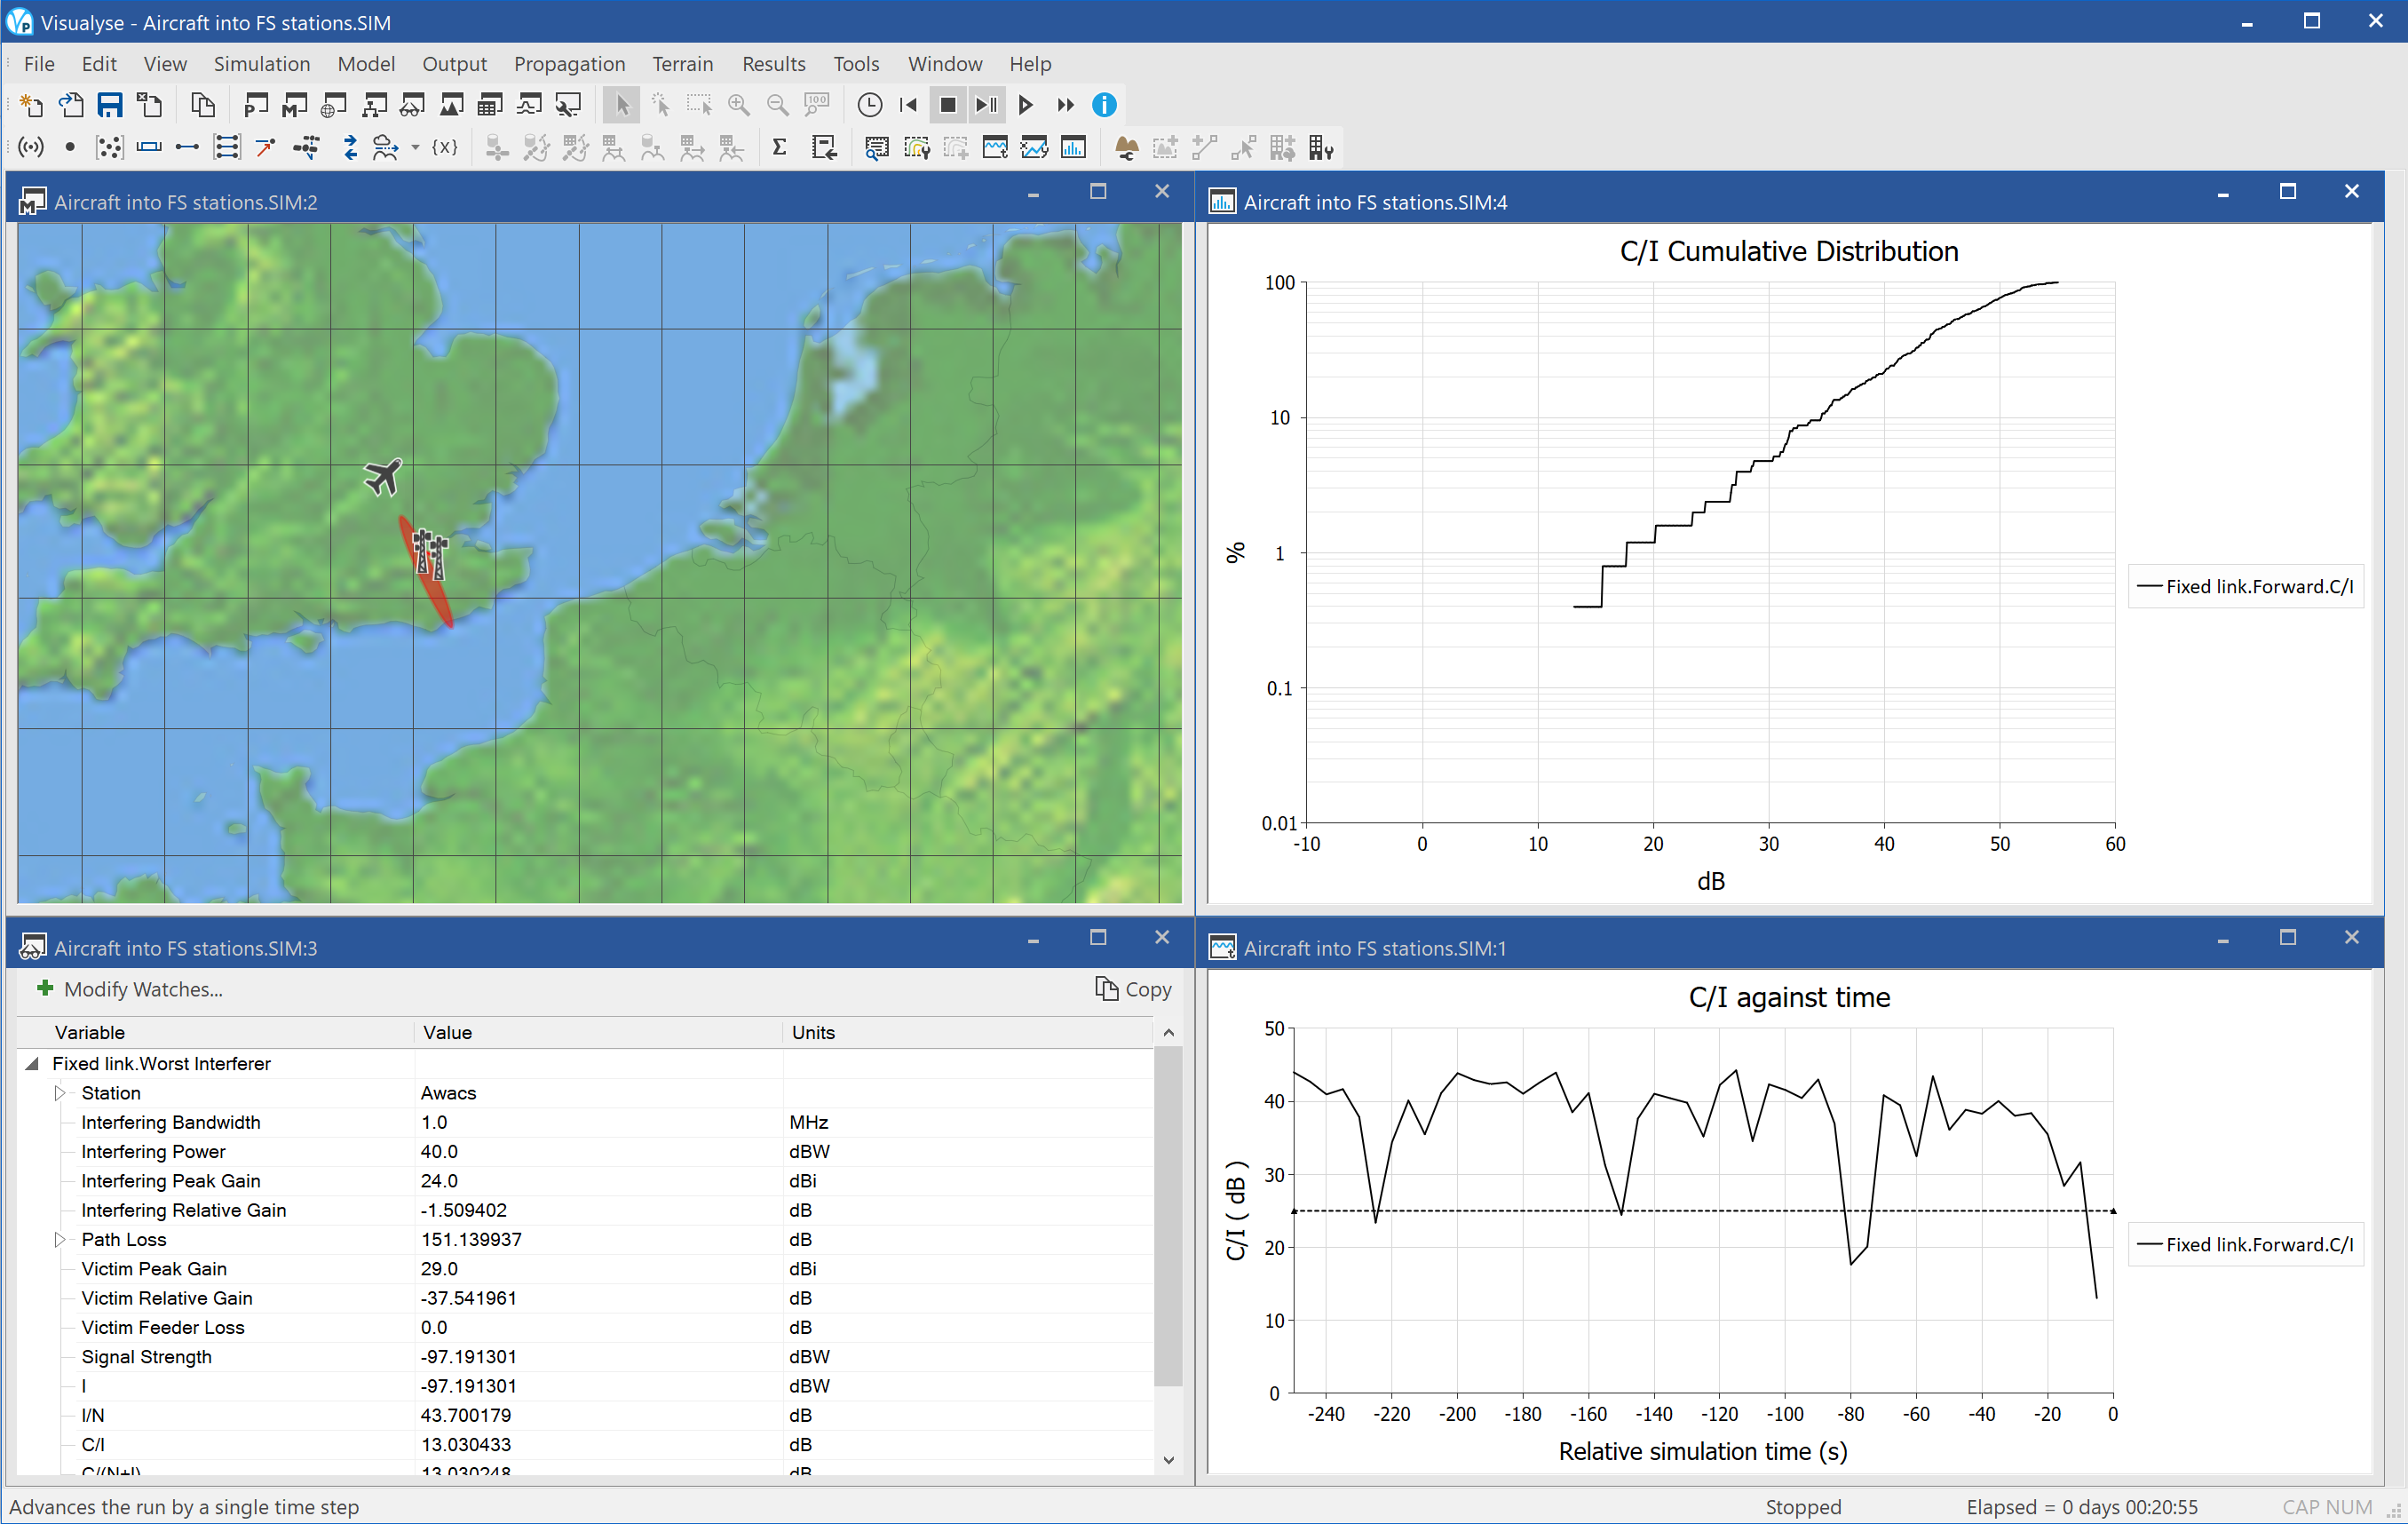
This example shows Visualyse Professional modelling interference from airborne radar into a fixed link at Ku band.
The aircraft is flying across the UK transmitting at high power on a frequency also used by a point to point fixed link. The antenna on the aircraft is rotating round pointing 10 degrees below the horizon and is modelled using ITU-R Rec.F.699 gain pattern. Note the radar antenna spin rate has been reduced to make the example easier to see.
The propagation model for the air to ground is assumed to be free space path loss if line of sight otherwise an additional diffraction term is used.
The fixed link is modelled using free space path loss plus the ITU-R Rec.P.530 rain and fade models which means the wanted signal can vary in time. The fixed link antennas are based upon an ETSI specification style table.
As the aircraft flies and its antenna rotates and the fade varies on the fixed link the C/I changes. When the C/I is below the threshold of C/I = 25 dB the link is assumed to be suffering interference and is shown in red.
The simulation shows the following views open:
- Mercator map view (top left) showing the location of the aircraft, the fixed service stations, the aircraft antenna footprint, and the link coloured as either green (good) or red (bad)
- Watch window (bottom left) showing the interfering link budget from the AWACs to the fixed link
- Statistics graph (top right) showing the cumulative distribution function of the C/I at the fixed link’s receiver
- Quick graph (bottom right) showing how the C/I varies against time together with a line showing the threshold of C/I = 25 dB.
Aircraft with pre-set track across US and interference from FS
| Action: | Run simulation |
| Modules used: | Define Variable |
| Terrain regions: | None |
| Frequency band: | S |
| Station types: | Aeronautical, Fixed |
| Propagation models: | Free space, ITU-R Rec.P.676, Diffraction when beyond line of sight, Aircraft body shielding |
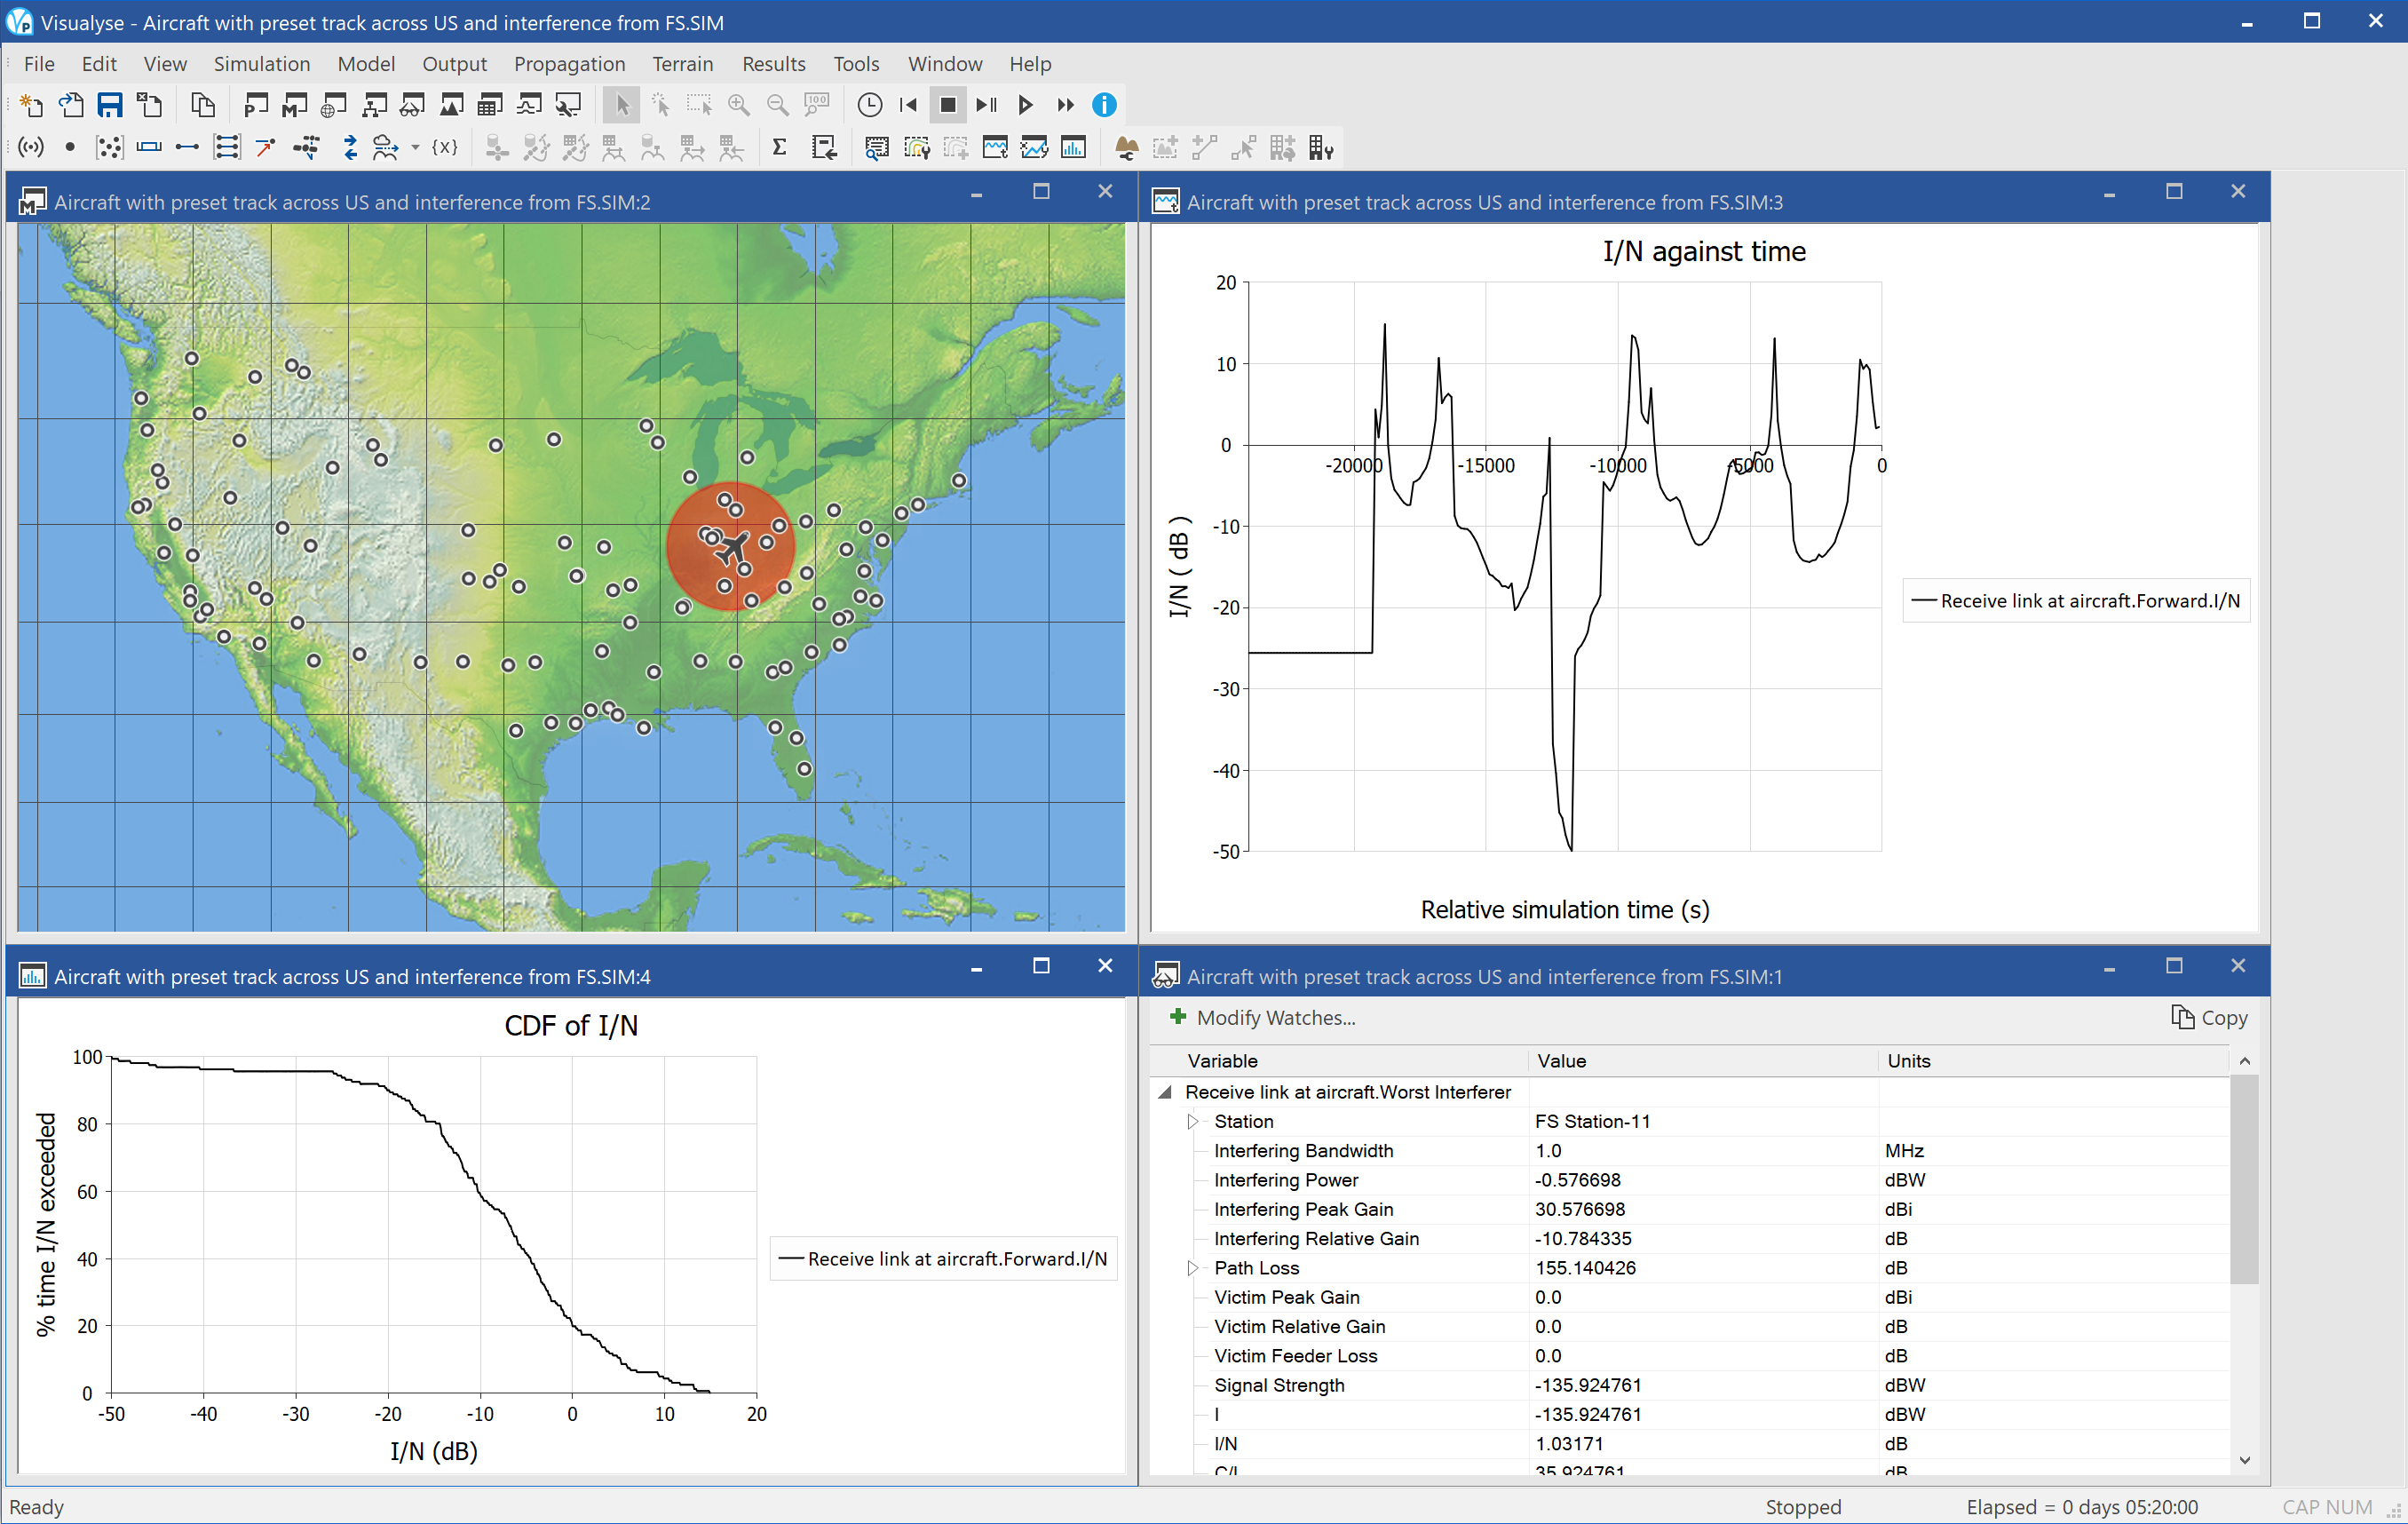
This example shows a scenario whereby a commercial aircraft flies across the US using part of C band (2 GHz) for communication services. This band is also used by a number of point to point fixed links, and therefore there is the potential for interference.
The aircraft is assumed to travel along pre-defined traffic routes: three are modelled:
- Los Angeles to New York
- New York to Seattle
- Seattle to Los Angeles
One hundred fixed service transmitters were deployed across the US, with random antenna azimuth and elevations. Each was assumed to have a single antenna using ITU-R Rec.P.699 as its gain pattern assuming a 2m dish.
The propagation model from the FS to the aircraft included the following four terms:
- Free space path loss
- Diffraction when aircraft is beyond visible line of sight of the fixed station
- Attenuation due to atmospheric gases in ITU-R Rec.P.676
- Shielding loss due to body of aircraft
- The aggregate I/N at the receiver on the aircraft is then calculated from all one hundred of the FS transmitters.
The simulation is shown with four windows open:
- Mercator view (top left) showing the aircraft, its field of view and each of the fixed service transmitters
- Statistics view (bottom left) showing the cumulative distribution function of I/N
- Quick plot (top right) showing how the I/N would vary against time
- Watch window (bottom right) showing the worst single interfering link budget and the aggregate interference
AMT vs. Globalstar
| Action: | Run simulation |
| Modules used: | Define Variable |
| Terrain regions: | None |
| Frequency band: | C |
| Station types: | Non-GSO Satellite, Earth Station, Aeronautical |
| Propagation models: | Free space |
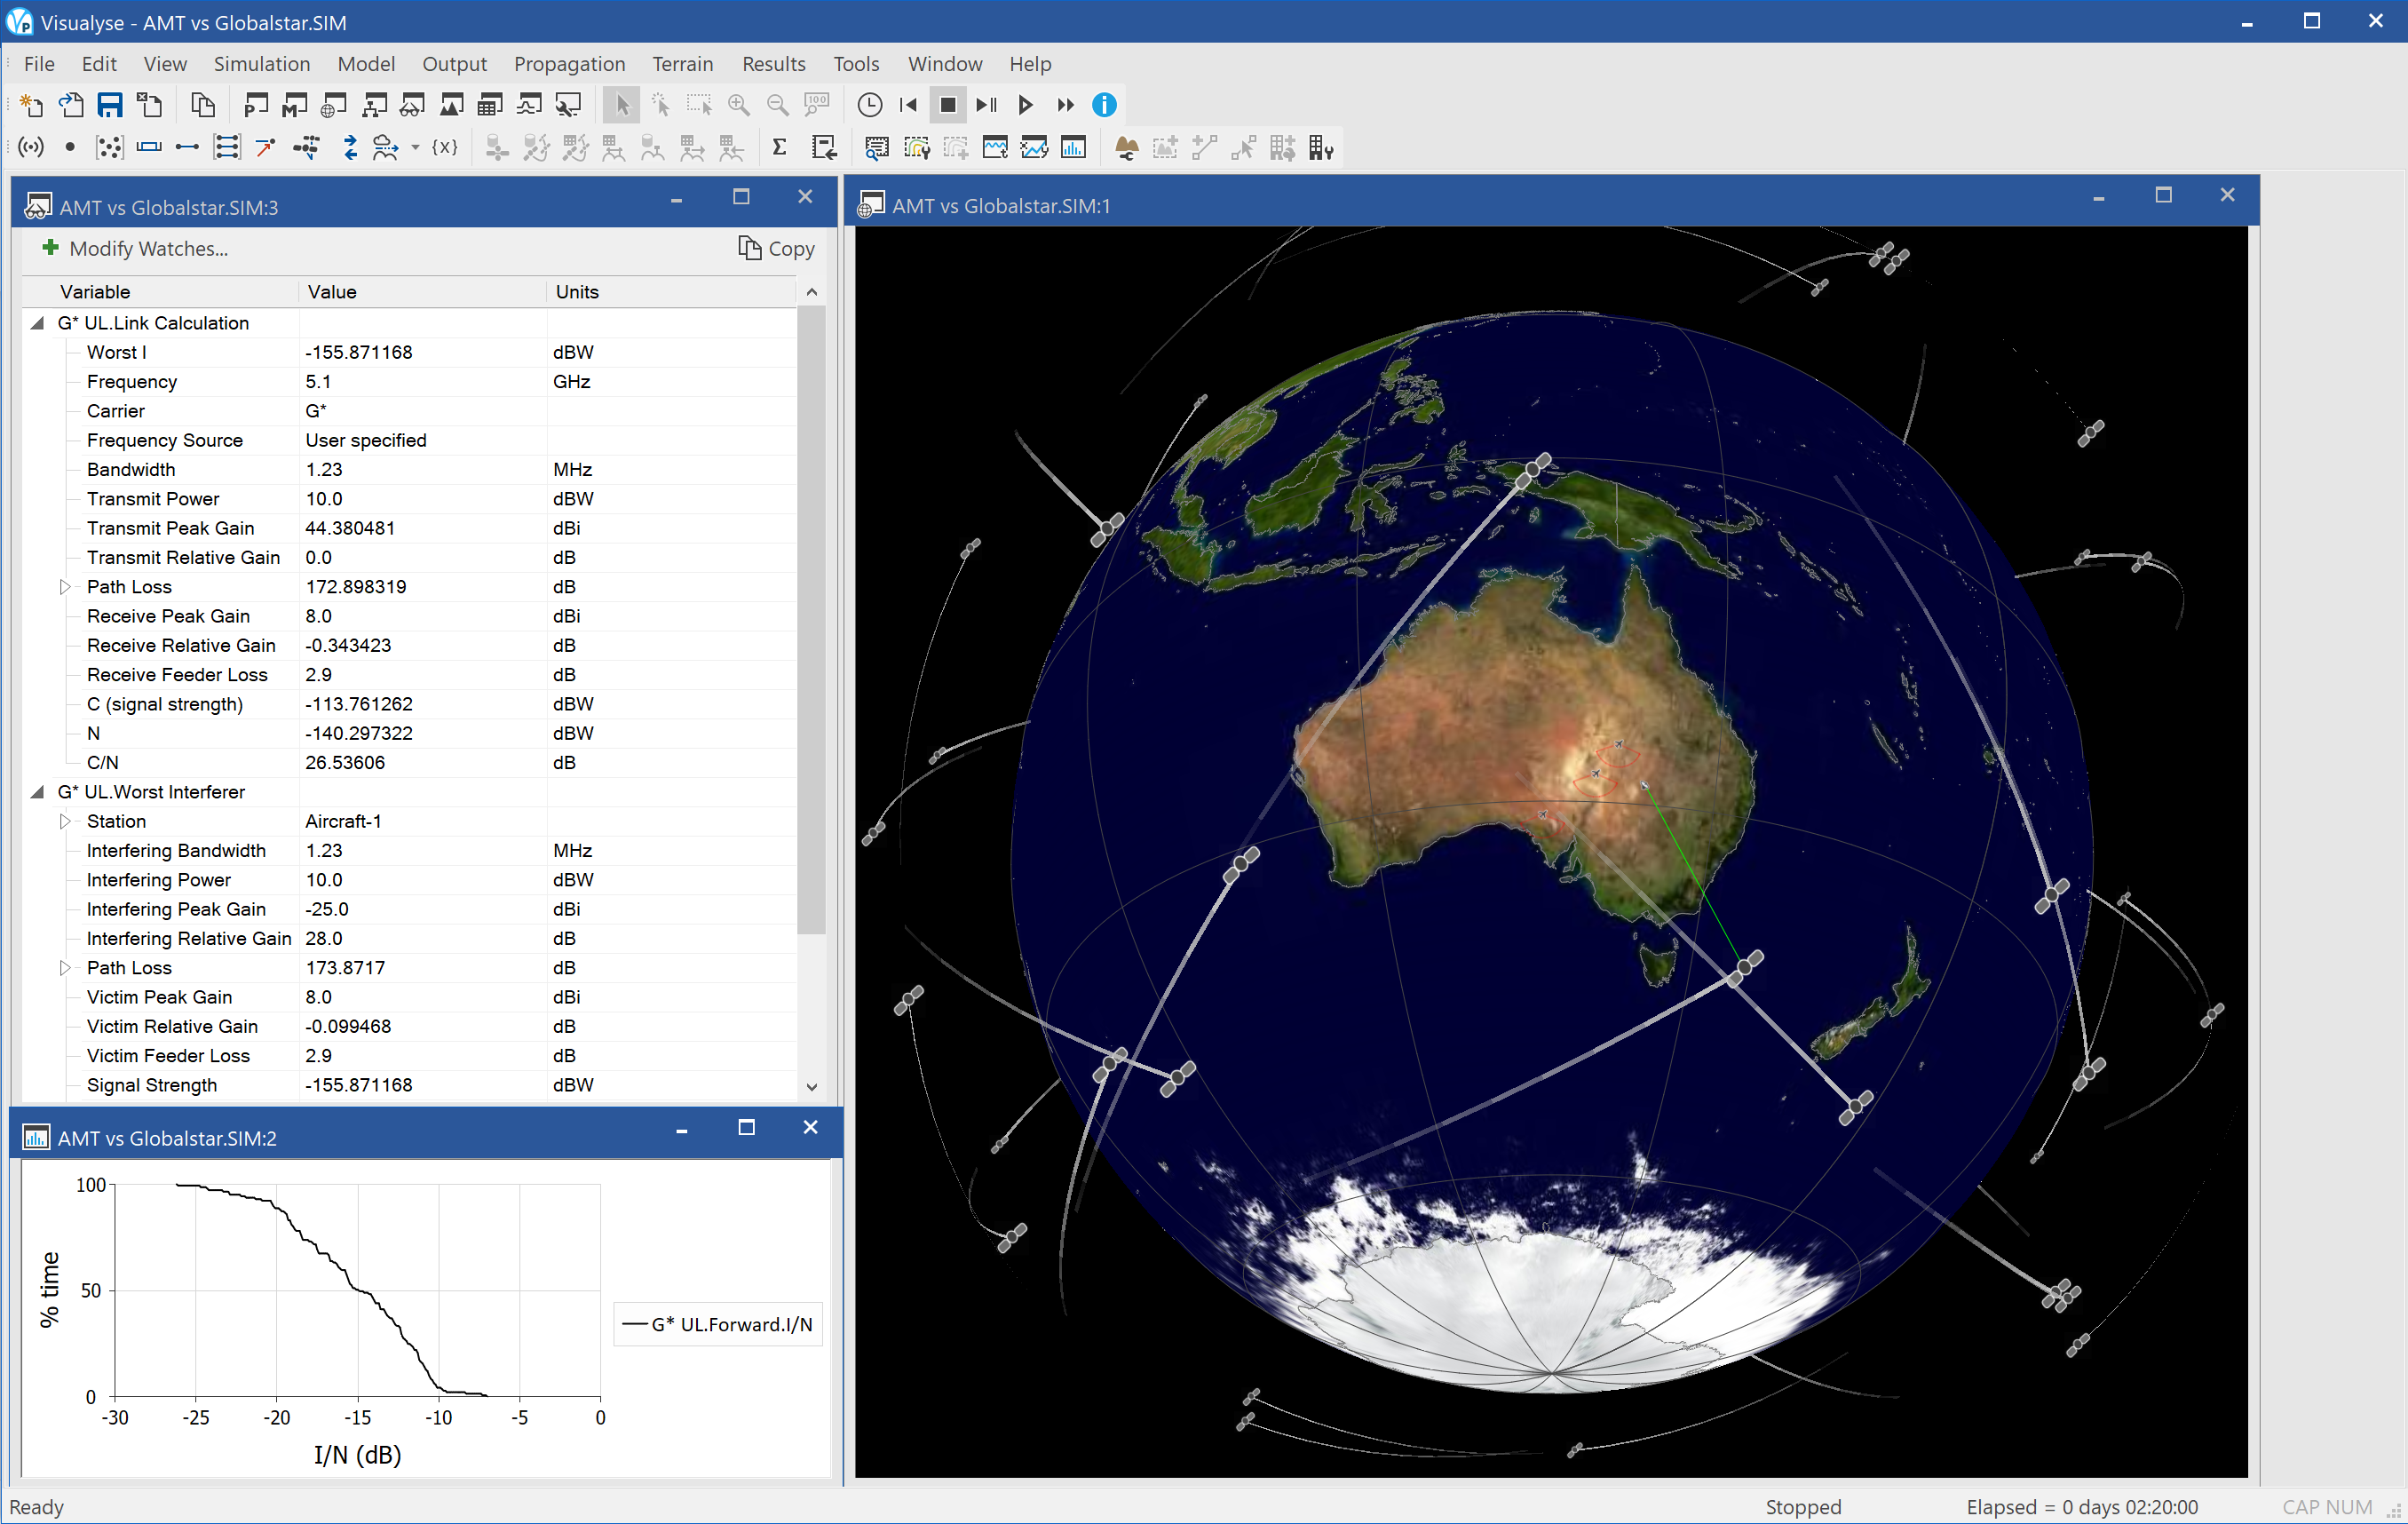
This scenario relates to sharing between aeronautical mobile telemetry (AMT) and non-GSO MSS feeder links at around 5 GHz. In the study cycle leading up to WRC 07 it was Agenda Items 1.5 and 1.6.
The simulation is configured with the victim being the uplink to the Globalstar (G*) network from a gateway in Australia. Co-frequency are a number of aircraft being tested in the desert using the same frequency.
The Define Variable module is being used to specify the location of the aircraft either:
- On a square flight path
- Selected at random using Monte Carlo methods
On each aircraft there are two antennas – one pointing up and one pointing down. The interference is then the aggregate at the satellite receiver of all antennas on all aircraft.
The propagation model for the wanted link from the gateway to the satellites and the interfering link from the aircraft to the satellites is assumed to be simply free space path loss.
In the simulation file, there are three windows open:
- 3D view (right) showing the satellites, their space tracks, the gateway earth station, the link connecting the gateway to the highest elevation satellites, the aircraft and their field of views.
- Watch window (top left) showing the wanted and interfering link budgets
- Statistics window (bottom left) showing the cumulative distribution function of the I/N at the satellite. In this case the highest I/N is predicted to be around -7.5 dB
Modelling air traffic routes
| Action: | Run simulation |
| Modules used: | Define Variable |
| Terrain regions: | None |
| Frequency band: | any |
| Station types: | Aeronautical |
| Propagation models: | n/a |
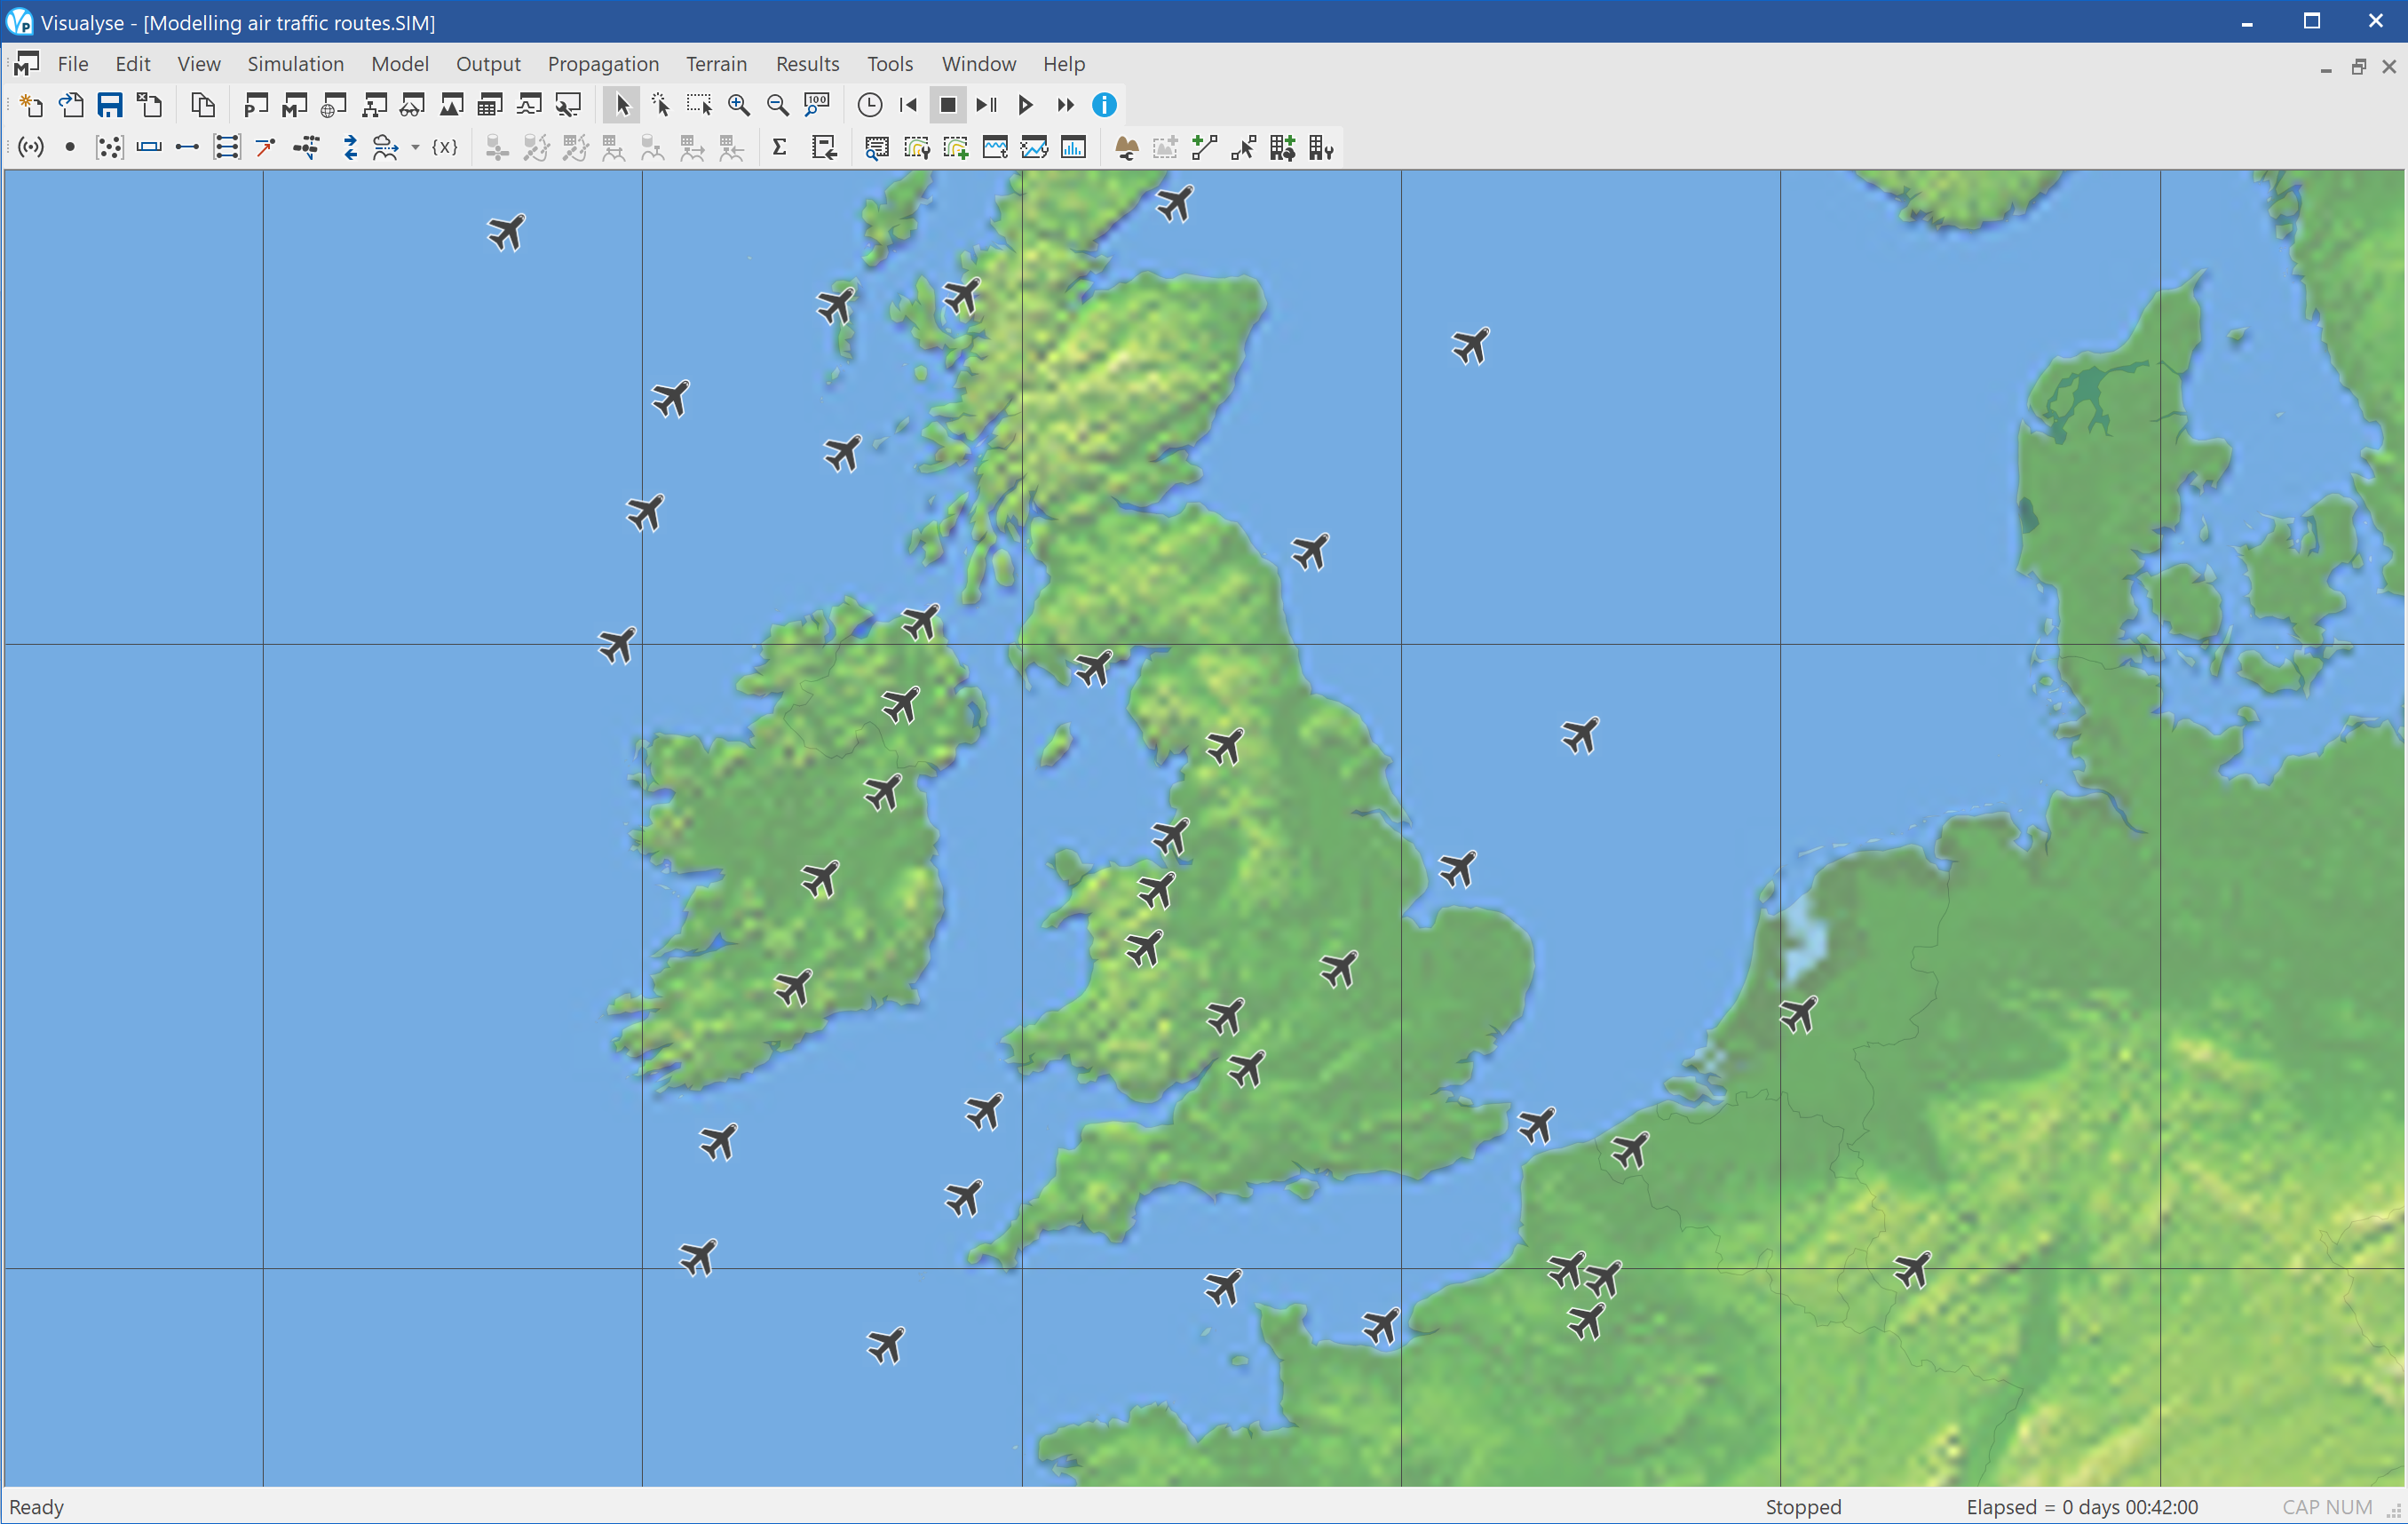
This simulation shows how aircraft traffic routes can be modelled in Visualyse Professional. The simulation shows a number of routes in the vicinity of the UK, some of which are short-haul and some of which are long haul.
A single view is open showing a map of Europe in Mercator projection.
Digital Dividend
This section contains the following examples:
This section considers issues relating to the so-called “Digital Dividend”, the release of spectrum in parts of UHF as analogue TV is switched off. This could be used for a variety of purposes, including mobile applications such as IMT-2000, WiMAX, and DVB-H. However, these cellular like services could cause or suffer interference with broadcasting applications, and so there has been a request for studies by the ITU under WRC-11 Agenda Item 1.17.
The examples are based around sharing scenarios between digital TV and mobile applications – and in particular between fixed TV receivers and IMT-2000 services. Others scenarios could be considered and we would be happy to discuss this further. There are also sharing scenarios involving other services – such as aeronautical radionavigation – for which there could be examples in other sections of this document.
3G into DVB Punched Holes
| Action: | None |
| Modules used: | Terrain, IDWM |
| Terrain regions: | South Wales |
| Frequency band: | UHF |
| Station types: | Broadcasting, Mobile |
| Propagation models: | ITU-R Rec.P.1546, ITU-R Rec.P.452 |
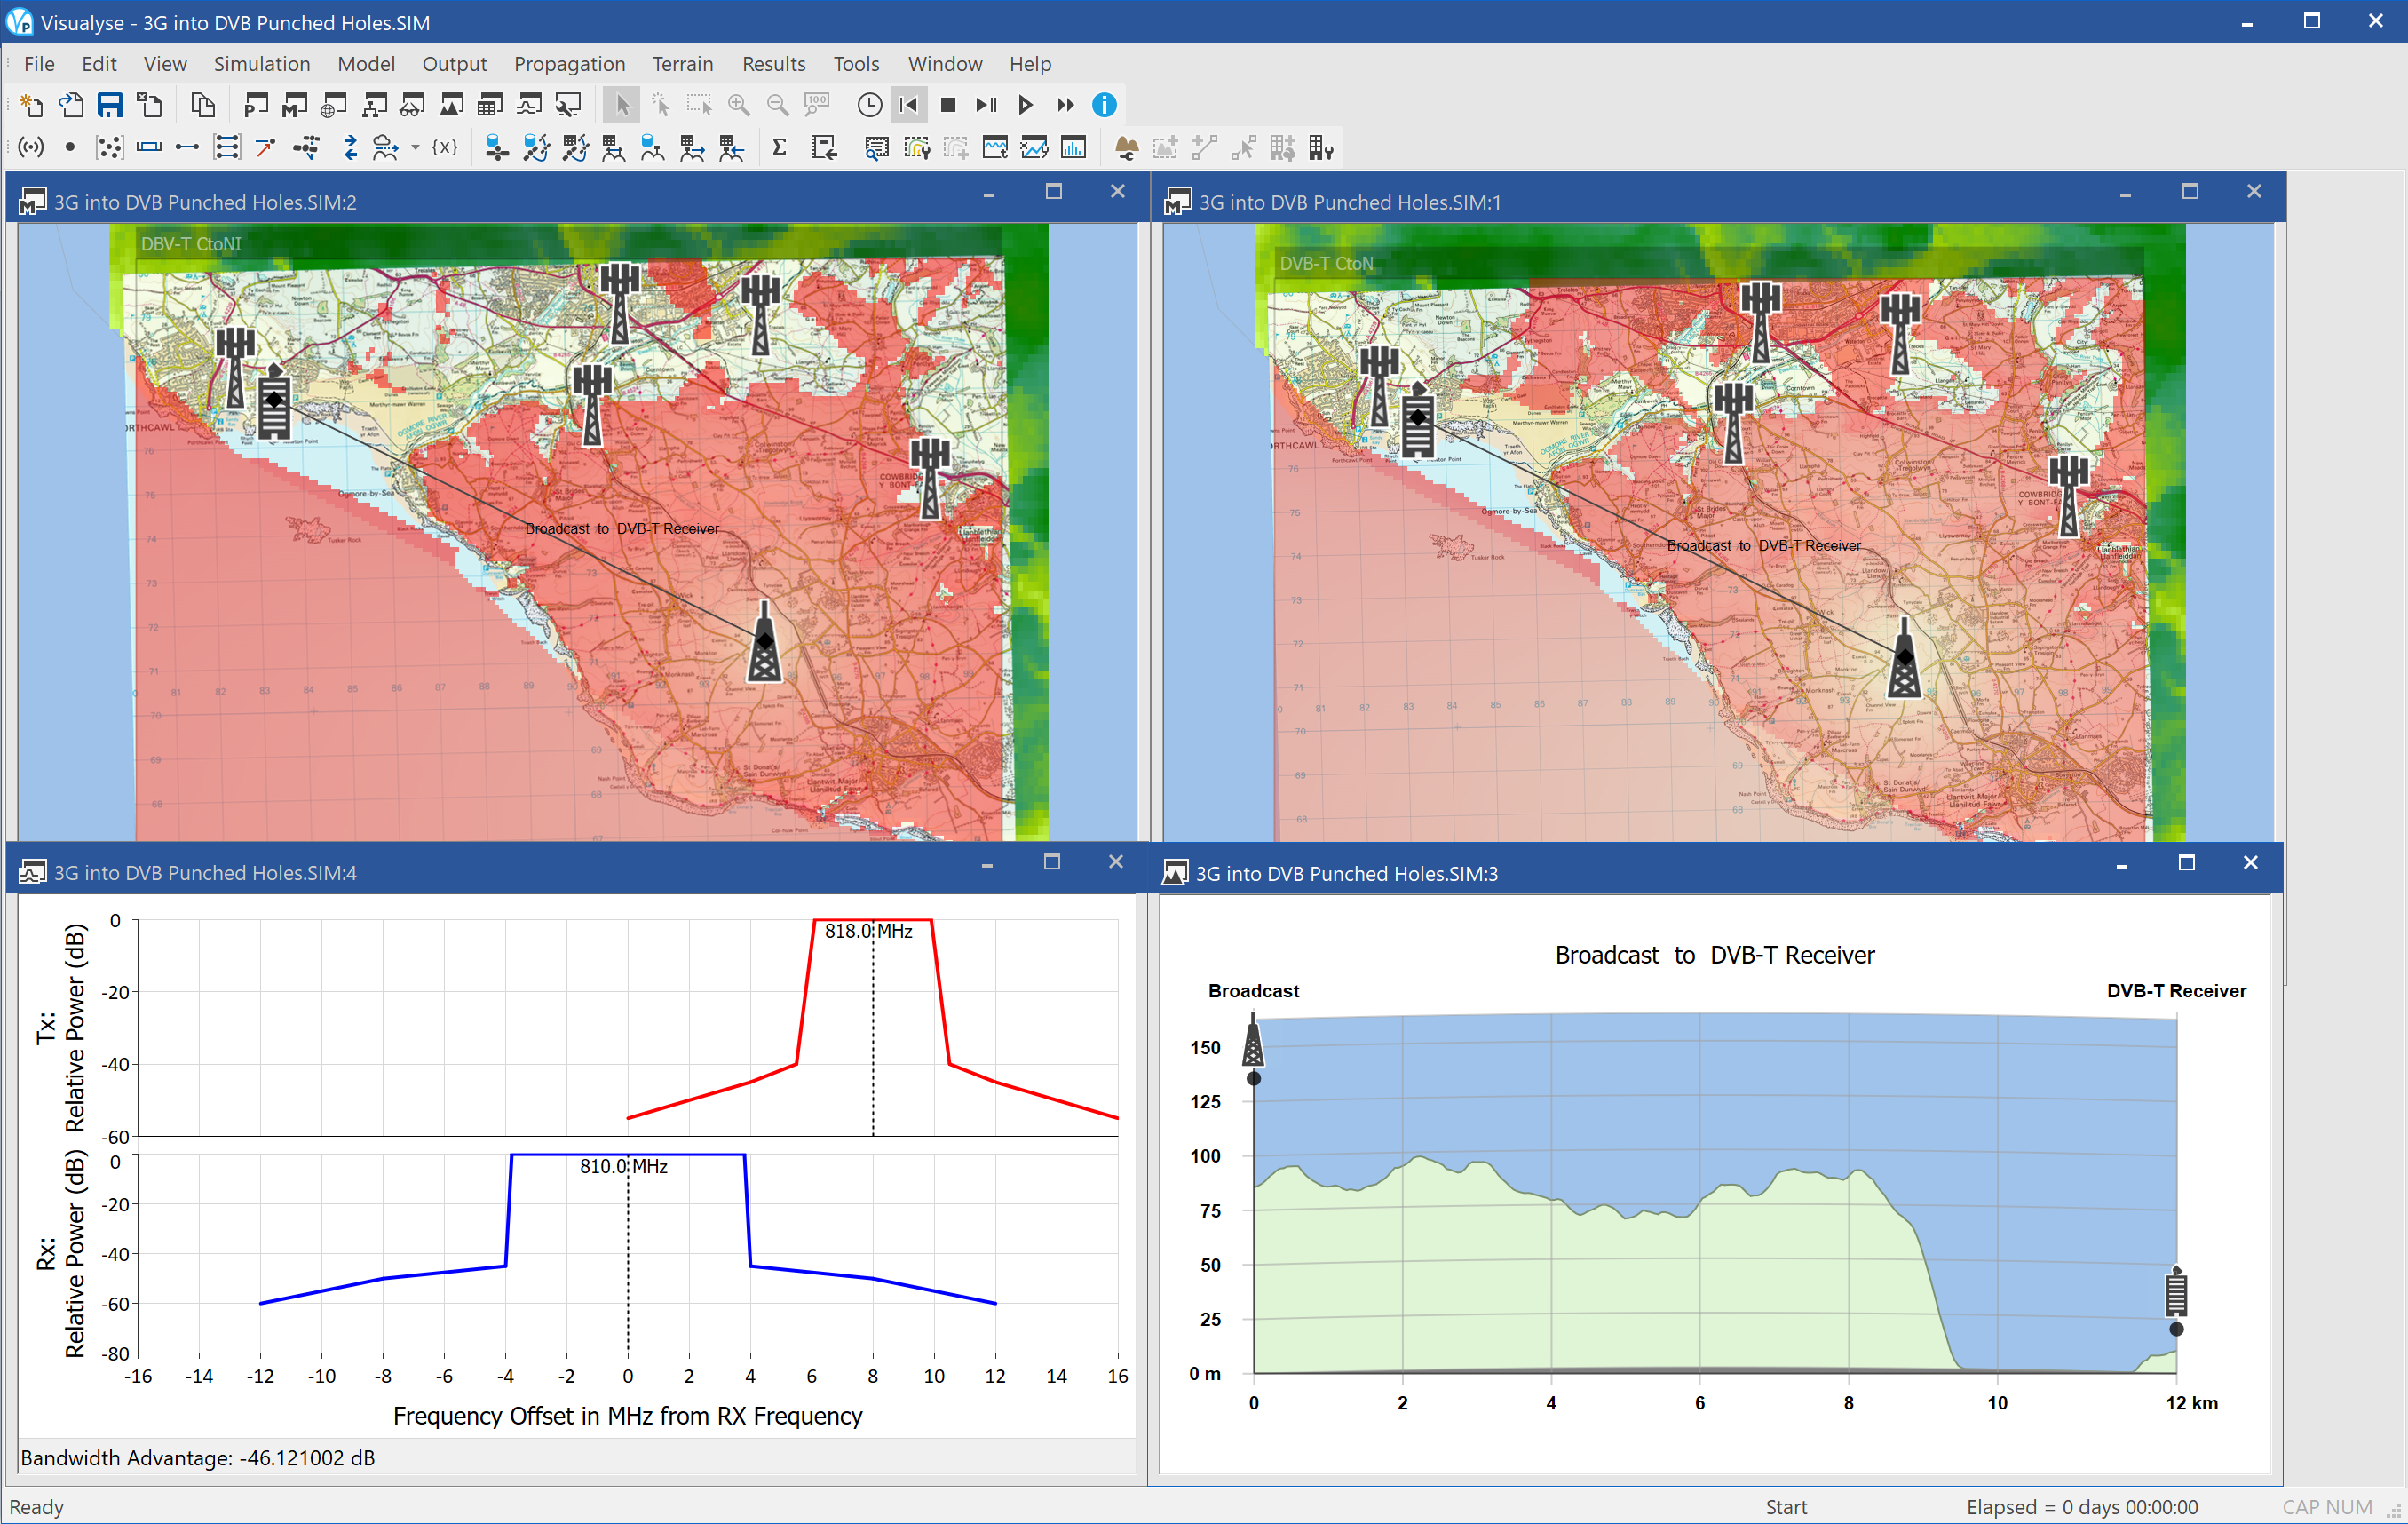
This example considers the impact of a mobile network working in an adjacent band to a broadcaster. It considers a 1 kW local in-fill transmitter in the South Wales part of Britain transmitting DVB-T on channel C63, i.e. a frequency of 810 MHz. In the adjacent channel C64, i.e. a frequency of 818 MHz is the downlink or base station transmit part of a 3G / IMT-2000 network.
The analysis identifies the locations where interference from the adjacent mobile operator would cause interference into a fixed TV receiver. The analysis takes account of all the key factors including:
- Terrain and land-use data: we have loaded the relevant terrain data and (where available for copyright reasons) the land-use data to derive clutter loss
- Propagation models: we have used ITU-R Rec.P.1546 for the calculation of the broadcaster’s wanted signal, using a location variability of 95%. For the interference path we have used ITU-R Rec.P.452 due to its detailed modelling when terrain data is available. We have a library of other ITU-R models including P.1812 and generic models such as Hata and dual slope.
- Gain patterns: we have modelled the fixed receive antenna using the pattern in the RRC-06 Final Acts and the base stations as having three sector antennas with downtilt of 2°. Visualyse Professional includes a wide range of gain patterns and can include measured data in table format
- Interference measures: we have undertaken this analysis using the C/N or C/(N+I) measure, but we can also calculate I, I/N, C/I, and PFD / field strength.
- Carrier shapes and net filter discrimination (NFD): Visualyse Professional undertakes a direct analytic integration of the TX spectrum mask and RX filter characteristics to calculate the NFD for this path.
The result is a highly accurate prediction of the impact of a 3G network operating in an adjacent band on the coverage of a broadcasting network. In the screen shot above you can see four windows:
- Mercator map view (top right) showing the coverage of the broadcasting system in the absence of interference overlaid on a map and also showing the clutter database categories (where available)
- Mercator map view (top left) showing the reduction in coverage of the broadcasting system due to the “punched-holes” from the 3G network’s base station transmissions
- Frequency view (bottom left) showing the broadcasting receive mask assumed and the spectrum mask of the 3G transmitter, and the NFD calculated, around 46 dB
- Path profile view (bottom right) showing the terrain between the broadcast transmitter and the test point fixed receiver.
DVB into 3G Punched Holes
| Action: | None |
| Modules used: | Terrain, IDWM |
| Terrain regions: | South Wales |
| Frequency band: | UHF |
| Station types: | Broadcasting, Mobile |
| Propagation models: | ITU-R Rec.P.452 |
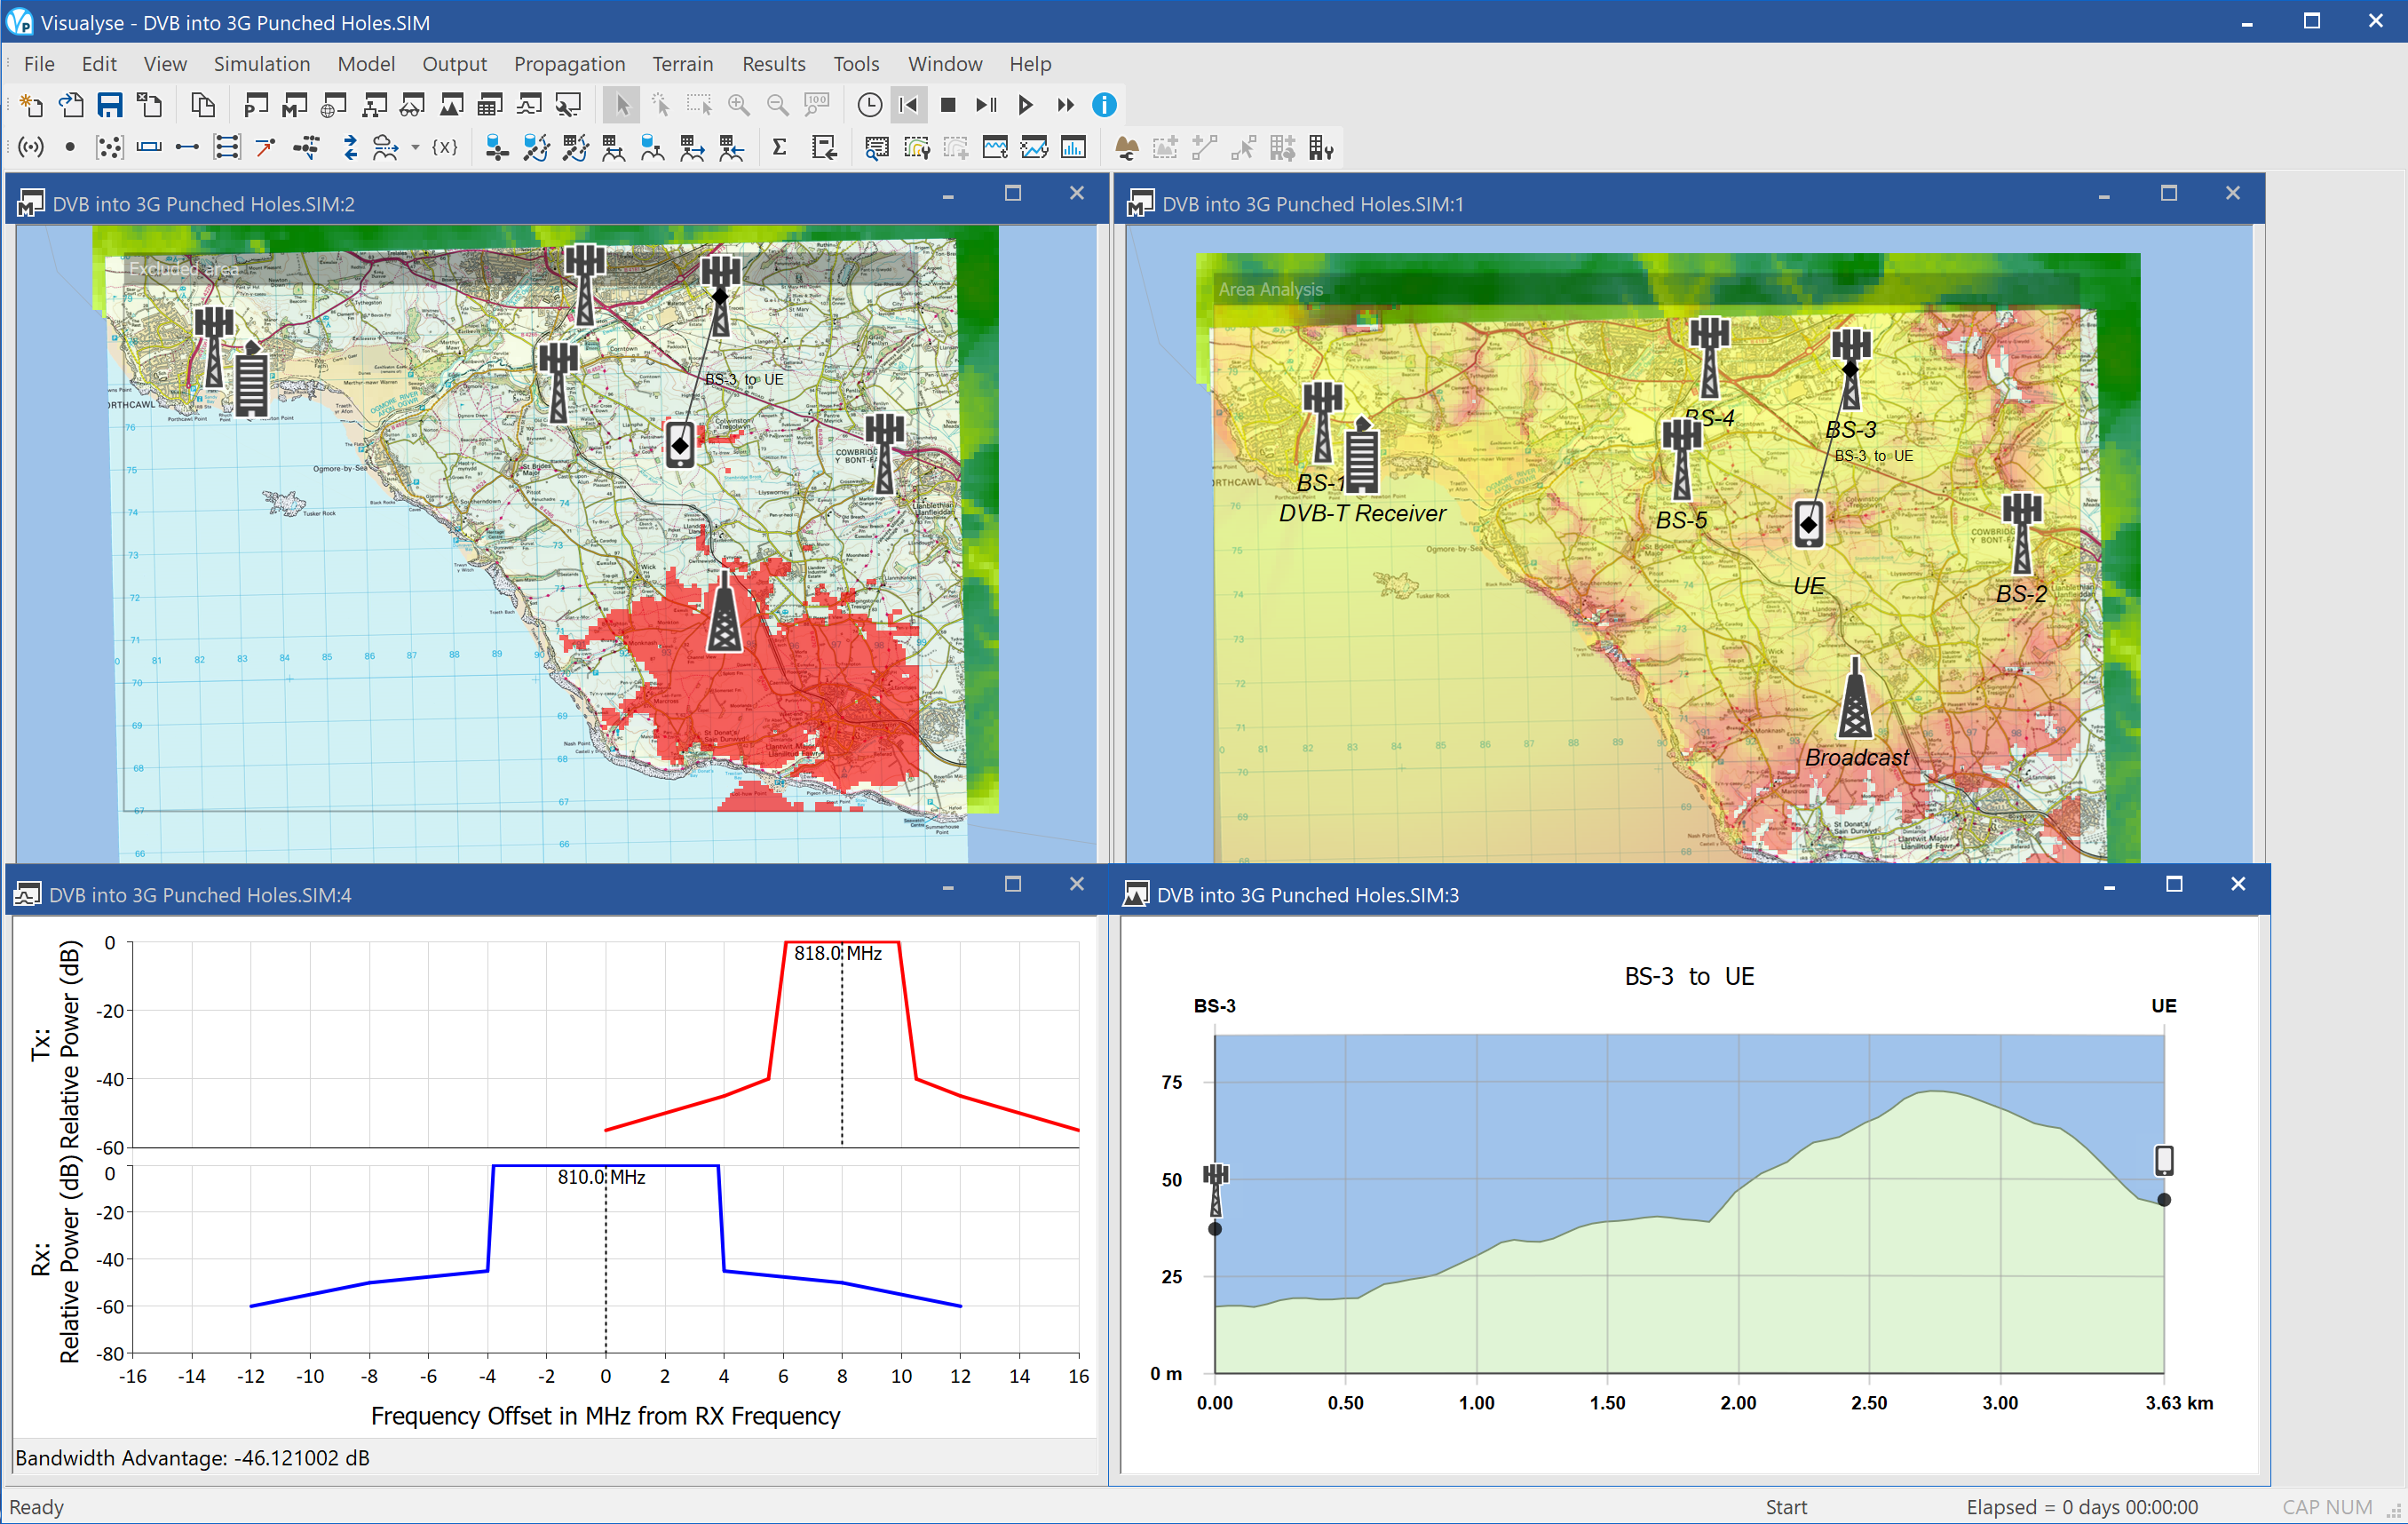
This scenario considers the reverse case to the previous example, and analyses where the mobile network’s coverage would be reduced due to adjacent band interference from the broadcaster.
In the screen shot above you can see four windows:
- Mercator map view (top right) showing where the wanted signal of the mobile system is sufficient to provide a service, overlaid on a map and also showing the clutter database categories (where available)
- Mercator map view (top left) displays the C/I of interference from the broadcast transmitter into the mobile network, showing the “punched-hole” effect from the broadcast transmitter
- Frequency view (bottom left) showing the 3G receive mask assumed and the spectrum mask of the broadcast transmitter, and the NFD calculated, around 46 dB
- Path profile view (bottom right) showing the terrain between one of the base stations and the test point UE.
It can be seen that the higher power broadcast transmitter causes significant “punched-holes” into the mobile networks coverage. To maintain coverage the mobile operator would have to plan with increased number of base stations near each of the broadcaster’s transmitters. This in turn would increase interference into the broadcast network!
Monte Carlo Mobile into DTT Fixed Receive
| Action: | Run Simulation |
|---|---|
| Modules used: | Define Variable |
| Terrain regions: | None |
| Frequency band: | UHF |
| Station types: | Broadcasting, Mobile |
| Propagation models: | Rec.P.1546, Hata / COST 231 |
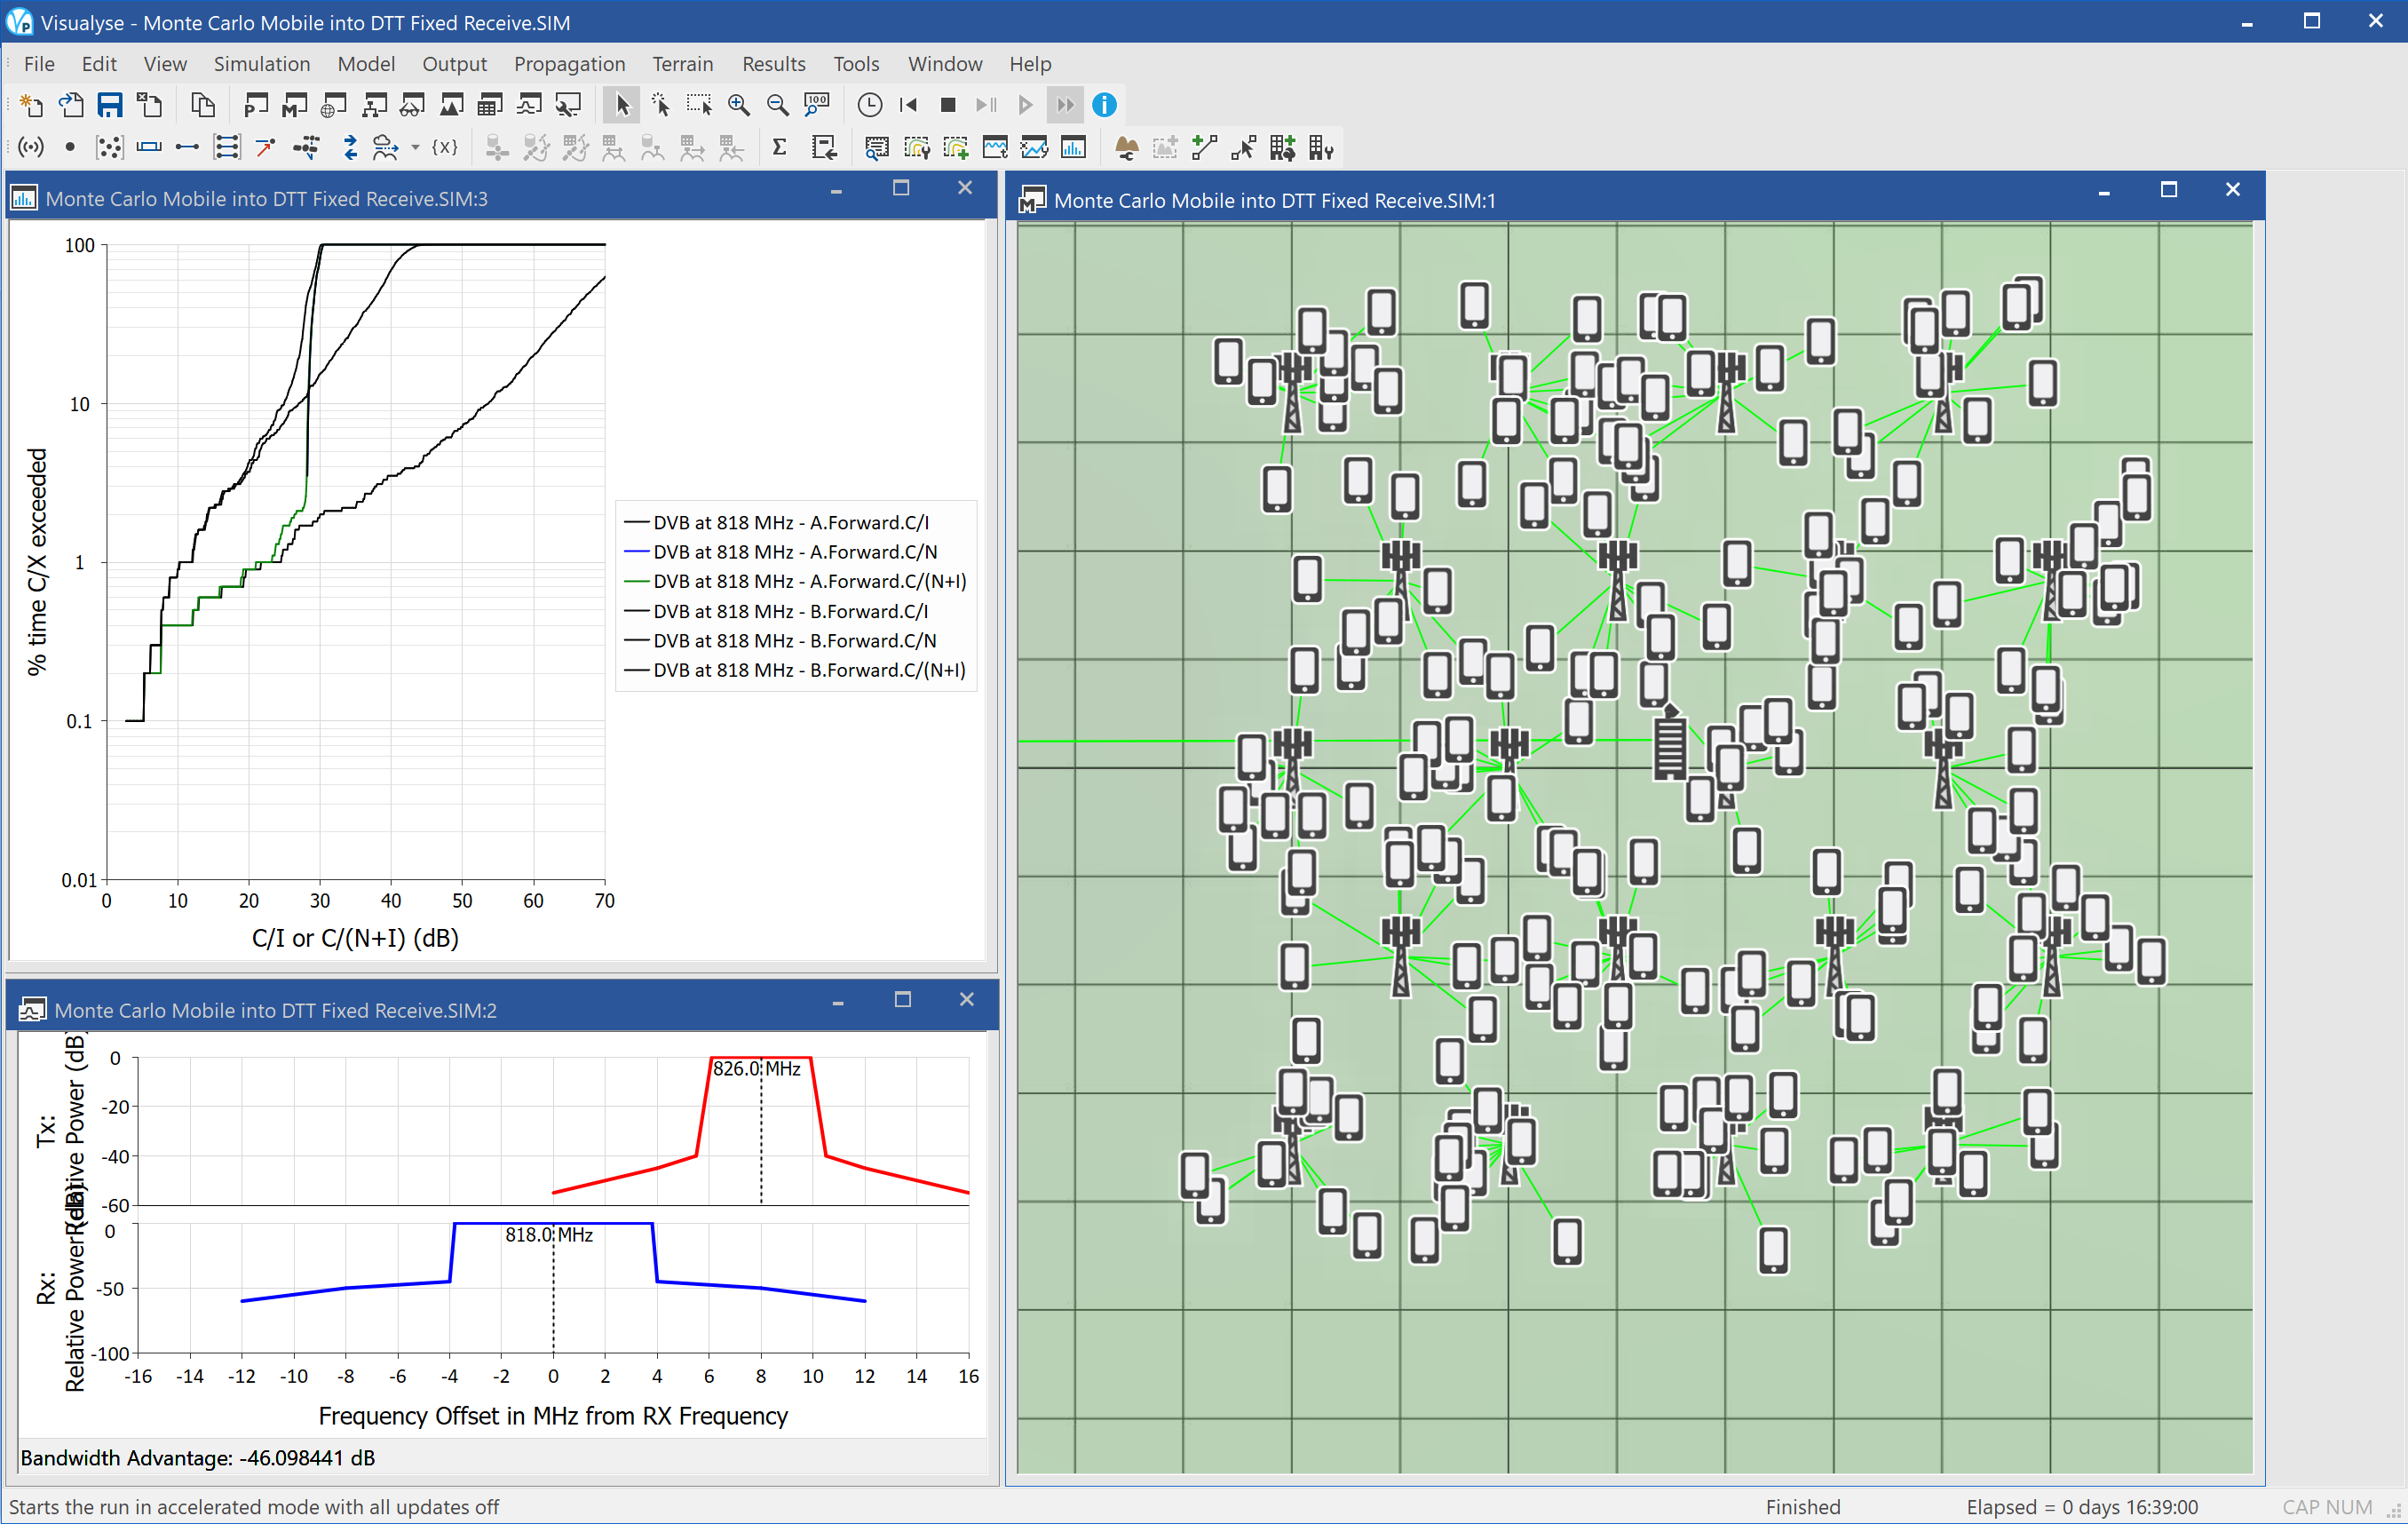
The previous two examples where based upon the premise of prediction of interference between real networks – i.e. using actual locations and powers to work out the resulting coverage that can be expected.
To undertake regulatory analysis it is often useful to consider generic scenarios with generic propagation models to identify lessons that are widely applicable.
This example considers one such simulation, using Monte Carlo methods to identify the impact of a mobile network on a fixed receiver using generic propagation models.
A test area has been configured with a grid of 20 base stations of a mobile network deployed in a hexagonal grid. Each cell is assumed to contain 10 mobile users simultaneously active and transmitting / receiving. The question this file addresses is if this network operating in the adjacent channel to a DTT broadcast to a fixed receiver, what would be the likelihood of interference?
Two sub-questions are actually being addressed in this simulation file:
- What would be interference into the fixed receiver if the adjacent band was used for a mobile network’s downlink?
- What would be interference into the fixed receiver if the adjacent band was used for a mobile network’s uplink?
To address this question a fixed receiver has been deployed, and its location randomised within the central mobile network cell. Simultaneously the location of each of the 200 mobiles has been randomised within its cell. Power control is used on both the uplink and downlink and the propagation models used are:
Hata / COST 231: base station to mobile / DTT receiver, mobile to base station / DTT receiver
ITU-R Rec.P.1546: broadcast transmitter to DTT receiver, assuming 95% location coverage and 50% of time
This form of Monte Carlo analysis produces results in the form of statistics, and in this case there are cumulative distribution functions (CDFs) of C/N, C/I, and C/(N+I) for the two cases above.
The screen shot above shows three windows open:
- Mercator view (right) showing the location of the base stations, the mobile, and the DTT receiver, and the links. A grid is overlaid with 1 km spacing.
- Statistics view (top left) showing the CDFs of C/N, C/I and C/(N+I) for each of the two cases above
- Frequency view (bottom left) showing the DVB and WCDMA carriers in adjacent channels
It can be seen that interference from the IMT-2000 downlink (BS TX) direction causes greater interference than the uplink (MS TX) direction, but both would reduce the likelihood of good reception.
Earth station coordination
This section contains the following examples:
Coordination Contours
| Action: | Export to Google Earth |
| Modules used: | IDWM |
| Terrain regions: | None |
| Frequency band: | Ku |
| Station types: | GSO Satellite, Earth Stations, Fixed Station |
| Propagation models: | Free space, ITU-R Rec.P.618, RR Appendix 7 Mode 1 |
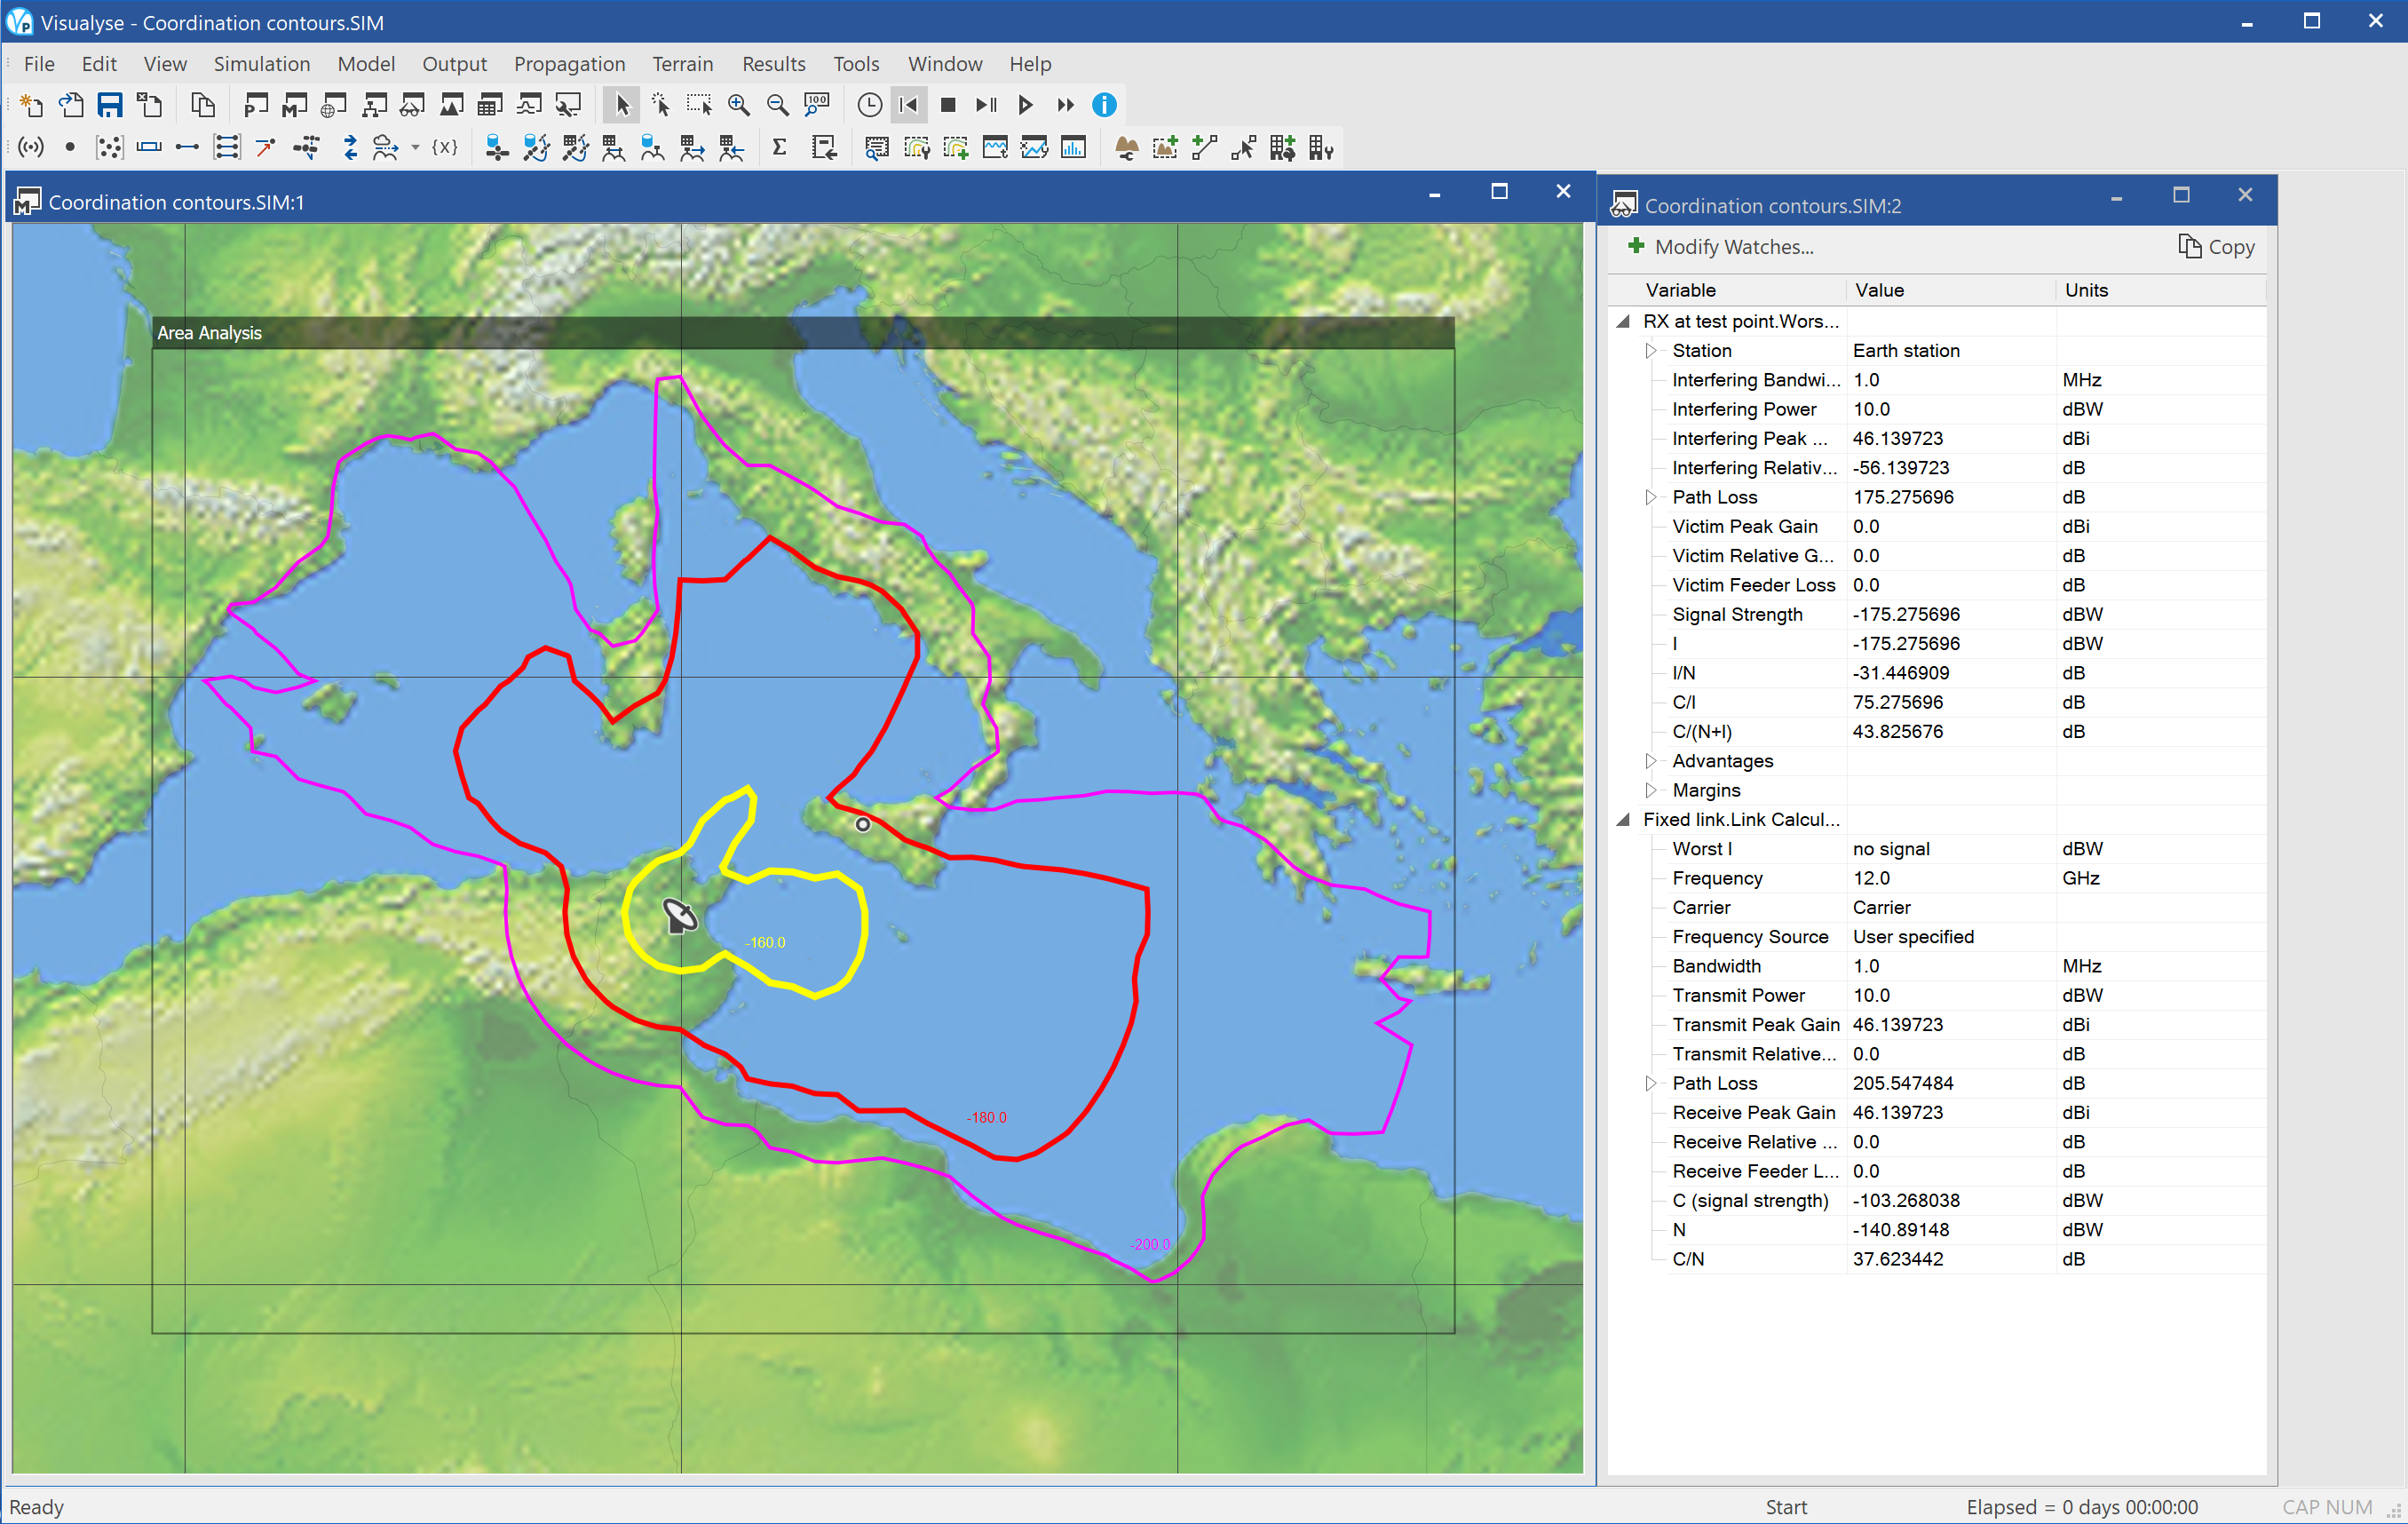
This example shows Visualyse Professional calculating the coordination contour around a satellite Earth Station.
The Earth Station is in Tunisia and is communicating with a GSO satellite at 23° East with an EIRP of 56 dBW. This might require coordination with the networks of other countries, and the starting point is derivation of the coordination contour.
In this simplified example we calculate the total of the EIRP plus path loss using the propagation model in Appendix 7 of the Radio Regulations. The Mode 1 of this propagation model has been selected (propagation along great circles), configured for 0.01% of the time. The various zones the path crosses (sea, coastal, inland etc.) are extracted from the IDWM database.
Note: If you don’t have access to IDWM you might see a slightly different contour.
Three contours are given for the -160, -180, and -200 dBW as received at a test point with isotropic 0 dBi gain.
Two windows are open:
- Mercator view (left) showing the location of the Earth Station and a test point, and the coordination contours
- Watch window (right) showing the link budget of the interfering signal from the Earth Station to the test point and the wanted signal on the uplink to the satellite
Note these coordination contours can be exported into Google Earth1 by selecting menu option “File | Export to KMZ”. This should produce a figure something like this:
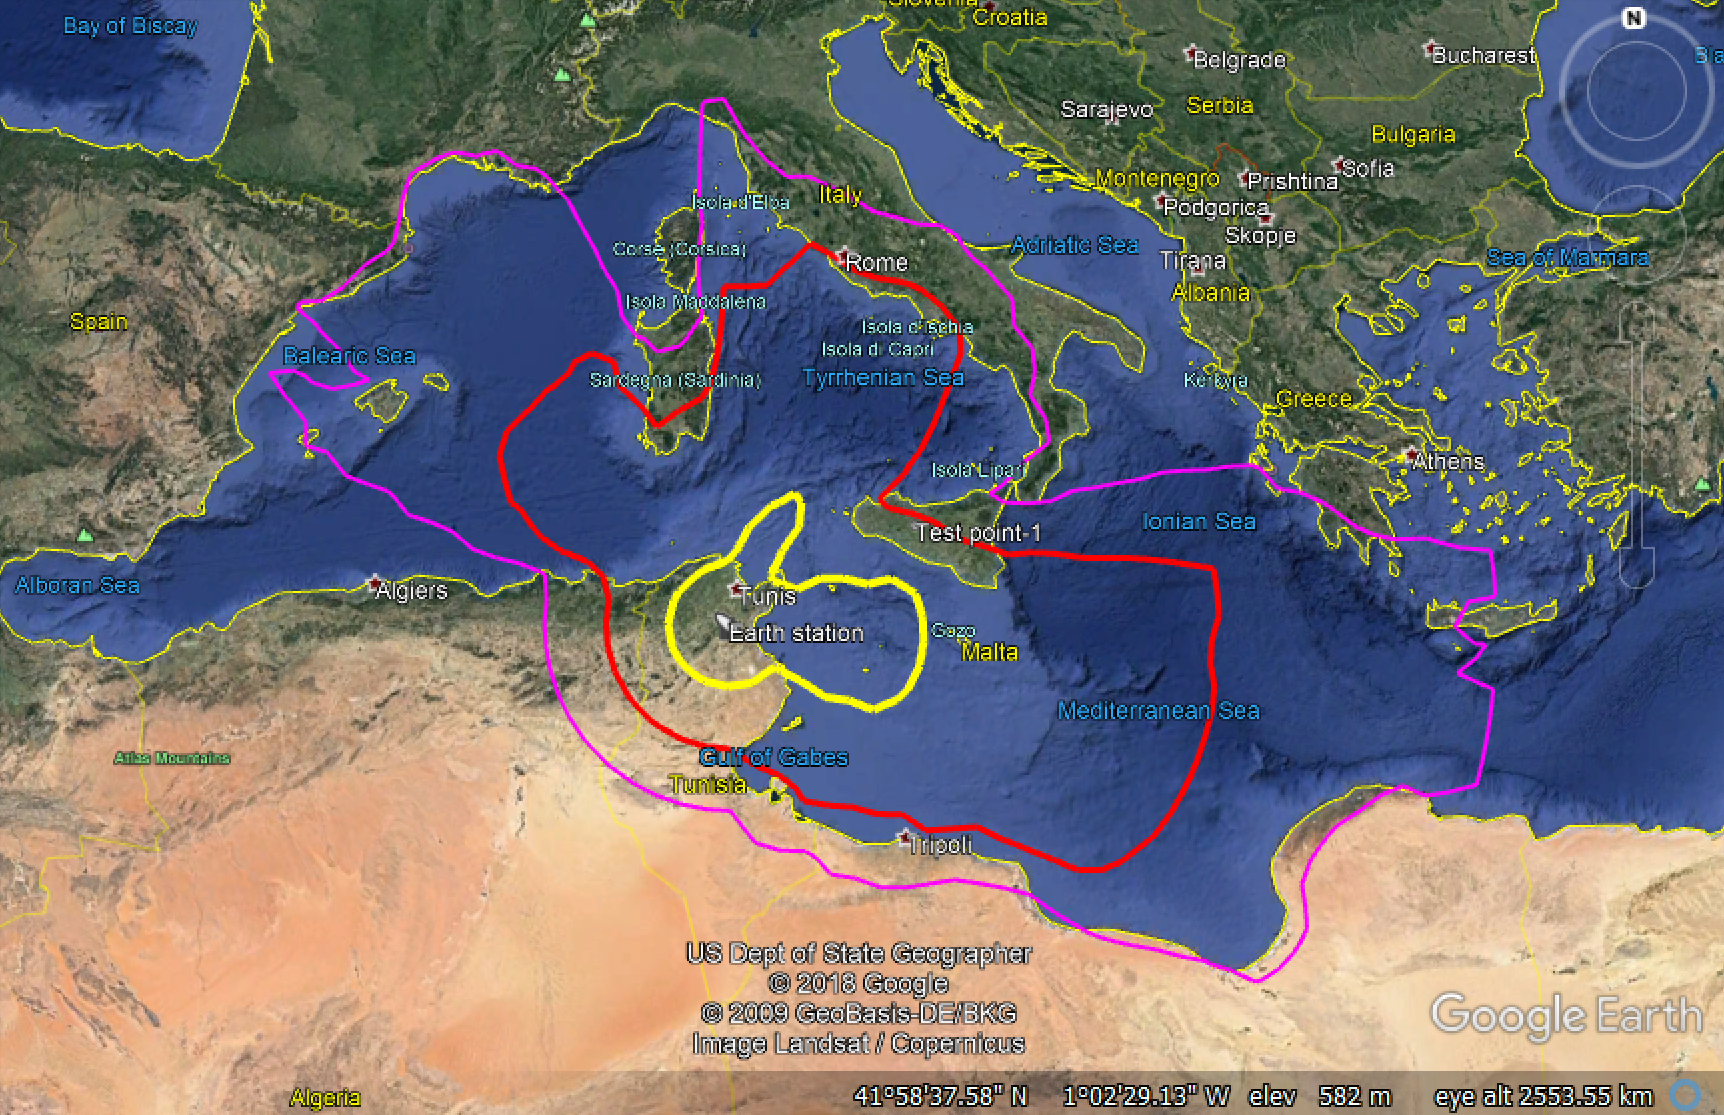
WiMAX to ES EZ
| Action: | Export to Google Earth |
| Modules used: | Terrain, IDWM |
| Terrain regions: | Sydney SRTM90 |
| Frequency band: | C |
| Station types: | GSO Satellite, Earth Stations, Fixed Station |
| Propagation models: | ITU-R Rec.P.452 |
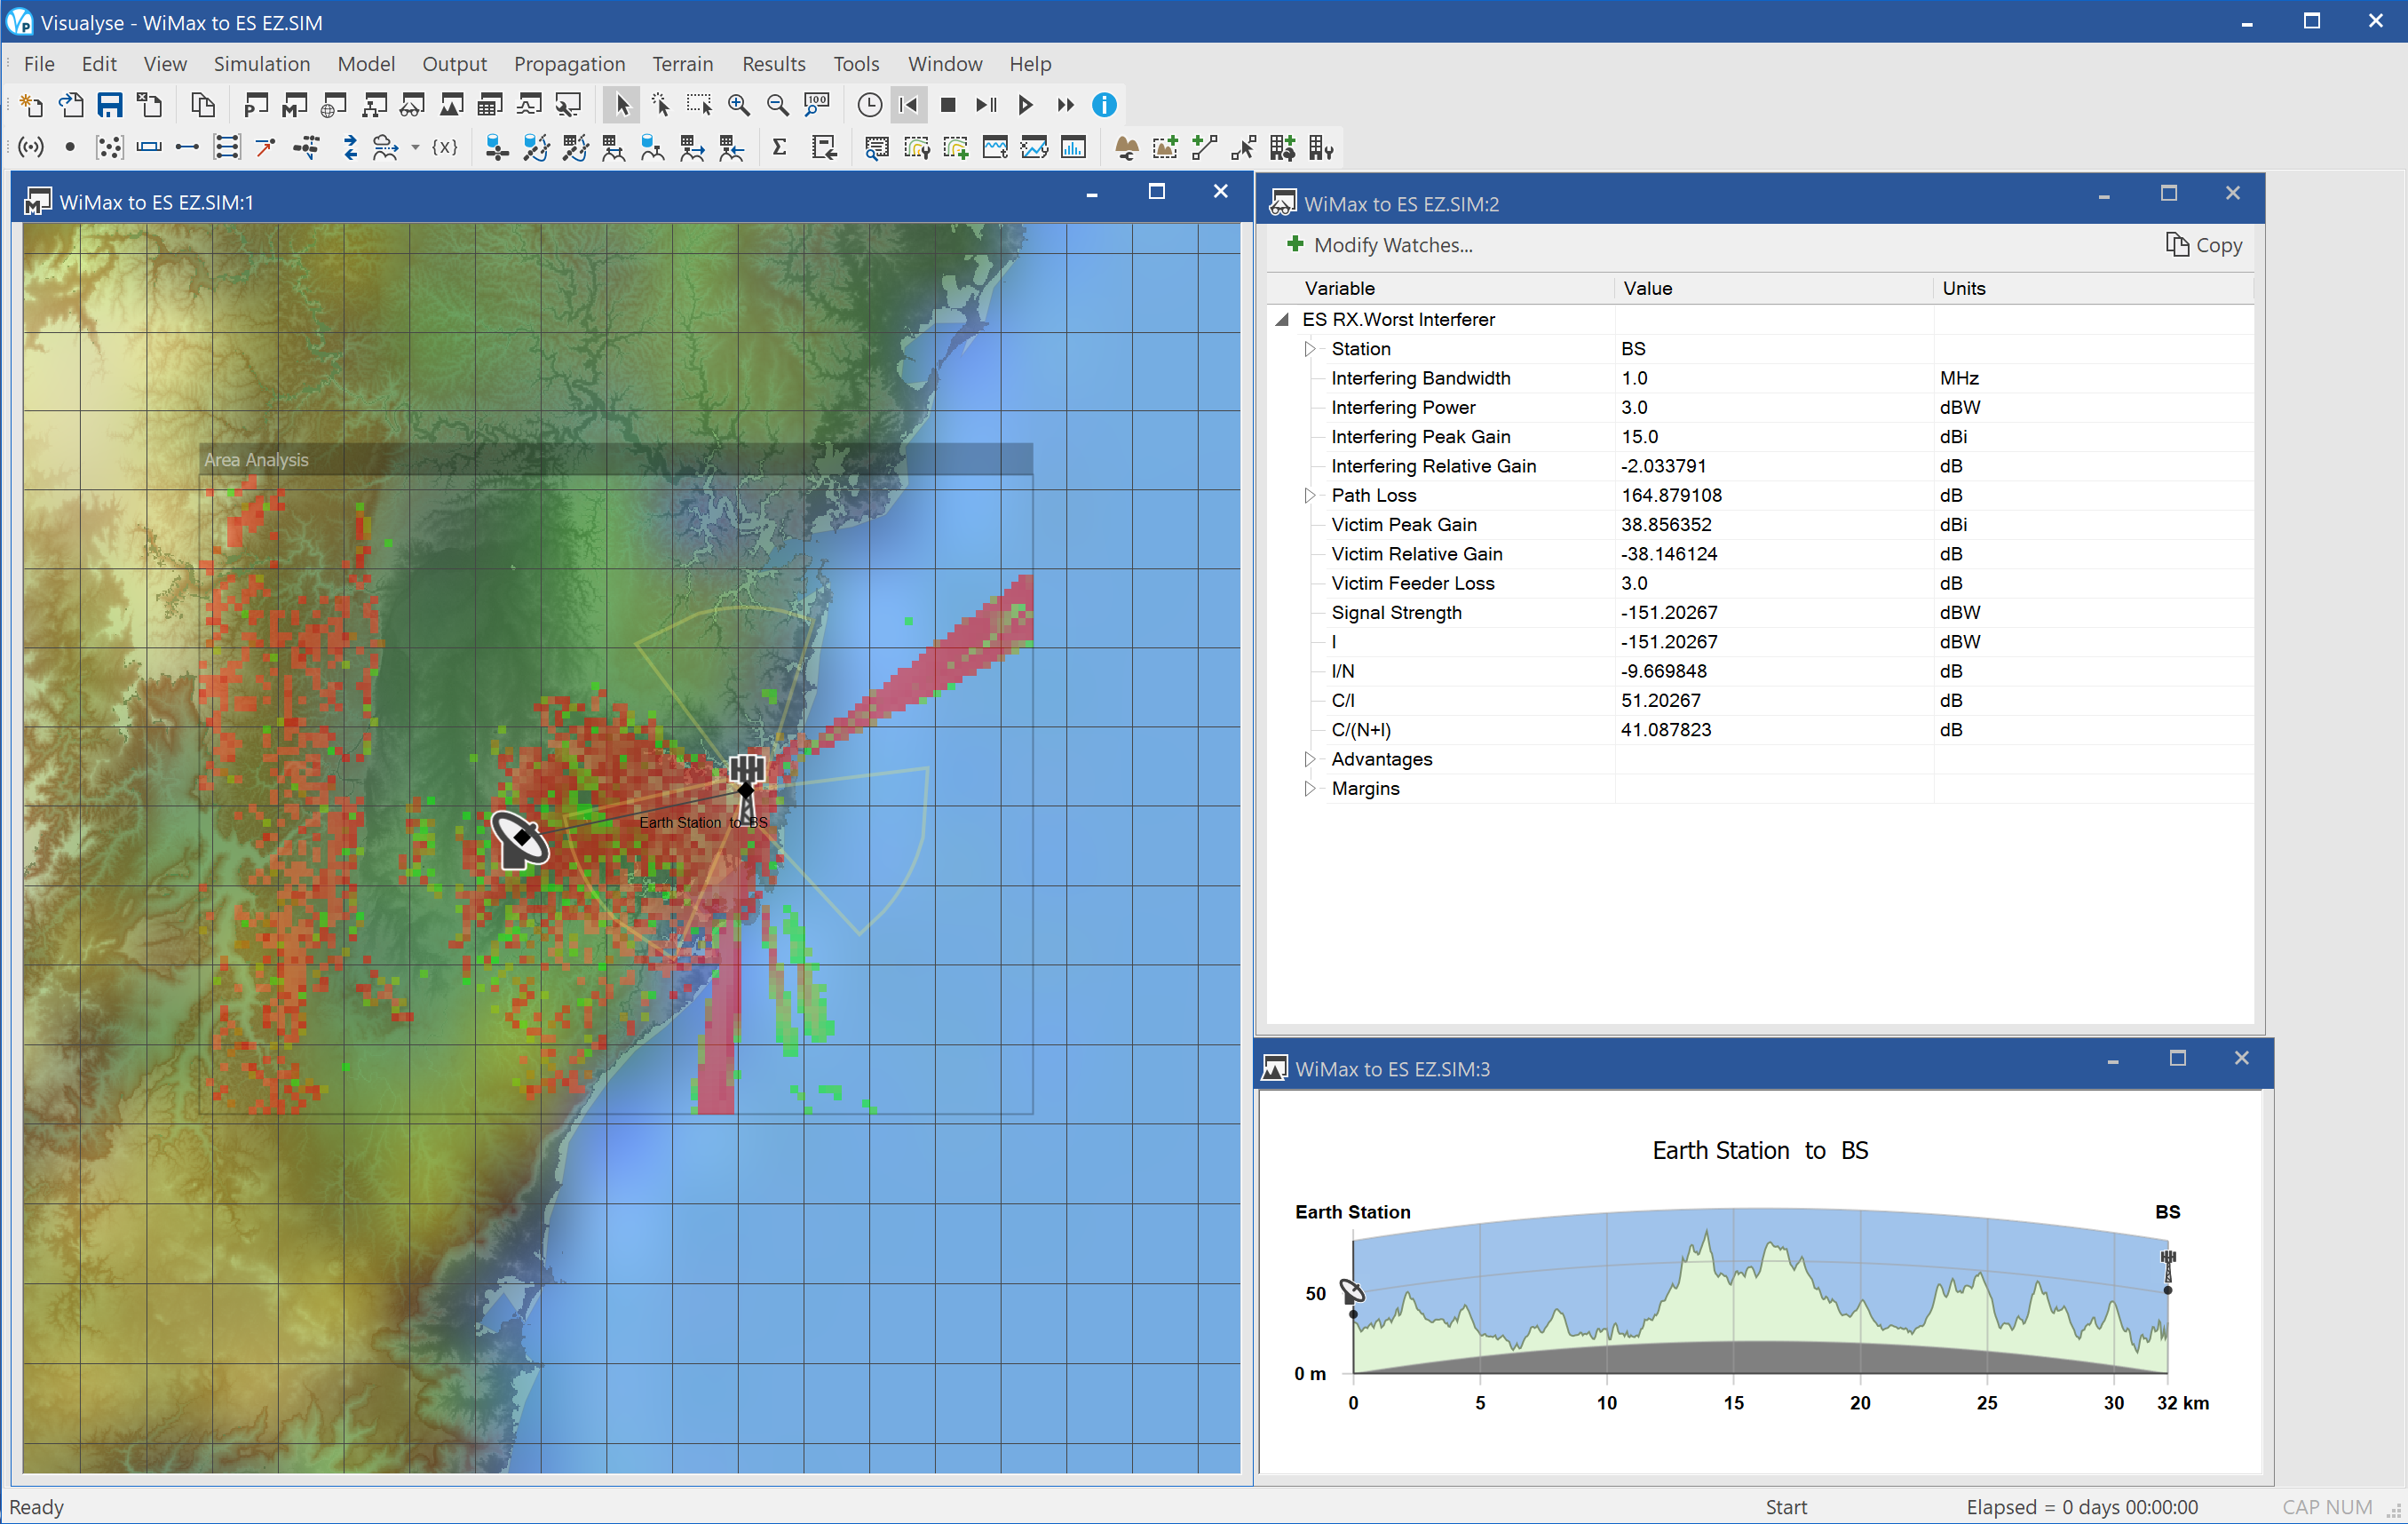
This simulation shows Visualyse Professional deriving the area around a WiMAX base station where it would not be possible to deploy an Earth station receiving in C-band.
It is based upon analysis relating to Agenda Item 1.4 as discussed at the WRC in November 2007. More information about this example is given in the associated “Visualyse Professional Version 7 Tutorial Document”.
The WiMAX base station has been deployed near Sydney with 3 sectors and with power of 43 dBm within 10 MHz carrier. The C Earth station uses a 3m dish pointing at a satellite at 150°E. The interference is calculated taking into account the terrain using the propagation model in ITU-R Rec.P.452.
The simulation can be used in two ways:
- Static analysis: the link budget shows the contributions of the interfering link budget and hence could be used for detailed coordination between a WiMAX network and a specific Earth station
- Exclusion zone analysis: using the Area Analysis, the locations where an Earth Station would suffer interference are identified and the level of interference at that point used to select the colour to fill in that pixel.
The screen shot above shows three windows open, namely:
- Mercator view (left) showing the terrain, coastlines, sea, locations of WiMAX base station and earth station, the base station sectors, and the overlaid Area Analysis showing by colour the interference an Earth station would experience at each point.
- Watch window (top right) showing the interfering link budget from the WiMAX base station to the test location of the Earth station shown on the map
- Path Profile (bottom right) showing the characteristics of the terrain between the Earth station and the base station
Additional geographical features can be observed by exporting the simulation including Area Analysis to Google Earth, as in the figure below.
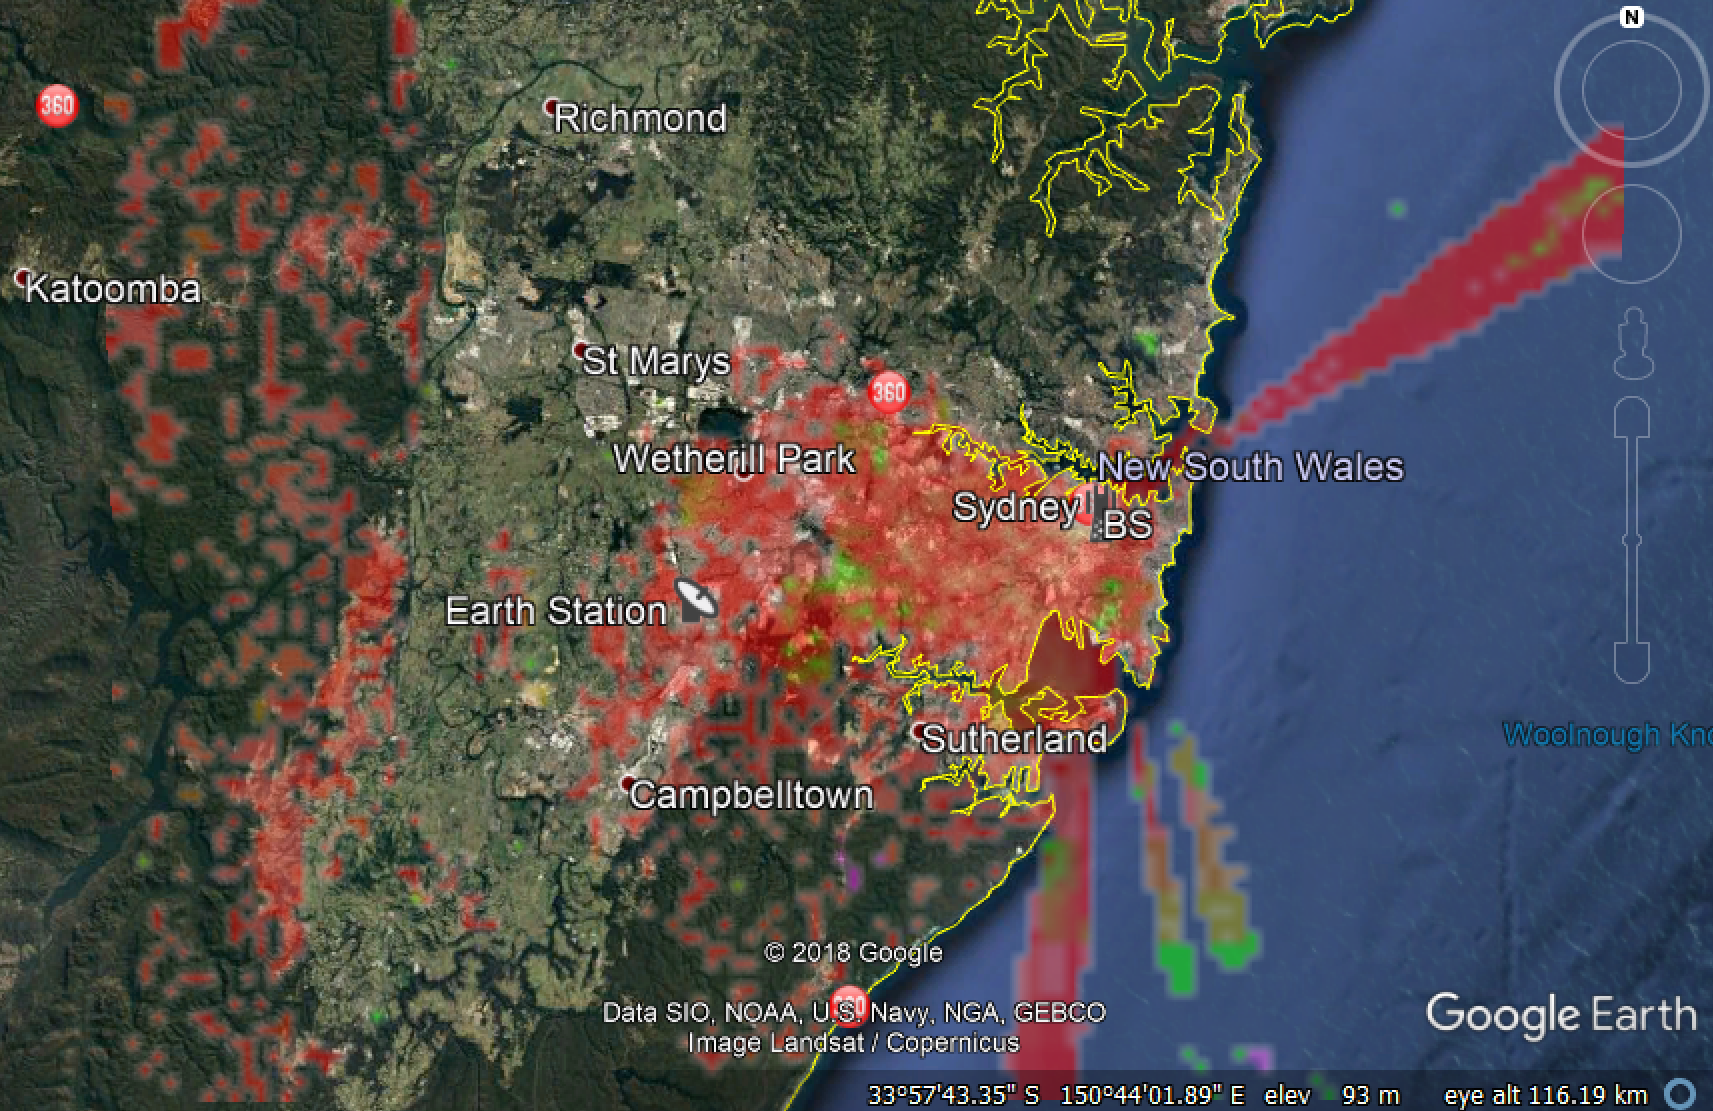
Little LEO gateways into FS
| Action: | Run Simulation |
| Modules used: | Terrain |
| Terrain regions: | Washington Area |
| Frequency band: | L |
| Station types: | GSO Satellite, Earth Stations, Fixed Station |
| Propagation models: | Free space, ITU-R Rec.P.618, ITU-R Rec.P.452 |
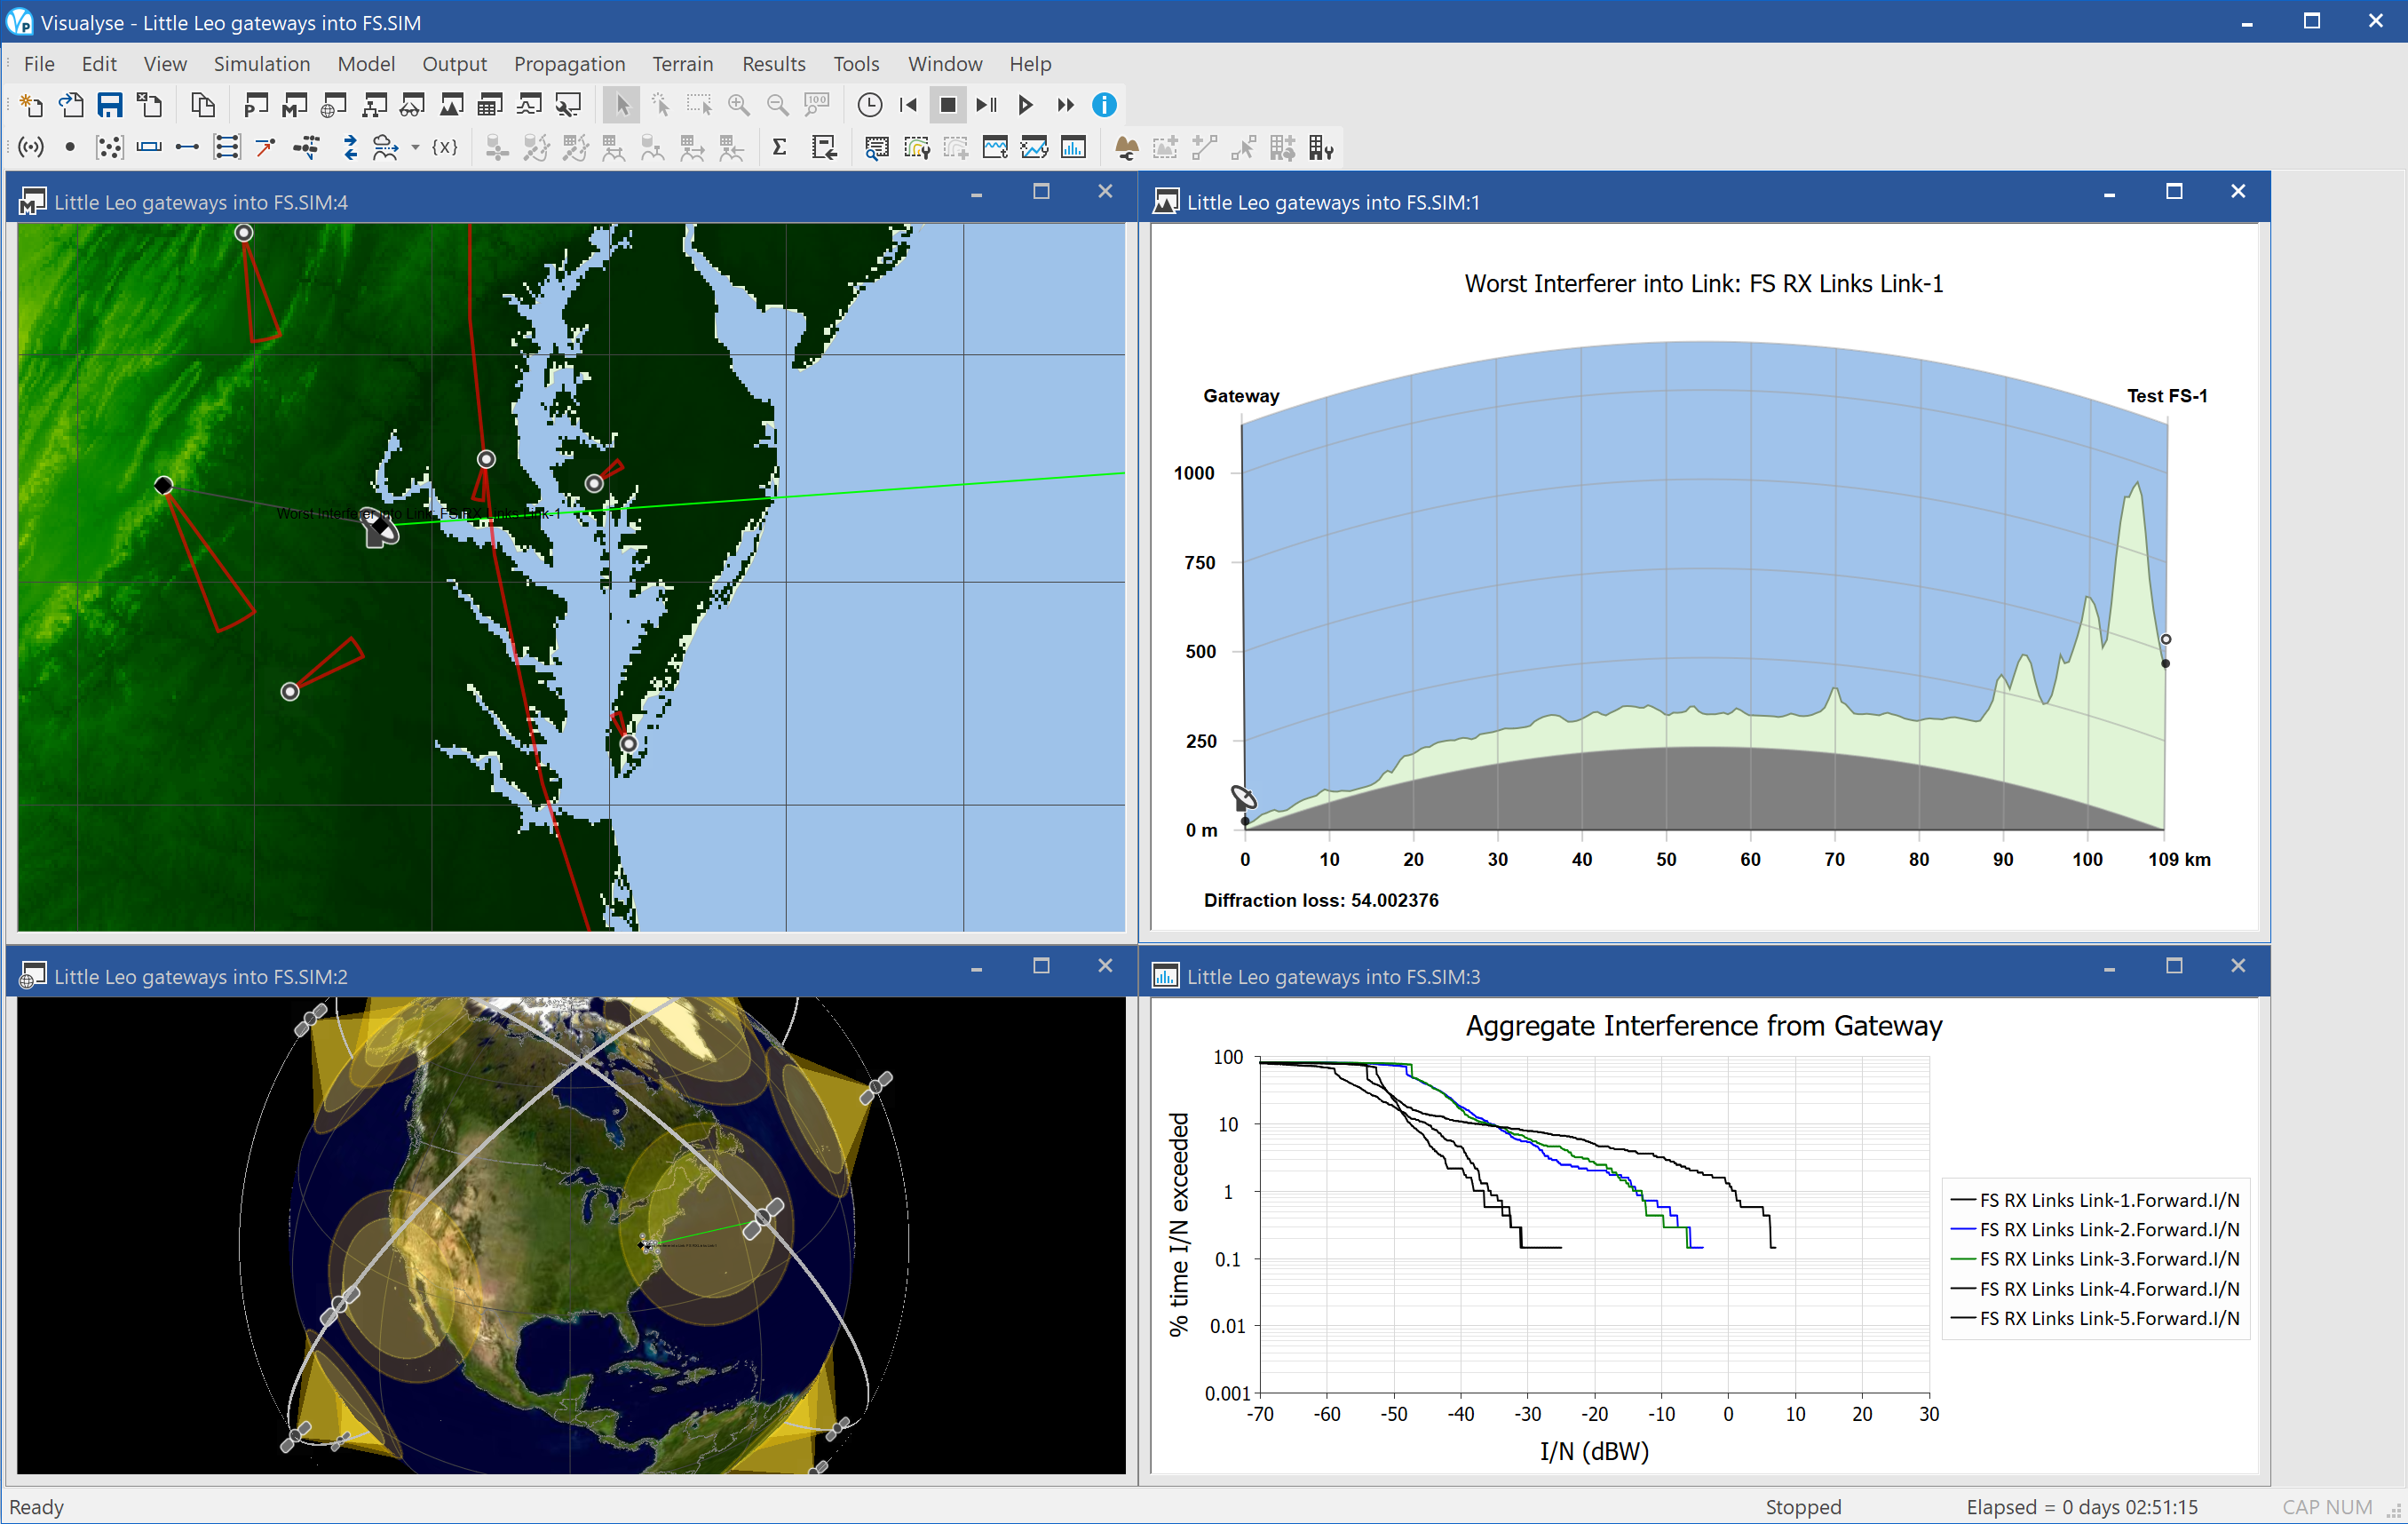
This example shows Visualyse Professional supporting the coordination of the gateway for a non-Geostationary satellite network with a number of nearby point to point fixed links. These could have been entered directly, read in using the FS import tool, or via the interface to the ITU’s terrestrial IFIC.
The non-GSO network is assumed to be providing store and forward messaging services – these are known as “Little LEOs” due to the lower capacity than the voice and high-speed data of the “Big LEOs”.
In this simulation, the gateway Earth Stations are uplink in L-band, co-frequency with a number of fixed service links. Interference at each of the FS receivers will vary depending upon:
- Gain of the gateway antenna (modelled using a Bessel function – real measured data could also be used) towards the FS link
- Path length and topography between the gateway and the FS receiver using a terrain database
- Change in atmospheric conditions using the propagation model in ITU-R Rec.P.452
Hence the interference, measured as the I/N, will vary in time and it is necessary to run a simulation to work out the probability that various thresholds are met.
The screen shot above shows four windows open:
- Mercator view (top left), showing the locations of the gateway and fixed service receivers, the direction of their azimuth, colour coding of terrain heights, and overlaid map (this might not be available on all installation)
- 3D view (bottom left), showing the satellites in the non-GSO constellation, their beams, the links, space tracks, gateway and terrestrial fixed stations
- Terrain path profile (top right), showing the slice of terrain between the gateway and one of the fixed service receivers
- Statistics graph (bottom right), showing the cumulative distribution function of the I/N at each of the FS receivers.
-
At time of writing this document, Google Earth could be downloaded from: http://earth.google.com/ ↩
Fixed planning and coordination
This section contains the following examples:
FS Import from IFIC
| Action: | None |
| Modules used: | None |
| Terrain regions: | None |
| Frequency band: | C |
| Station types: | Fixed Stations |
| Propagation models: | ITU-R Rec.P.452 |
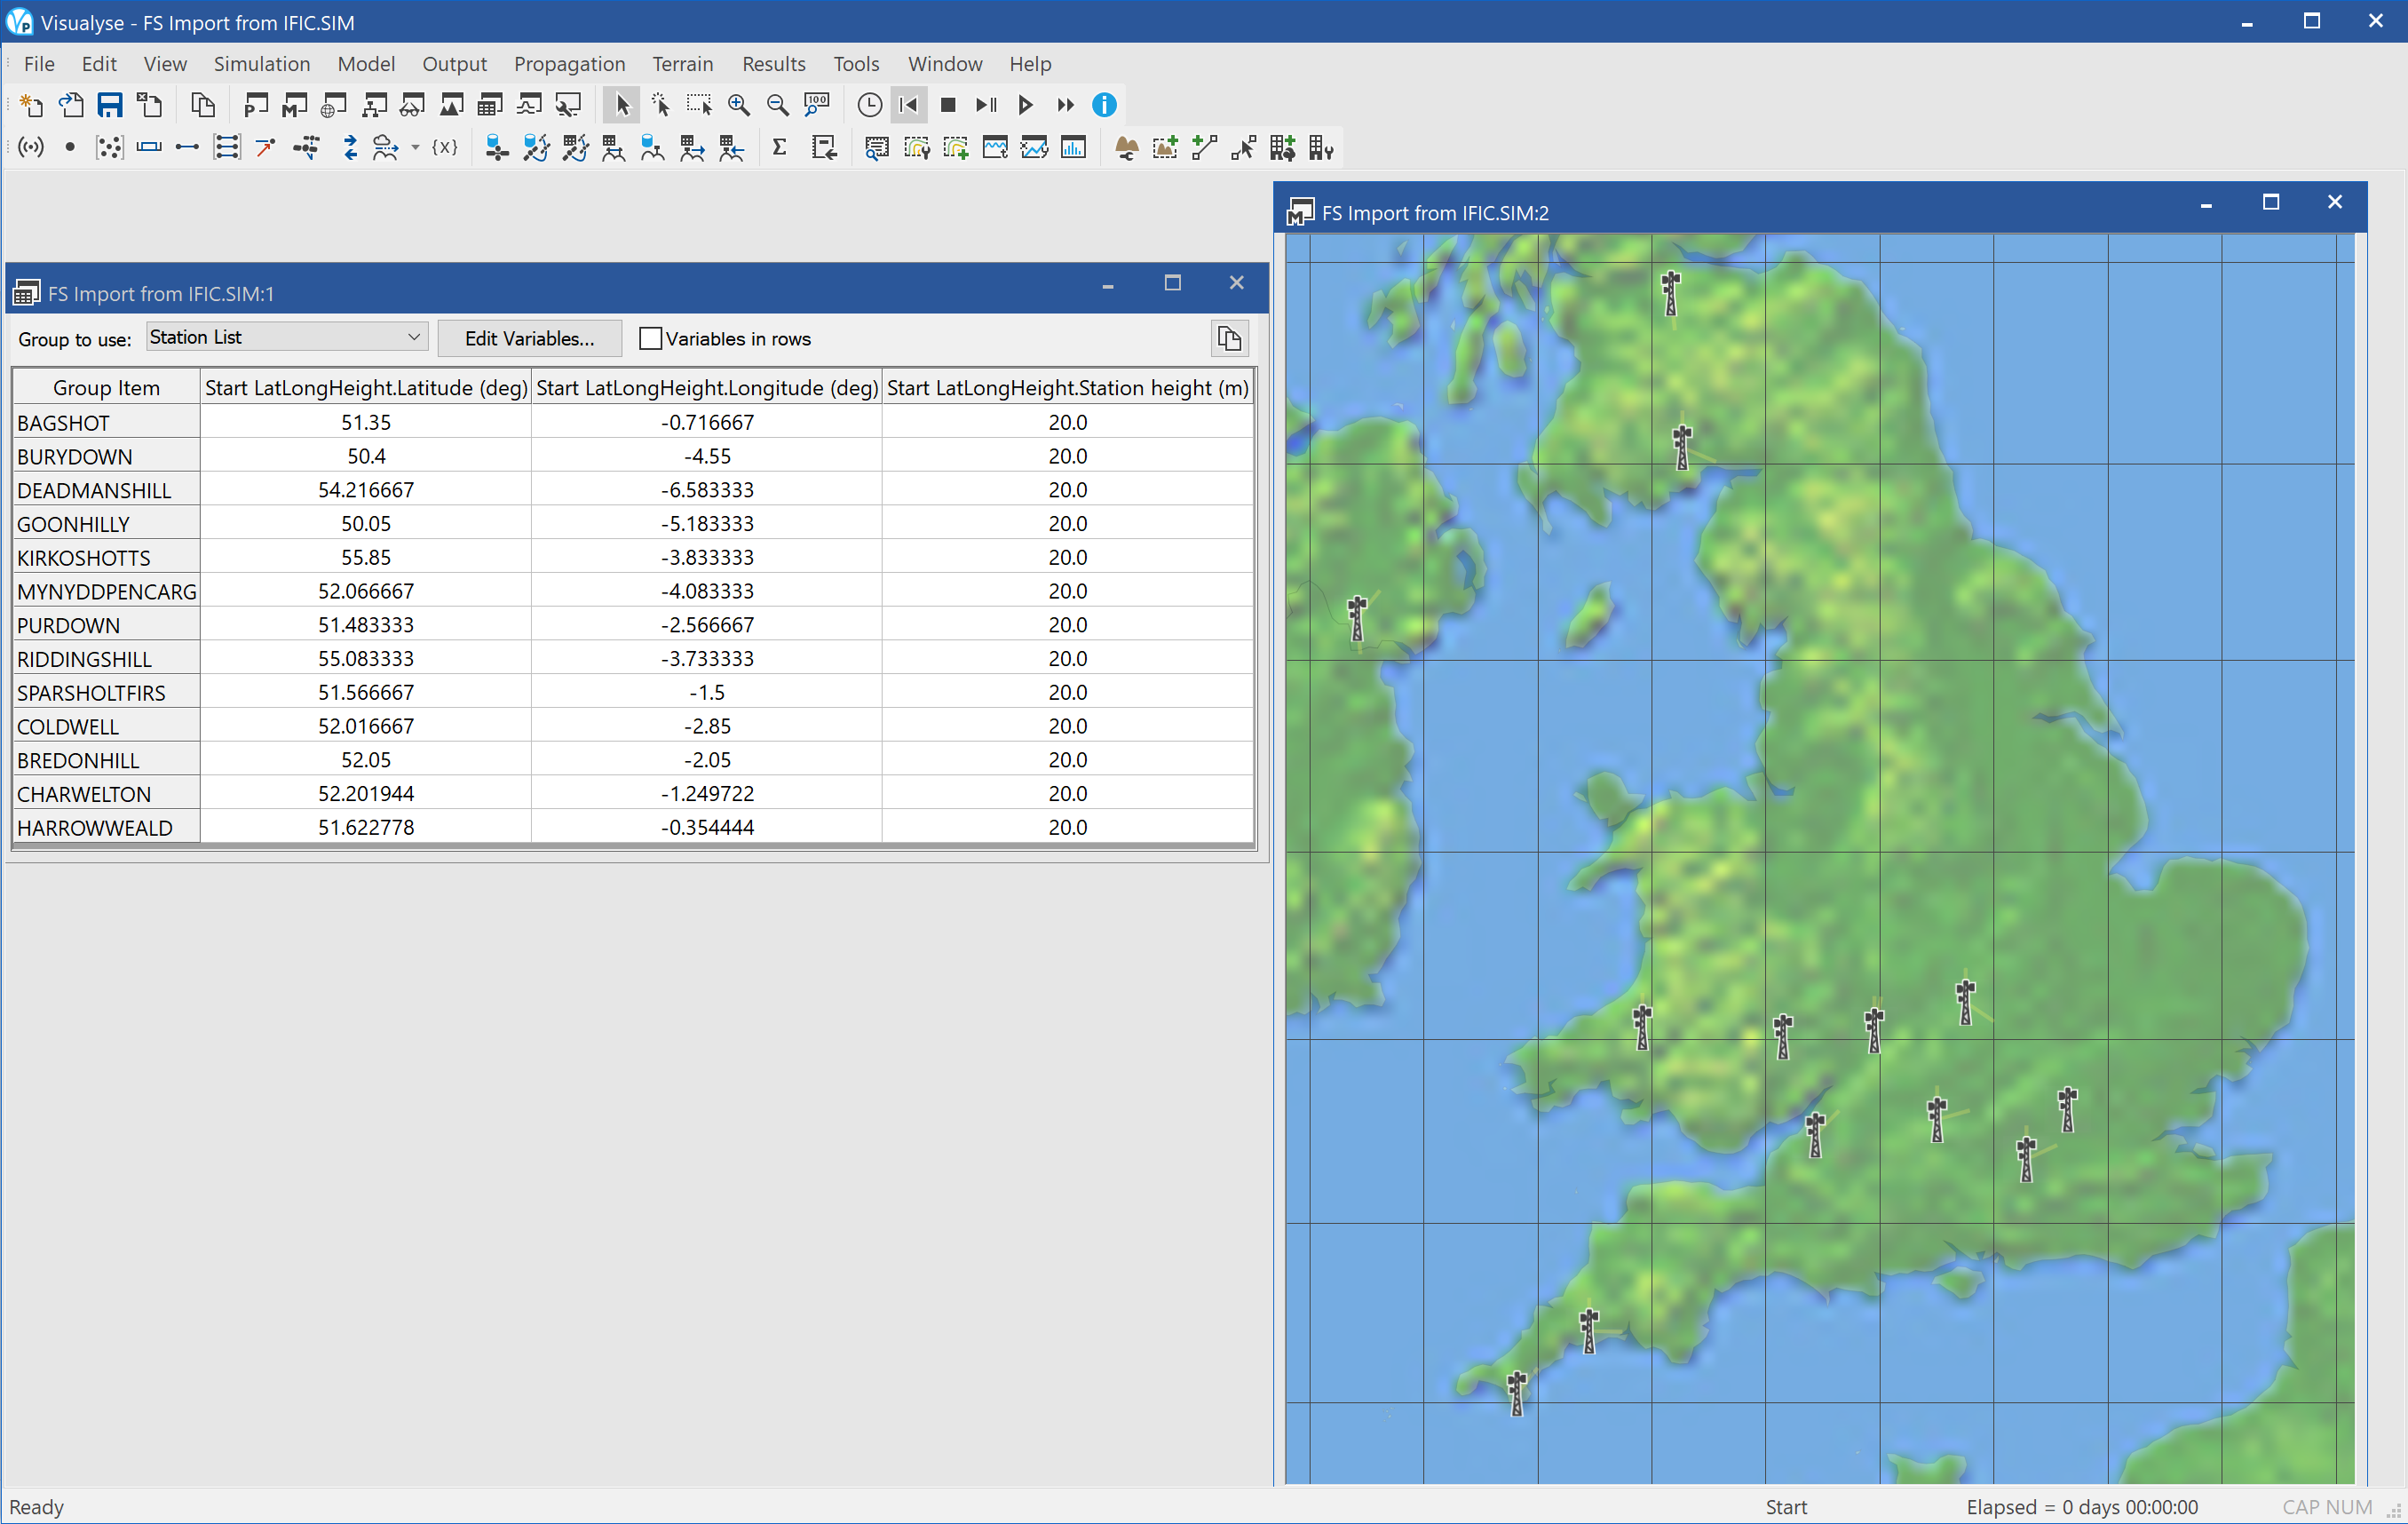
This example file shows the results of a search of the Terrestrial IFIC. The screen shot above shows the search which was of:
- Assignments in the UK (Administration code = “G”)
- Frequency between 7,000 MHz and 7,010 MHz
- Any receipt date, filing type or service
The query returned 13 FS transmitters, including their locations (latitude, longitudes), gain patterns, pointing angles, frequencies, bandwidths and EIRPs.
The screen shot above shows two windows and two dialogs:
- Terrestrial IFIC query dialog (top left) showing the options to search the database
- Terrestrial IFIC query response (middle) showing the return list of systems
- Table view (bottom left) showing the (lat, long, heights) of the returned systems
- Mercator map view (right) showing the locations of the stations and pointing angles of their antennas.
PtMP UT Deployment
| Action: | Run simulation |
| Modules used: | Terrain, IDWM, Define Variable |
| Terrain regions: | Northern Ireland |
| Frequency band: | C |
| Station types: | Earth Stations, Fixed Stations |
| Propagation models: | ITU-R Rec.P.452 |
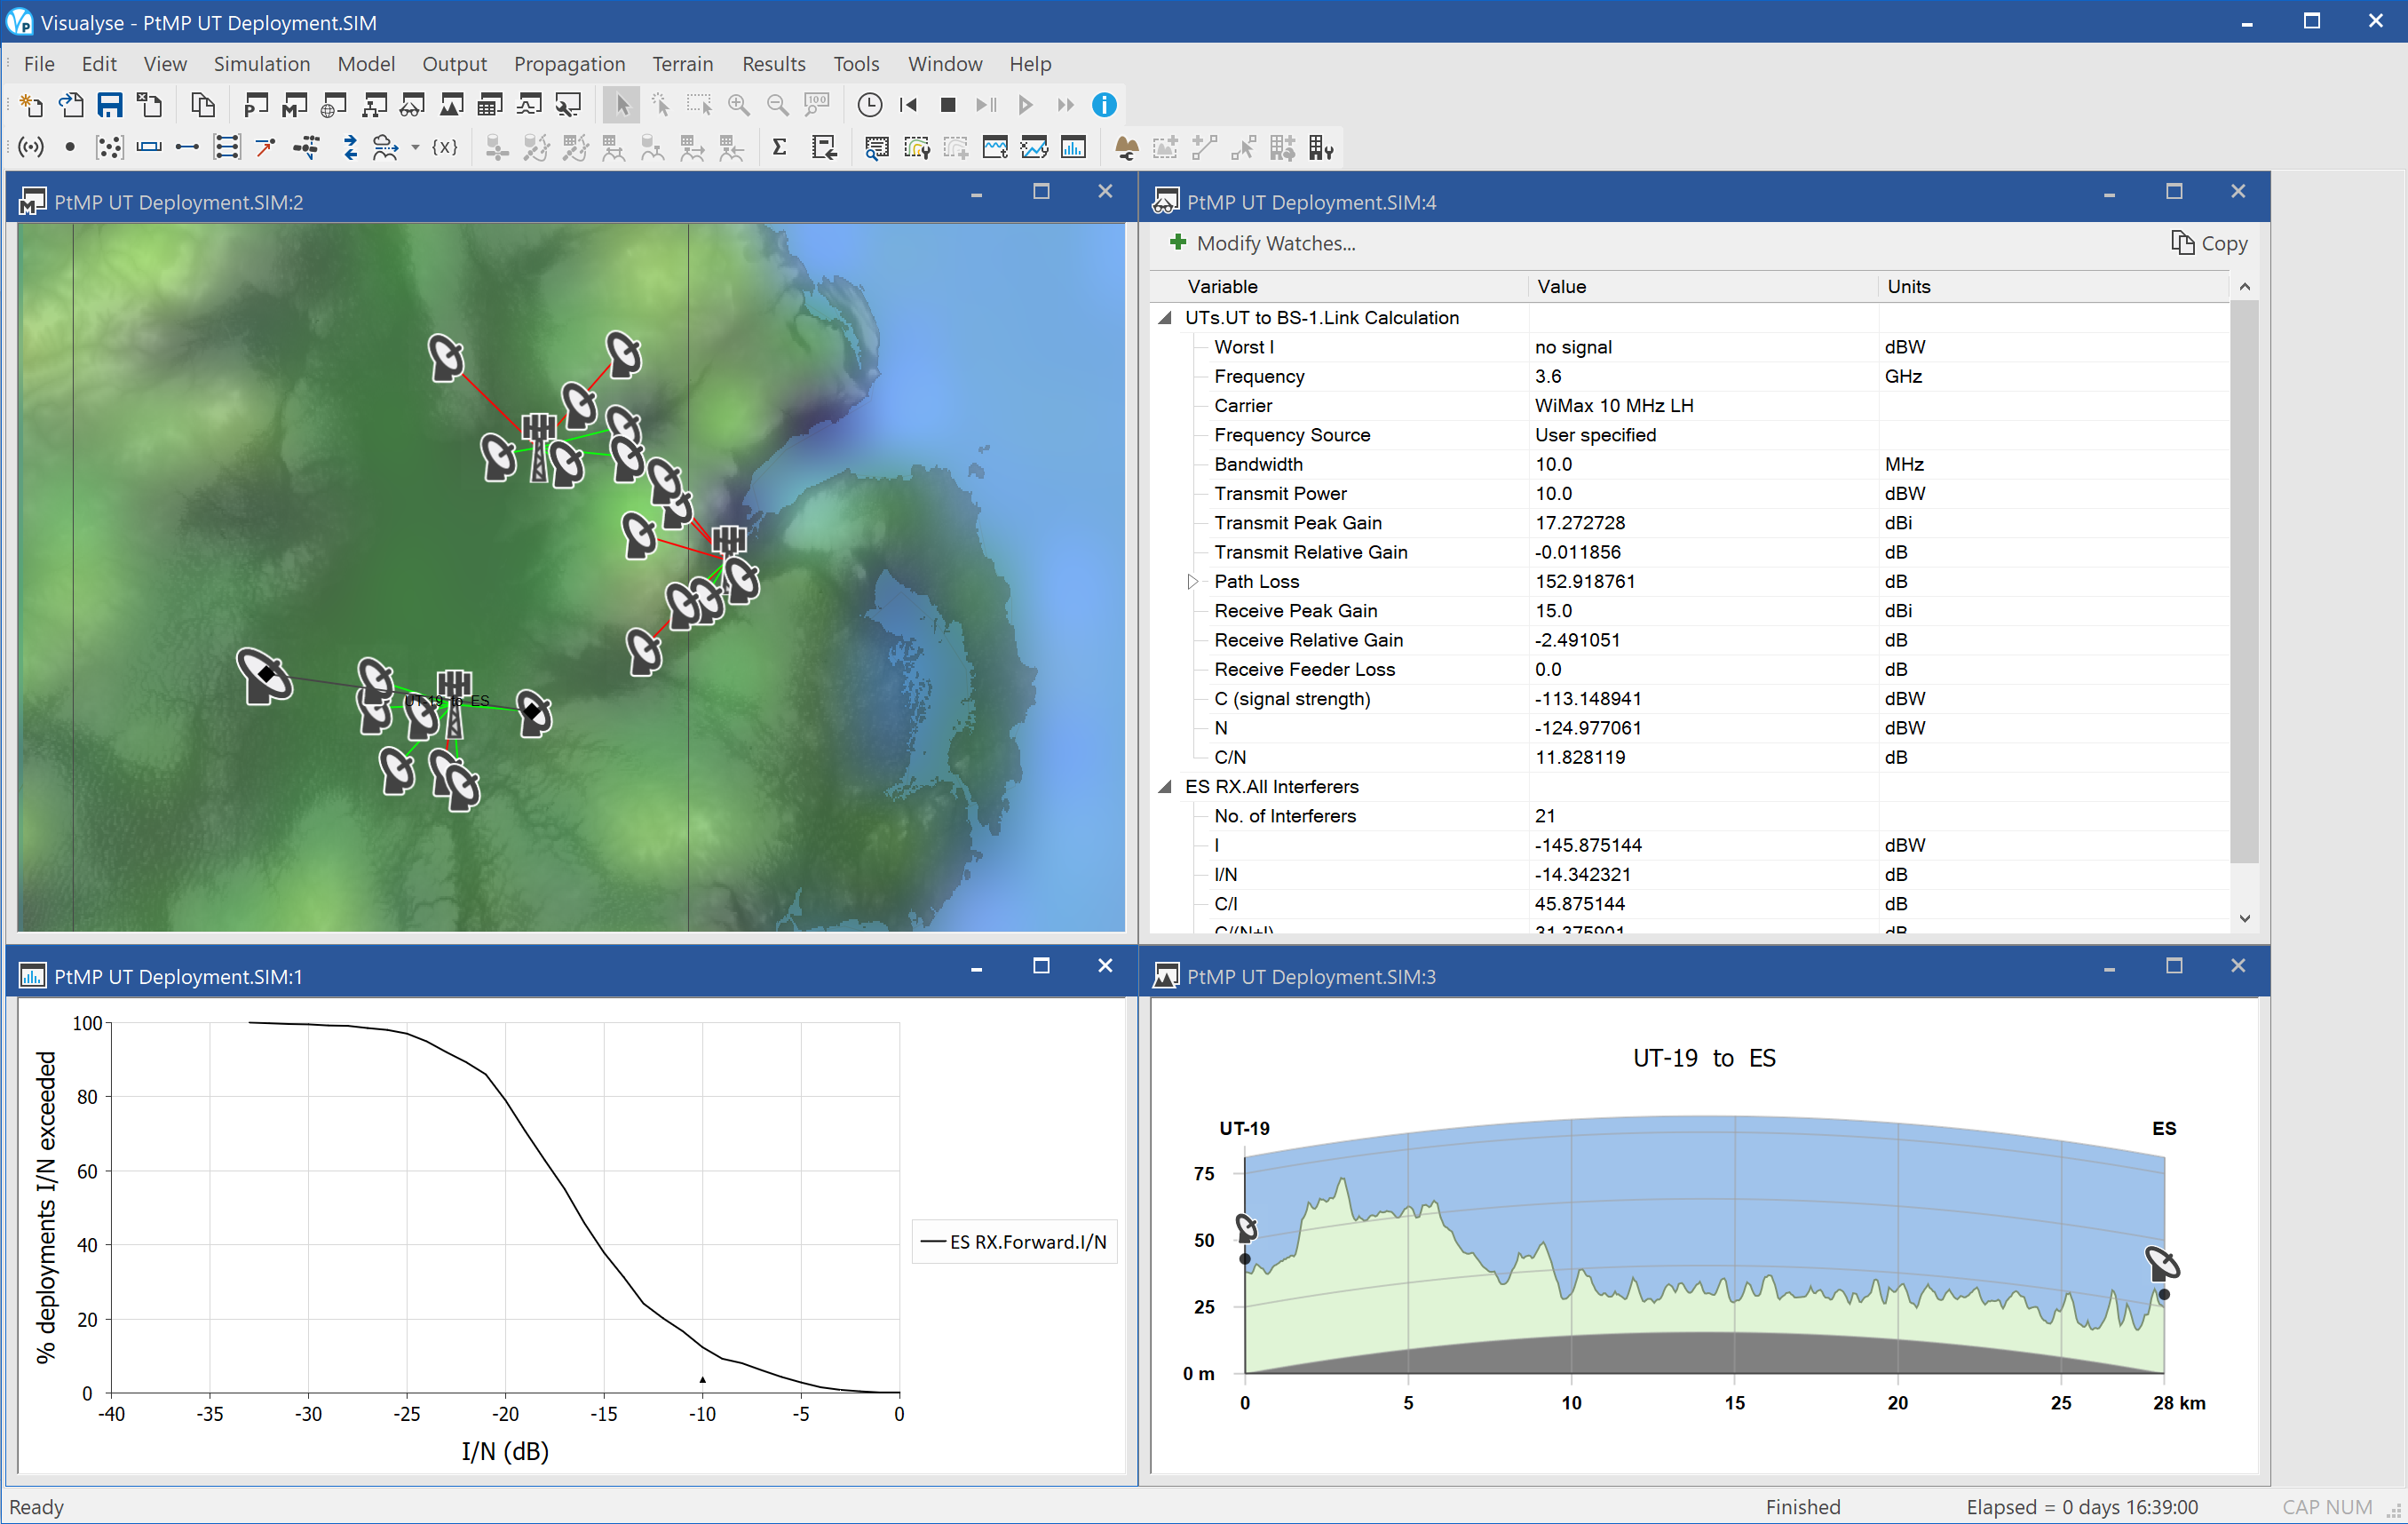
This example file shows an analysis of the impact of deployment probability on the interference that an Earth station would experience from a point to multi-point (PtMP) fixed service network.
In this scenario a PtMP operator intends to provide communication services to fixed terminals on a frequency that is also used by an Earth station to receive downlinks. The PtMP operator must ensure it protects the ES, but it does not know where it will have customers in the future.
One approach to determine the feasibility of deploying a base station at certain locations is to identify the probability that a deployment of user terminals (UTs) would cause interference.
This is done by undertaking a Monte Carlo modelling approach that randomises the locations of the UTs across the PtMP operator service area. Other factors that could vary, such as propagation, are fixed, as they would vary in the time domain and this simulation is looking at probabilities relating to deployments.
The screen shot above shows four windows open:
- Mercator view (top left) showing the locations of the base stations, the UTs, the links from each UT to its respective base station, the location of the Earth station, and the terrain overlay
- Statistics graph (bottom left) showing the cumulative distribution function of the aggregate I/N at the Earth station from each of the potential deployment configurations of UTs. Though the I/N at the ES exceeds the -10 dB threshold, the probability of a “bad” deployment is only about 10%
- Watch window (top right) showing the link budget for one of the PtMP terminal uplinks and also the aggregate interference at the ES
- Path Profile (bottom right) showing the path between the Earth station and its worst interferer
PtP link planning
| Action: | Change propagation parameters |
| Modules used: | Terrain |
| Terrain regions: | North West |
| Frequency band: | Ka |
| Station types: | Fixed Stations |
| Propagation models: | Free space, ITU-R Rec.P.530 (rain), ITU-R Rec.P.452, |
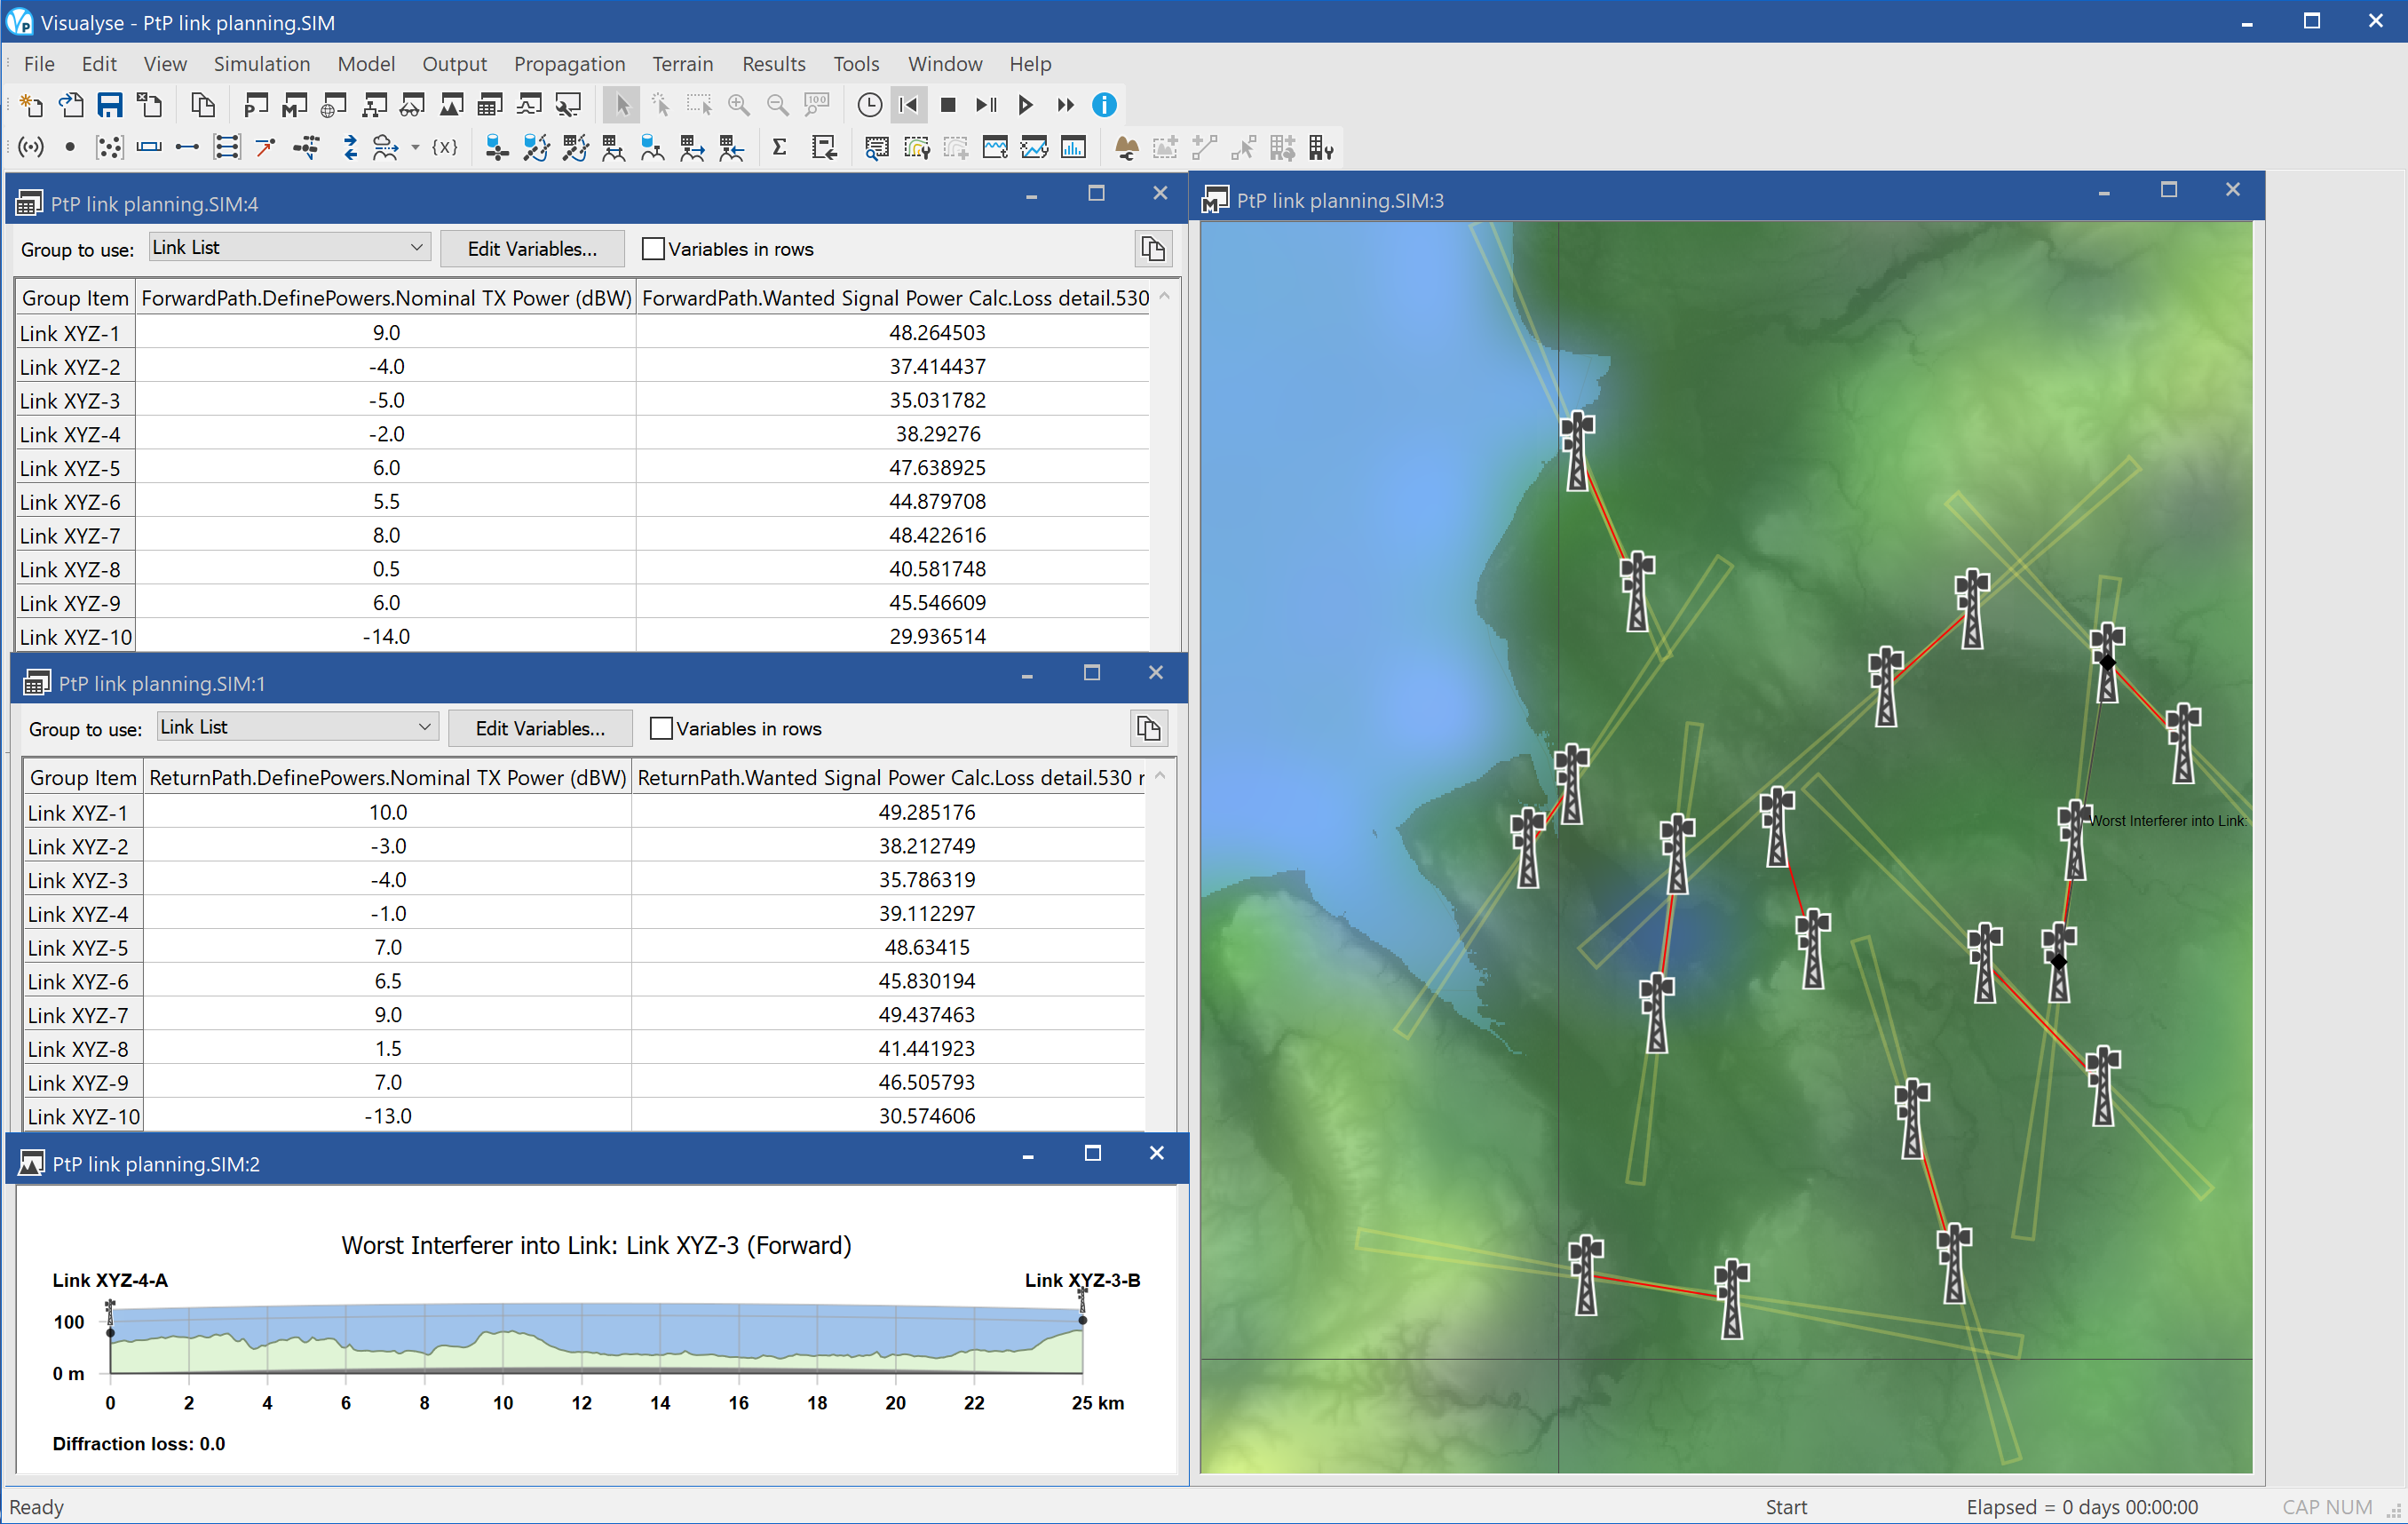
This example shows Visualyse Professional being used to support the planning of point to point (PtP) fixed links. A database of link positions has been entered – either directly or using one of:
- Fixed service import tool
- Station location import tool
All links are co-frequency within the 28 GHz band and are using a bandwidth of 14 MHz. The links have been planned using the rain fade model in ITU-R Rec.P.530-16 using the rain rates in ITU-R Rec.P.837 and a percentage level of 0.01% - i.e. an availability target of 99.99%.
The transmit power (and hence EIRP) have been selected so that the receive C/N is about 15 dB, which includes some interference and implementation margin against the target C/(N+I) of 13.5 dB. In this case we have assumed the implementation margin should be 1 dB so the target C/(N+I) is 14.5 dB.
Interference paths have been set up so that the aggregate interference from all other links into each other is calculated using ITU-R Rec.P.452 and a terrain database. As the wanted link is set to deep fade, the interfering signal is assumed to be a median 50% of time level.
The screen shot above shows four windows open:
- Mercator view (right) showing the locations of each of the FS links and with a terrain overlay
- Table view (top left) showing the TX power, rain fade, C/N and C/(N+I) for the forward direction for each of the links
- Table view (middle left) showing the TX power, rain fade, C/N and C/(N+I) for the return direction for each of the links
- Terrain path profile (bottom left) for the worst interfering path one of the fixed links
Select “Propagation | Terrestrial Fixed” and try the following the changes:
-
Analyse the median wanted signal level by changing the Rec.P.530 percentage time to 50% and the Rec.P.452 percentage time to 0.01% as in the figures below.
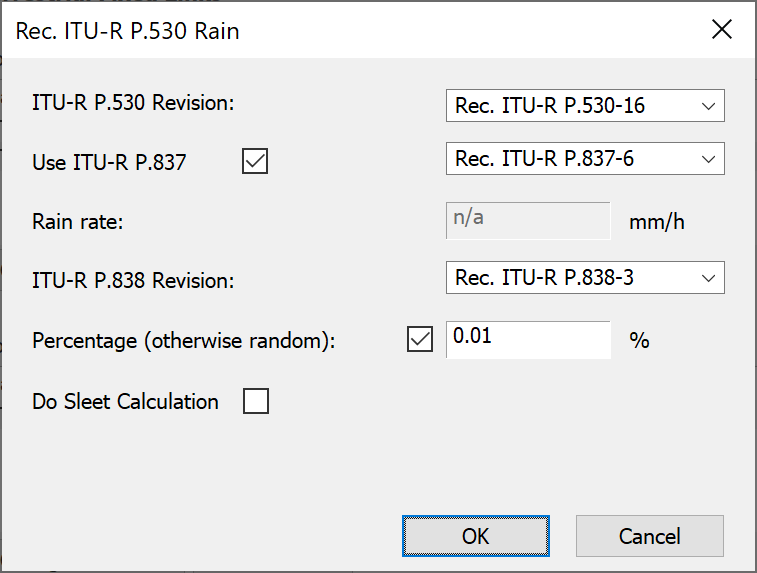
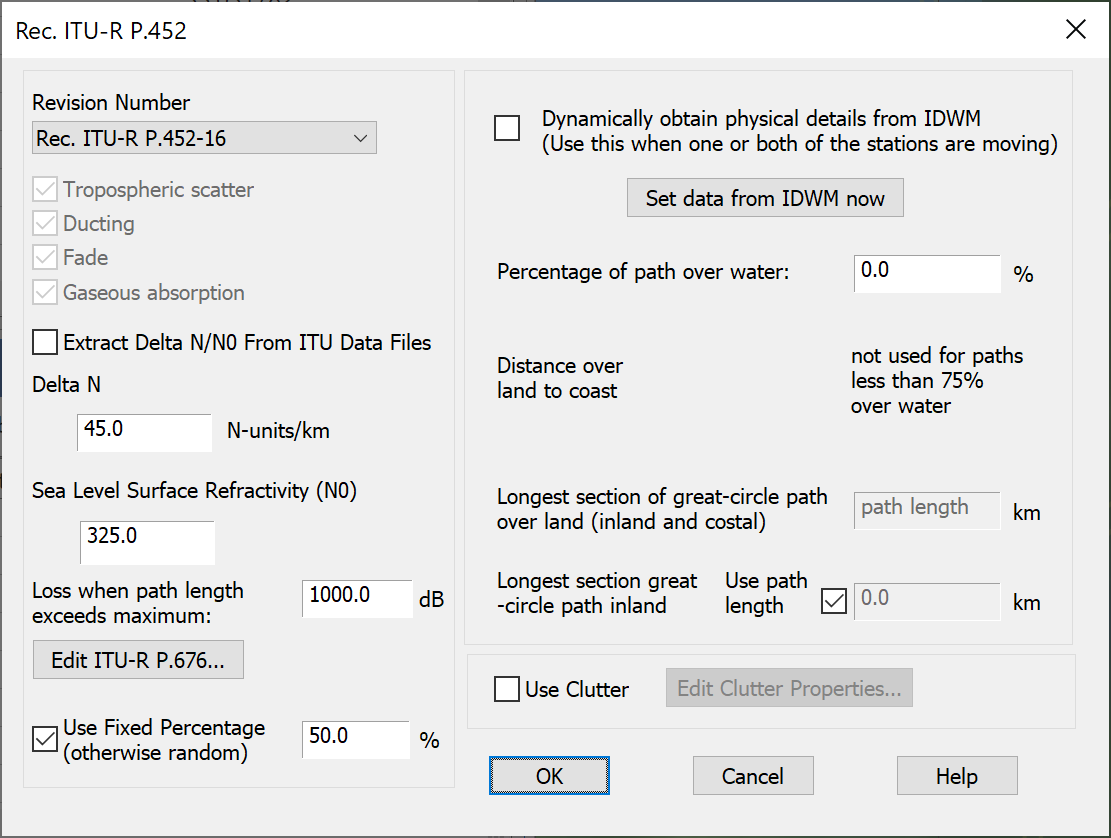
Propagation Model Changes -
Analyse the changes in ITU-R Rec.P.530-16 over P.530-11 by changing the version number – it should be quite significant! This is because the rain rates in the revised version of Rec.P.837 for these locations are much higher.
GSO to GSO Satellite
This section contains the following examples:
GSO downlink with rain loss
| Action: | Run simulation |
| Modules used: | None |
| Terrain regions: | None |
| Frequency band: | Ku |
| Station types: | GSO Satellite, Earth Stations |
| Propagation models: | Free space, ITU-R Rec.P.618, ITU-R Rec.P.676 |
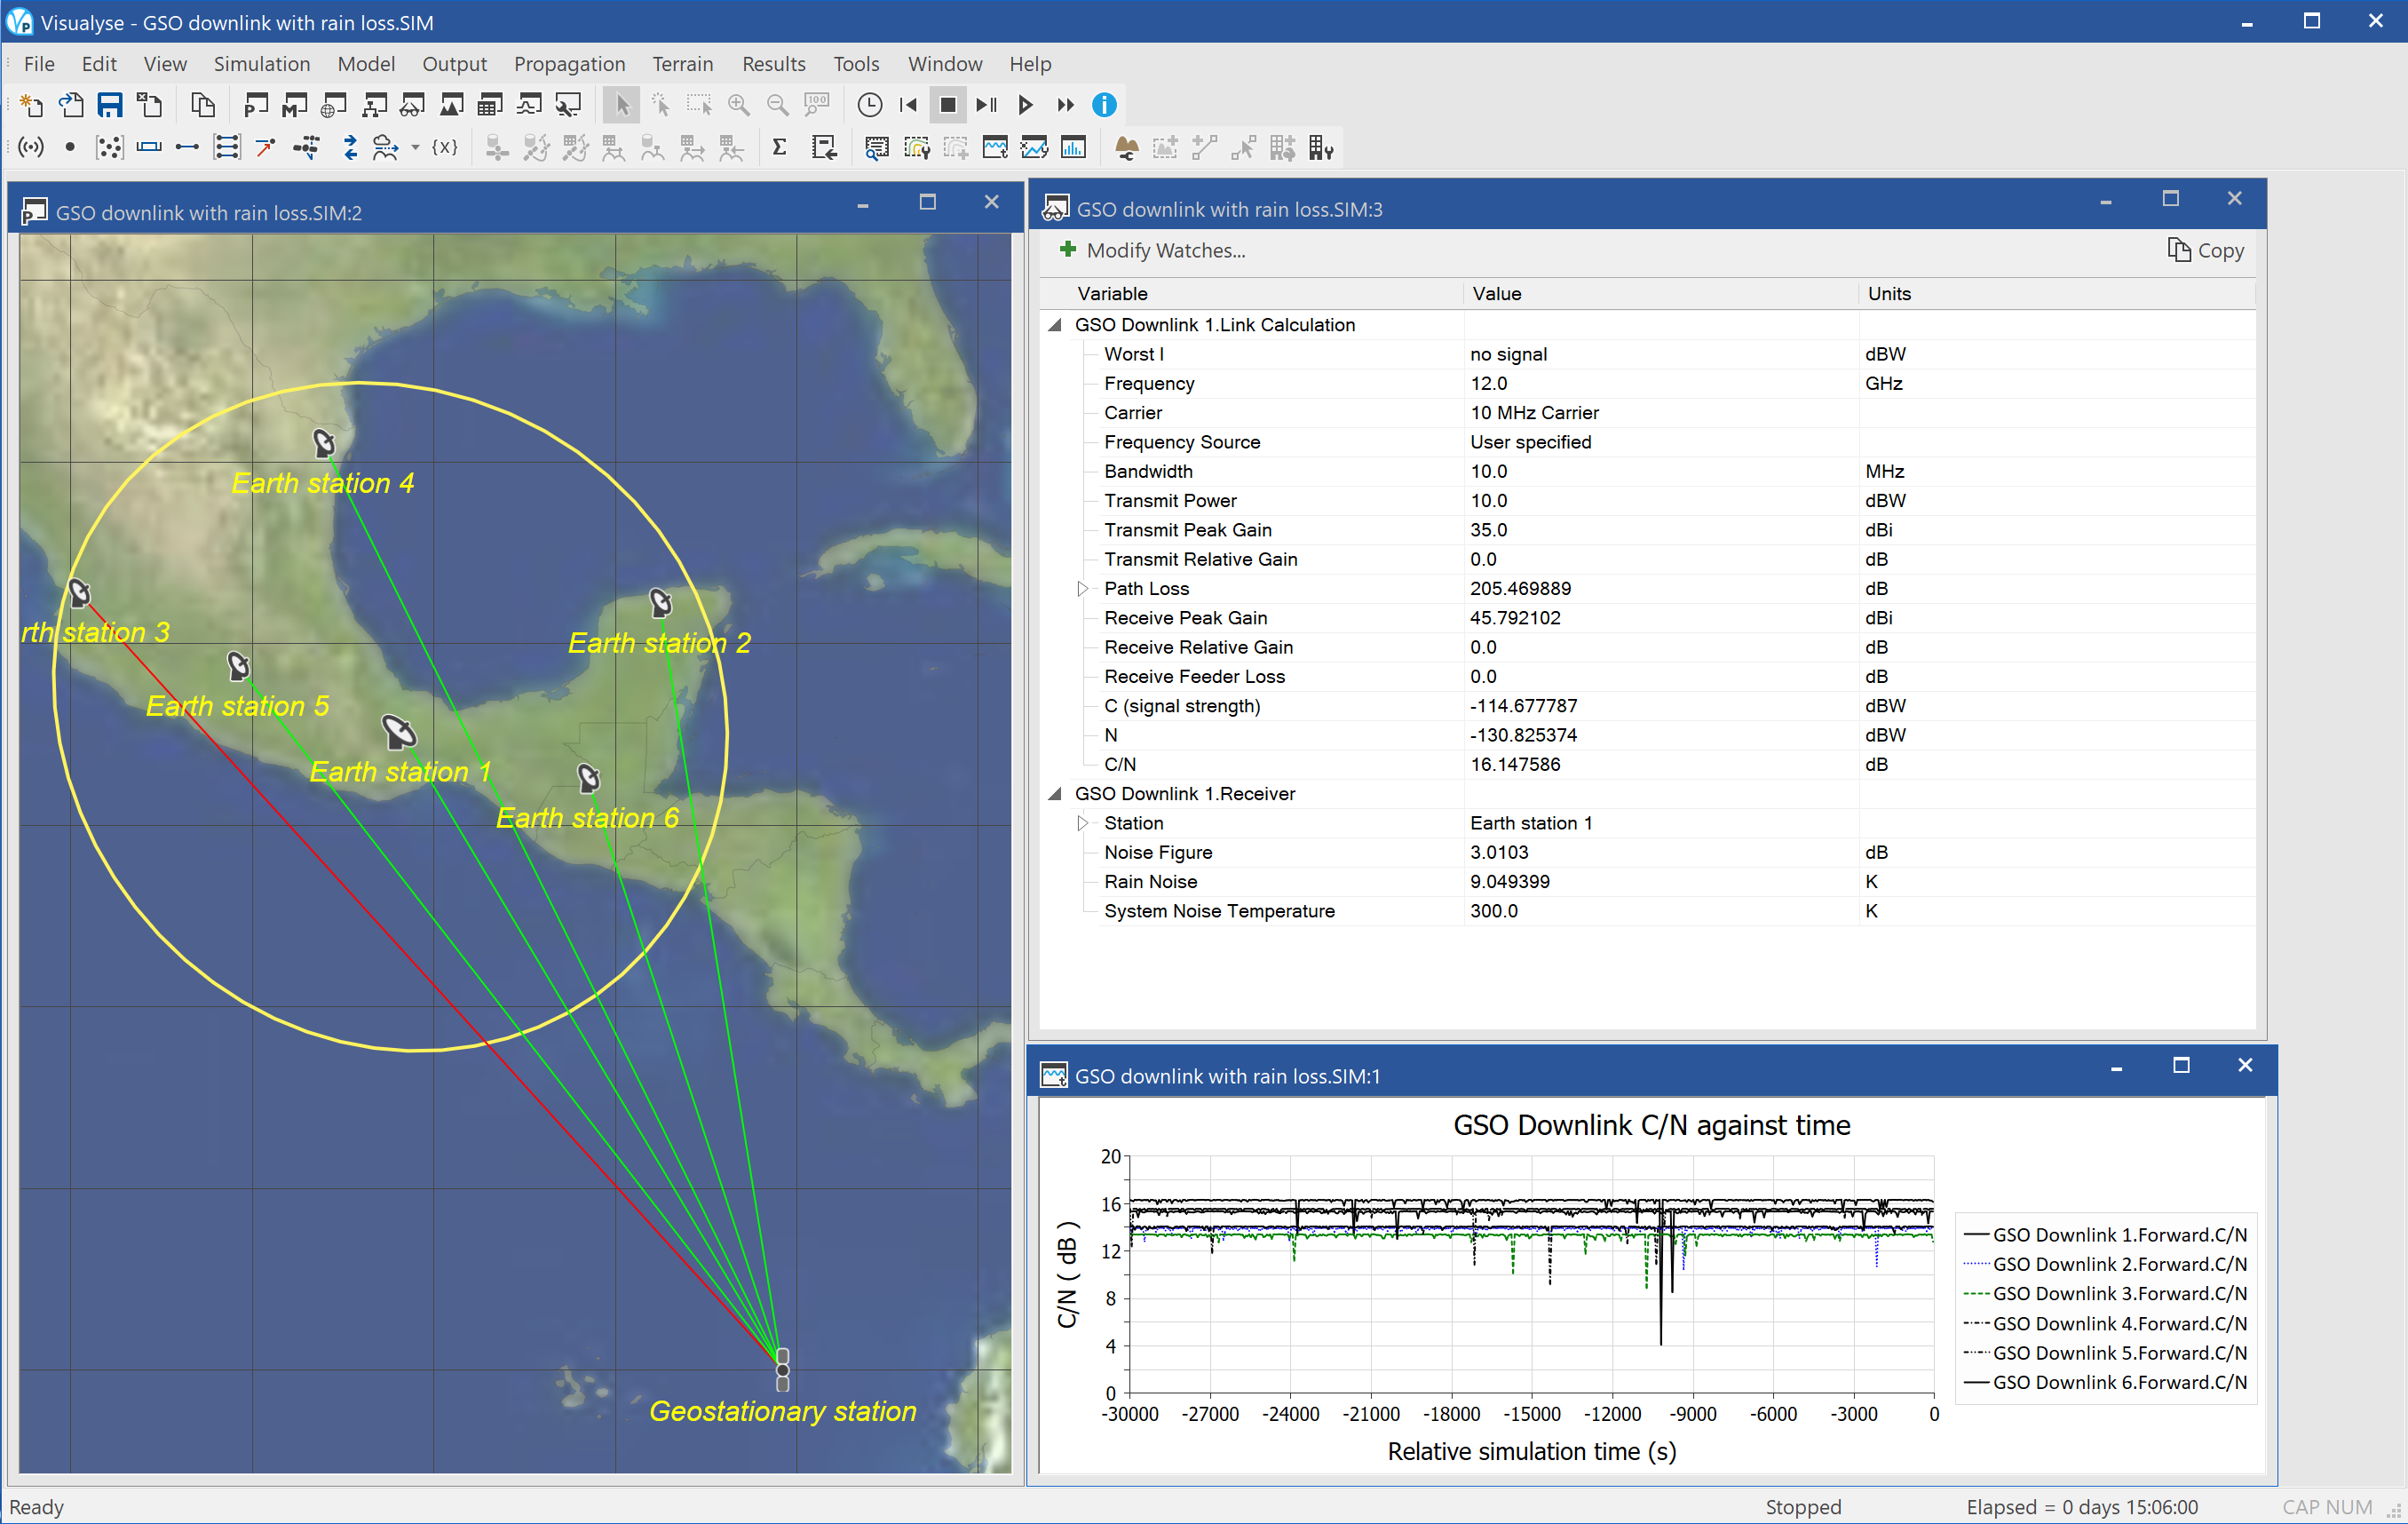
This example that shows a GSO satellite with a single transmit spot beam. In its coverage are 6 receive earth stations, and links have been set up to model atmospheric effects such as gaseous absorption and rain fade. This uses the ITU-R's relevant propagation models, Rec. 676 and Rec. 618.
There are three windows:
- Map in Plate Carrée projection (left) showing the satellite, earth stations, beam footprint and links. The links go red when a rain fade degrades the received signal.
- Watch window (top right) showing details of one of the downlinks including components of the propagation loss due to absorption and fading.
- Quick graph (bottom right) showing how the C/N of each link is varying with time.
The watch window also shows the calculation of the receive noise temperature on one of the links and shows how it increases due to rain noise – the double whammy effect of rain in lowering the wanted signal while increasing the noise.
This simulation could be extended to allow detailed analysis of GSO links or GSO-GSO interference subject to rain fading.
GSO to GSO MSS availability
| Action: | After reading text below, select user defined polarisation advantage on the Interference Paths dialog – Advanced tab |
| Modules used: | none |
| Terrain regions: | None |
| Frequency band: | L |
| Station types: | GSO Satellite, Maritime |
| Propagation models: | Free space, ITU-R Rec.P.676 |
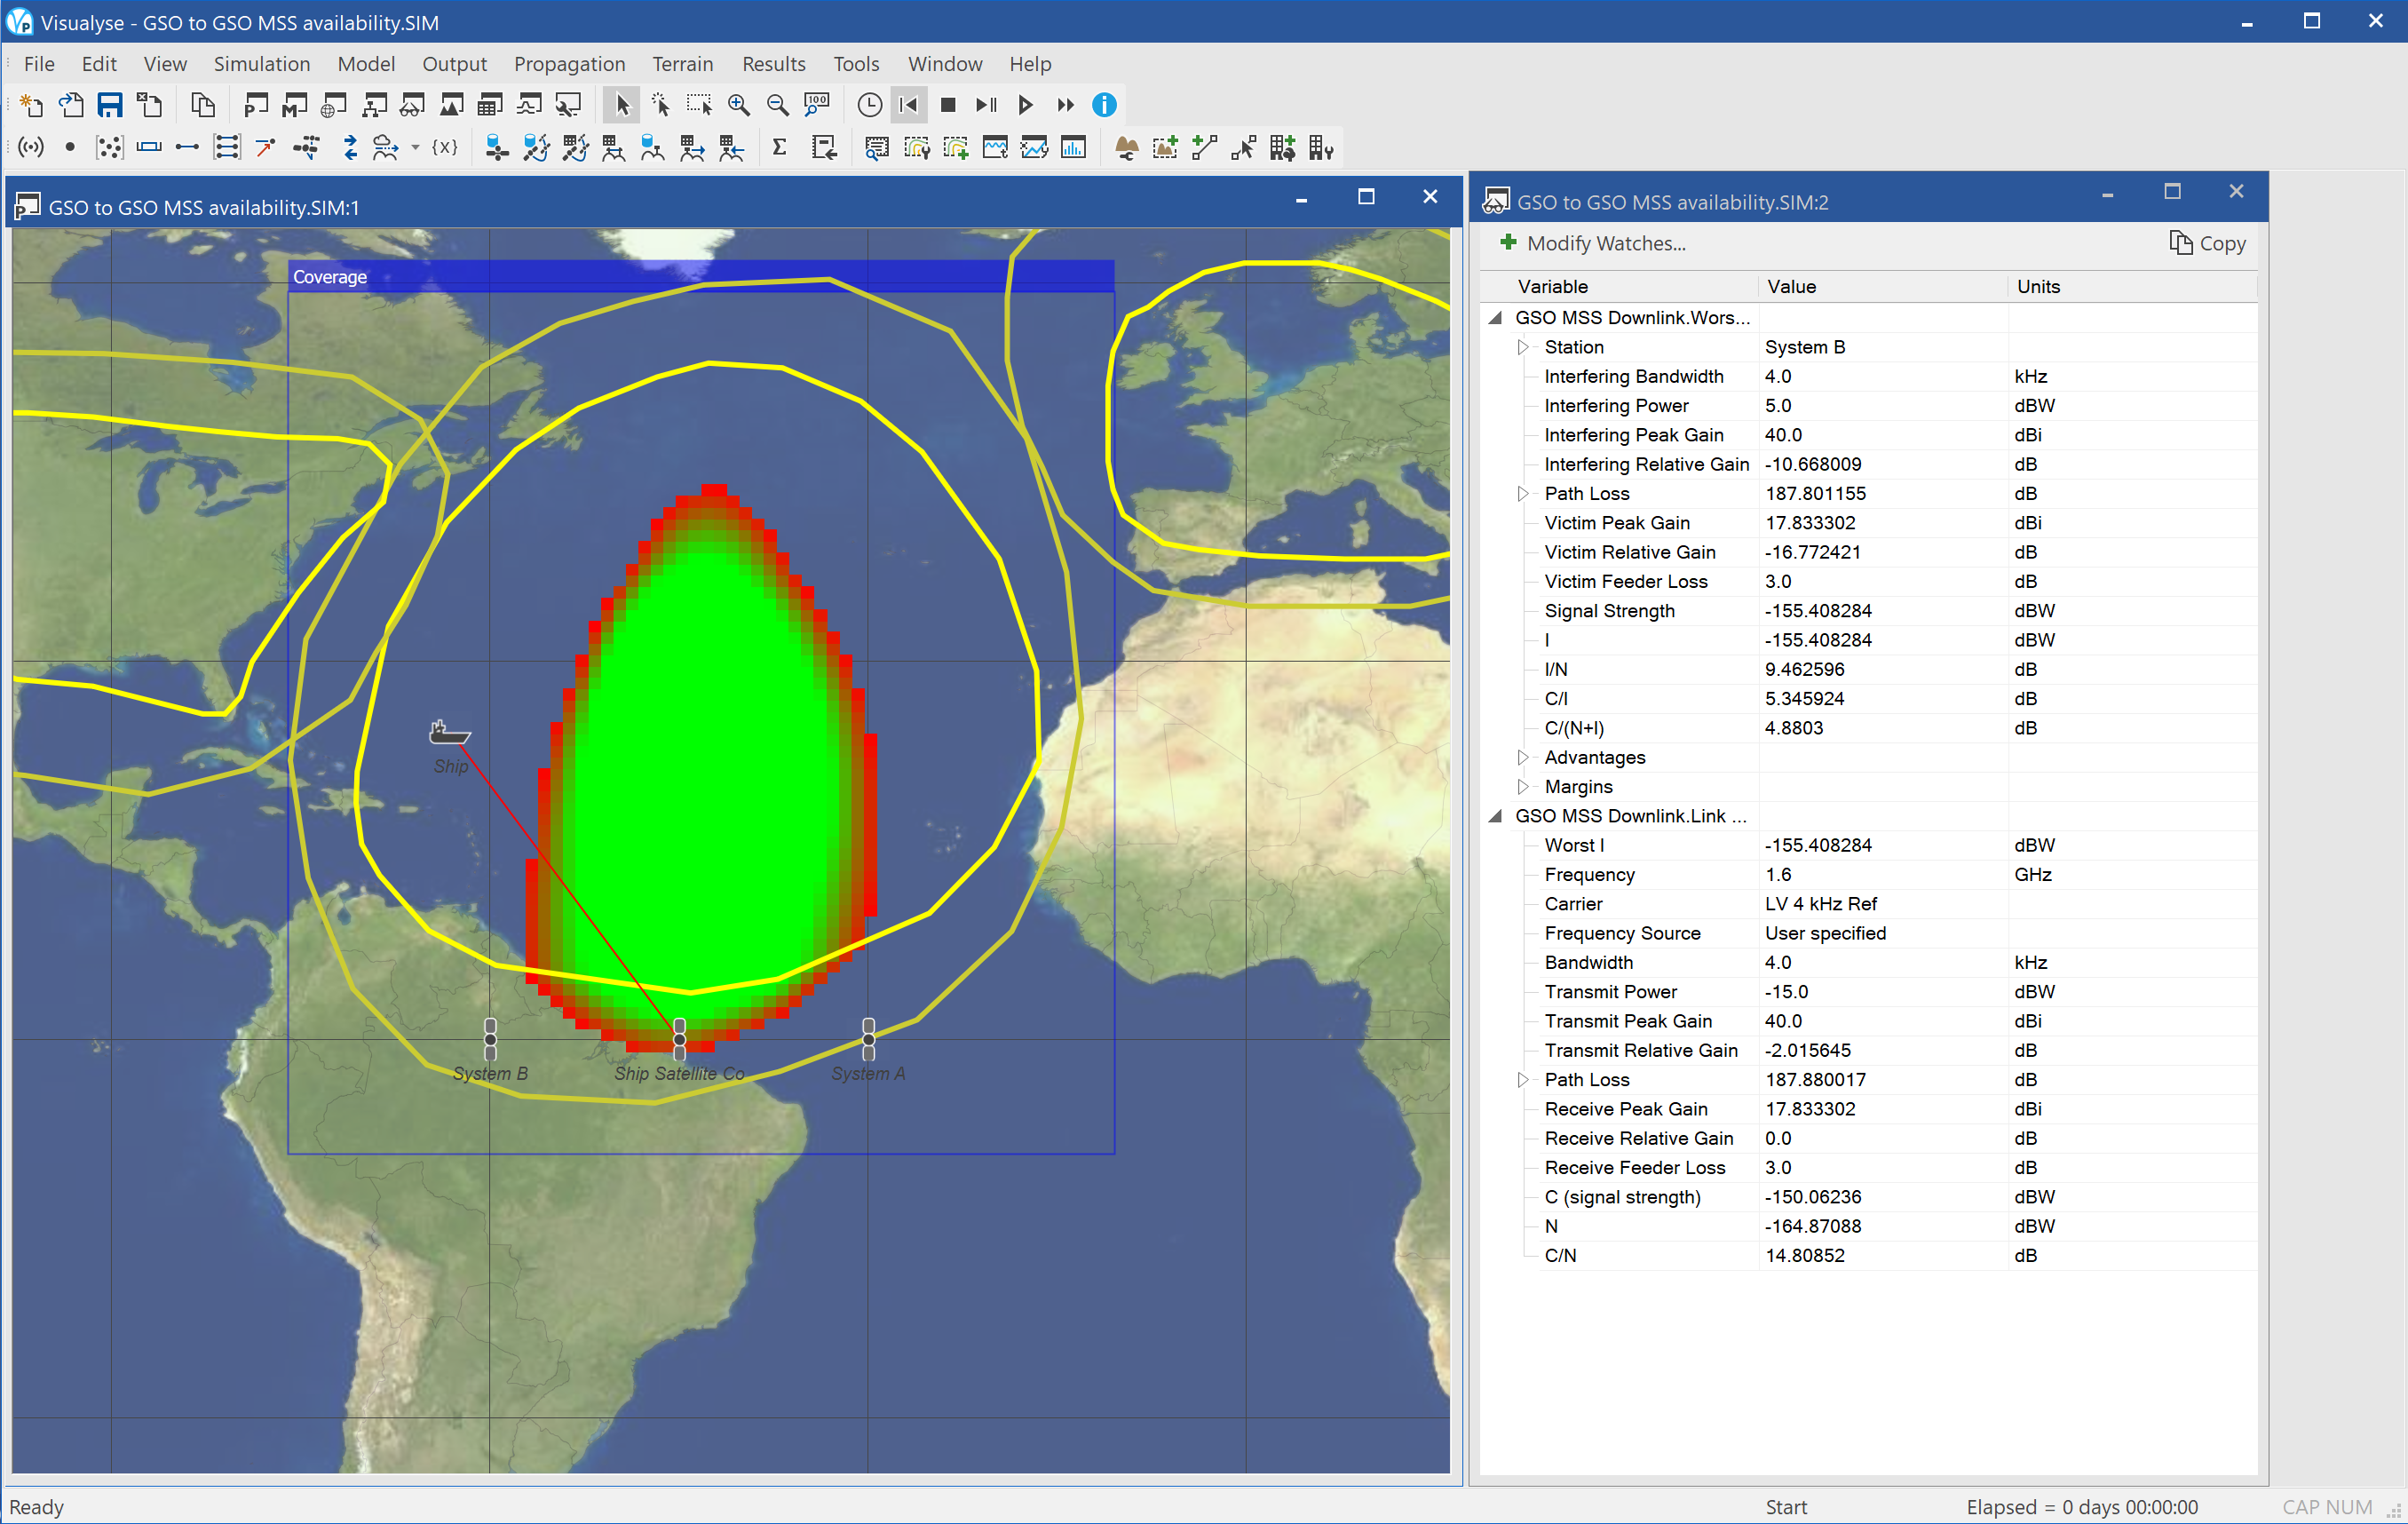
This example shows an example of how Visualyse Professional can support the coordination of GSO satellite networks. In this scenario there are two mobile satellite networks covering Europe and the US respectively. These are part of integrated mobile/terrestrial networks, and hence have little interest in maritime regions. A third operator wishes to take advantage of this but must coordinate with the other two networks.
The coordination agreement is likely to take the form of a transmit EIRP 20 dB below that of the regional networks and with at least 6 dB antenna discrimination from land. The question is whether these tight constraints leave sufficient area over which service can be provided to make operation profitable.
The simulation is configured with two windows open:
- Map in Plate Carrée projection (left) showing the satellites, gain patterns, ship used as reference, and Area Analysis of the C/N
- Watch window showing the wanted and interfering link budgets.
The green area in the Visualyse Professional Area Analysis shows where the C/(N+I) is above 10 dB and hence service should be possible. The red area is where a marginal reduced service would be available. It can be seen that it is limited in area.
One possibility to increase this area is to agree during coordination to use alternative polarisations – even though it is assumed this would only reduce unwanted signals by about 3 dB.
If you:
- Select “Interference Paths” from the icon / toolbar
- Double click on “From other satellites”
- Select “Advanced”
- Under “Polarisation Advantage” select “User Defined”
- Click “Ok” then “Close”
The Area Analysis should then update with a significantly large area coloured in green as in the figure below.
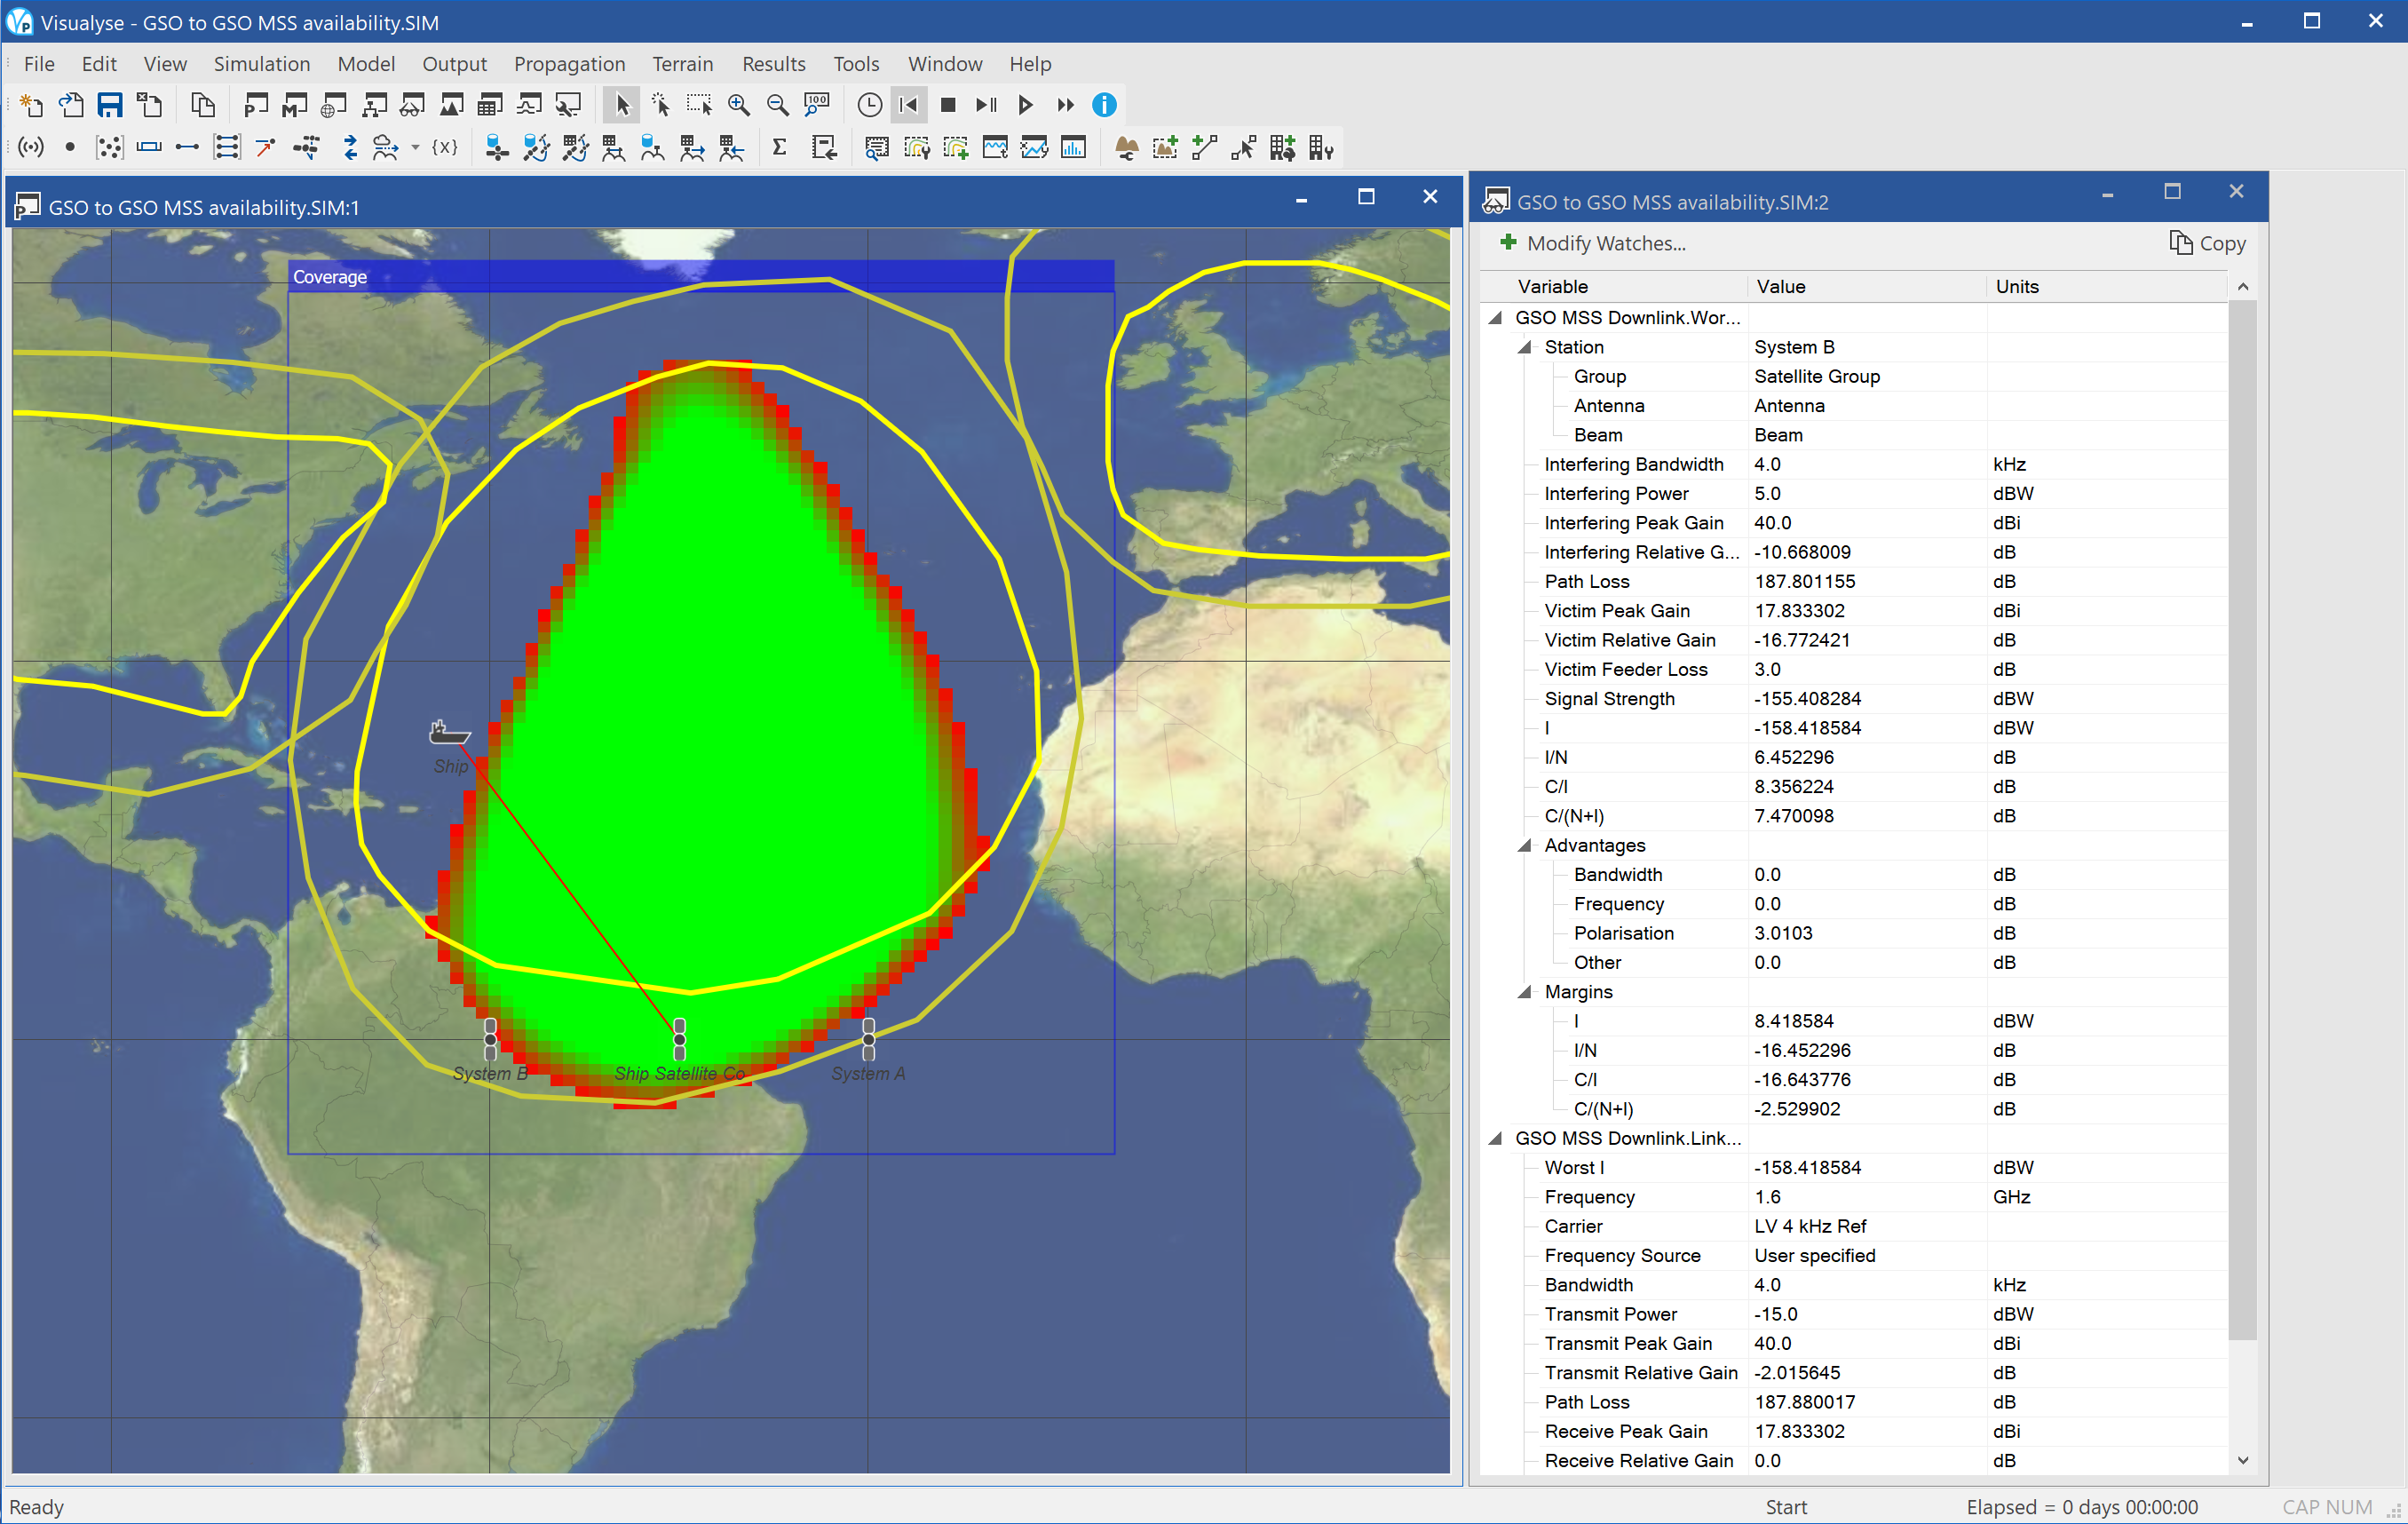
This could be sufficiently large an area to justify deployment if combined with services on other frequencies that can cover the ocean regions not covered by this network.
GSO transfer orbit TTC with interference from populated GSO arc
| Action: | Run simulation |
| Modules used: | None |
| Terrain regions: | None |
| Frequency band: | Ku |
| Station types: | GSO Satellite, Non-GSO Satellite, Earth Stations |
| Propagation models: | Free space, ITU-R Rec.P.676 |
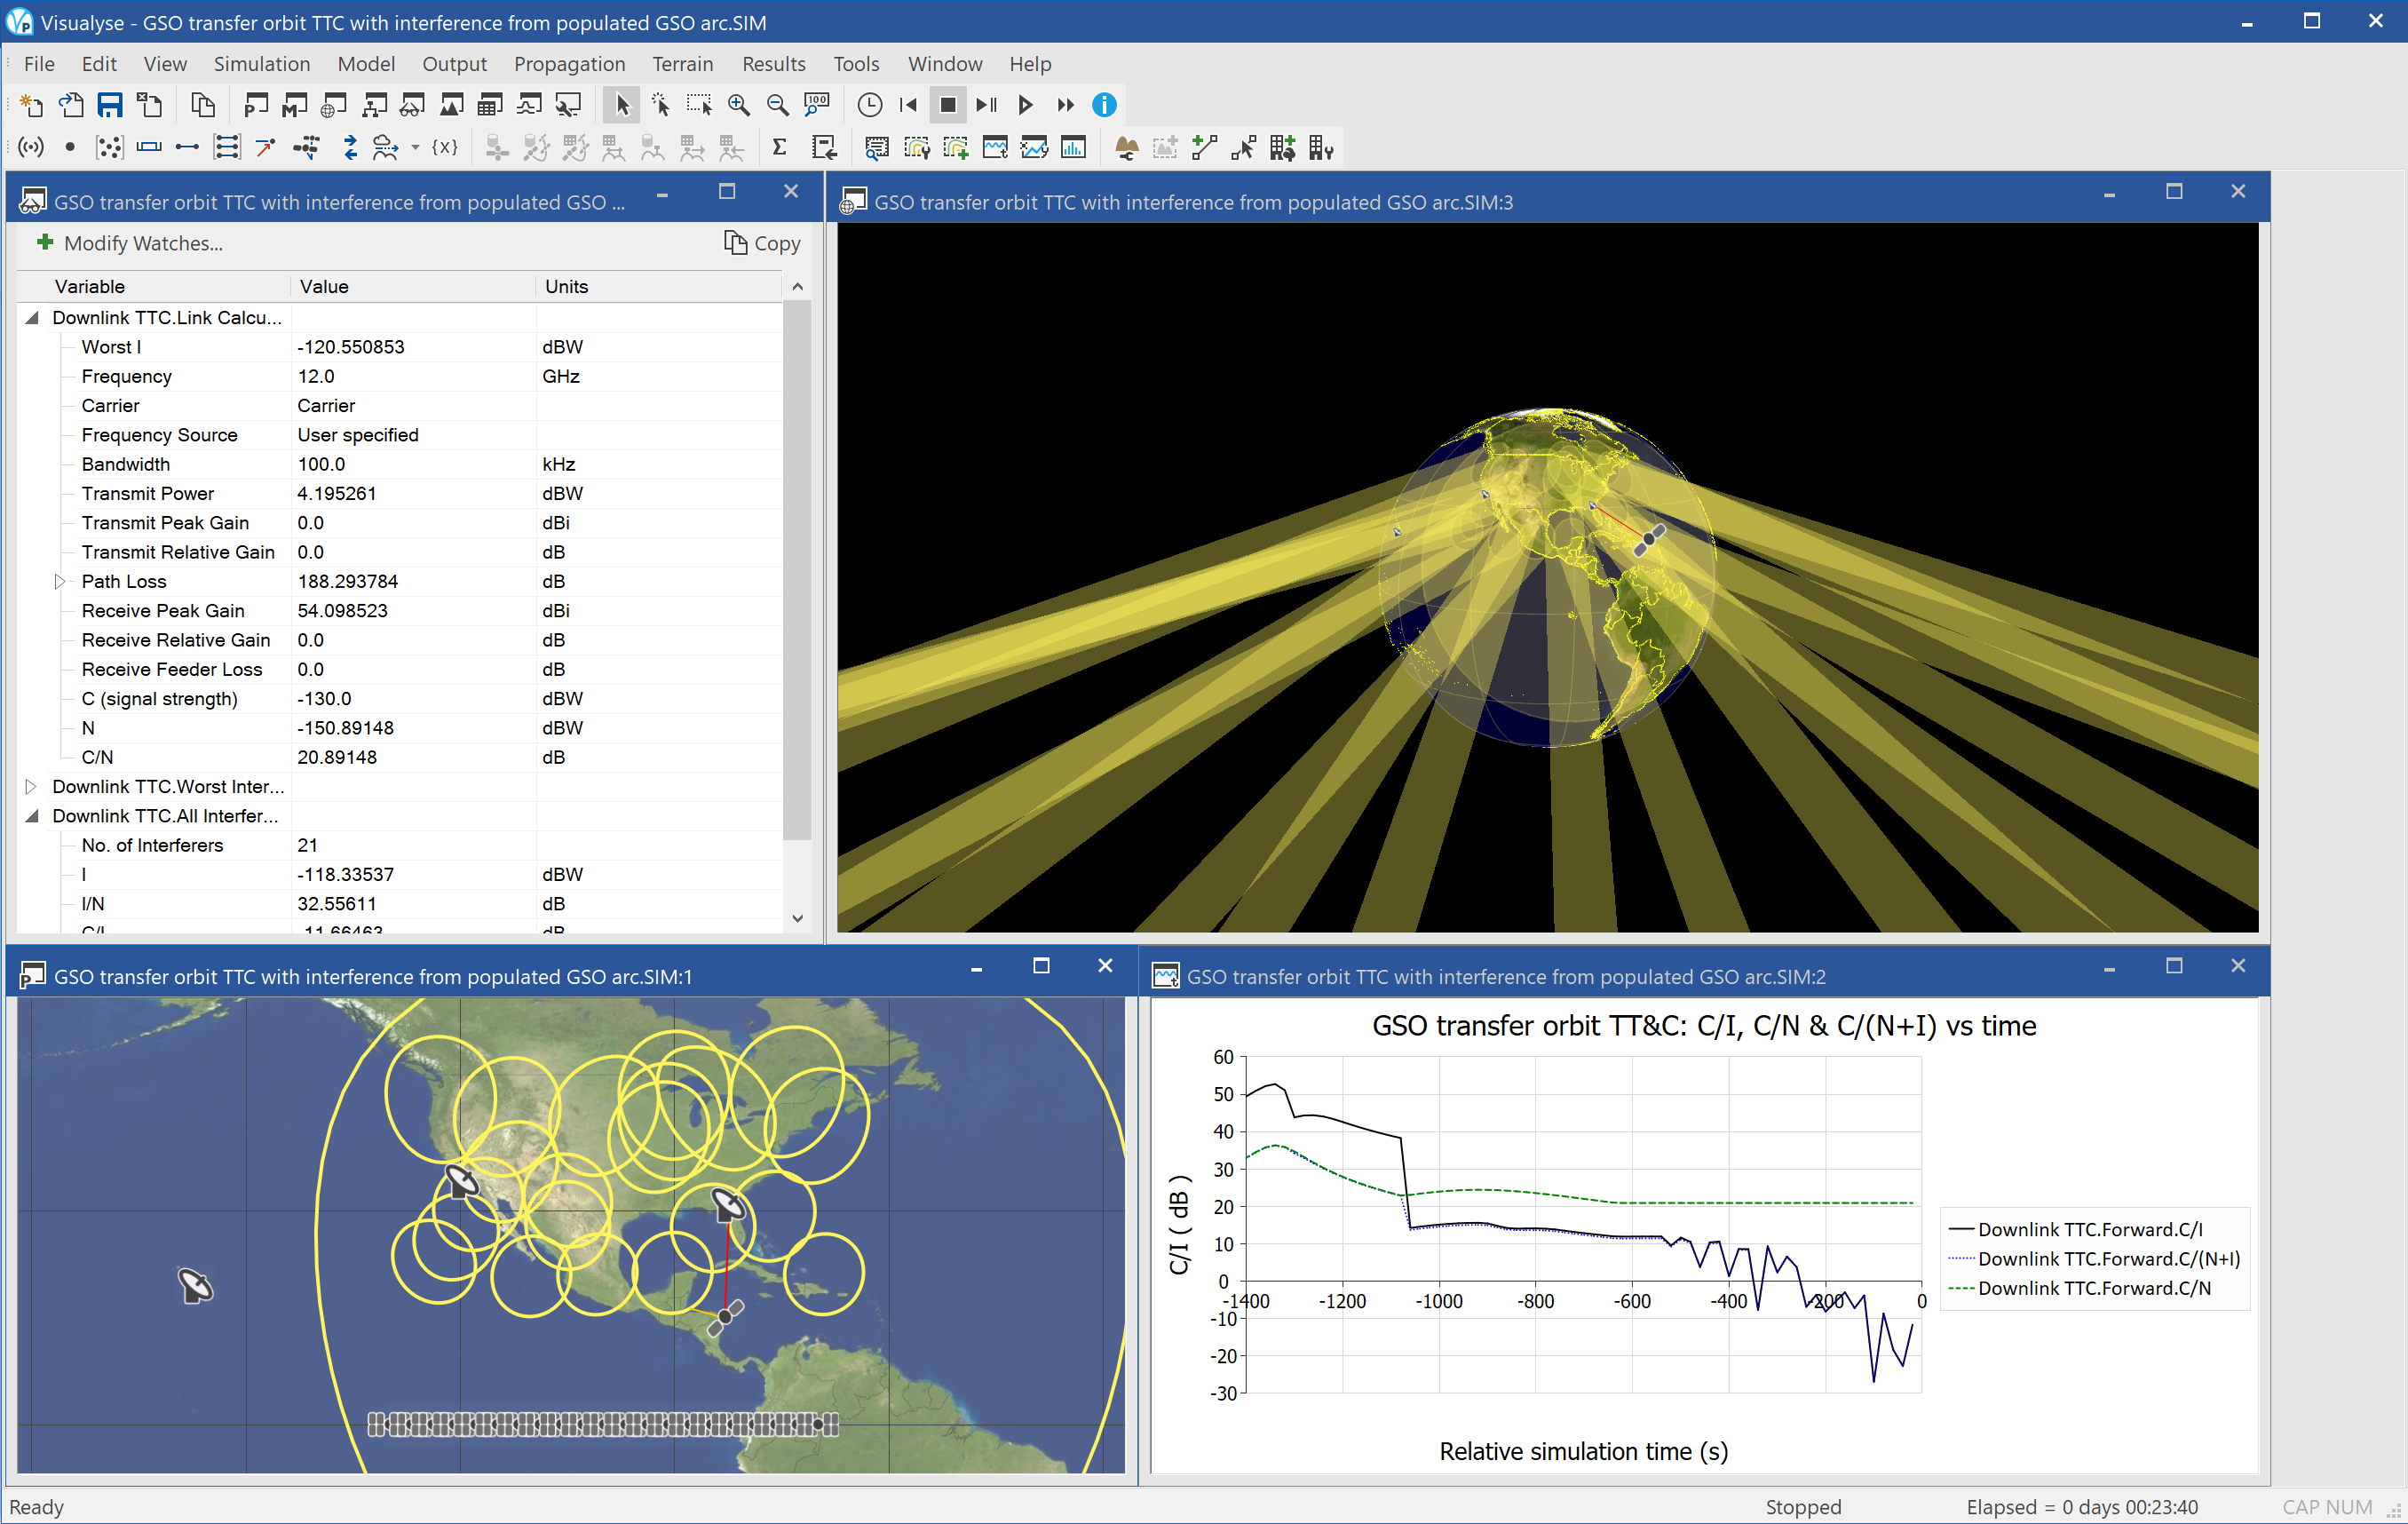
This example shows a satellite being transferred from low earth orbit into GSO. During this period, it is transmitting TT&C to ground control stations. As the orbit height increases it uses power control to maintain a constant received signal. To maintain constant communication, it hands over between ground control stations.
While in transit it crosses a location with a large number of GSO beams which are transmitting on the same frequency. This causes the downlink to suffer interference as the TT&C stations point towards the GSO satellites.
The following windows are open:
- 3D view (top right) showing the beams from the GSO satellites, the TT&C control stations and the satellite in transfer orbit. As the satellite move the hand overs between ground control stations can be seen. This link goes red when subject to interference from the GSO satellites.
- Plate Carrée map view (bottom left) showing the same beams, satellites and earth stations as for the 3D View, plus the GSO satellites.
- Quick graph (bottom right) showing how the C/I, C/N and C/(N+I) varies against time. When in the field of view of the GSO satellites the C/(N+I) can be seen to be dominated by the C/I.
- Watch window (top left) showing the link budget for the wanted downlink. This shows how the transmit power increases to compensate for the increased path loss as the satellite ascends. When the maximum power of 10 dBW has been reached the received signal starts to decrease gradually.
LUX 28,2 coverage
| Action: | None |
| Modules used: | None |
| Terrain regions: | None |
| Frequency band: | Ku |
| Station types: | GSO Satellite, Earth Stations |
| Propagation models: | Free space, ITU-R Rec.P.676 |
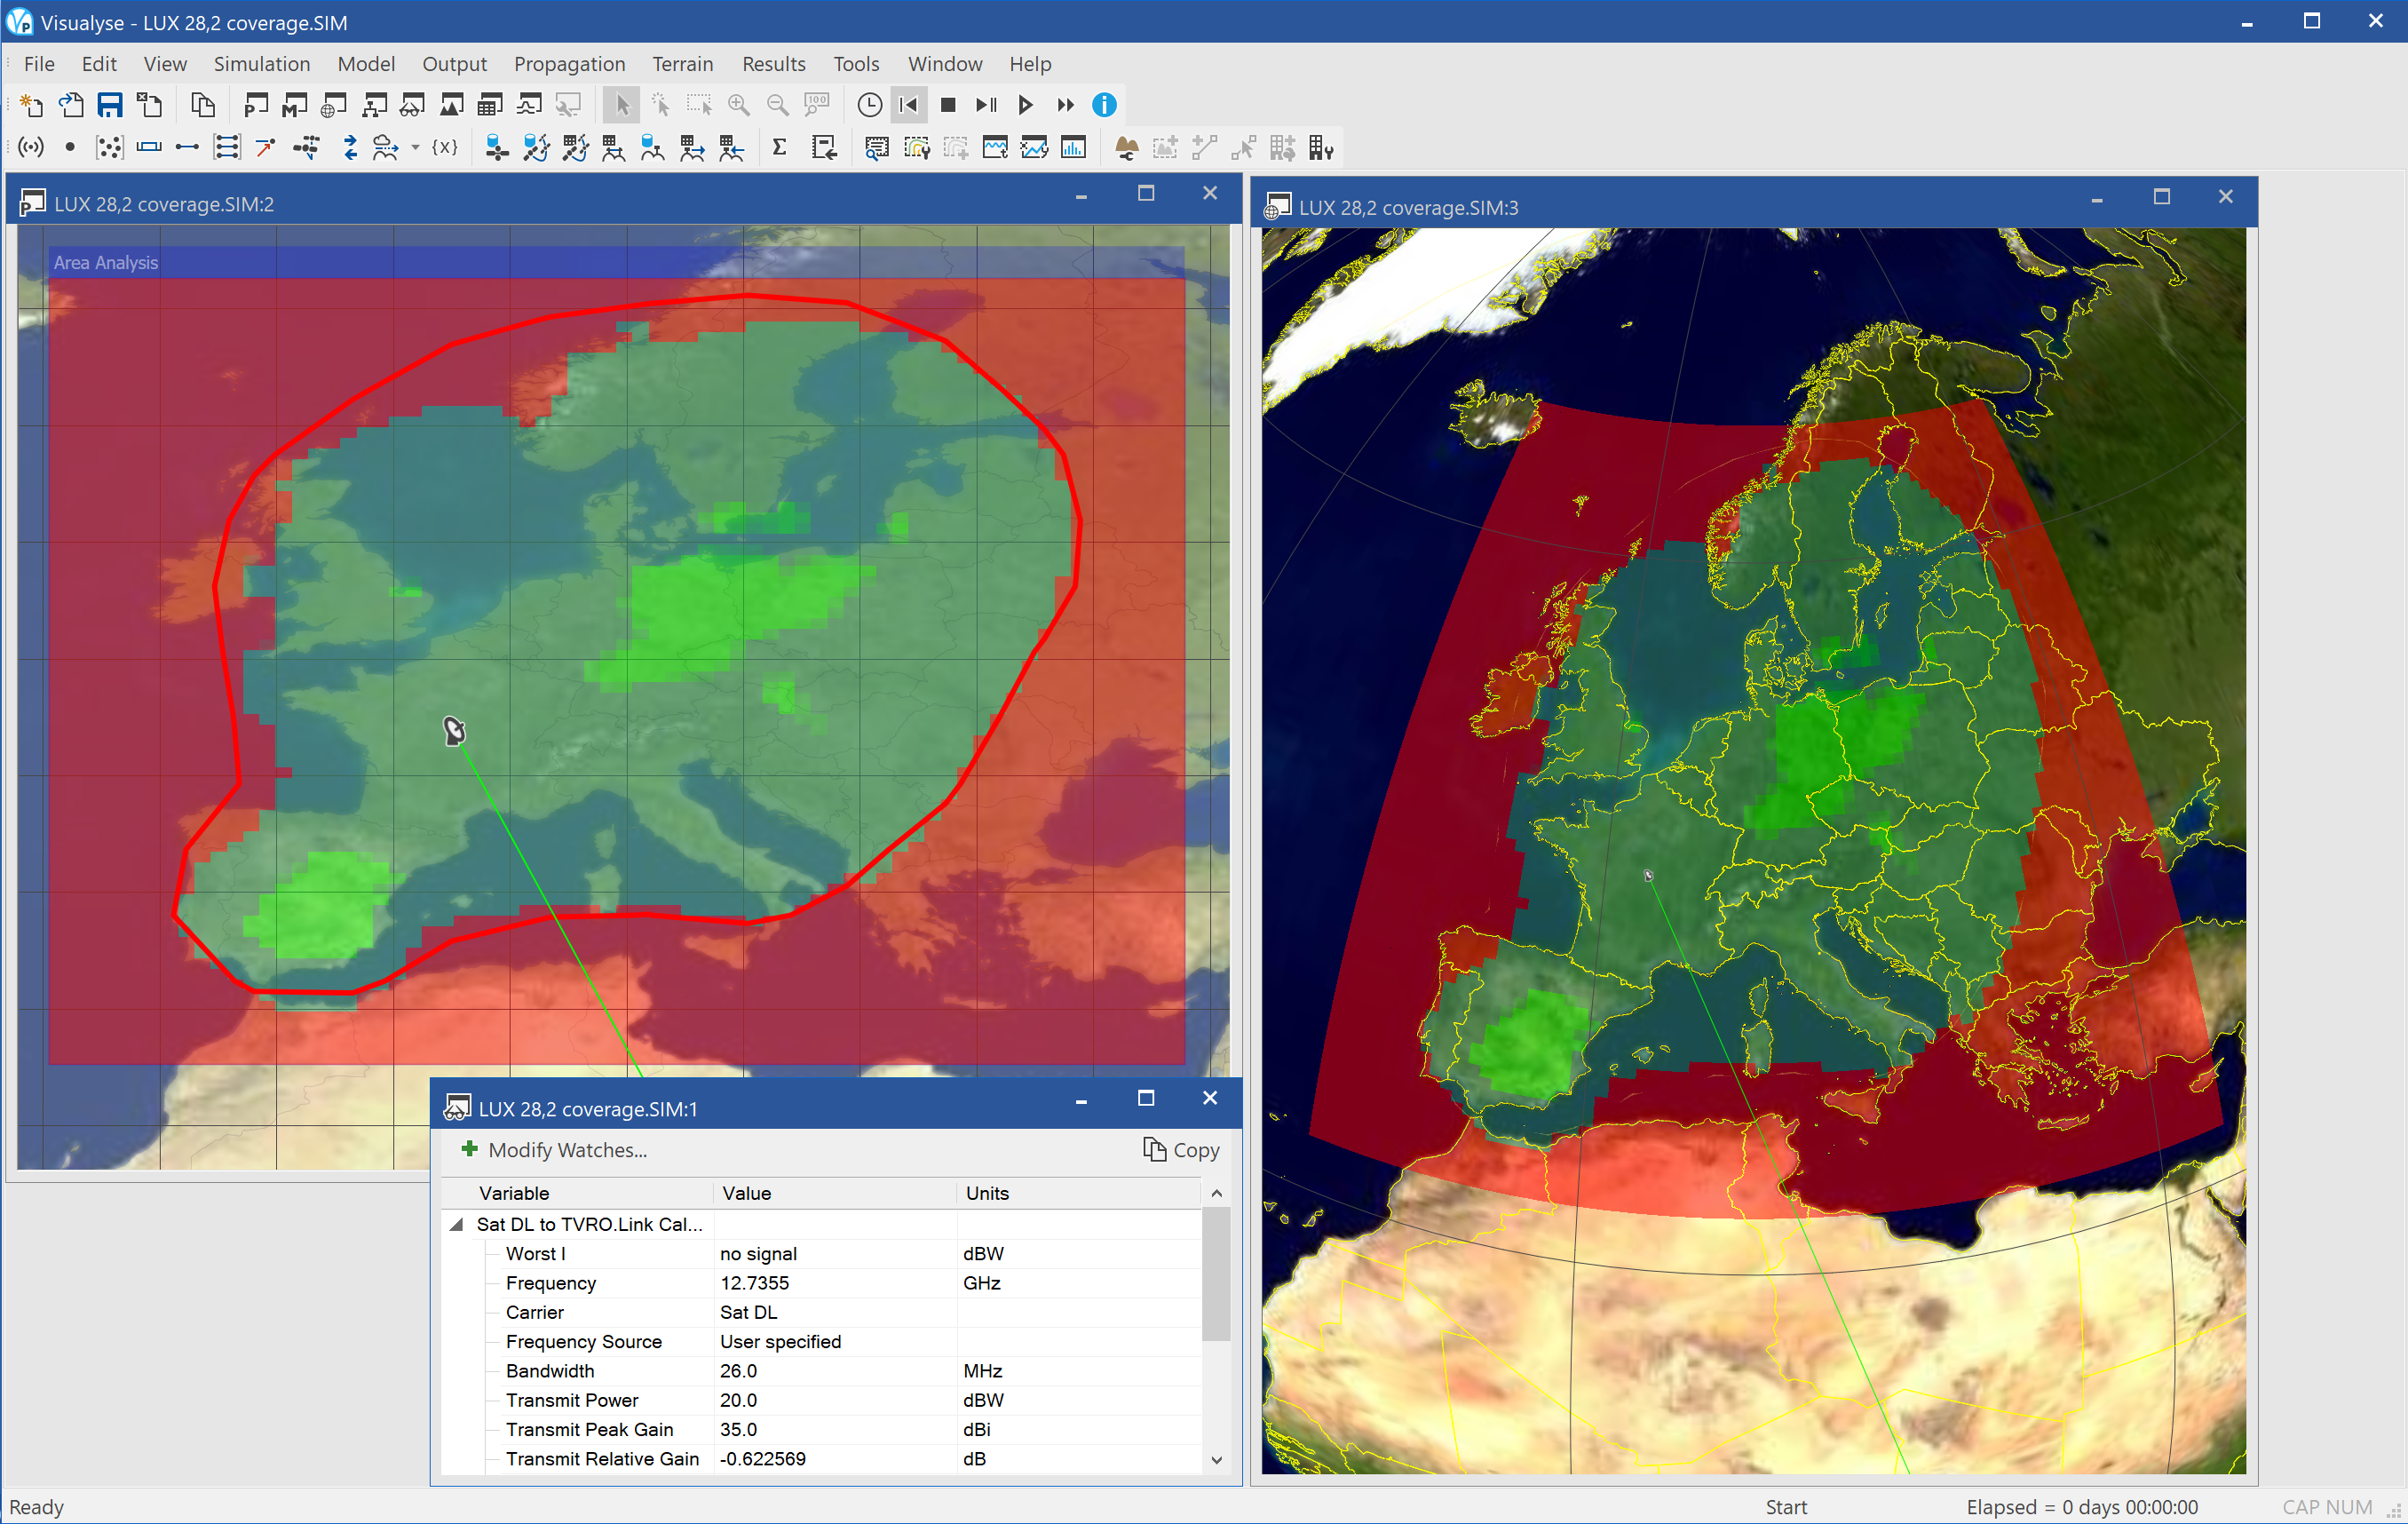
This example shows graphically the coverage of a GSO satellite network over Europe.
The satellite location and gain pattern are those for the LUX-28.2 satellite extracted from the ITU’s database via Visualyse Professional’s interface to SRS. The transmit power, bandwidth and frequency were also taken from SRS read using the SpaceCap tool.
The link was set up to a reference earth station representing a TVRO service. The link was configured using an earth-space propagation model that included ITU-R Rec.676 for gaseous absorption and ITU-R Rec.618 for rain, using a percentage of time of 0.1%. Hence the link budget is calculated for an availability of 99.9% of time.
The location of the test point was then varied using Visualyse Professional’s Area Analysis tool. Locations were then coloured depending upon whether the threshold of C/N > 10 dB for 99.9 % of time could be met as follows:
Bright green: could be met with a 60 cm dish
Dark green: could be met with an 80 cm dish
Red: would require receive antenna greater than 80 cm.
The simulation is configured with three views open:
- Plate Carrée map view (top left) showing the area analysis, satellite footprint, reference test station and link;
- 3D view (top right), also showing the area analysis, satellite footprint, reference test station and link;
- Watch window (bottom left) showing the link budget from the GSO satellite to the reference Earth Station
This simulation can be extended in a number of ways – for example including interference from adjacent satellites, the impact of station keeping or pointing errors etc.
Lux Arabsat Coordination
| Action: | None |
| Modules used: | None |
| Terrain regions: | None |
| Frequency band: | Ku |
| Station types: | GSO Satellite, Earth Stations |
| Propagation models: | Free space, ITU-R Rec.P.676 |
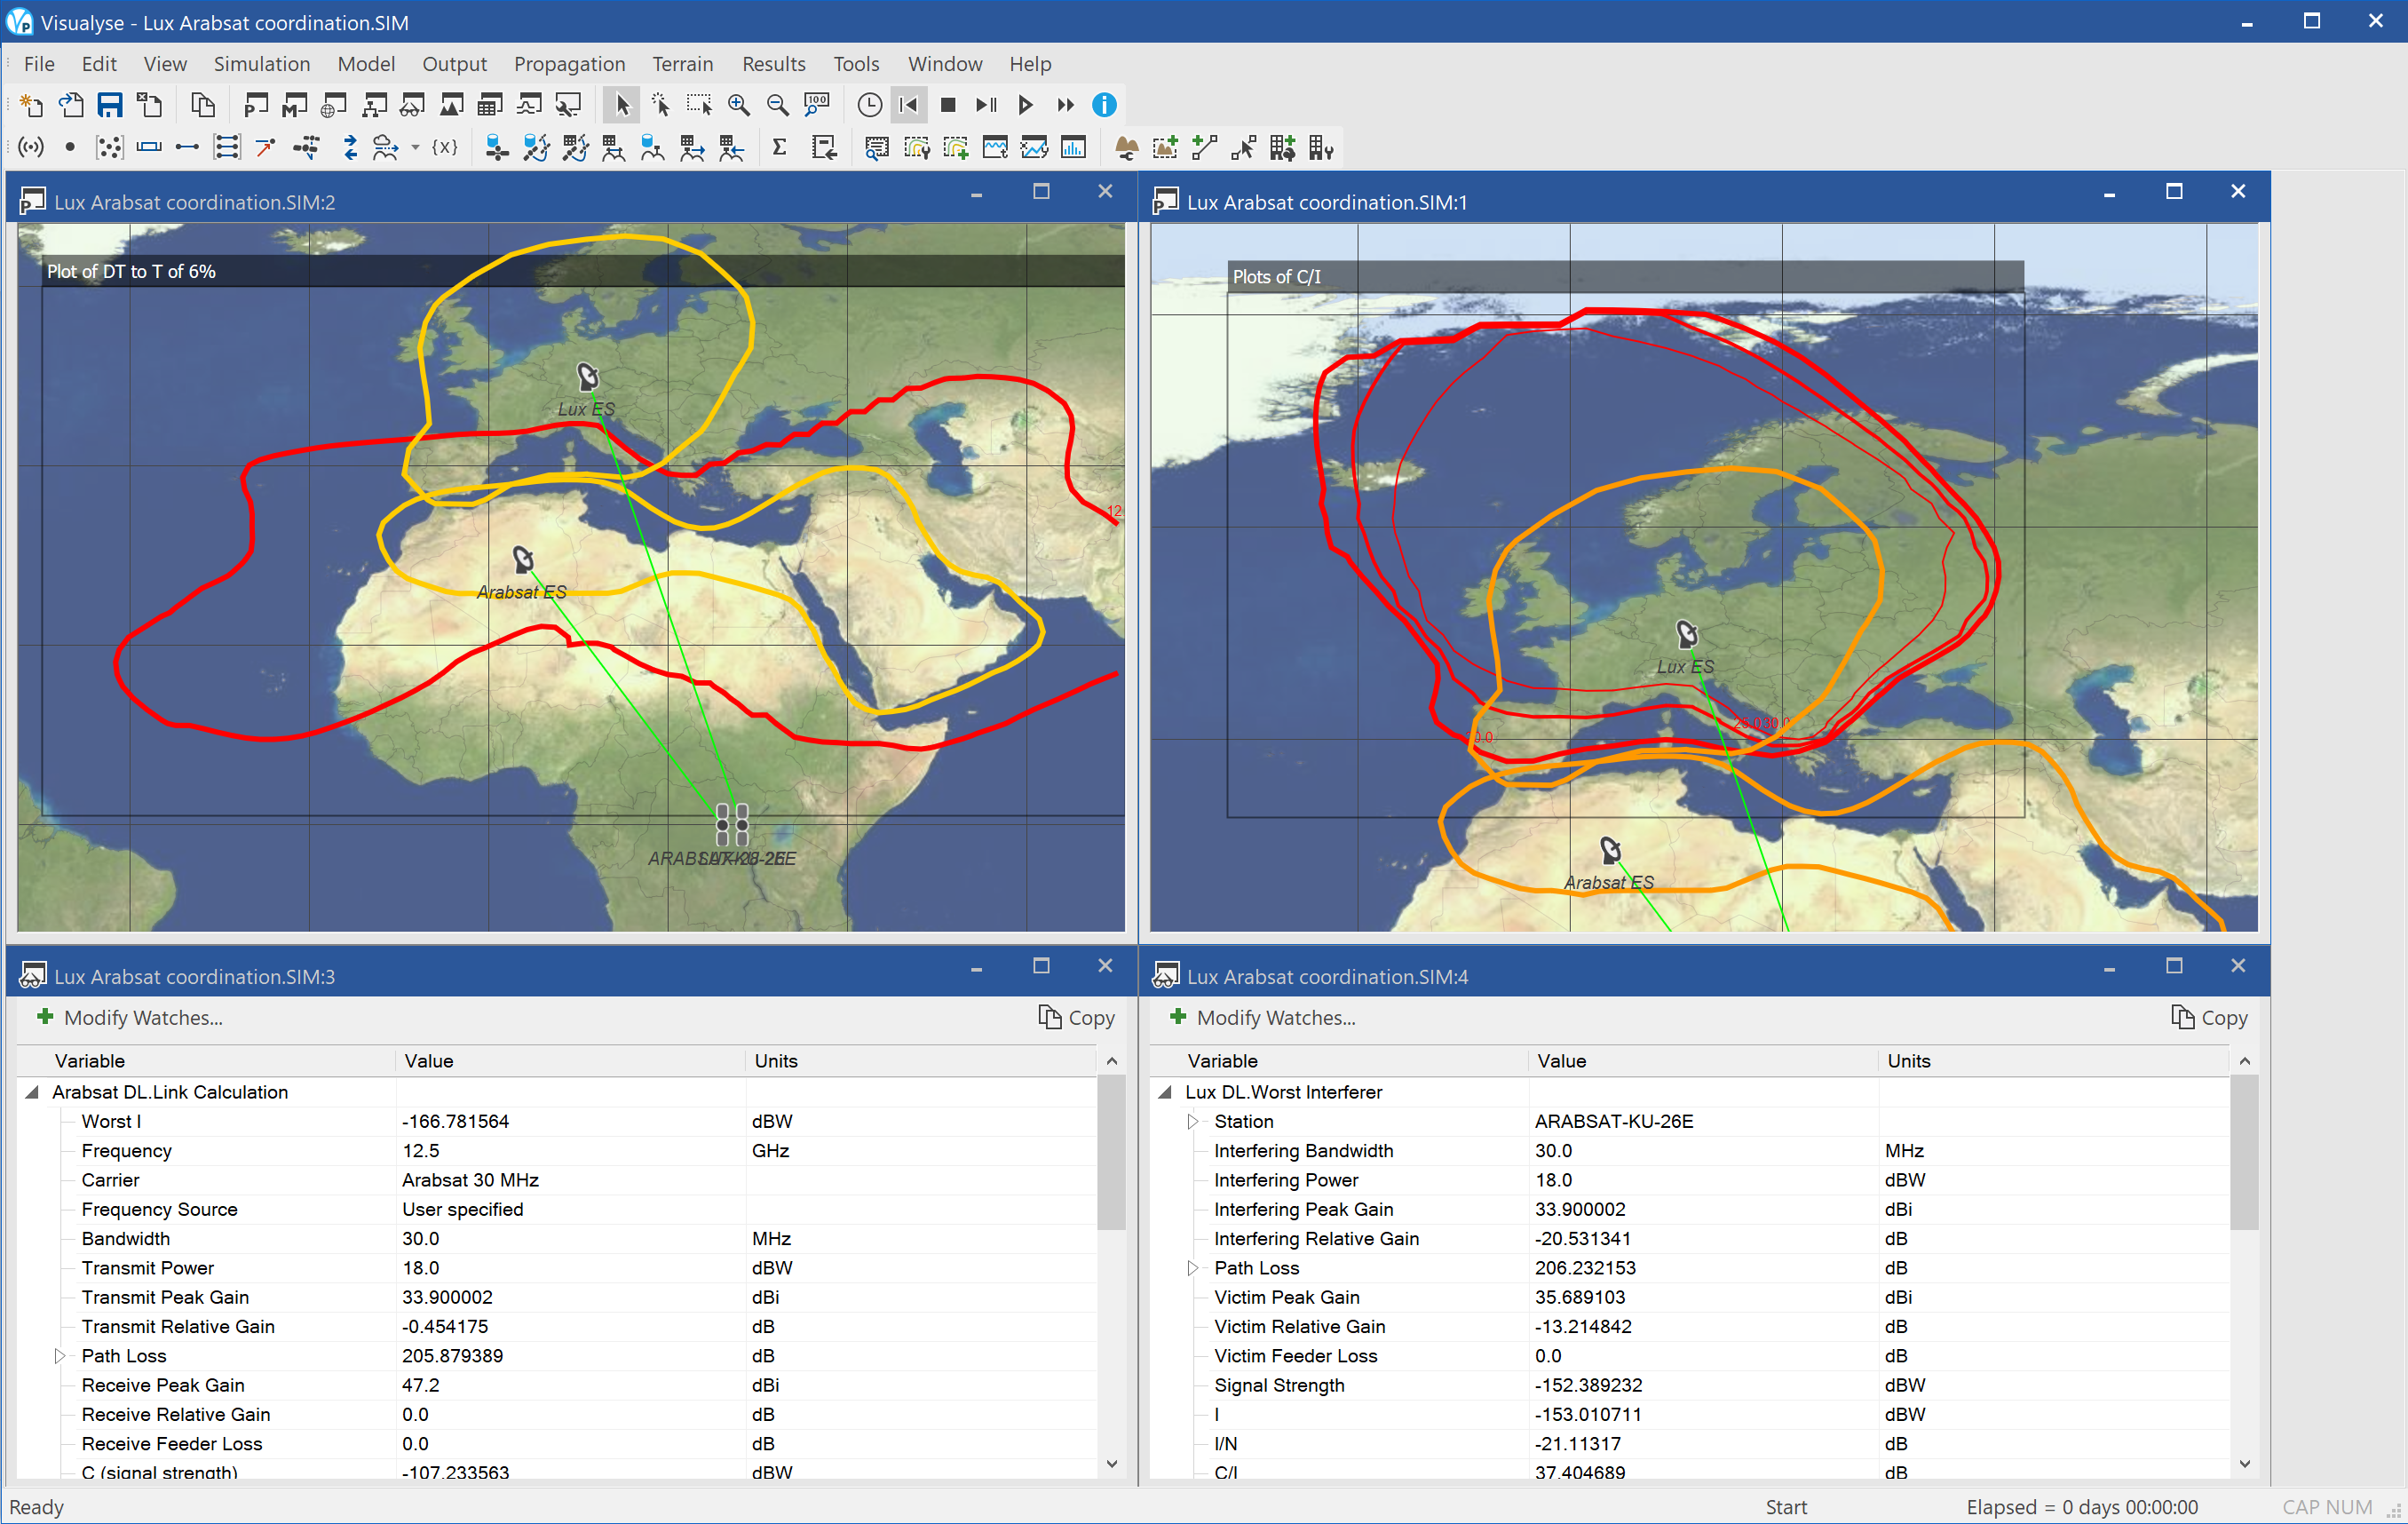
This example shows Visualyse Professional undertaking the sort of calculations required for detailed coordination between two GSO satellite networks.
Using Visualyse Professional’s interface to the ITU’s SRS database combined with parameters extracted using SpaceCap, the following two networks were configured:
| Network | Lux-28 2E | Arabsat-KU-26E |
| Longitude | 28.2E | 26E |
| Beam | T1 Transmit | KDF Transmit |
| Peak gain (dBi) | 35.0 | 33.9 |
| Transmit power (dBW) | 20.0 | 18.0 |
| Bandwidth (MHz) | 26.0 | 30.0 |
| Receive temperature (K) | 180 | 120 |
| Earth station dish size (m) | 0.6 | 0.8 |
Both networks were assumed to be operating at 12.5 GHz with a clear air propagation model of free space path loss plus attenuation due to atmospheric gases ITU-R Rec.P.676.
The DT/T and C/I’s were then calculated at the reference earth station across the relevant service areas.
The simulation is configured with four views open:
- Plate Carrée map view (top left) showing the satellite beam footprints and a contour where the DT/T > 6% (i.e. I/N > -12.2 dB) for interference from Arabsat into the Lux network
- Plate Carrée map view (top right) showing the satellite beam footprints and a contour where the C/I > 20, 25, 30 dB for interference from Arabsat into the Lux network
- Watch window (bottom left) showing the link budget for the wanted and interfering signals for Arabsat network
- Watch window (bottom right) showing the link budget for the wanted and interfering signals for Lux network
This simulation can be re-configured to show the converse interference path, i.e. from Lux-28.2E into Arabsat by changing the two Area Analysis as follows:
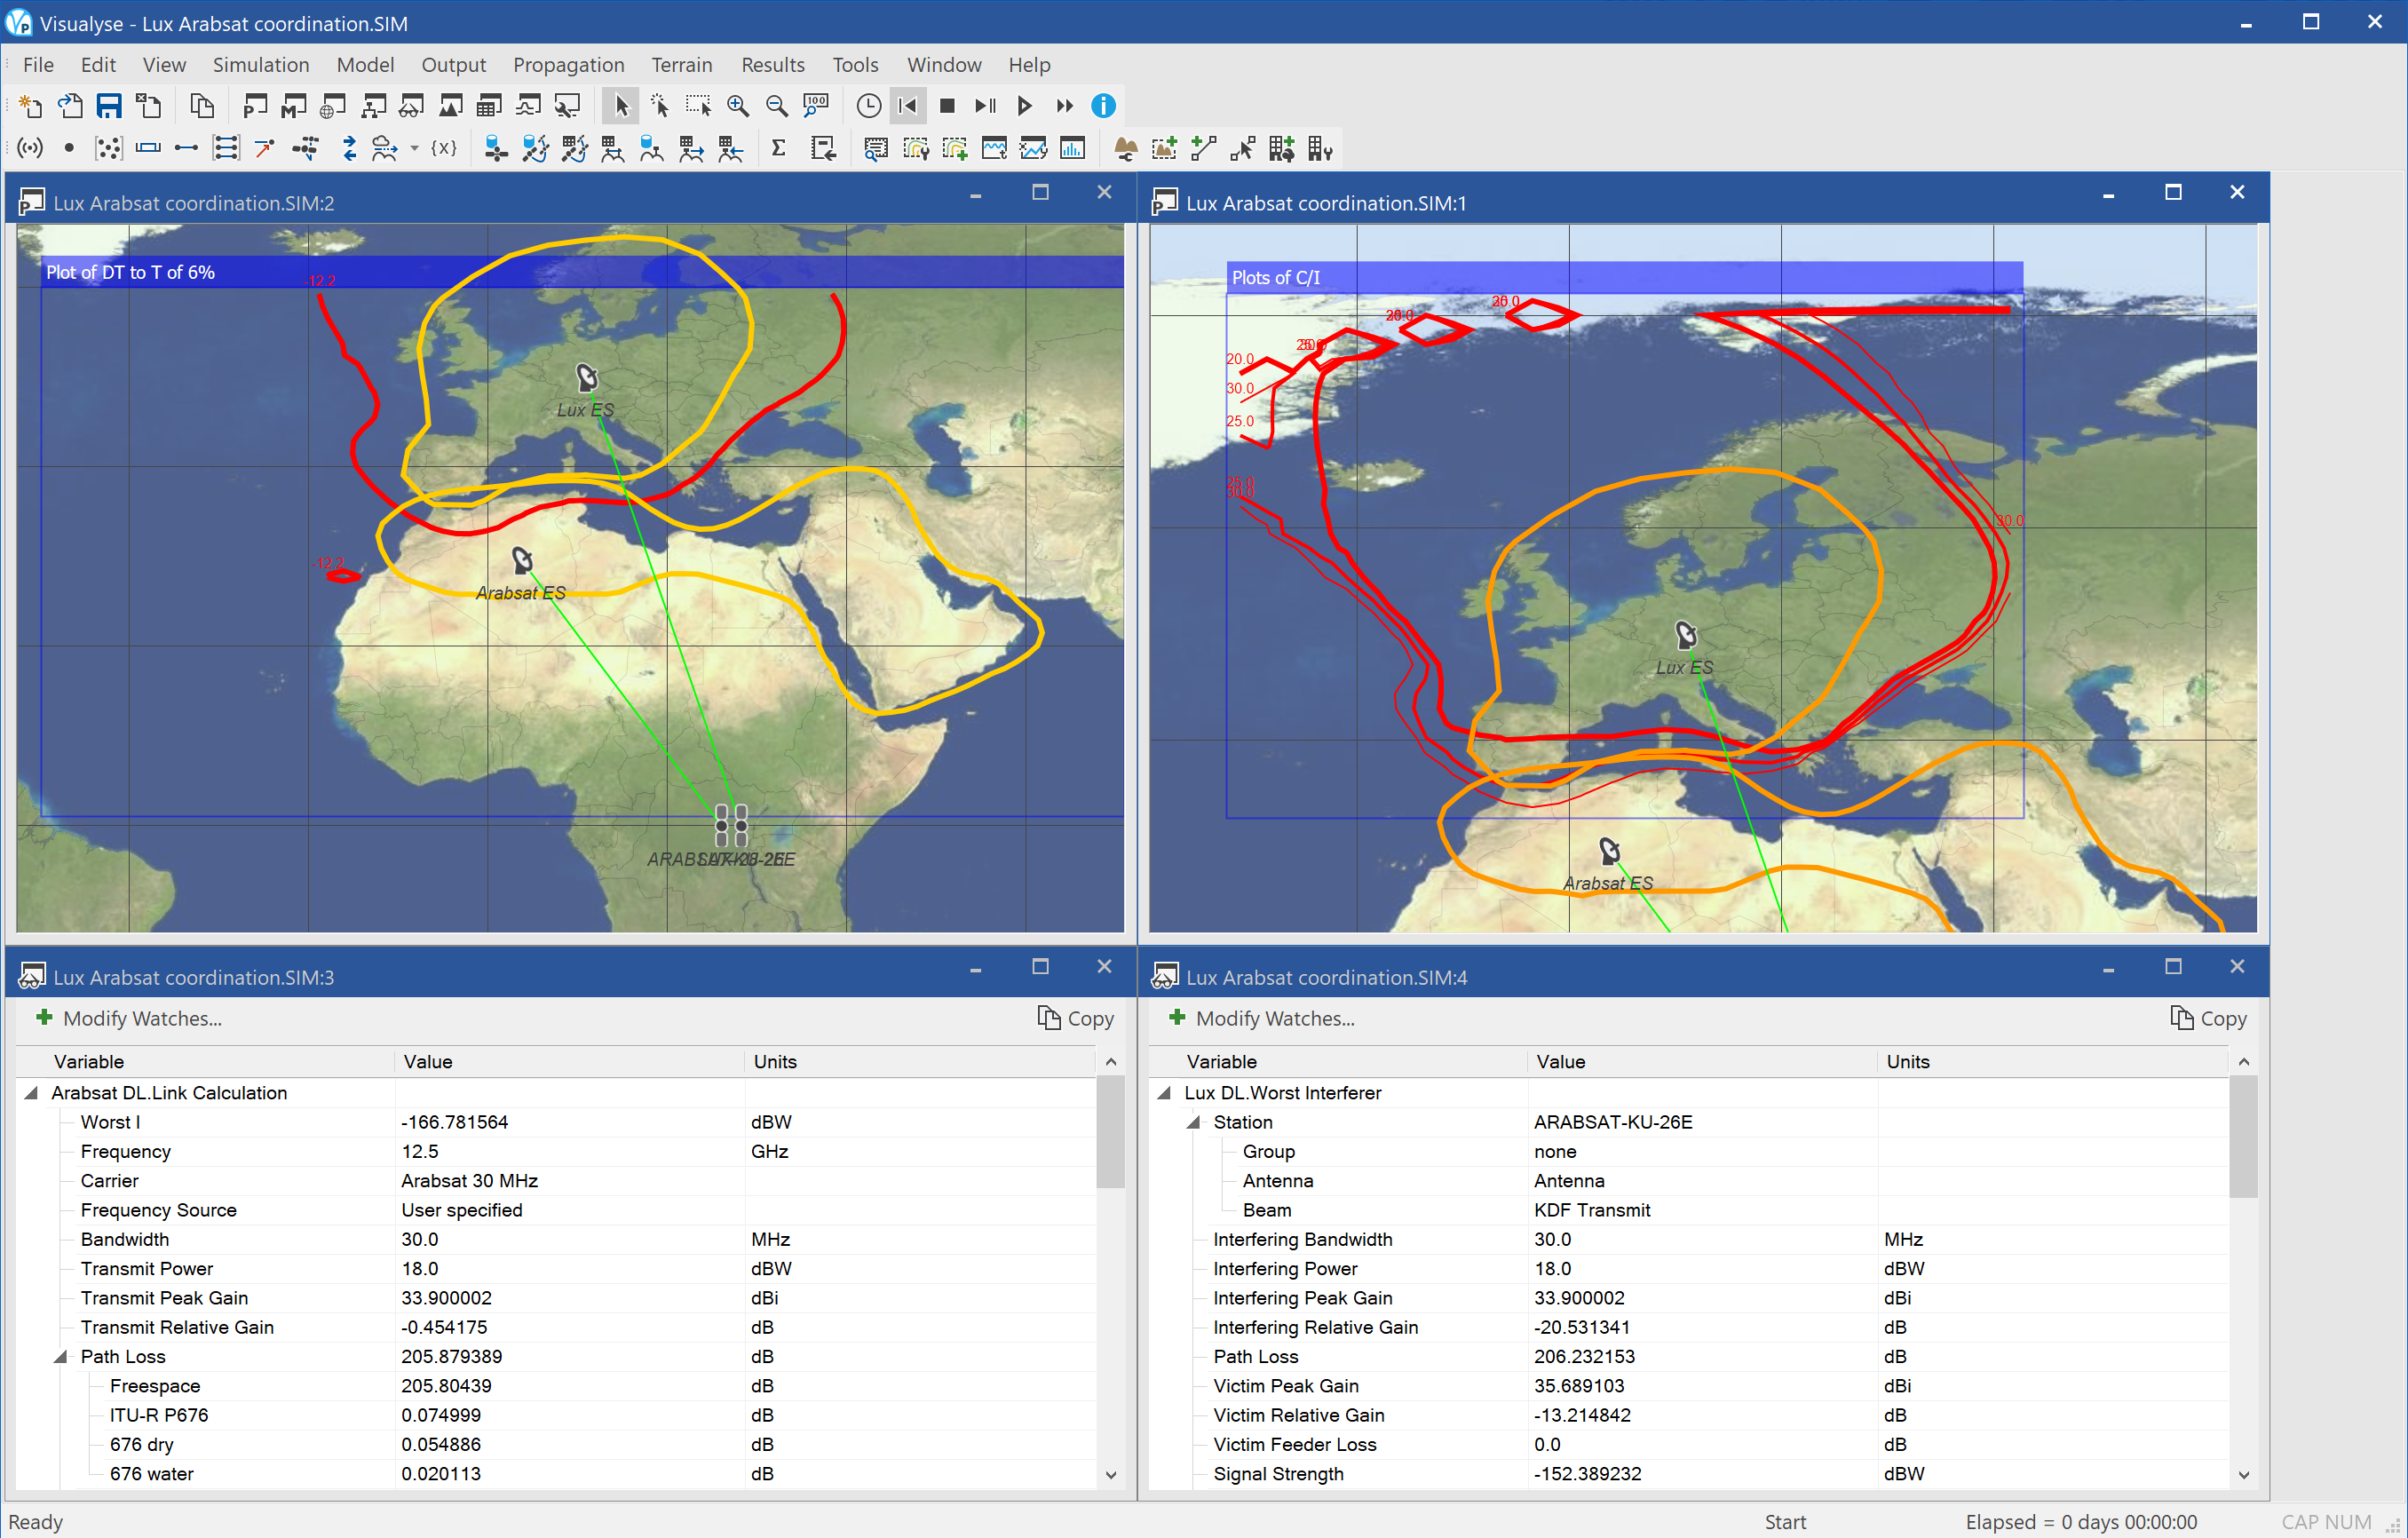
The scenario can be built on to include many other factors, including impact of interference mitigation, what-if analysis, end to end performance and coordination constraints.
Maritime
This section contains the following examples:
ESV Interference Area
| Action: | None |
| Modules used: | Terrain, IDWM |
| Terrain regions: | Seattle Area |
| Frequency band: | C |
| Station types: | GSO Satellite, Earth Stations, Fixed Stations, Maritime |
| Propagation models: | Free space, ITU-R Rec.P.452, ITU-R Rec.P.530 |
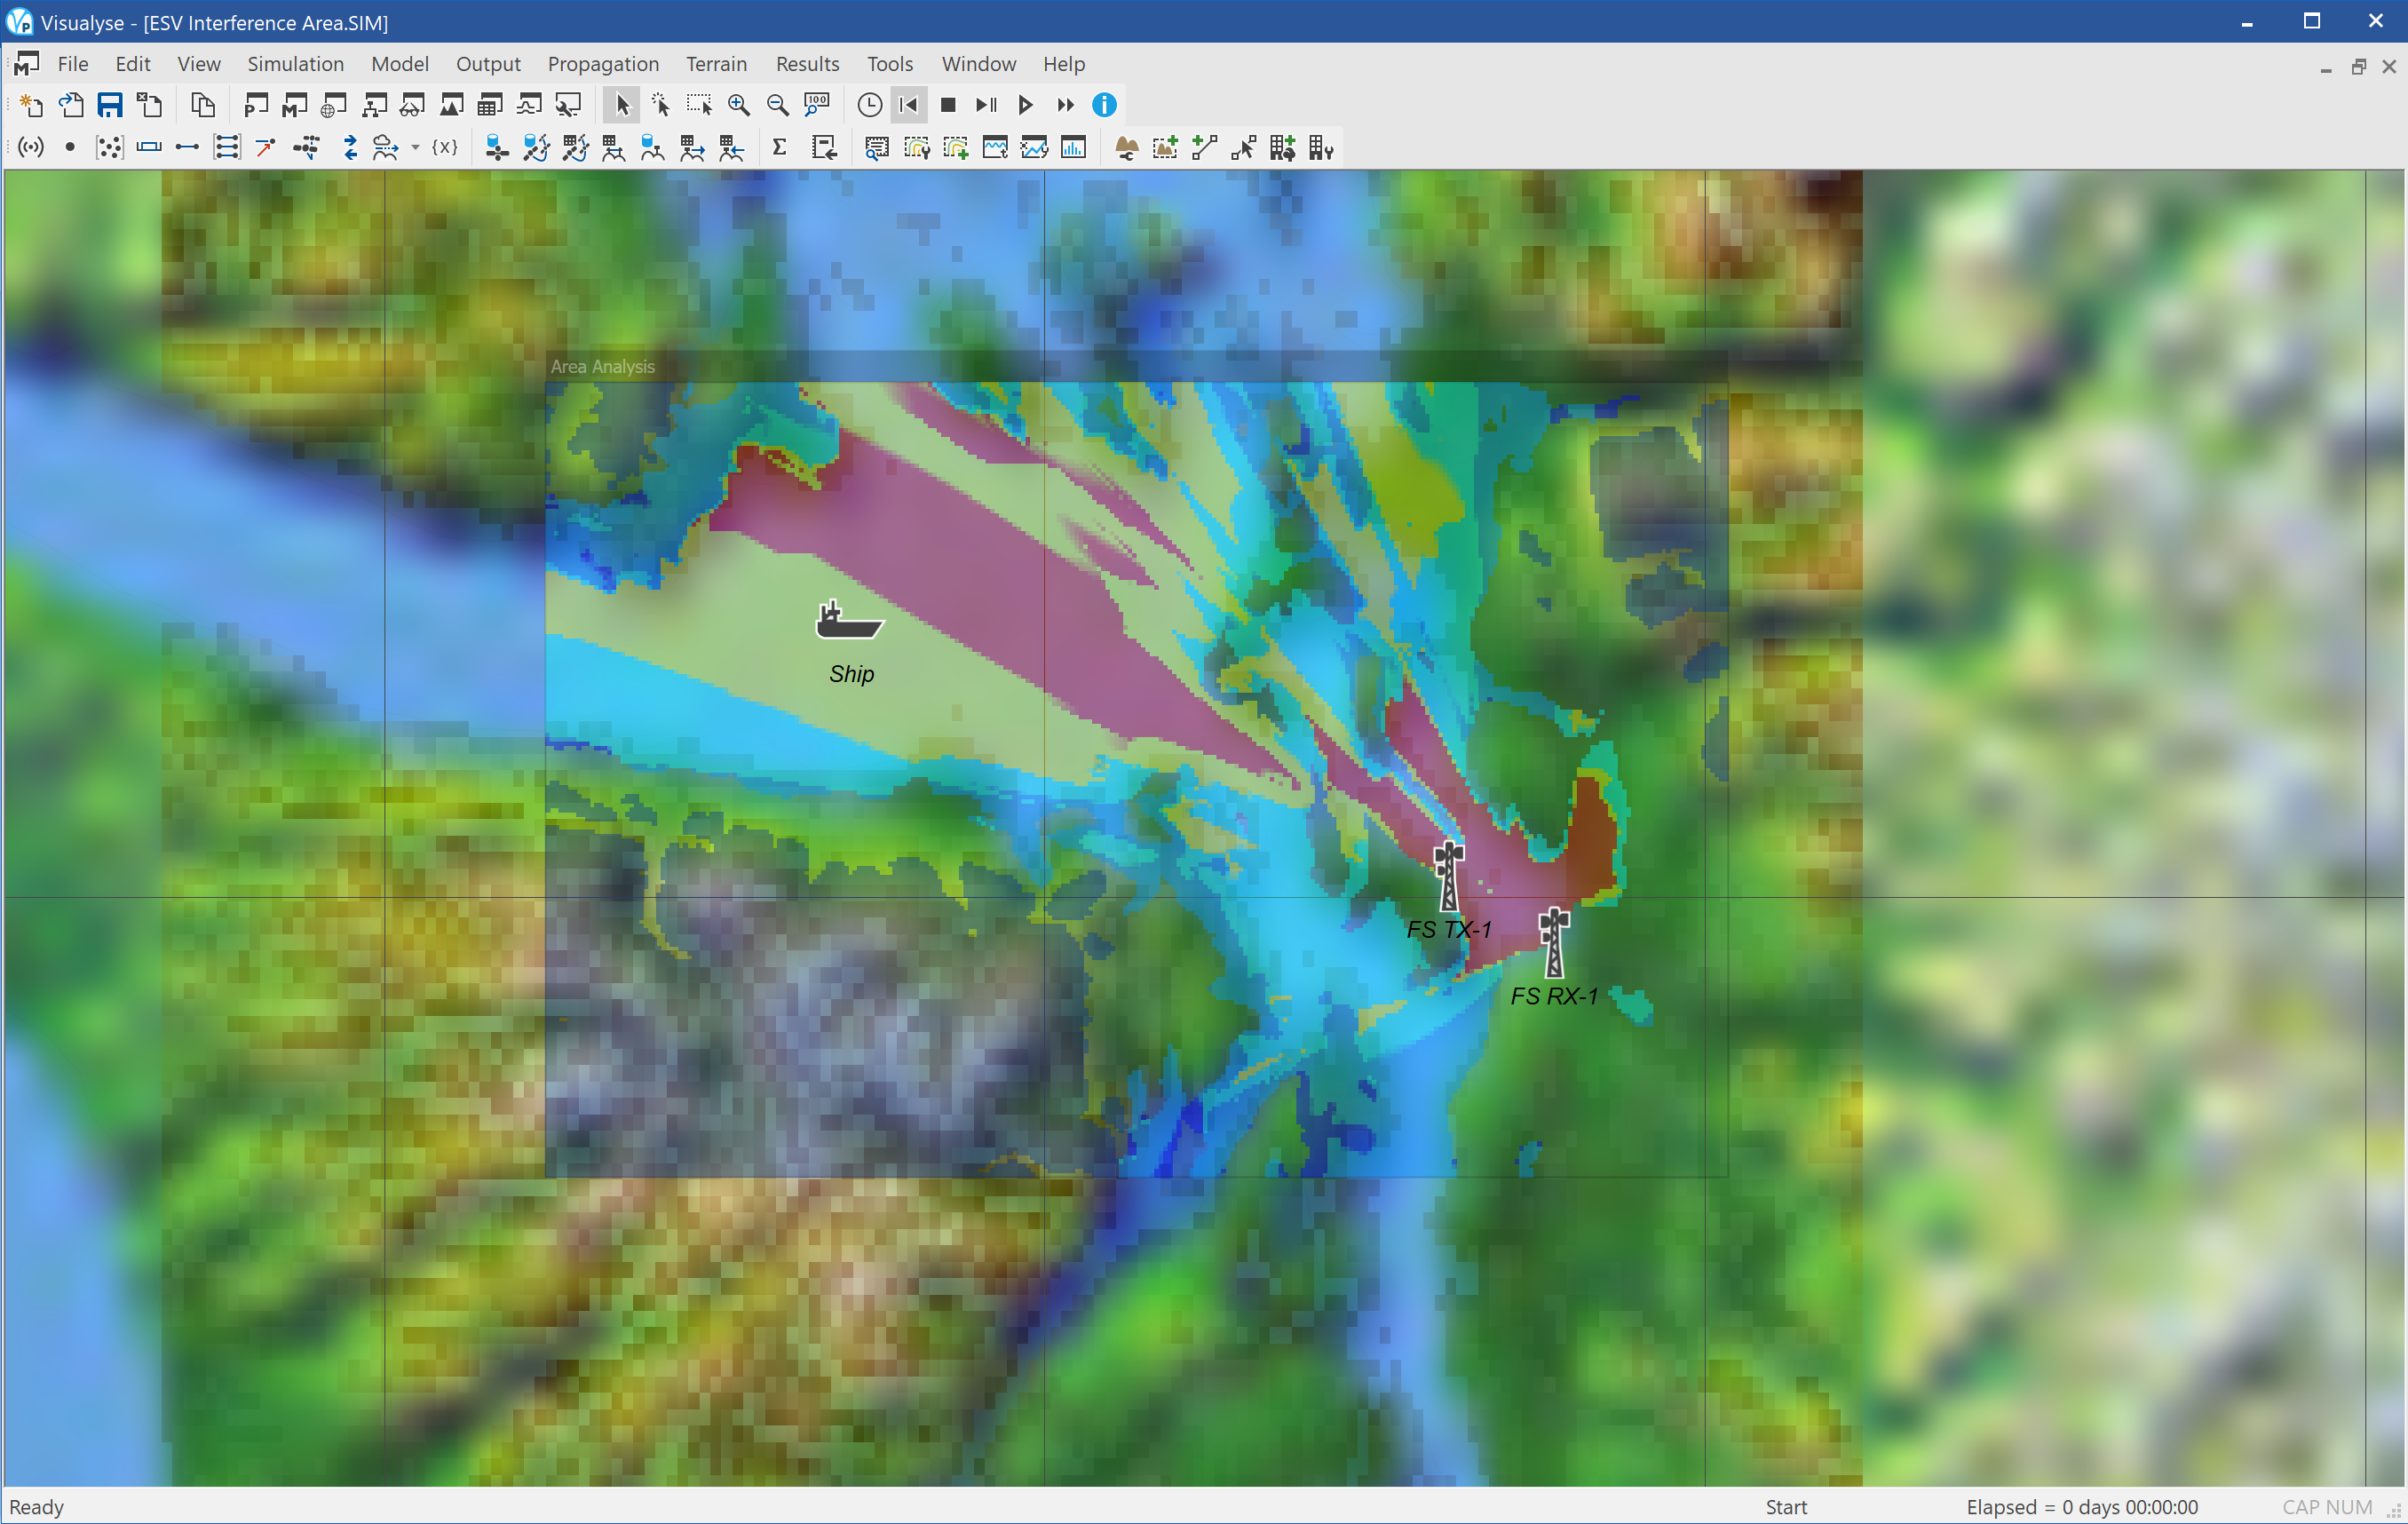
This example shows locations where an Earth Station on Vessel (ESV) transmitting up to a GSO satellite in C band could cause interference into co-frequency point to point fixed links. This analysis could also be used for adjacent or guard band operation or to calculate interference into point to multi-point fixed services.
The simulation has been configured to calculate the interference from an Earth Station into a fixed service receiver taking into account the effect of terrain using the ITU-R Rec.P.452 propagation model. This has been configured with a percentage of time of 0.216% based upon:
Required probability of interference = 0.001%
Number of ships / day = 4
Time spent at each pixel = 100 seconds
Probability ship active at pixel = 1/216
Propagation probability used = 216 * 0.001 = 0.216%
The window above shows the I/N that the ESV would cause colour coded as follows:
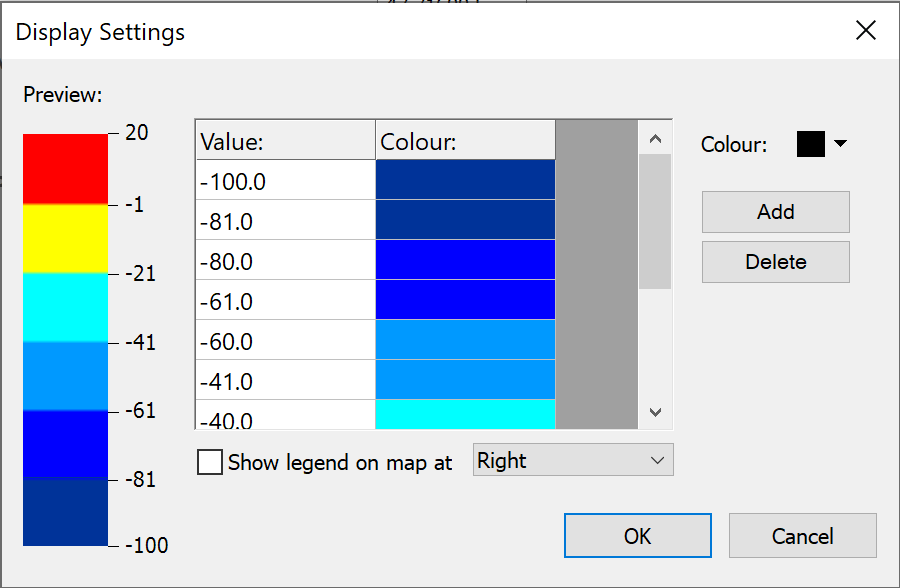
GSO ES on ship entering Seattle Port into FS
| Action: | Run simulation |
| Modules used: | Terrain, Define Variable, IDWM |
| Terrain regions: | Seattle Area |
| Frequency band: | C |
| Station types: | GSO Satellite, Earth Stations, Fixed Stations, Maritime |
| Propagation models: | Free space, ITU-R Rec.P.452, ITU-R Rec.P.530 |
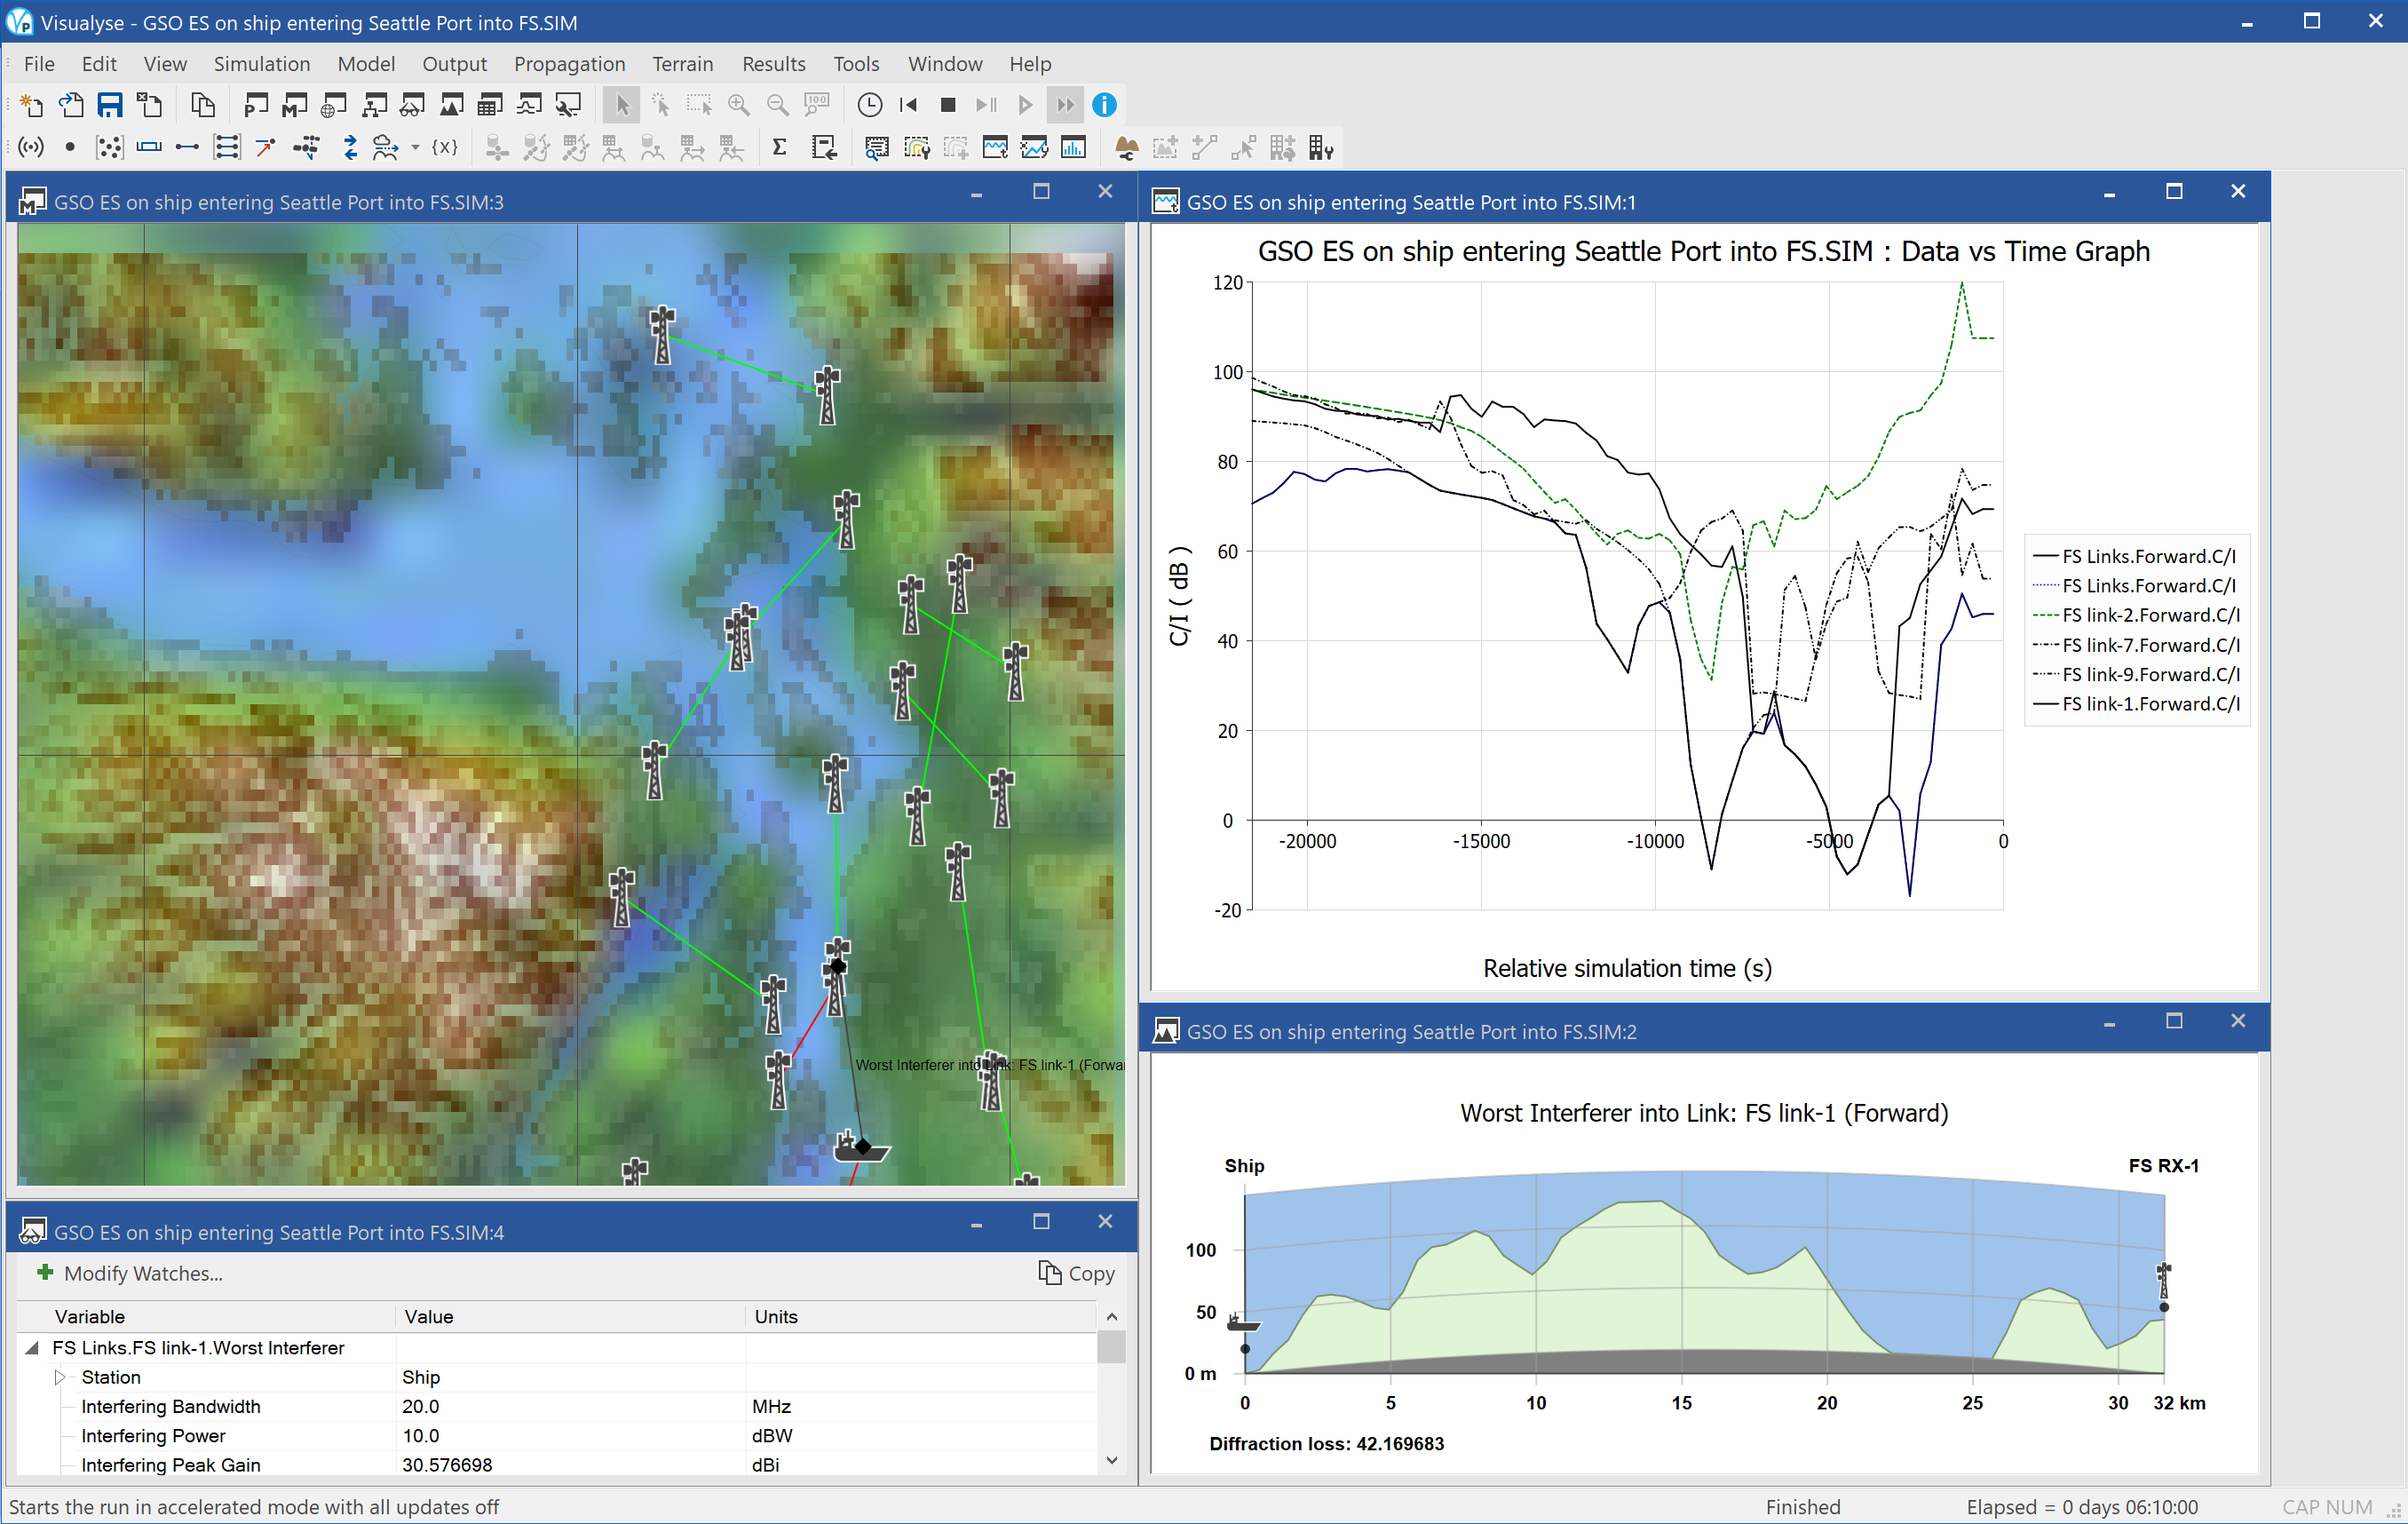
This example considers interference from the uplink from an Earth Station on a Vessel (ESV) into terrestrial point to point fixed service (FS) links operating in the vicinity. The ESV is approaching the port of Seattle while transmitting and the amount of interference it could cause will depend upon the locations of the ship and FS receivers.
The simulation has been configured with the movement of the ship defined using a series of way points. The interference from the ship at the fixed service receiver has been calculated taking into account the effect of terrain using the ITU-R Rec.P.452 propagation model. The wanted signal of the FS link is calculated taking into account fading due to multi-path and rain as in ITU-R Rec.P.530.
The screen shot above shows four window open:
- Mercator map view (top left), shows the locations of the FS stations, the ship, the terrain, and the various links, which go red when they suffer interference
- Quick graph (top right), shows how the C/I of some of the links varies as the ship progresses up the channel
- Watch window (bottom left), shows the worst single interferer’s link budget for the one of the FS links
- Path profile window (bottom right), shows the terrain between the ship and the receiver on one of the FS links
MRCC Coverage
| Action: | None |
| Modules used: | Terrain, IDWM |
| Terrain regions: | SW England |
| Frequency band: | VHF |
| Station types: | Maritime |
| Propagation models: | ITU-R Rec.P.1546 |
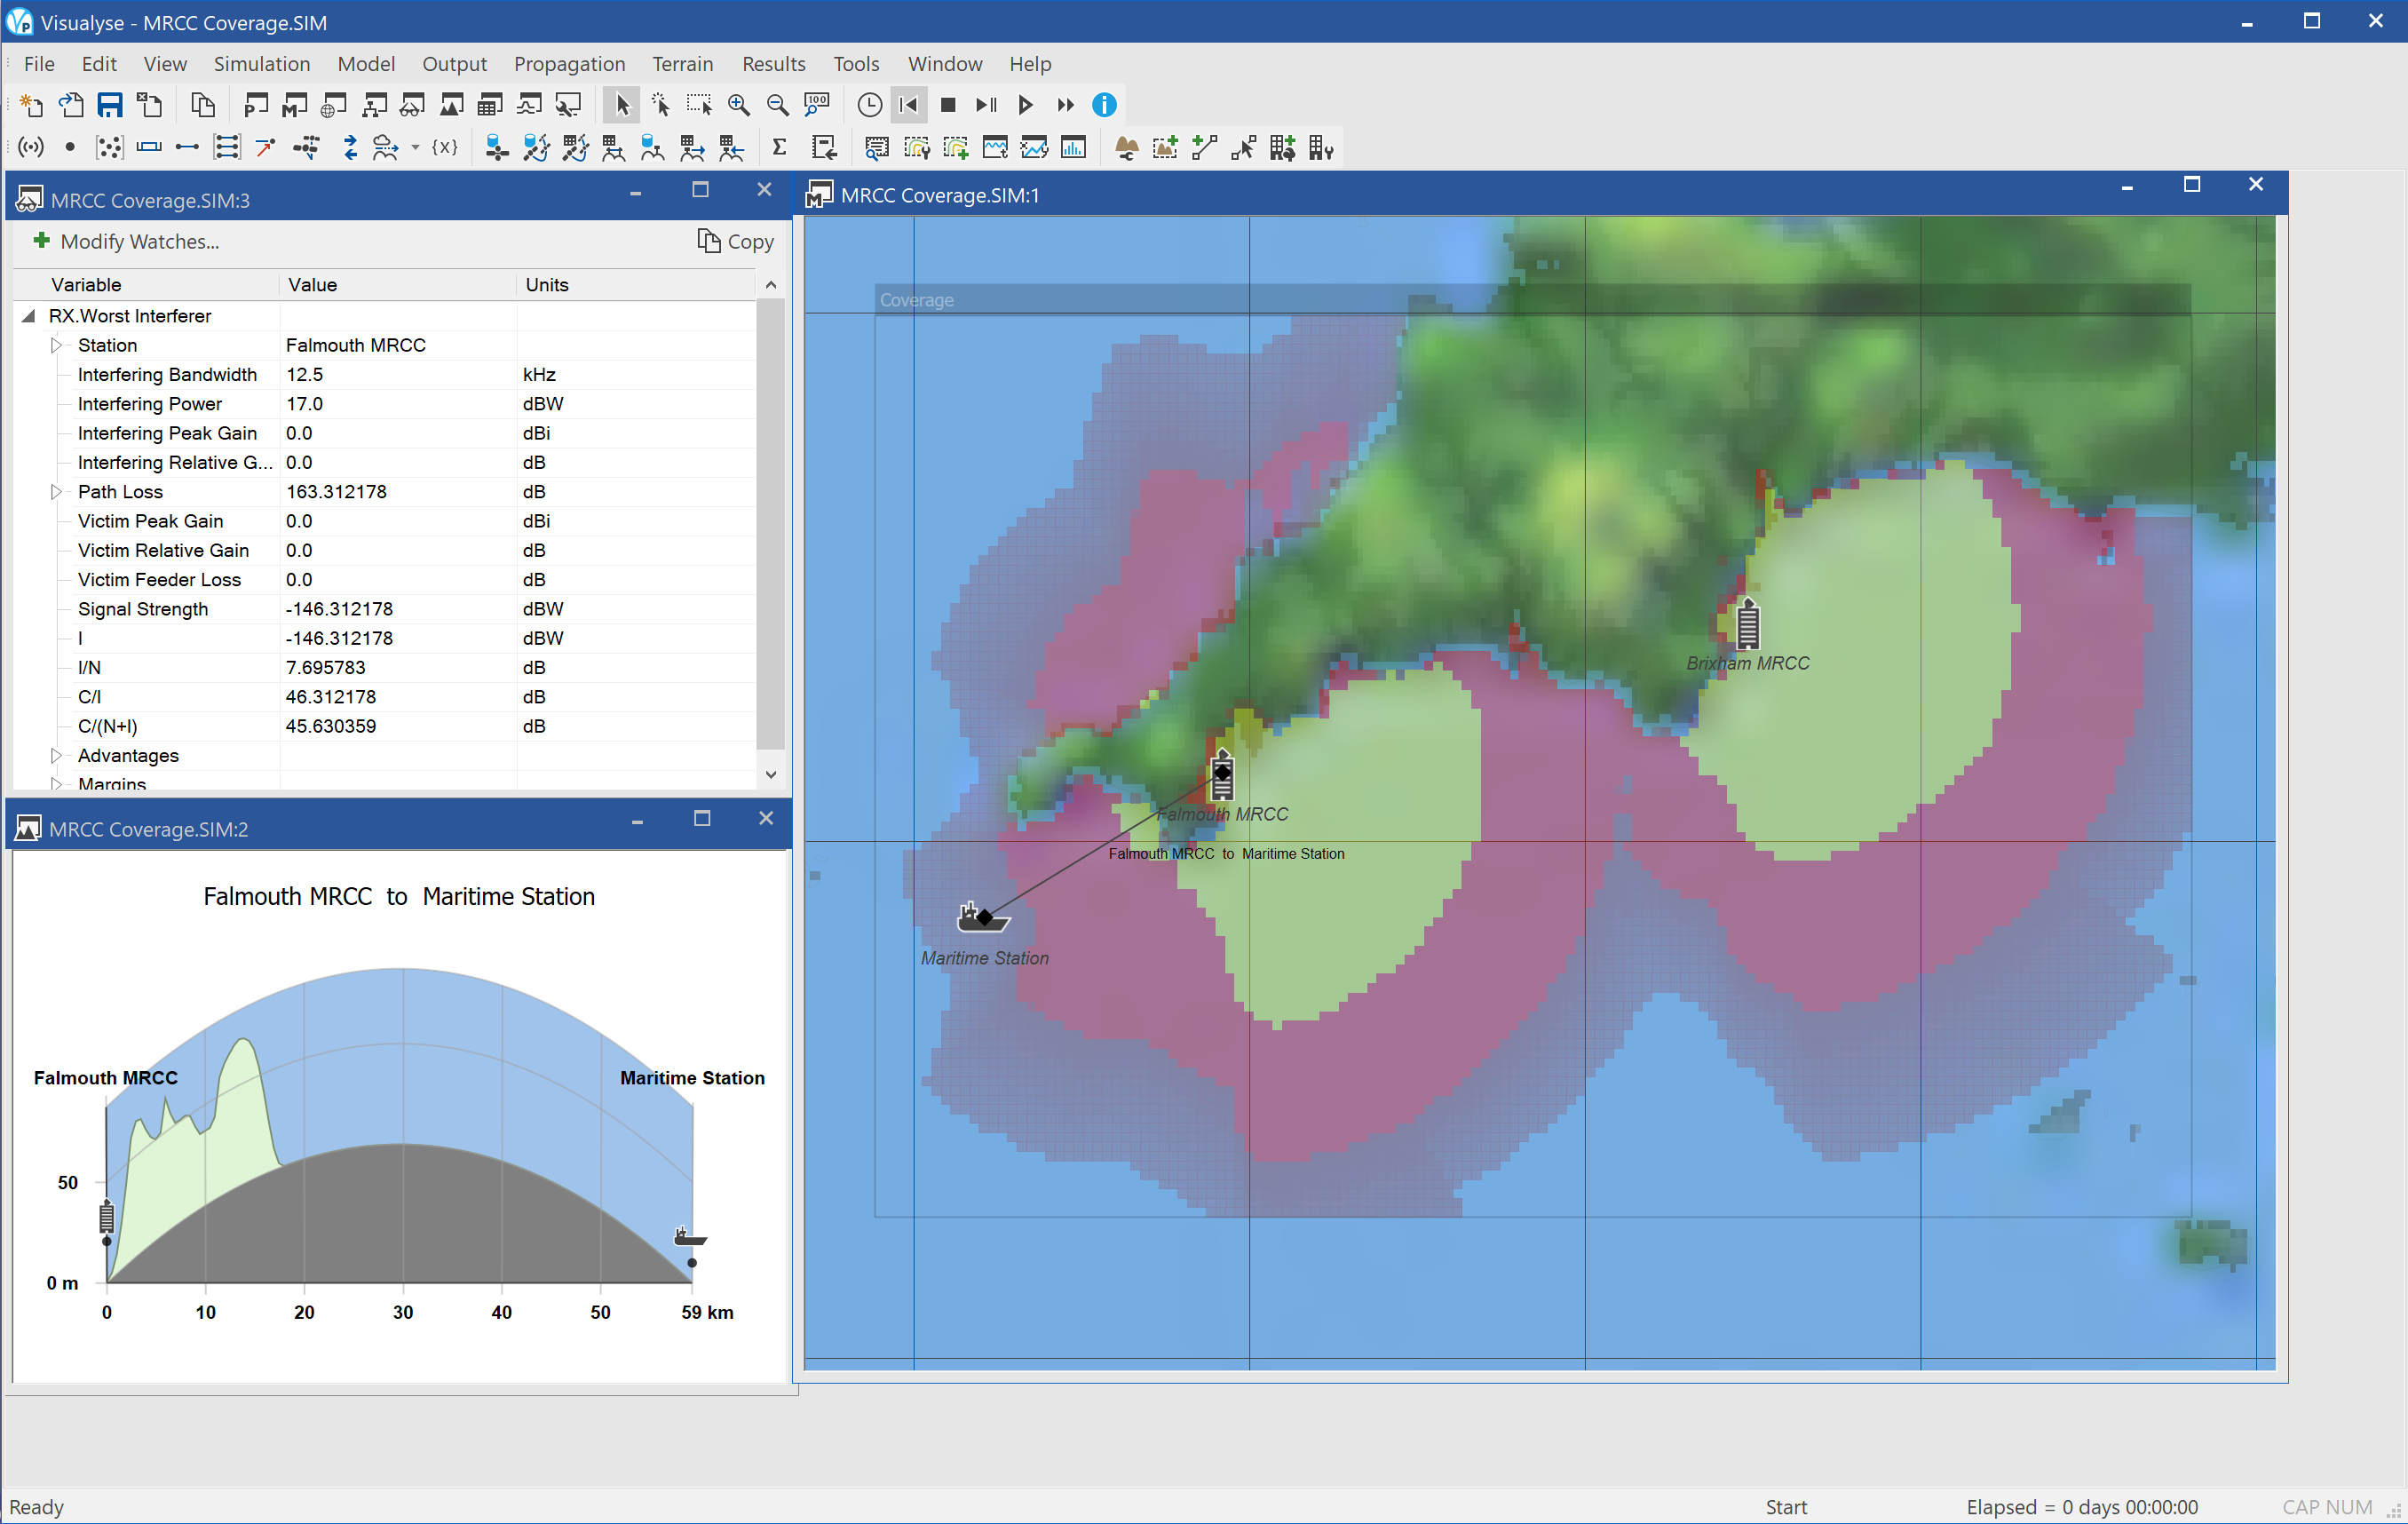
This example shows an example of Visualyse Professional the coverage of a maritime VHF voice communication. It calculates the C/N for a 12.5 kHz voice carrier operating on channel 16 around 156 MHz
Two Maritime Rescue Co-ordination Centres (MRCC) are modelled and the ship is assumed to transmit at 15W i.e. 17 dBW at a height of 10m above sea level, while the coast guard antenna is at a height of 20m above the local terrain.
The prediction is made using ITU-R Rec.P.1546 propagation model and the Area Analysis shows the C/N coloured according to the following scale:
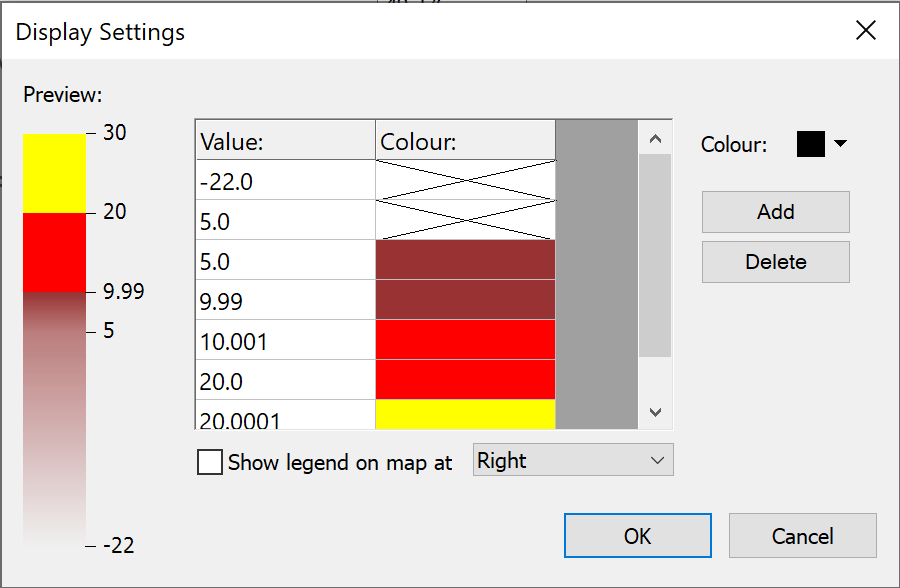
The screenshot shows three windows open:
- Mercator map view (right) showing the locations of the coast guard centres, a ship test point, and the predicted coverage
- Watch window (top left) showing the link budget for the link between the ship and the nearest coast guard
- Path profile (bottom left) showing the terrain between the ship and the nearest coast guard.
This type of analysis could be used to:
- Ensure there is coverage on channel 16 of the major shipping routes
- Identify where there could be re-use of channels between marinas or for in-port communications
- Analyse the options to move to 4 or 6 kHz channels
- Analyse the ability to re-use channels for in-land applications
Military
This section contains the following examples:
Missile telemetry with jamming
| Action: | Run simulation |
| Modules used: | None |
| Terrain regions: | None |
| Frequency band: | X |
| Station types: | Non-GSO Satellite, Earth Stations |
| Propagation models: | Free space, ITU-R Rec.P.676 |
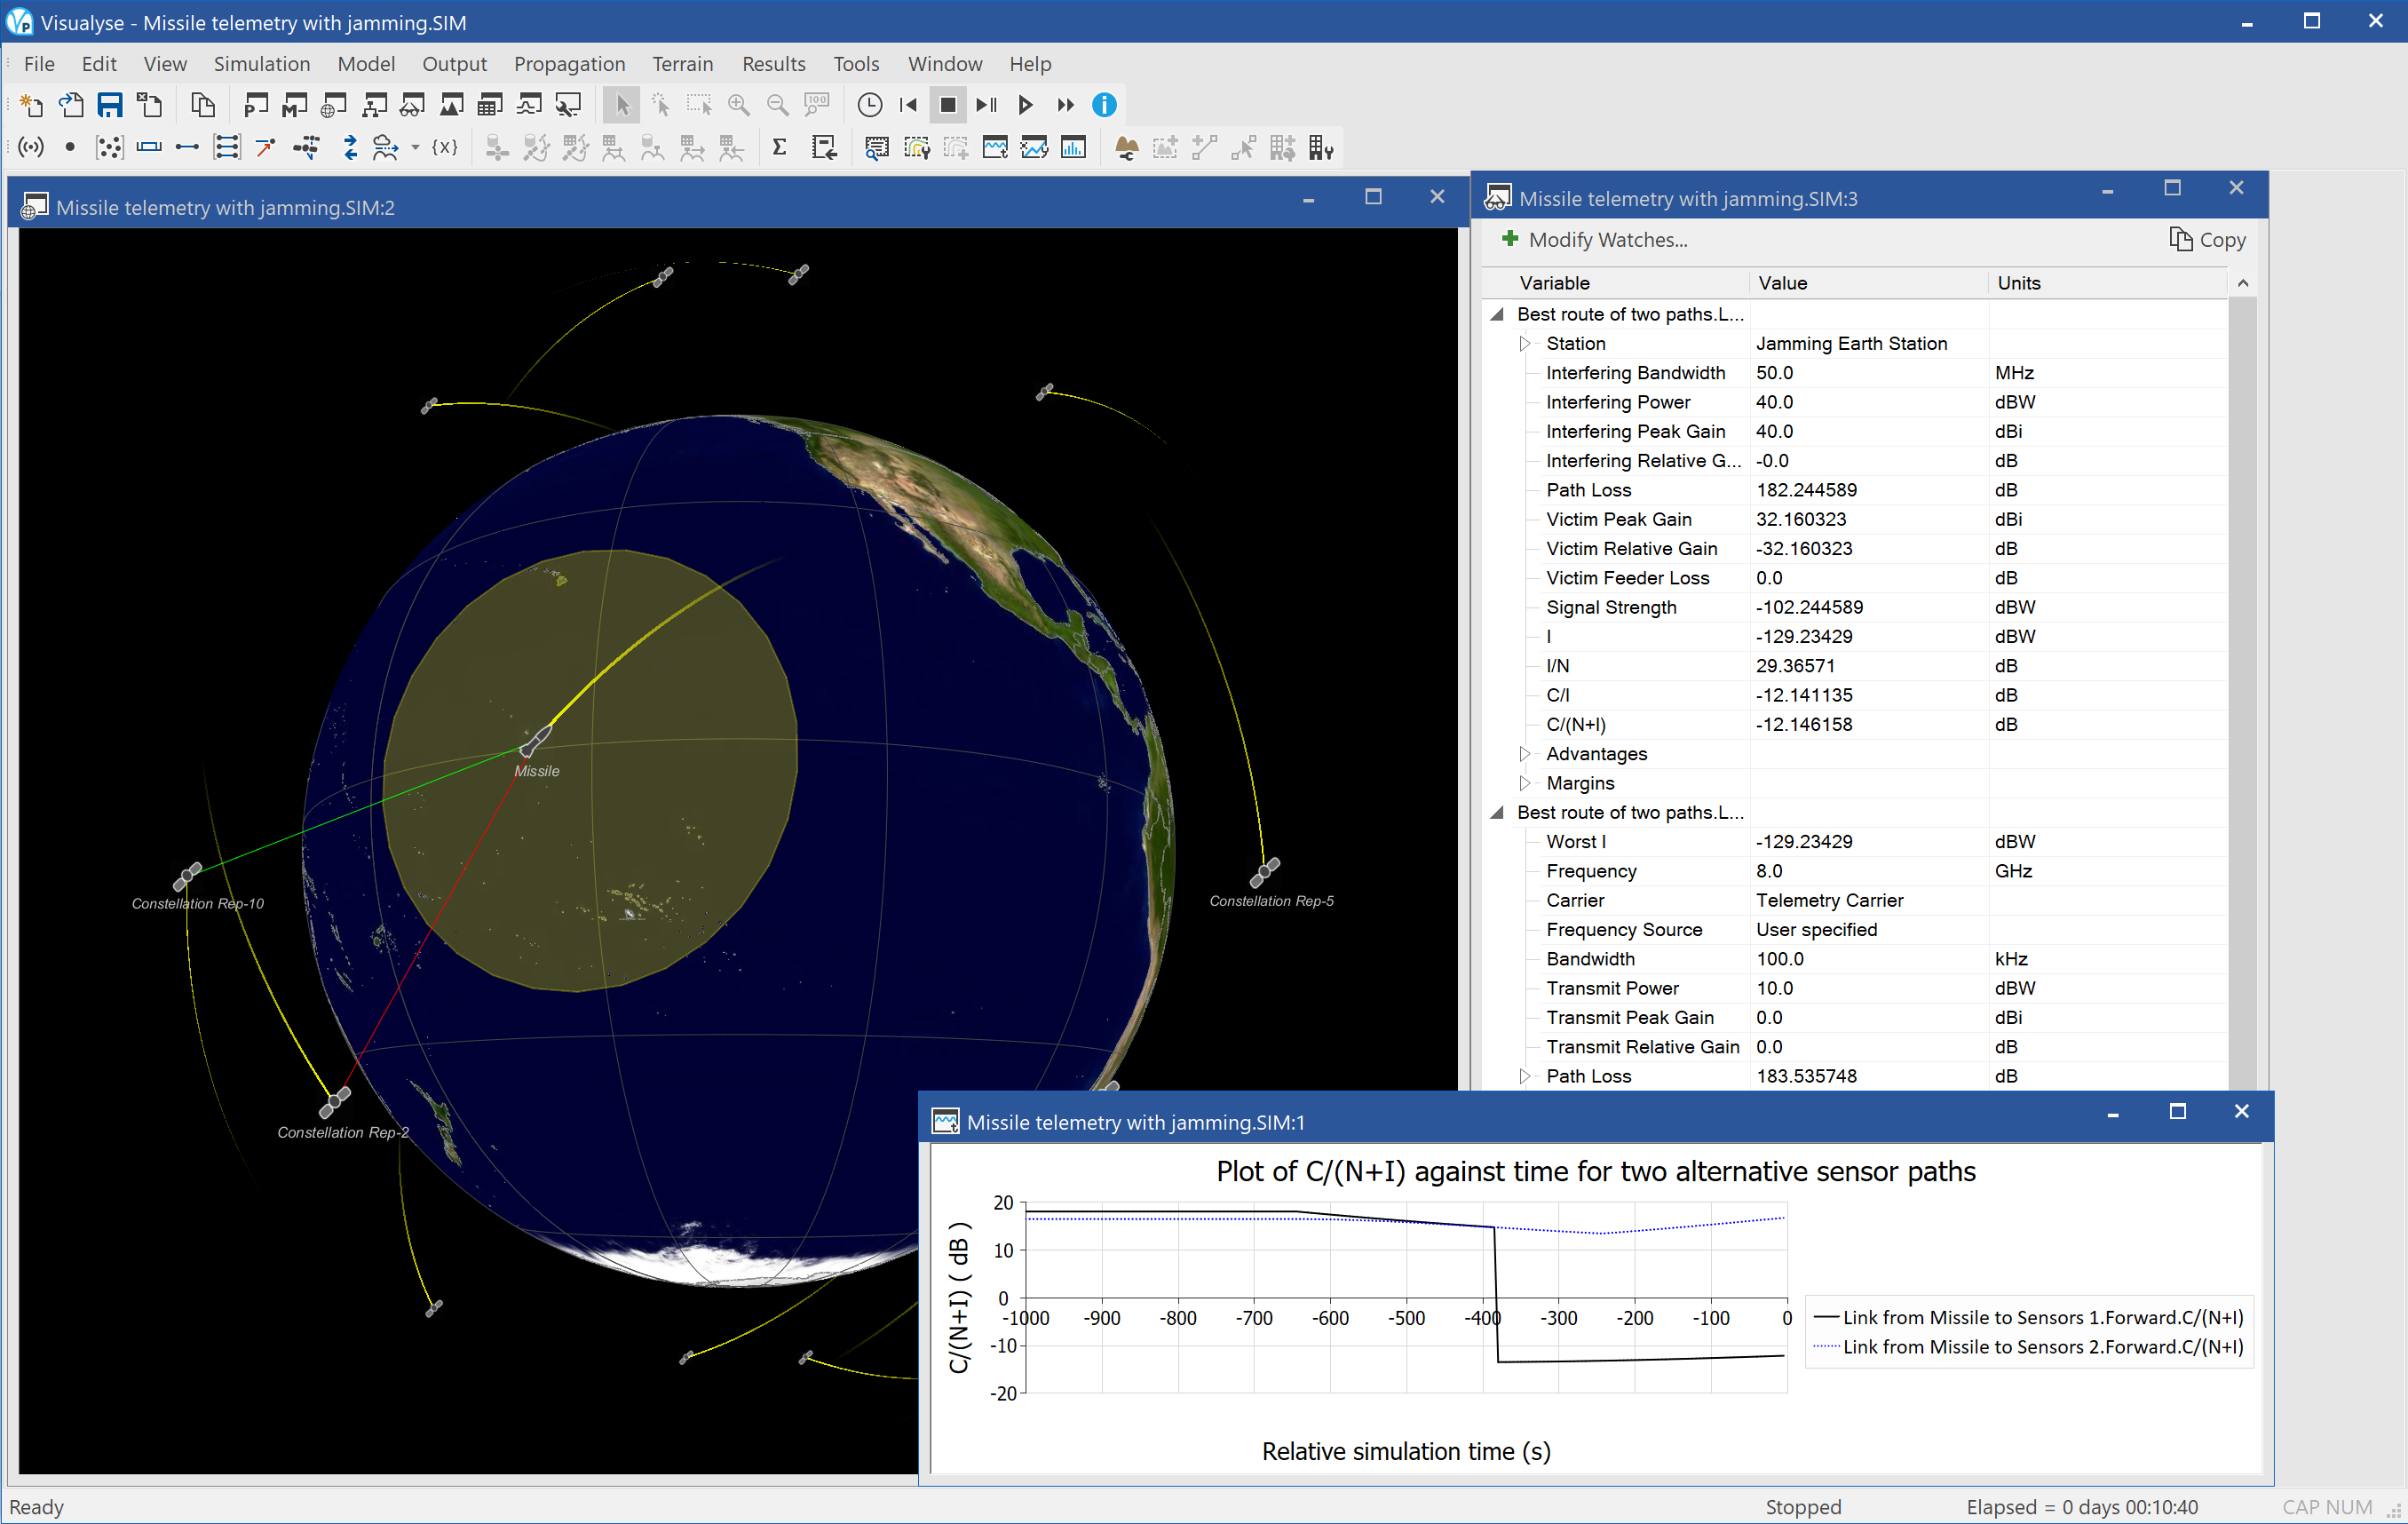
This example shows an example of Visualyse Professional modelling jamming. This is specialised form of interference that is deliberately generated to cause loss of service rather than (as is usually the case) unintentional.
A number of jamming scenarios could be considered – indeed all the interference simulations in this document could be considered jamming if the motivation was hostile. This simulation shows an exercise where susceptibility of a missile’s telemetry to jamming was being tested.
A missile is launch on a test trajectory across the Pacific Ocean, relaying data to ground via a network of satellites at X-band. In the exercise jamming station try to interrupt collection of data with a 10 kW transmission. The main mitigation method to the jamming attack is to switch to an alternative routing i.e. select a back-up satellite.
The simulation is configured with three views open:
- 3D view (left) showing the satellite constellation, the missile, the tracks, the jamming ground station, and the beam footprints
- Watch window (top right) showing the link budget of the wanted signal and the link budget of the jamming signal
- Quick graph (bottom right) showing how the C/N of the first and second preference links taking into account the effects of jamming.
UAV demo
| Action: | Run simulation |
| Modules used: | Define Variable, Terrain |
| Terrain regions: | Afghanistan |
| Frequency band: | Ka, V, S |
| Station types: | GSO Satellite, Earth Stations, Fixed Stations, Aeronautical stations |
| Propagation models: | Free space, ITU-R Rec.P.676, ITU-R Rec.P.452 |
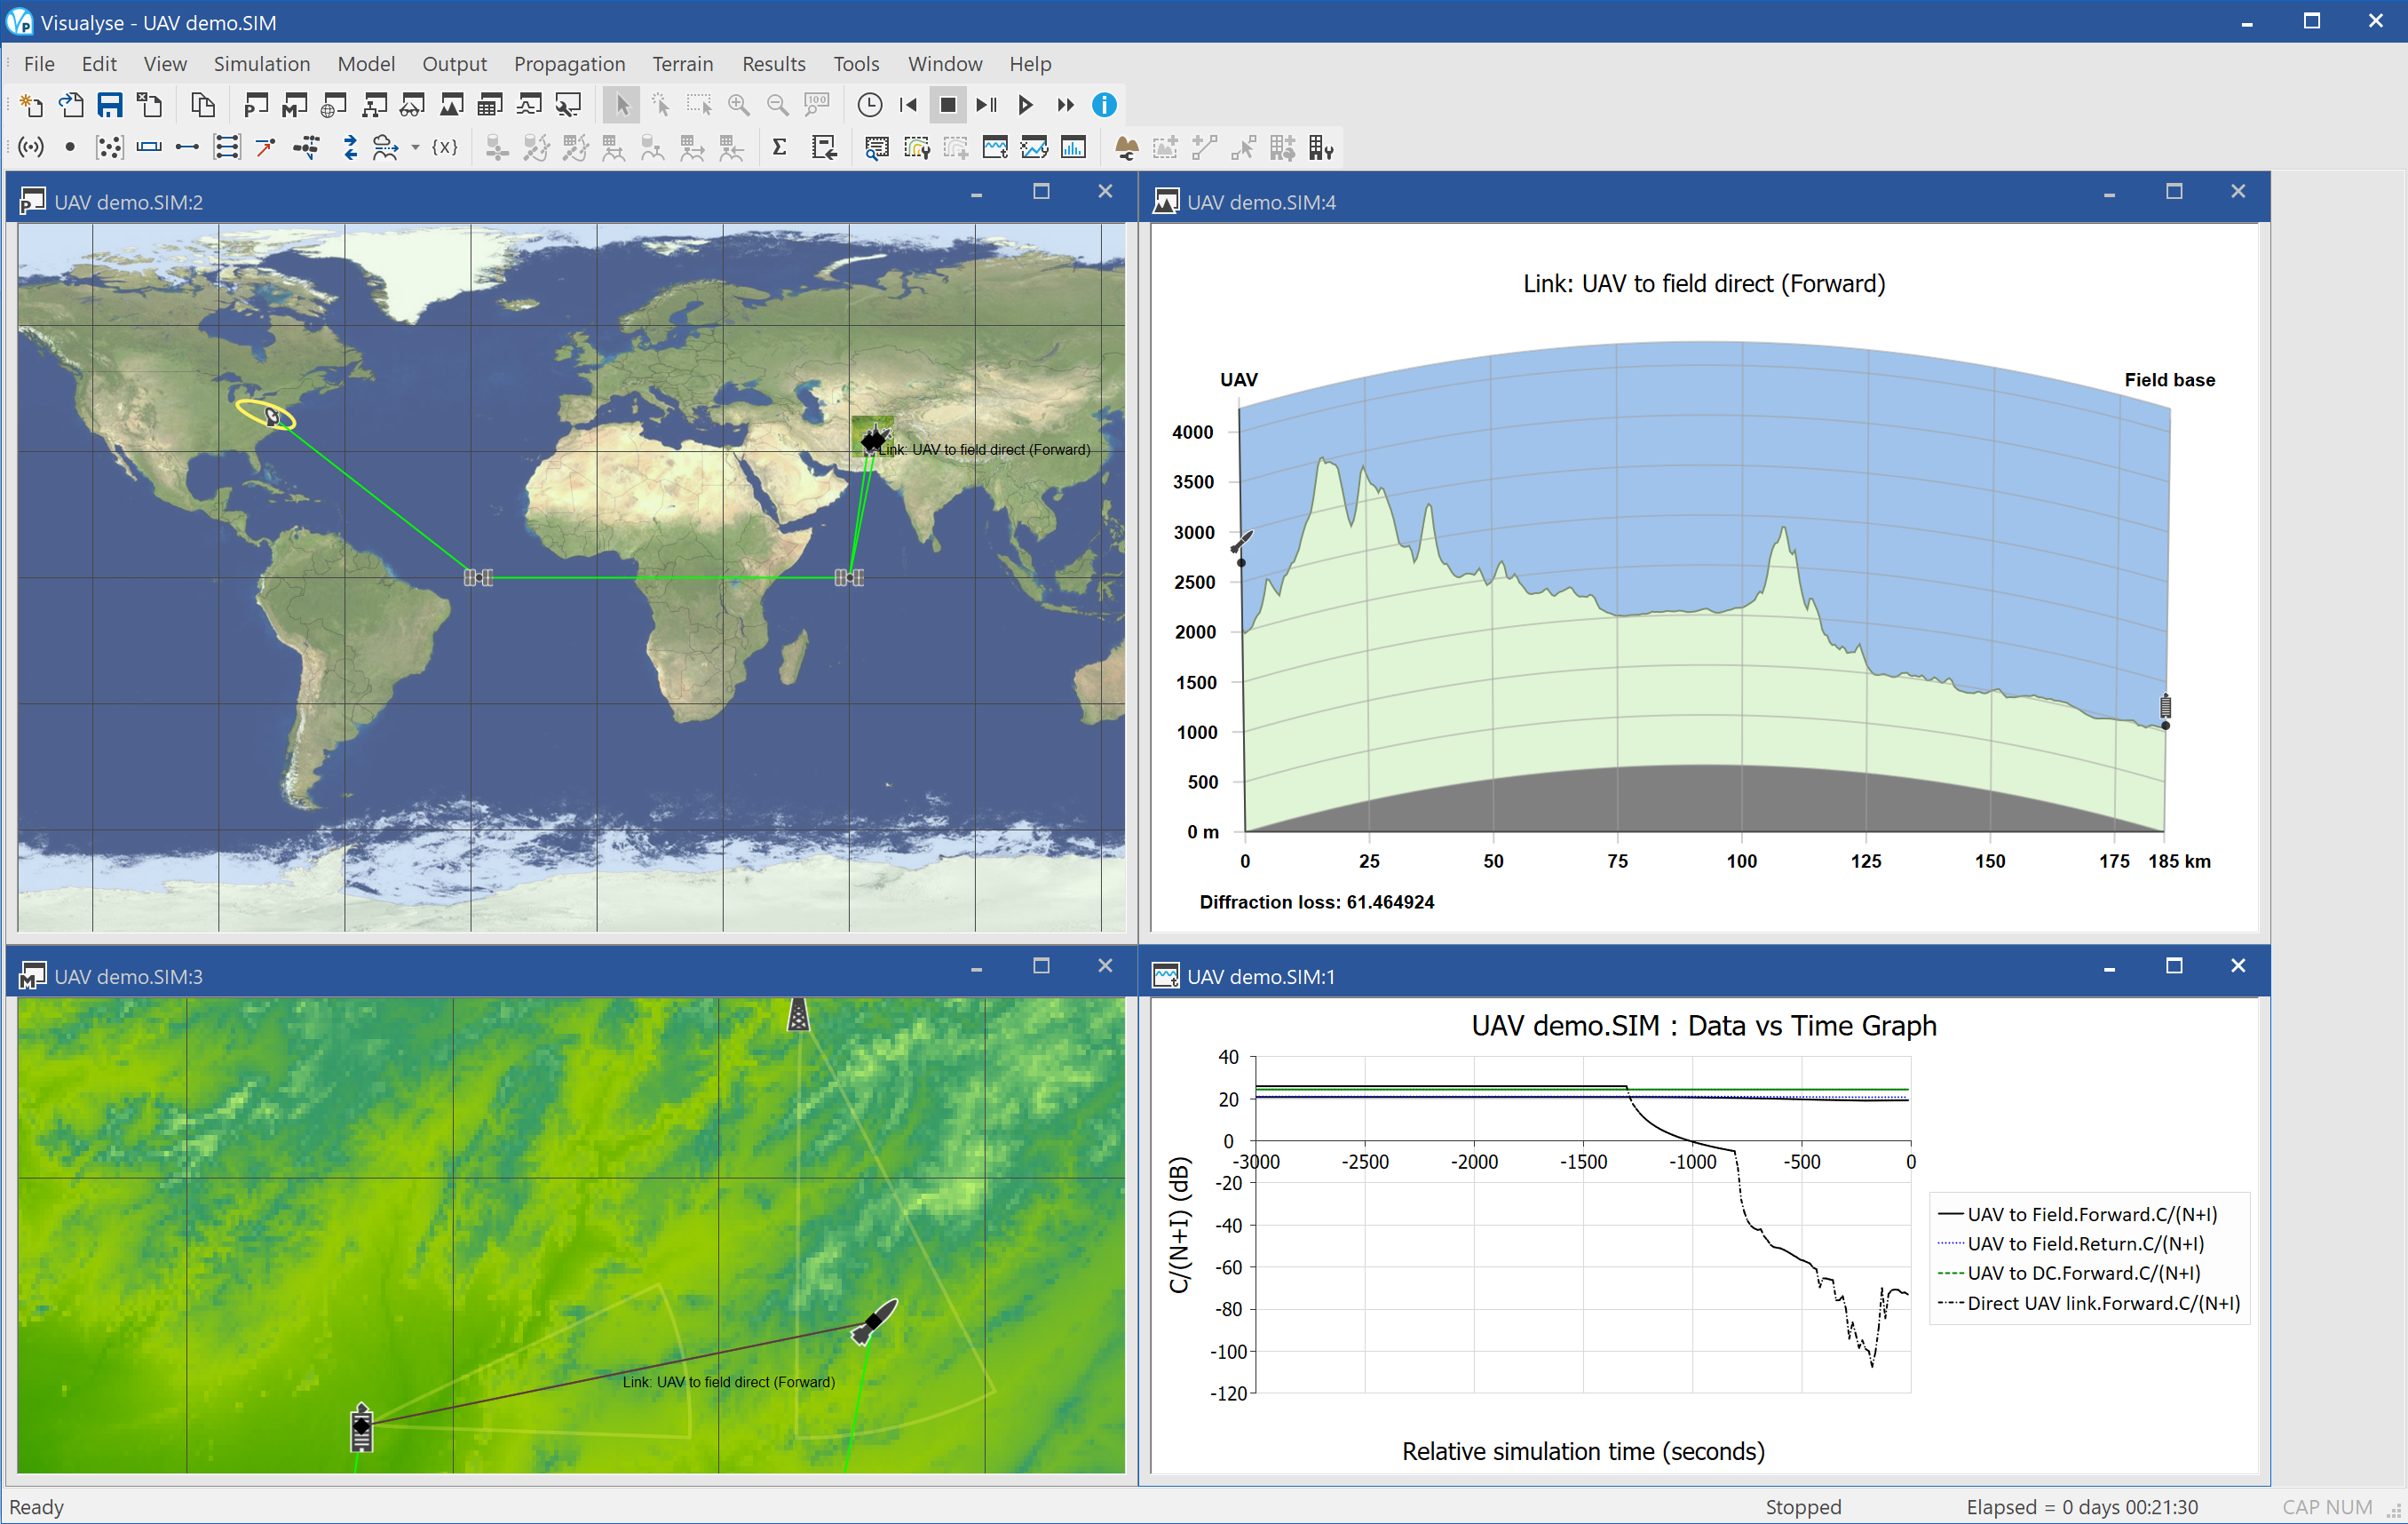
This example shows an example of Visualyse Professional modelling unmanned aerial vehicle, i.e. a UAV, including jamming.
The UAV is sent on a mission to observe targets in the hills of Afghanistan. Its flight path is defined by a set of way points in (latitude, longitude, height). As it enters the mountainous region it climbs and then descends into valleys.
Initially the communication is with the local field base: however soon the UAV is beyond range and instead a satellite link is used. The model also includes the complete end-to-end link back to the operations room in Washington DC. A range of frequency bands are used, including Ka for the UAV to satellite, V for the inter-satellite, and S for the field base to UAV.
At times during the mission the UAV suffers from jamming, and so the C/N is degraded. The model includes realistic modelling of propagation of wanted and interfering signals over terrain using ITU-R Rec.P.452 and a terrain database.
The simulation is configured with four views open:
- Plate Carrée map view (top left) showing the satellites routing the communications back to Washington DC
- Mercator map view (bottom left) showing the location of the field centre, the terrain, the UAV, the jamming station, and various communications links
- Terrain path profile view (top right) showing the terrain between the field base and the UAV
- Quick graph (bottom right) showing the C/Ns for the direct link to field base and satellite link
Network Coverage
This section contains the following examples:
Broadcasting Coverage
| Action: | None |
| Modules used: | Terrain, IDWM |
| Terrain regions: | Greater London |
| Frequency band: | S |
| Station types: | Broadcasting |
| Propagation models: | ITU-R Rec.P.1546 |
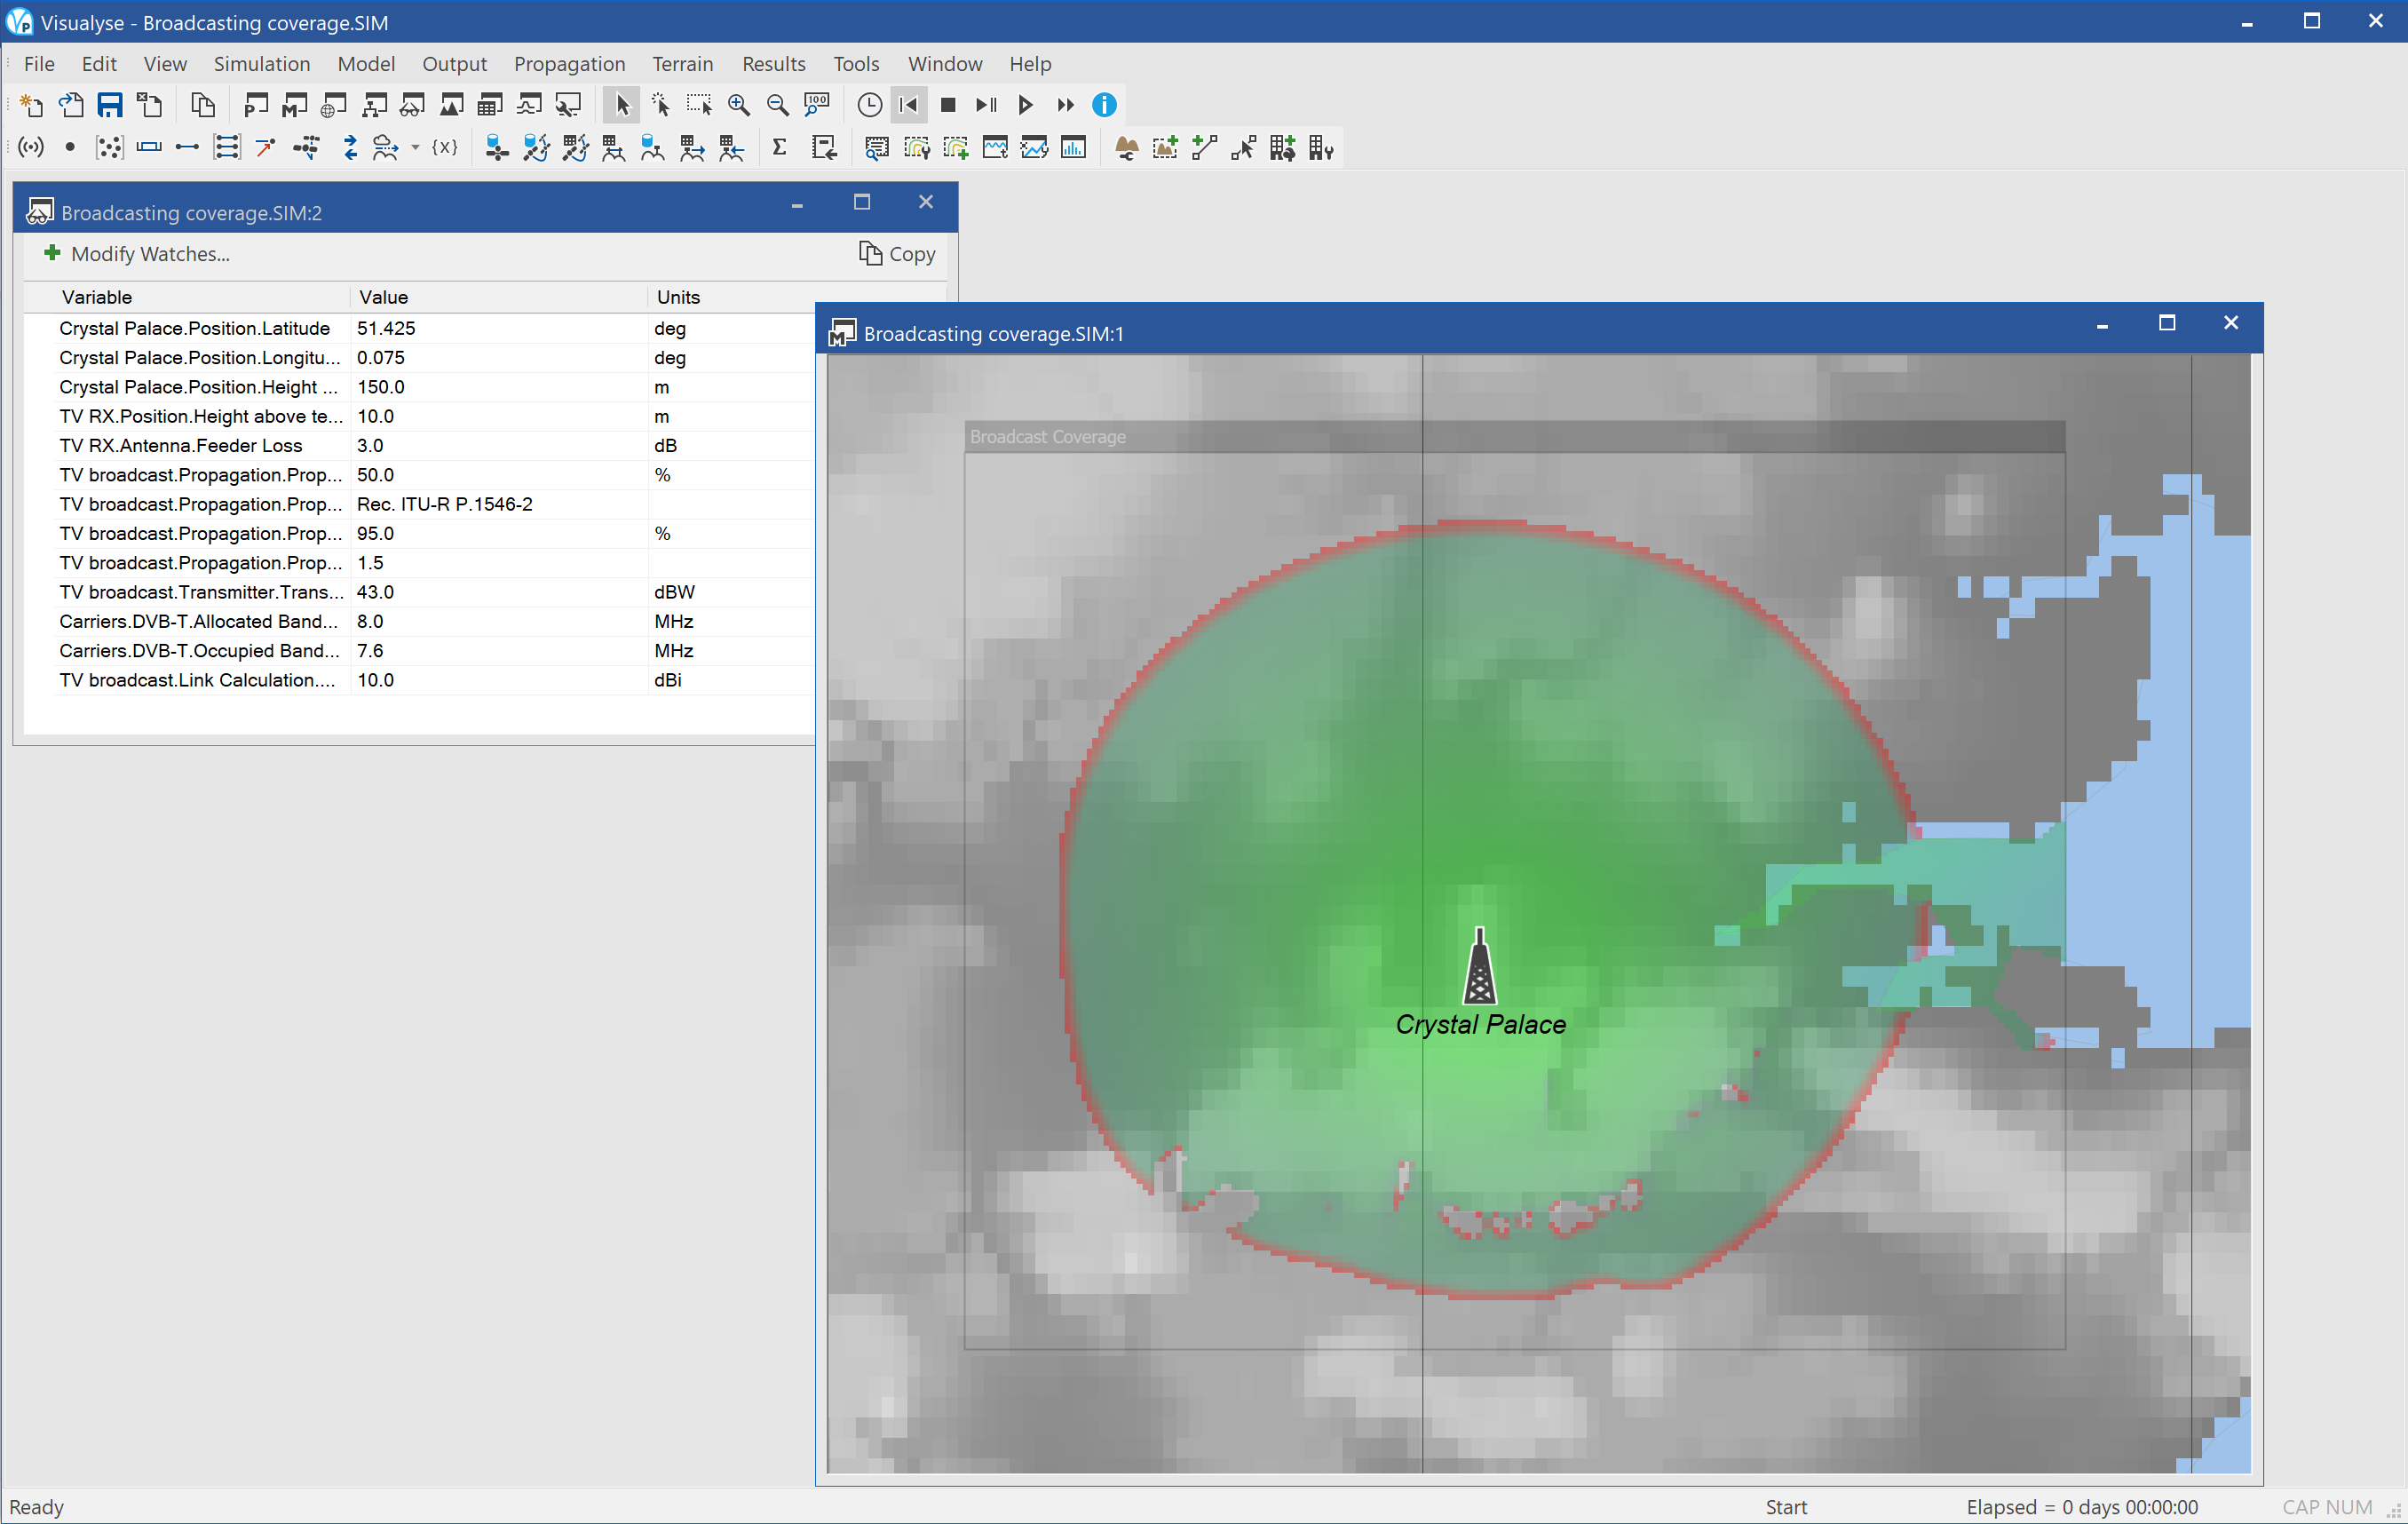
This example shows the coverage of a DTT broadcasting station in the London area. A transmitter of 43 dBW is providing TV services to fixed receivers, with coverage predicted using ITU-R Rec.P.1546.
The screen shot shows two views open:
- Mercator view (right) showing the terrain database used, the location of the transmitter, and the predicted coverage area
- Watch window (top left) showing the key parameters of the prediction, namely:
| Crystal Palace.Position.Latitude | 51.425 | deg |
| Crystal Palace.Position.Longitude | 0.075 | deg |
| Crystal Palace.Position.Height above terrain | 150 | m |
| TV RX.Position.Height above terrain | 10 | m |
| TV RX.Antenna.Feeder Loss | 3 | dB |
| ITU Rec P1546.Wanted Time Percentage | 50 | % |
| ITU Rec P1546.Revision Number | P.1546-2 | |
| ITU Rec P1546.Percentage Of Locations | 95 | % |
| ITU Rec P1546.K | 1.5 | |
| TV broadcast.Transmitter.Transmit Power | 43 | dBW |
| Carriers.DVB-T.Allocated Bandwidth | 8 | MHz |
| Carriers.DVB-T.Occupied Bandwidth | 7.6 | MHz |
| TV broadcast.Link Calculation.Receive Peak Gain | 10 | dBi |
Mobile Coverage
| Action: | None |
| Modules used: | Terrain |
| Terrain regions: | Surrey |
| Frequency band: | S |
| Station types: | Fixed, Mobile |
| Propagation models: | ITU-R Rec.P.452 |
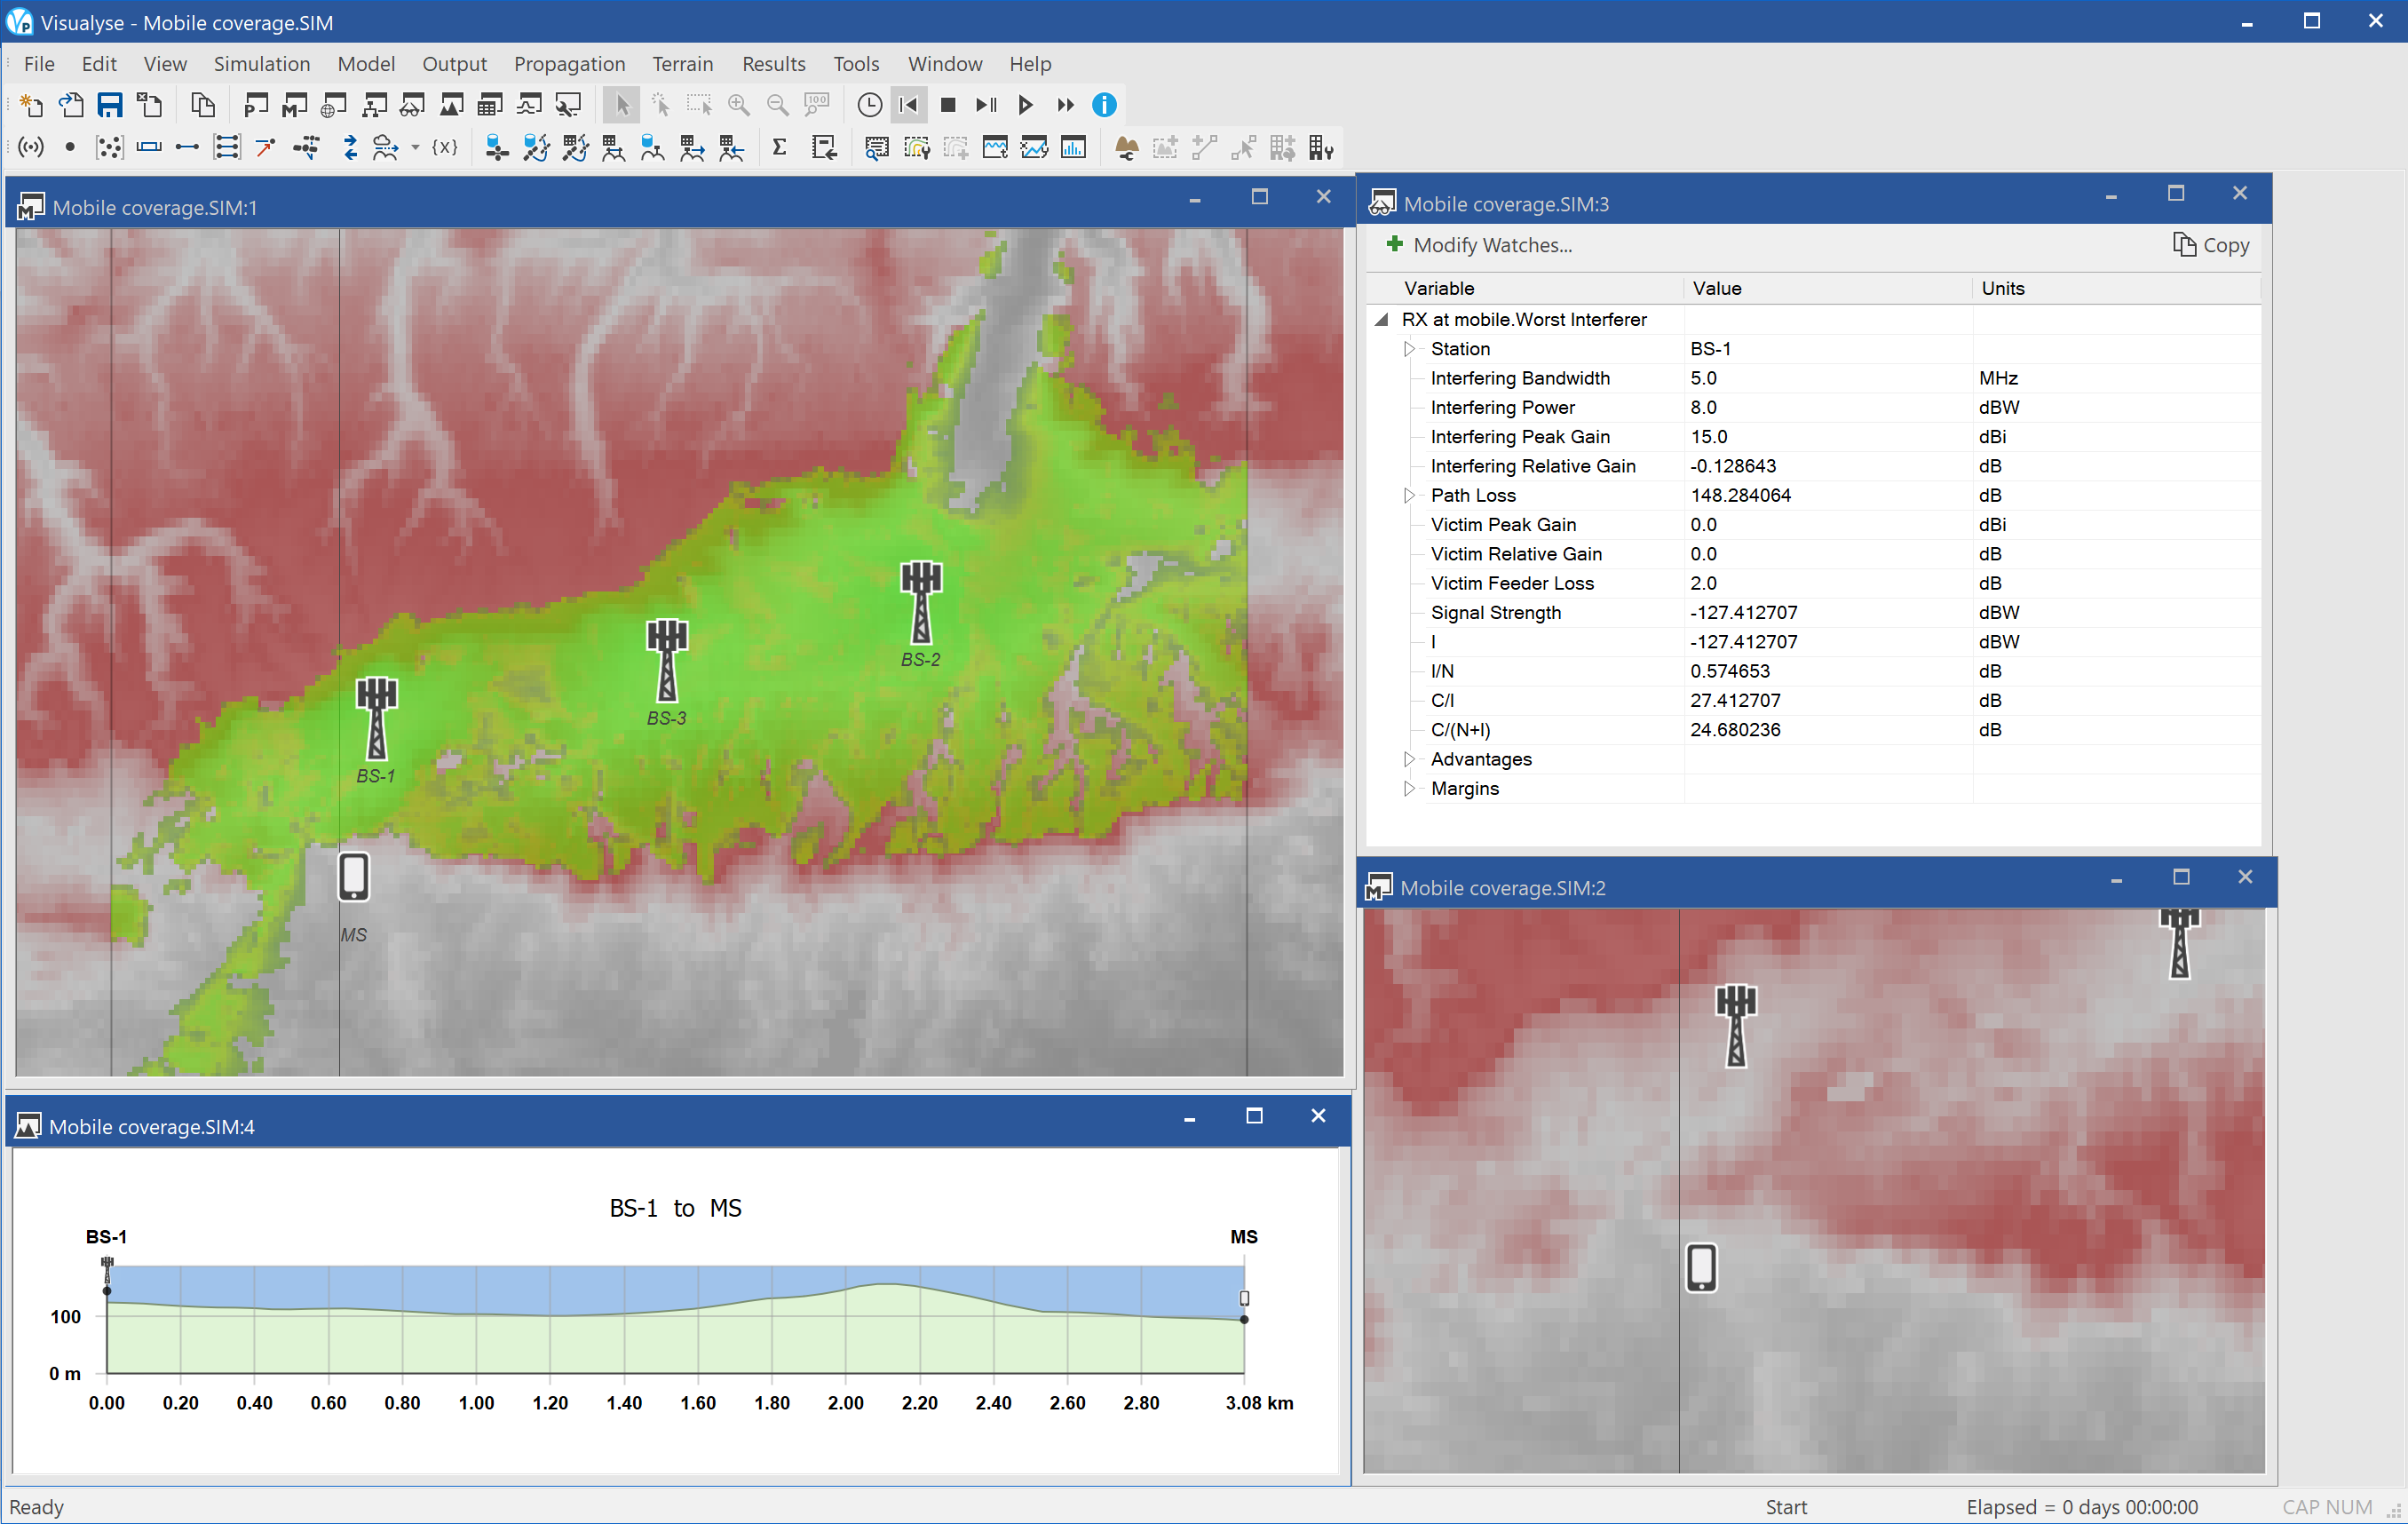
This example shows Visualyse Professional predicting the coverage a 3G network taking into account the effects of terrain and clutter.
A number of base stations have been deployed along the M25 motorway south of London to provide voice and data services to vehicles i.e. using macro cells. These are transmitting at 2.1 GHz and the coverage uses ITU-R Rec.P.452 to predict signal levels and to take into account terrain. A land-use database is also used to derive clutter loss predictions at each pixel.
The Area Analysis feature of Visualyse Professional has been used to show where there is usable signal strength according to the following scale:
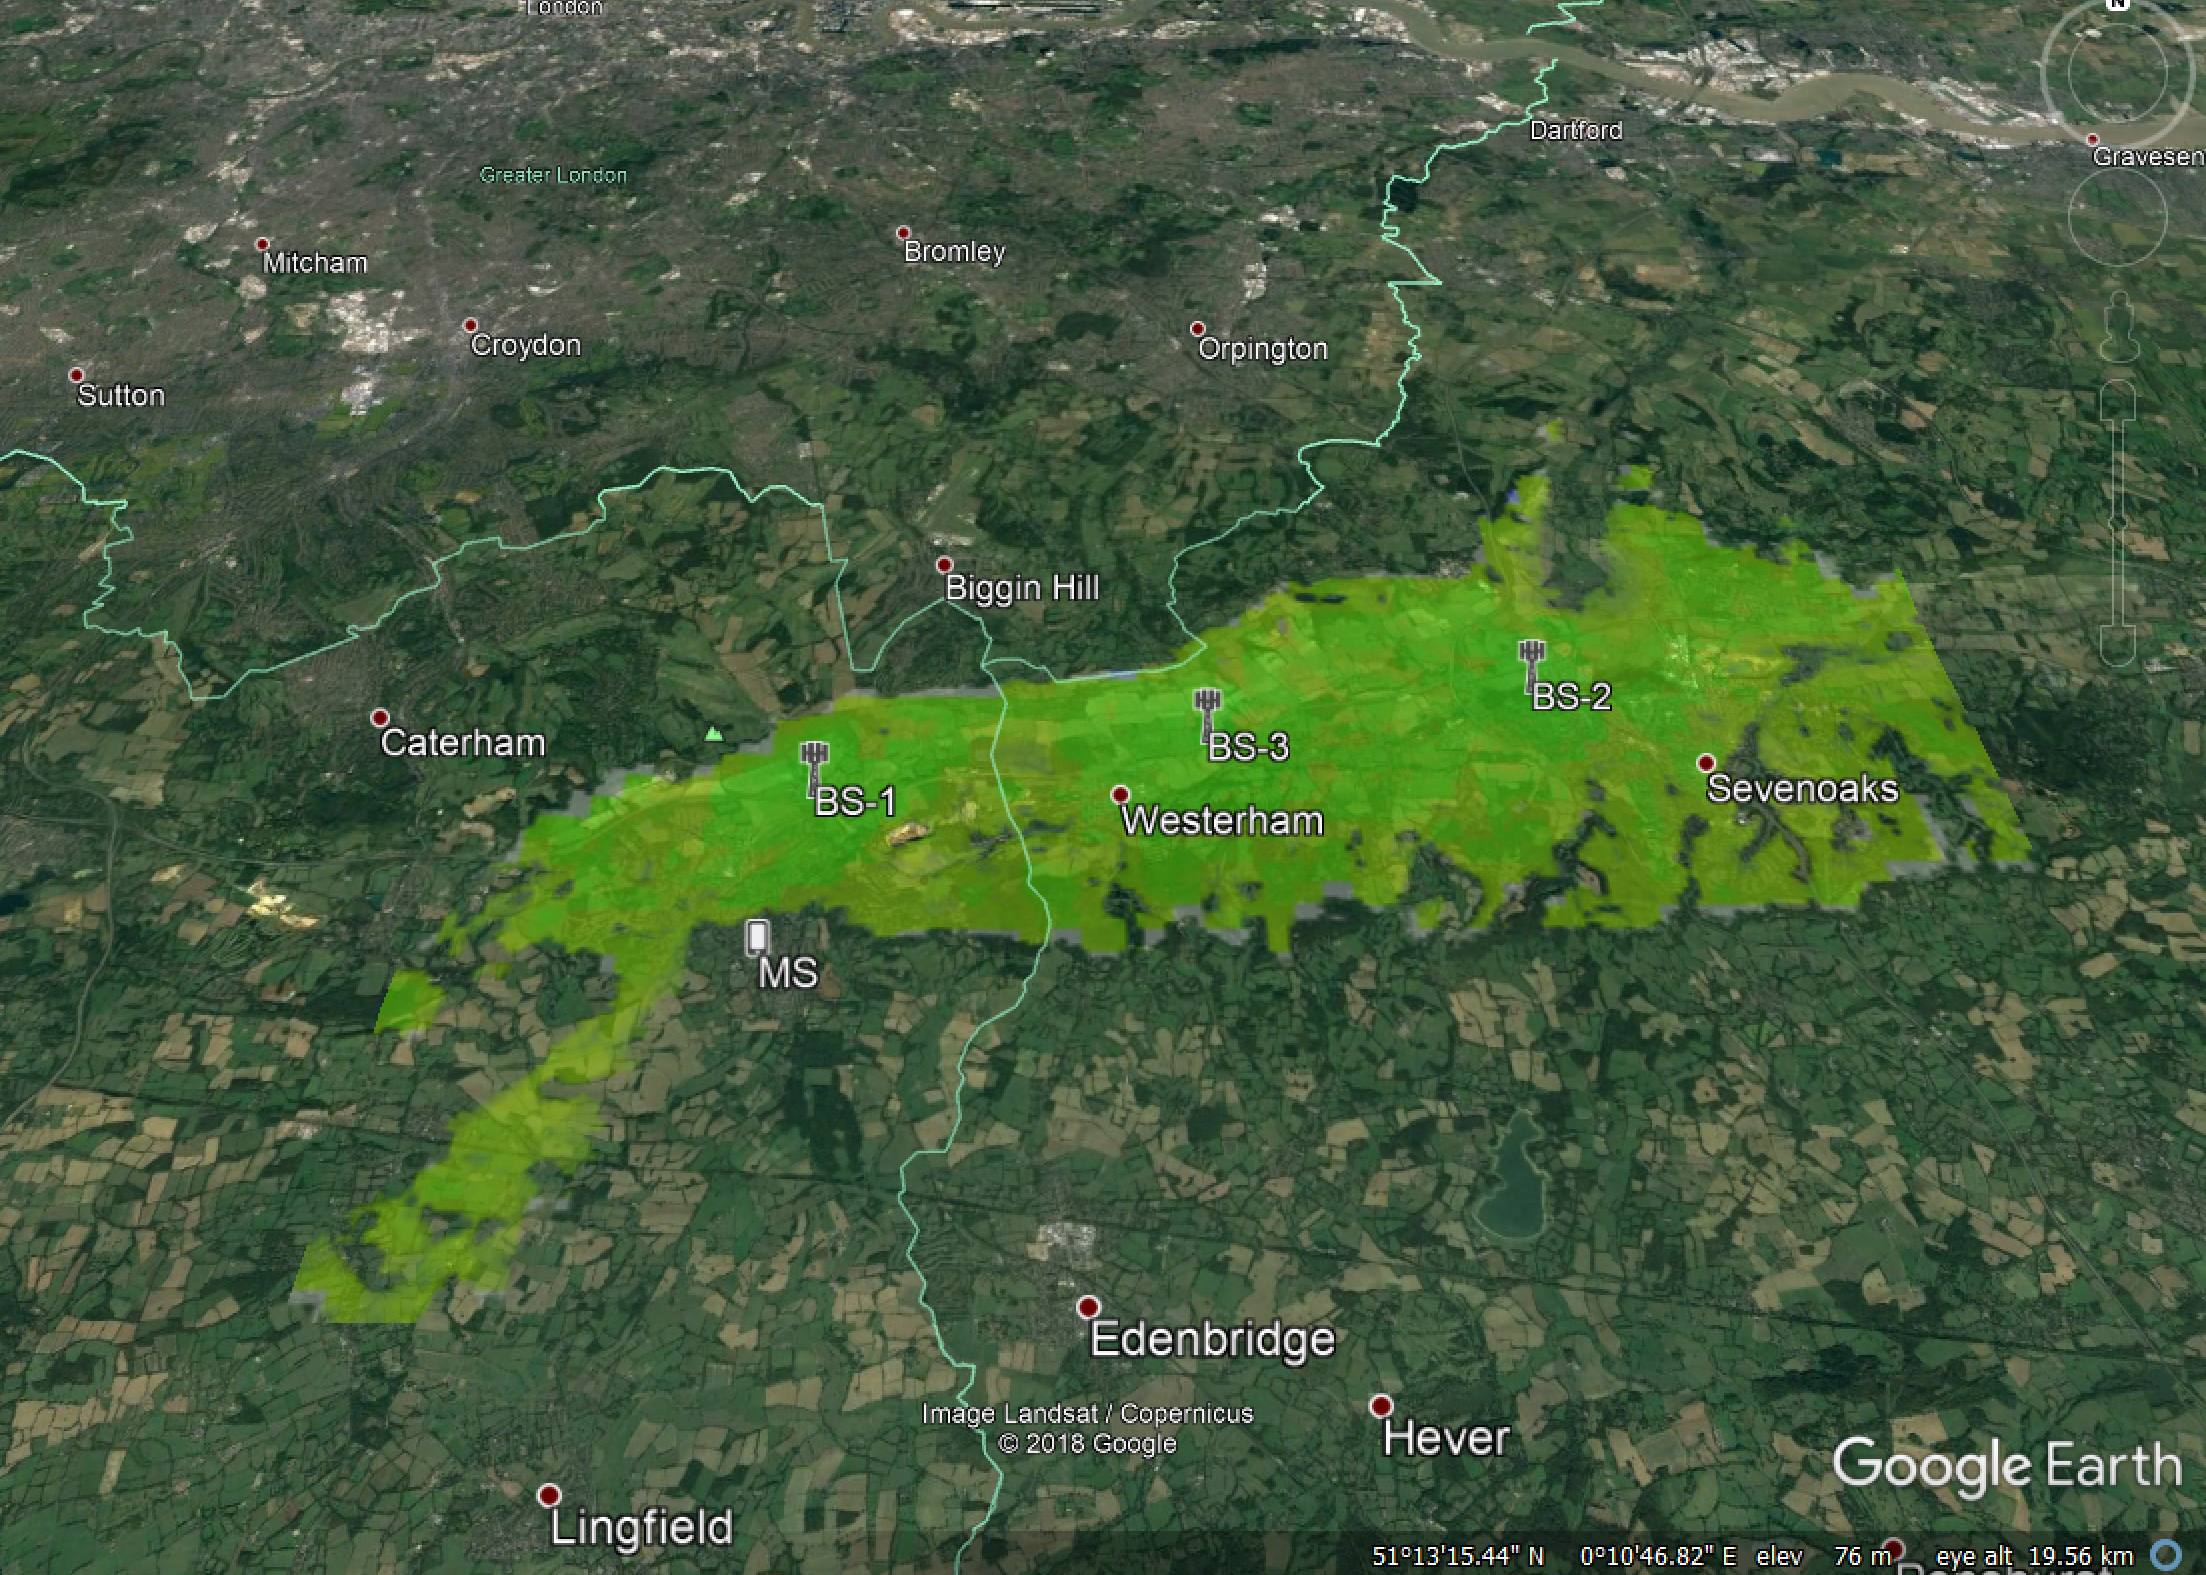
It can be seen that coverage is generally better along the route of the motorway where the terrain is less hilly and there are little buildings. The coverage is reduced where there are hills or within the town of Sevenoaks where there is greater clutter loss.
The screen shot above has four windows open:
- Mercator view (top left) showing the locations in green where there is coverage above the threshold level, the station locations, and a tinge of red to show terrain data
- Path profile view (bottom left) showing the terrain path between one of the base stations and the test location of the mobile
- Watch window (top right) showing the link budget from the base station to the test location of the mobile as used in the path profile
- Mercator view (bottom right) showing in more detail the map around the town of Sevenoaks with an overlay of colour representing land use where yellow = suburban, pink = buildings etc.
PMR Coverage
| Action: | None |
| Modules used: | Terrain |
| Terrain regions: | Crawley |
| Frequency band: | VHF |
| Station types: | Fixed, Mobile |
| Propagation models: | ITU-R Rec.P.1546 |
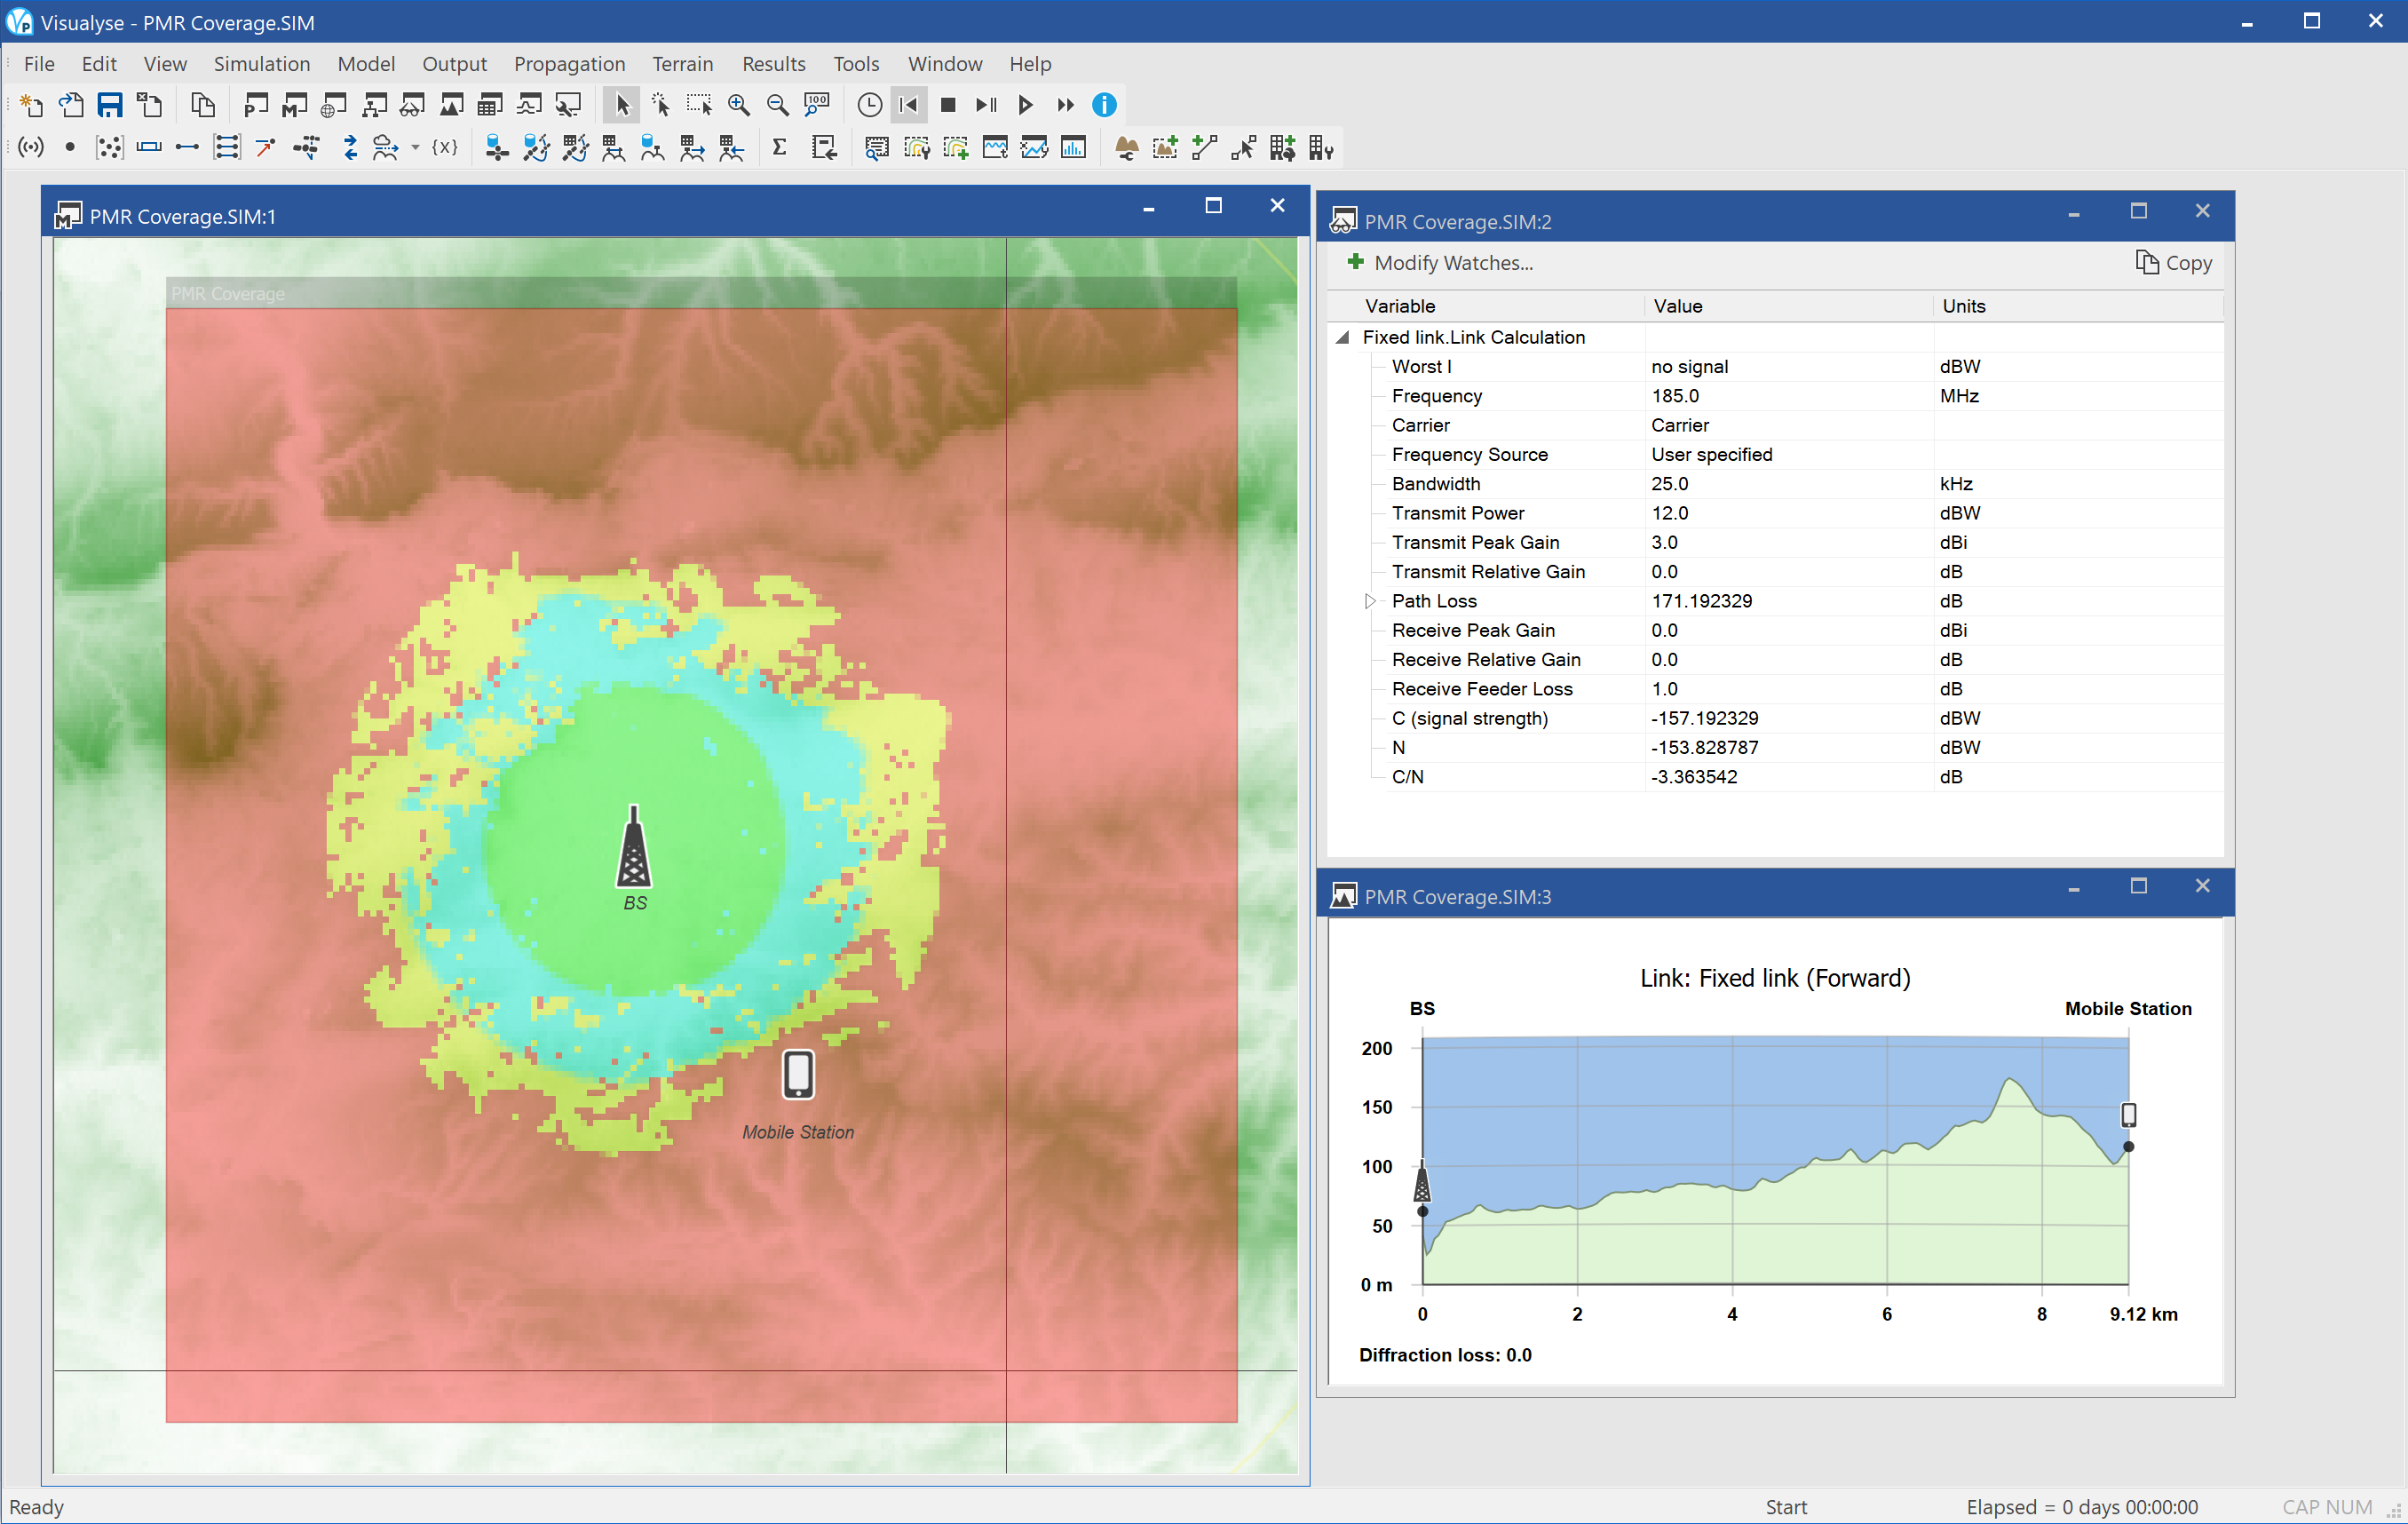
This example shows the calculation of the coverage of a Private Mobile Radio (PMR) network based around the UK airport of Gatwick. A base station is transmitting at a power of 12 dBW i.e. about 15.8 Watts within a 25 kHz voice channel at a frequency of 185 MHz.
Visualyse Professional is being used to identify where the C/N is above various thresholds, namely:
Green: C/N > 20 dB
Blue: 20 dB > C/N > 10 dB
Yellow: 10 dB > C/N > 5 dB
Red: 5 dB > C/N
The prediction is based upon use of ITU-R Rec.P.1546 using a terrain and land-use database.
In the screen shot above there are four windows open:
- Mercator map view (left) showing the locations of the base station and a test point for the mobile station, the prediction of the C/N at each pixel, and a map of the area.
- Watch window (top right) showing the link budget for the base station to mobile station path
- Path profile view (middle right) showing the path through the terrain between the base and mobile stations
- Mercator map view (bottom right) showing in more detail the map around the town of Dorking, with the land-use colour coded and overlaid on top
Note that due to copyright restrictions, the clutter and map overlay might not be available in all installations.
The prediction could also be exported to Google Earth, as in the figure below.
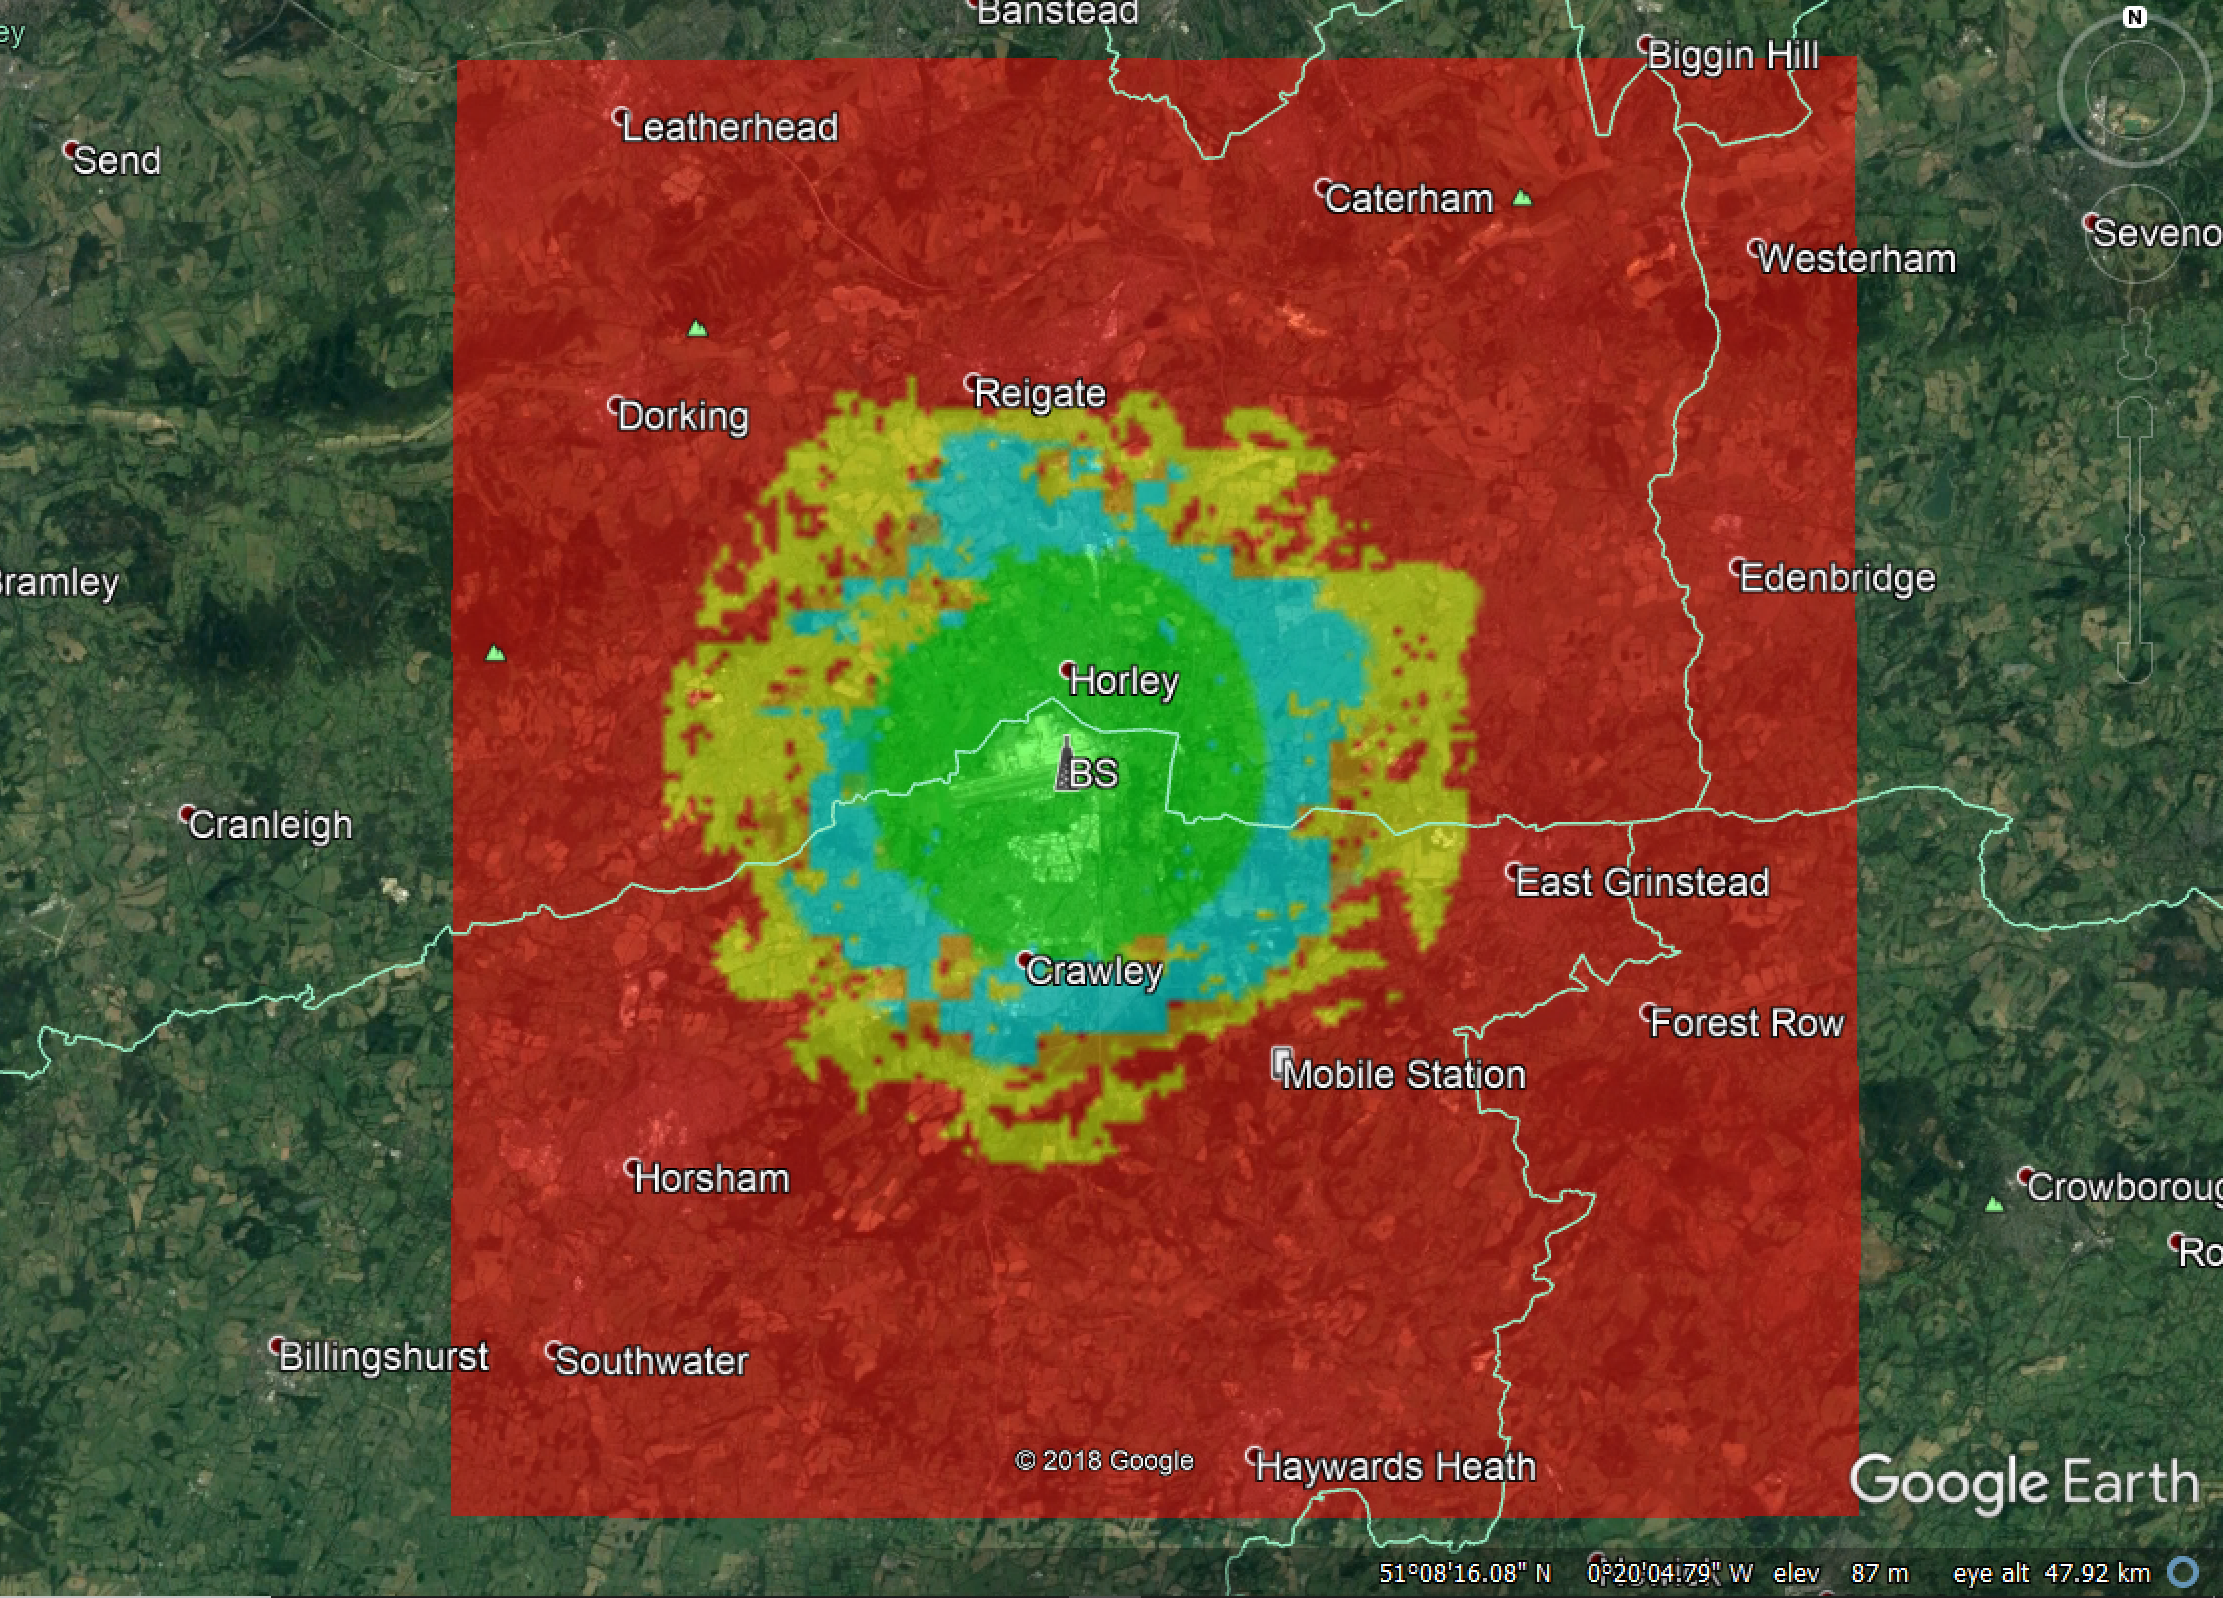
Non-GSO Satellites
This section contains the following examples:
- Non-GSO Satellites
- Data relay satellite end to end route with handover
- Galileo with HEO overlay
- GSO to non-GSO Area Analysis
- HEO into GSO DL at Ku band
- MSS Feeder links with spot beams
- Non-GSO MSS and Galileo
- PFD at GSO from NGSO MSS Feeder link
- Teledesic & Celestri with constellation avoidance
- Teledesic 840 satellite constellation
Data relay satellite end to end route with handover
| Action: | Run simulation |
| Modules used: | None |
| Terrain regions: | None |
| Frequency band: | Ka |
| Station types: | GSO Satellite, Non-GSO Satellite, Earth Stations |
| Propagation models: | Free space, ITU-R Rec.P.676 |
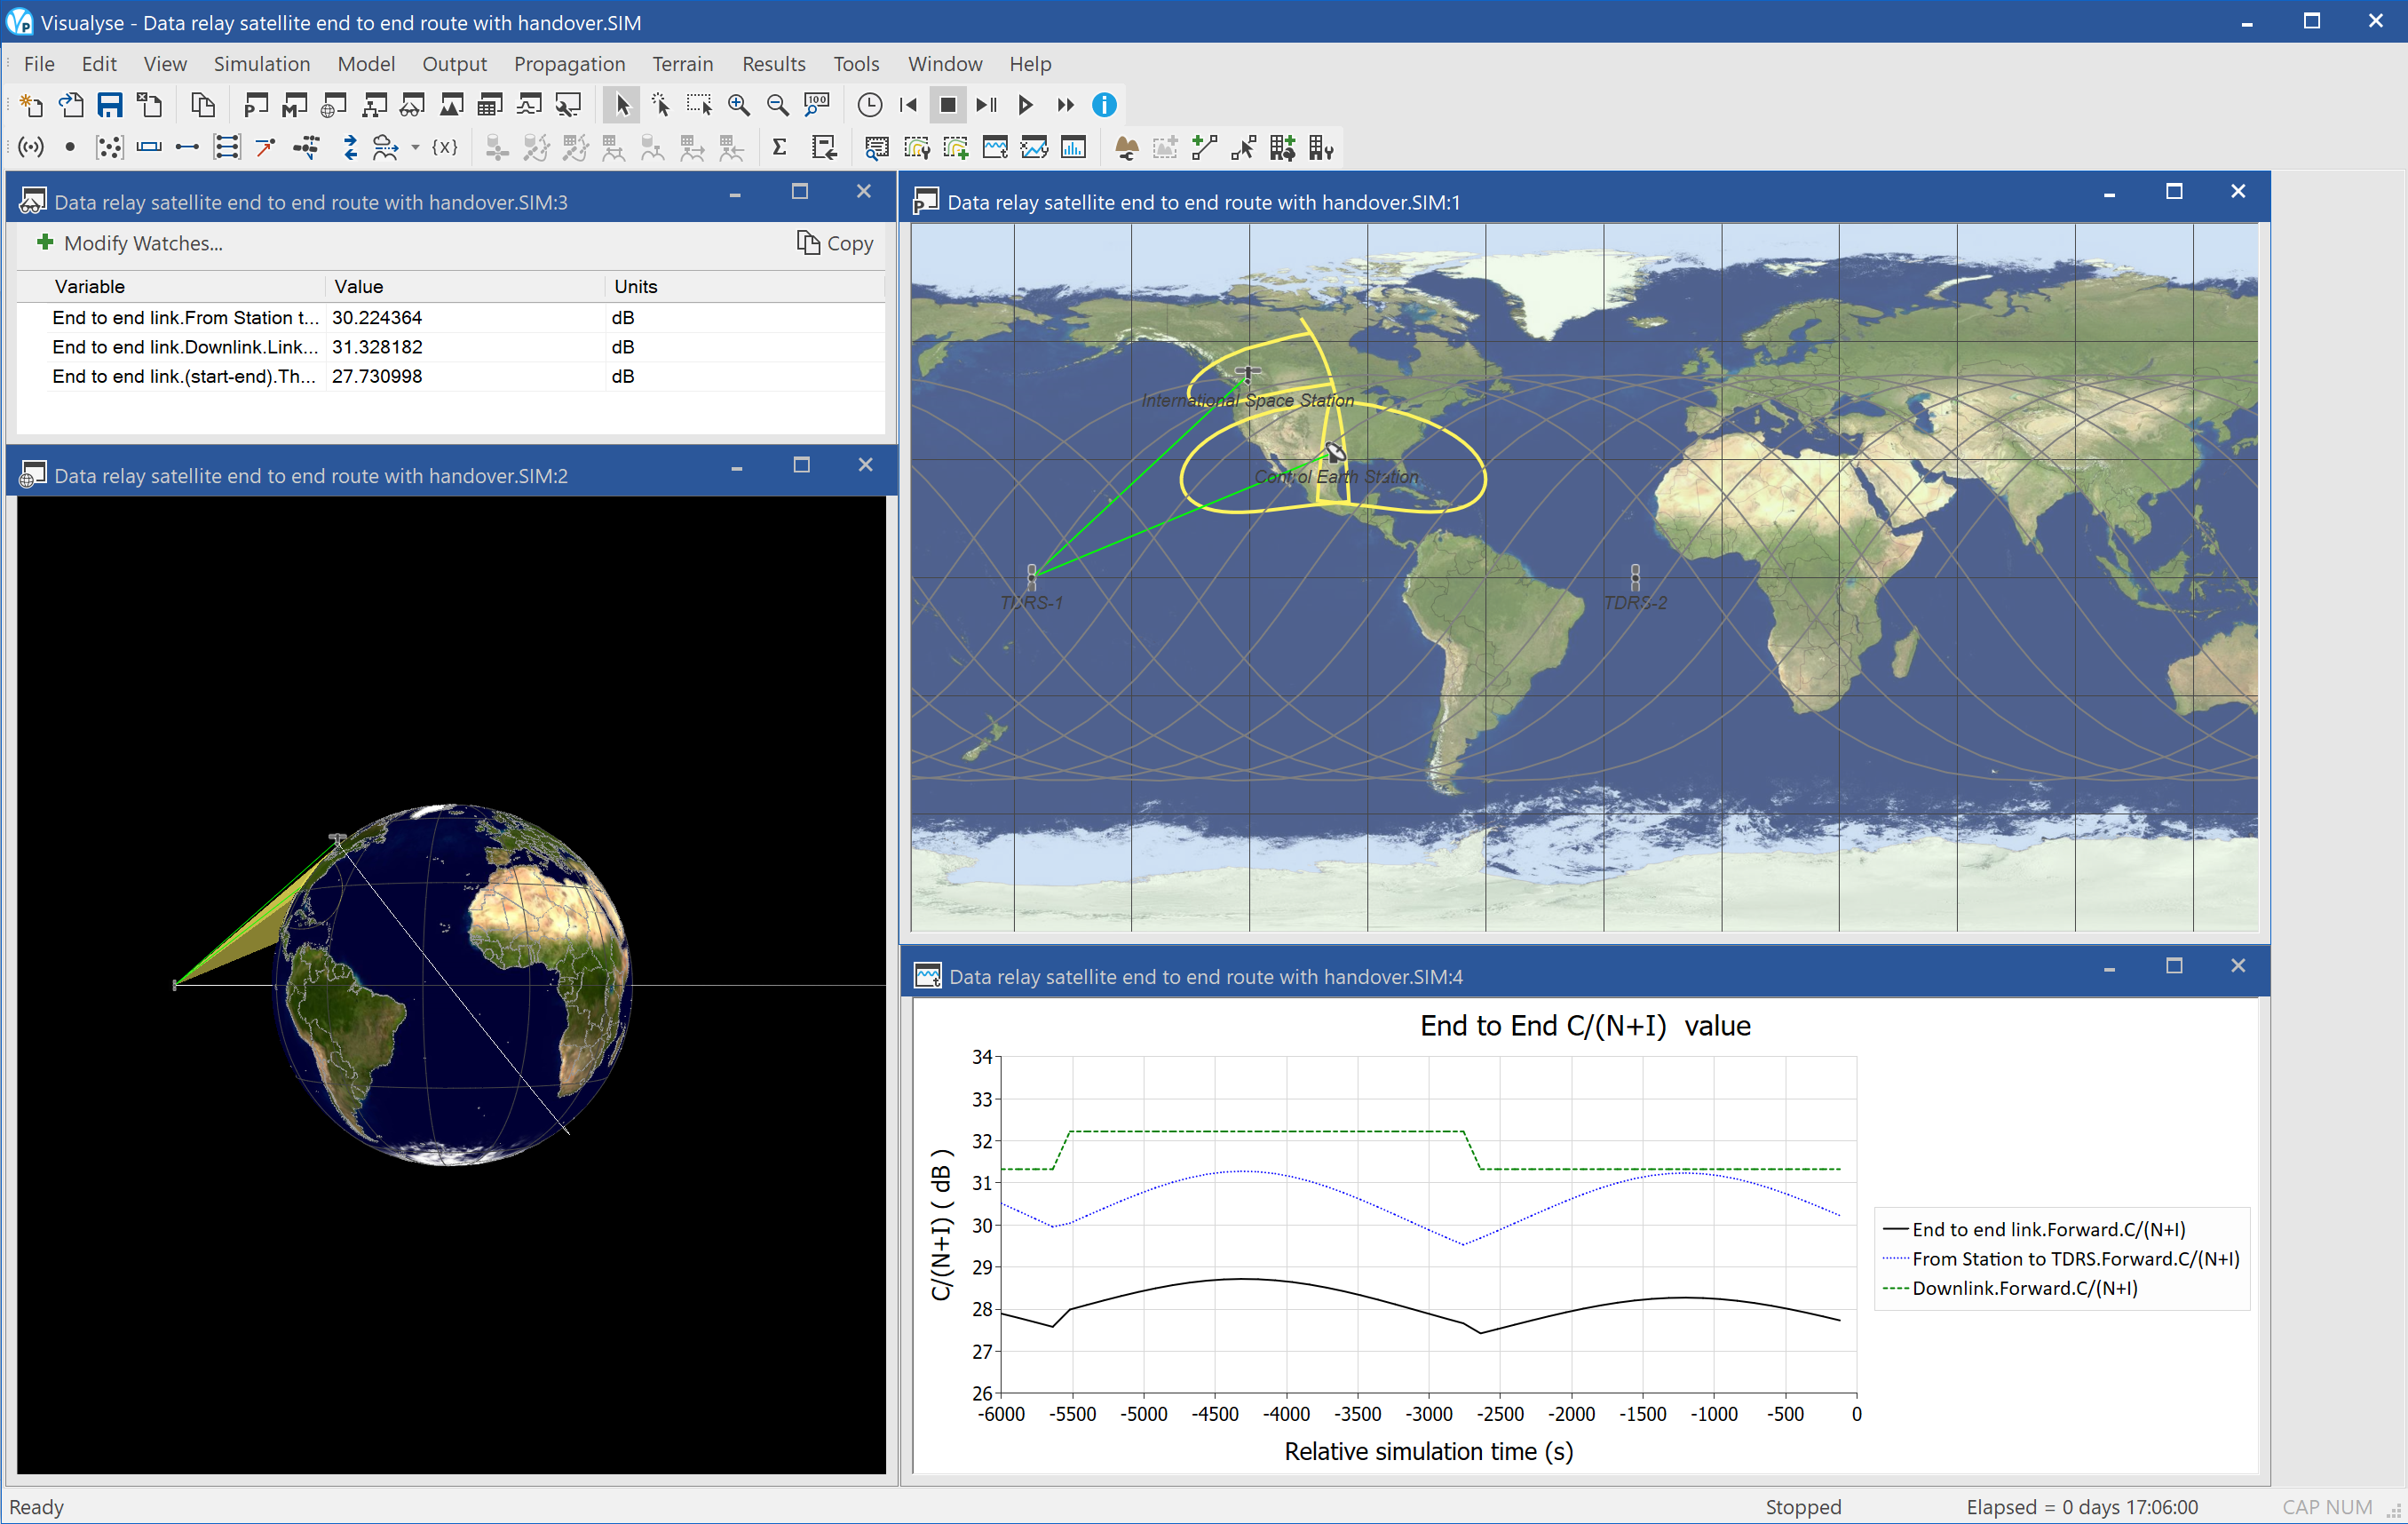
This example shows an end to end communications link from a non-GSO satellite (in this case the international space station) to its control centre, routing via one of two data relay satellites.
The space station selects which of the two tracking satellites to use and then the link down to the earth station starts at the end point of that link. As the space station moves the tracking satellite to use changes.
Visualyse Professional derives the C/N for each of the individual hops and also the end to end link assuming a bent-pipe or non-regenerative payload so that the overall performance can be calculated using thermal addition. The earth-space paths include the attenuation due to atmospheric gases in ITU-R Rec.P.676.
The simulation is configured with four views open:
- Plate Carrée map view (top right) showing the location of the two tracking satellites, the ground station, the current location of the space station, the ground track of the space station, and the footprints of the various beams.
- 3D view (bottom left) showing the view from one of the tracking satellites of the world, the space station, its orbit, the other tracking satellite, and the ground station.
- Quick graph (bottom right) showing how the C/N of each of the links and of the end to end link varies with time
- Watch window (top left) showing the value of each of the C/Ns shown in the Quick graph.
Galileo with HEO overlay
| Action: | Run Simulation |
| Modules used: | None |
| Terrain regions: | None |
| Frequency band: | S |
| Station types: | GSO Satellite, Non-GSO Satellite, Earth Stations |
| Propagation models: | Free space |
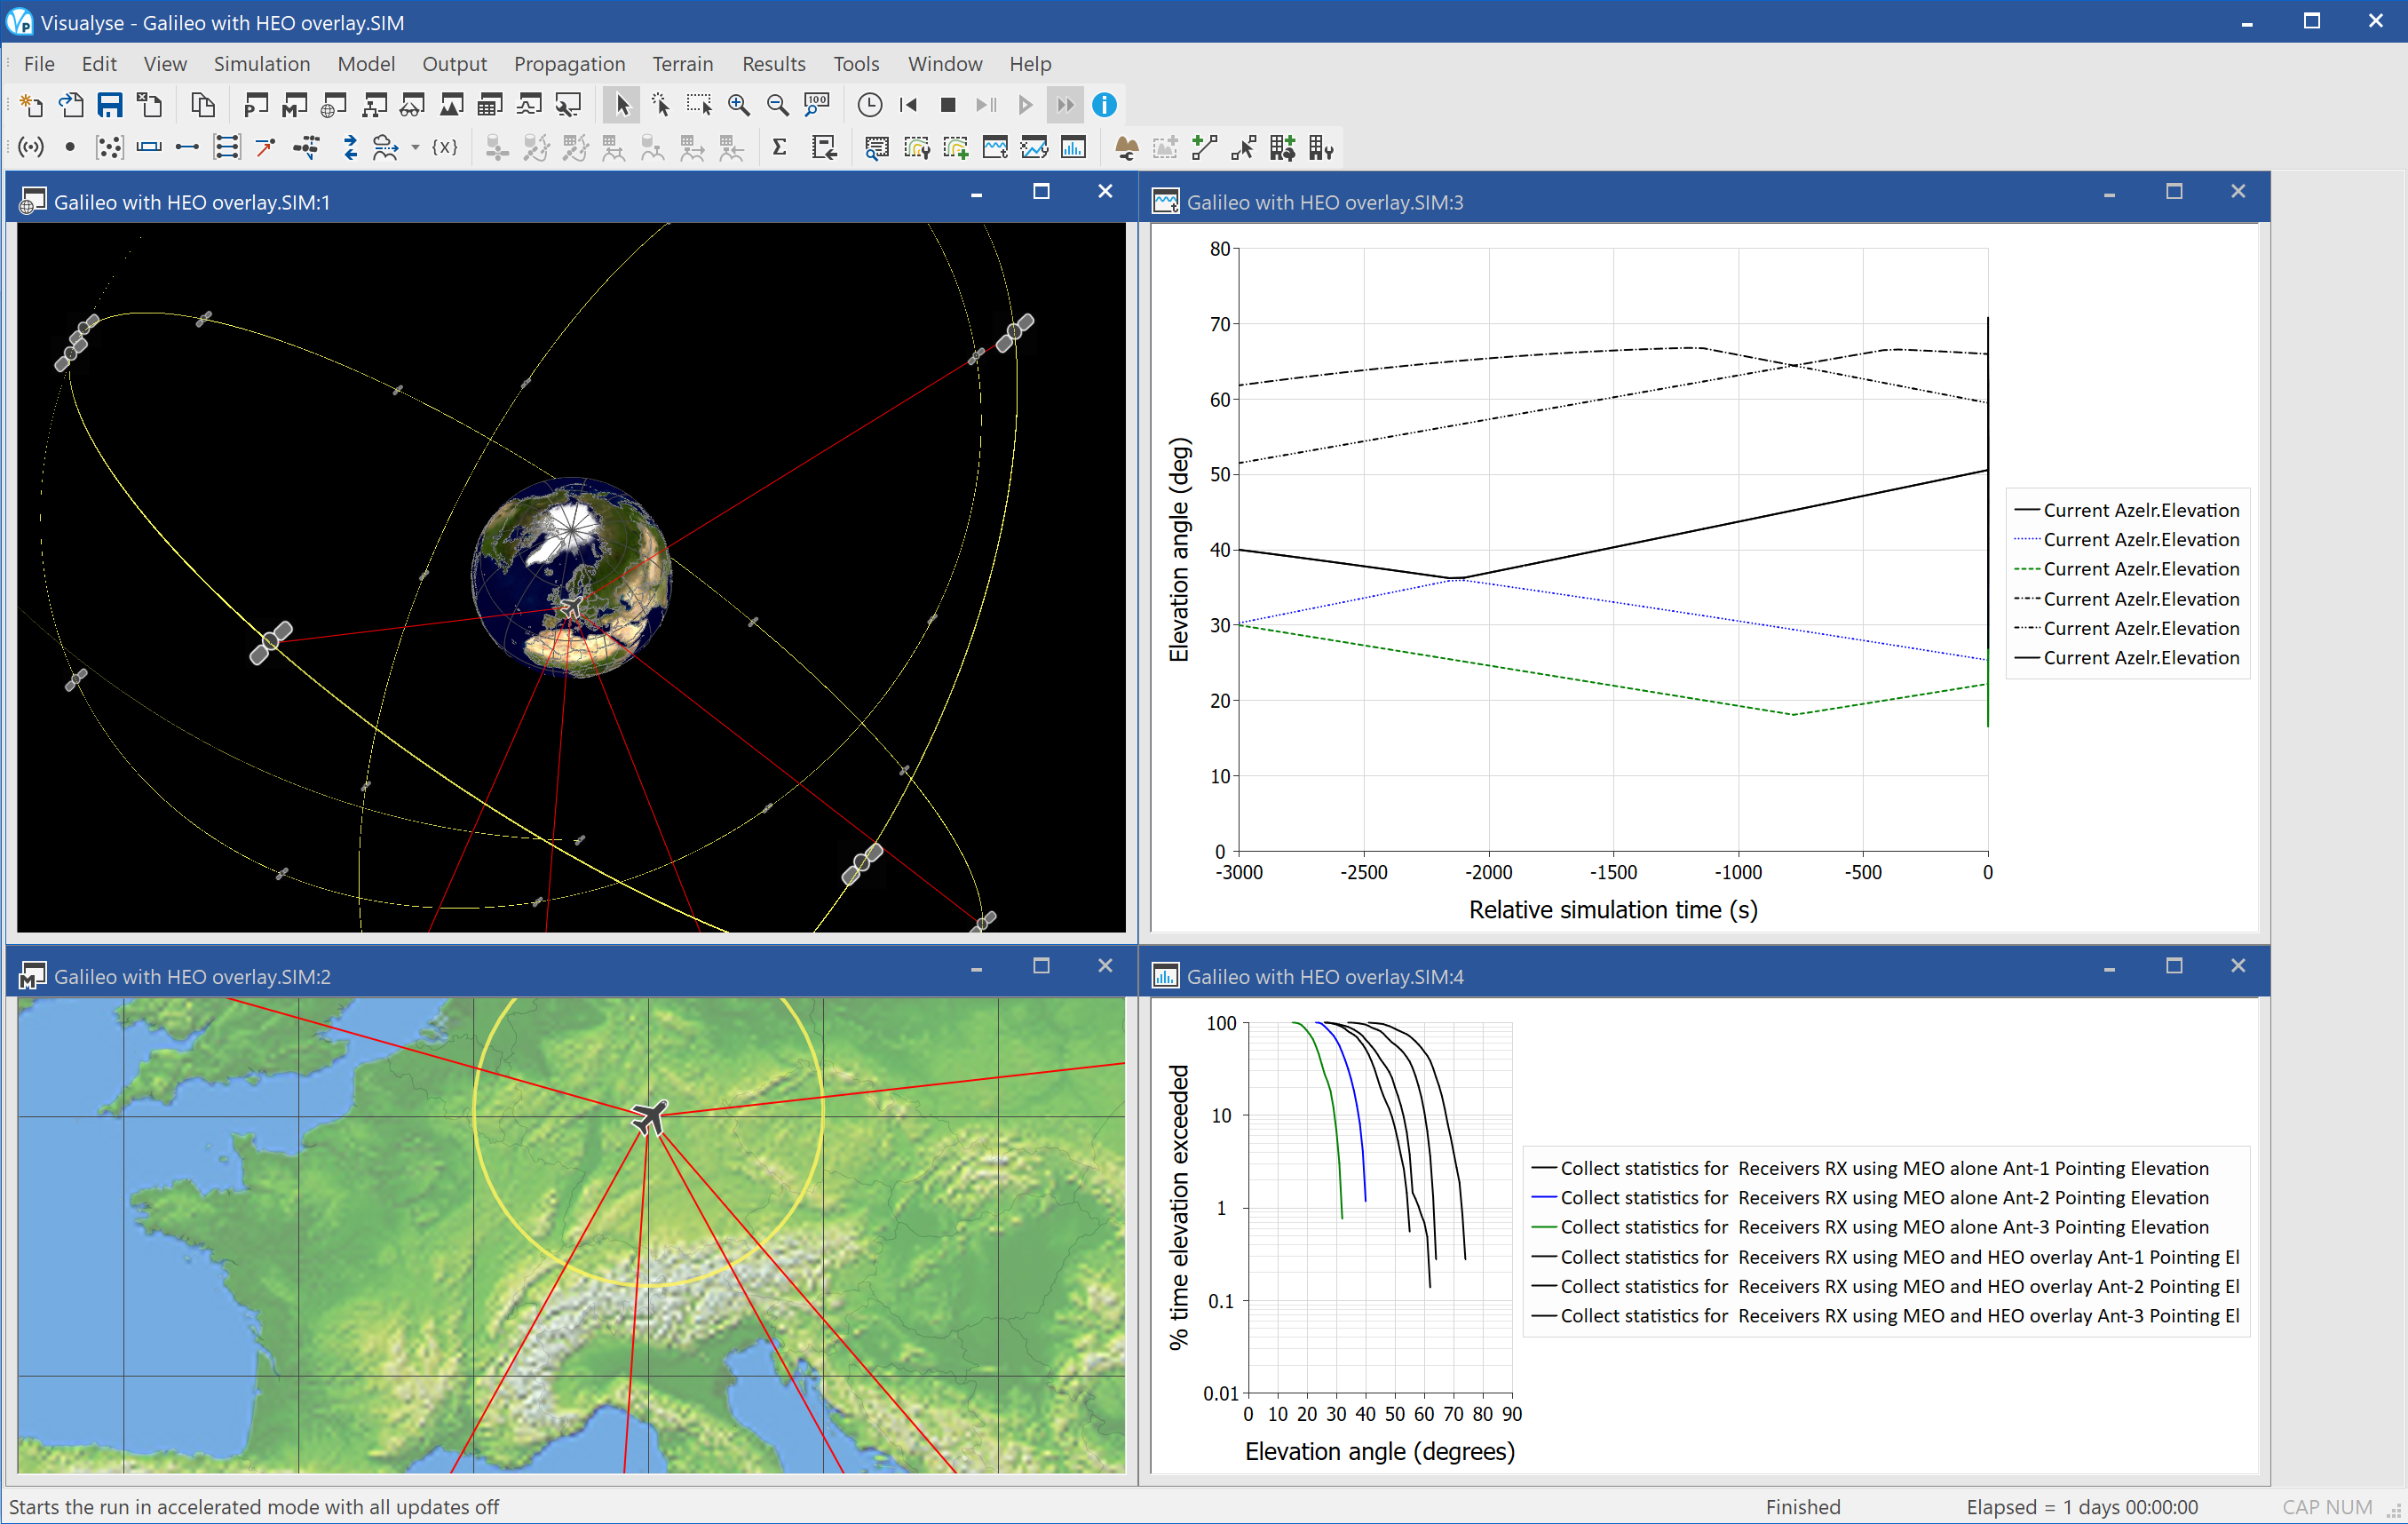
This example file shows analysis of the increase in availability for navigation services of using an overlay from a constellation of satellites in Highly Eccentric Orbits (HEO).
One objective of navigation services is to be able to provide accurate location within urban areas. However in cities there are likely to be tall buildings that obscure the view of the sky and hence reduce the number of satellites that can be used to gain a fix. This effect can be compensated by adding more satellites to the constellation, but this can be inefficient as any coverage improvement is by nature global.
One possible solution that can bring significant coverage improvements without requiring large numbers of additional satellites is to provide an overlay using a HEO constellation.
The screen shot above shows one such analysis, with four windows open:
- 3D view (top left), showing a Galileo like constellation of 27 satellites in circular orbit plus 4 in a HEO constellation, the ground tracks, and location of test point. The view point is that of one of the HEO satellites, so will change during the simulation as the satellite moves
- Mercator view (bottom left) showing the test point location in more detail and the various links to highest N satellites
- Quick graph (top right) showing how the elevation angle of the tracked satellite varies with time
- Statistics graph (bottom right) showing the cumulative distribution function of the links to the four highest circular orbit satellites and two highest HEO satellites
It can be seen that both of the two highest HEO satellites are typically better than the 2nd highest circular orbit constellation satellite. Hence using a HEO overlay would significantly improve the statistics of the best four satellites required to make a fix.
GSO to non-GSO Area Analysis
| Action: | Select 3D view and rotate Earth |
| Modules used: | None |
| Terrain regions: | None |
| Frequency band: | Ka |
| Station types: | GSO Satellite, Non-GSO Satellite, Earth Stations |
| Propagation models: | Free space, ITU-R Rec.P.676 |
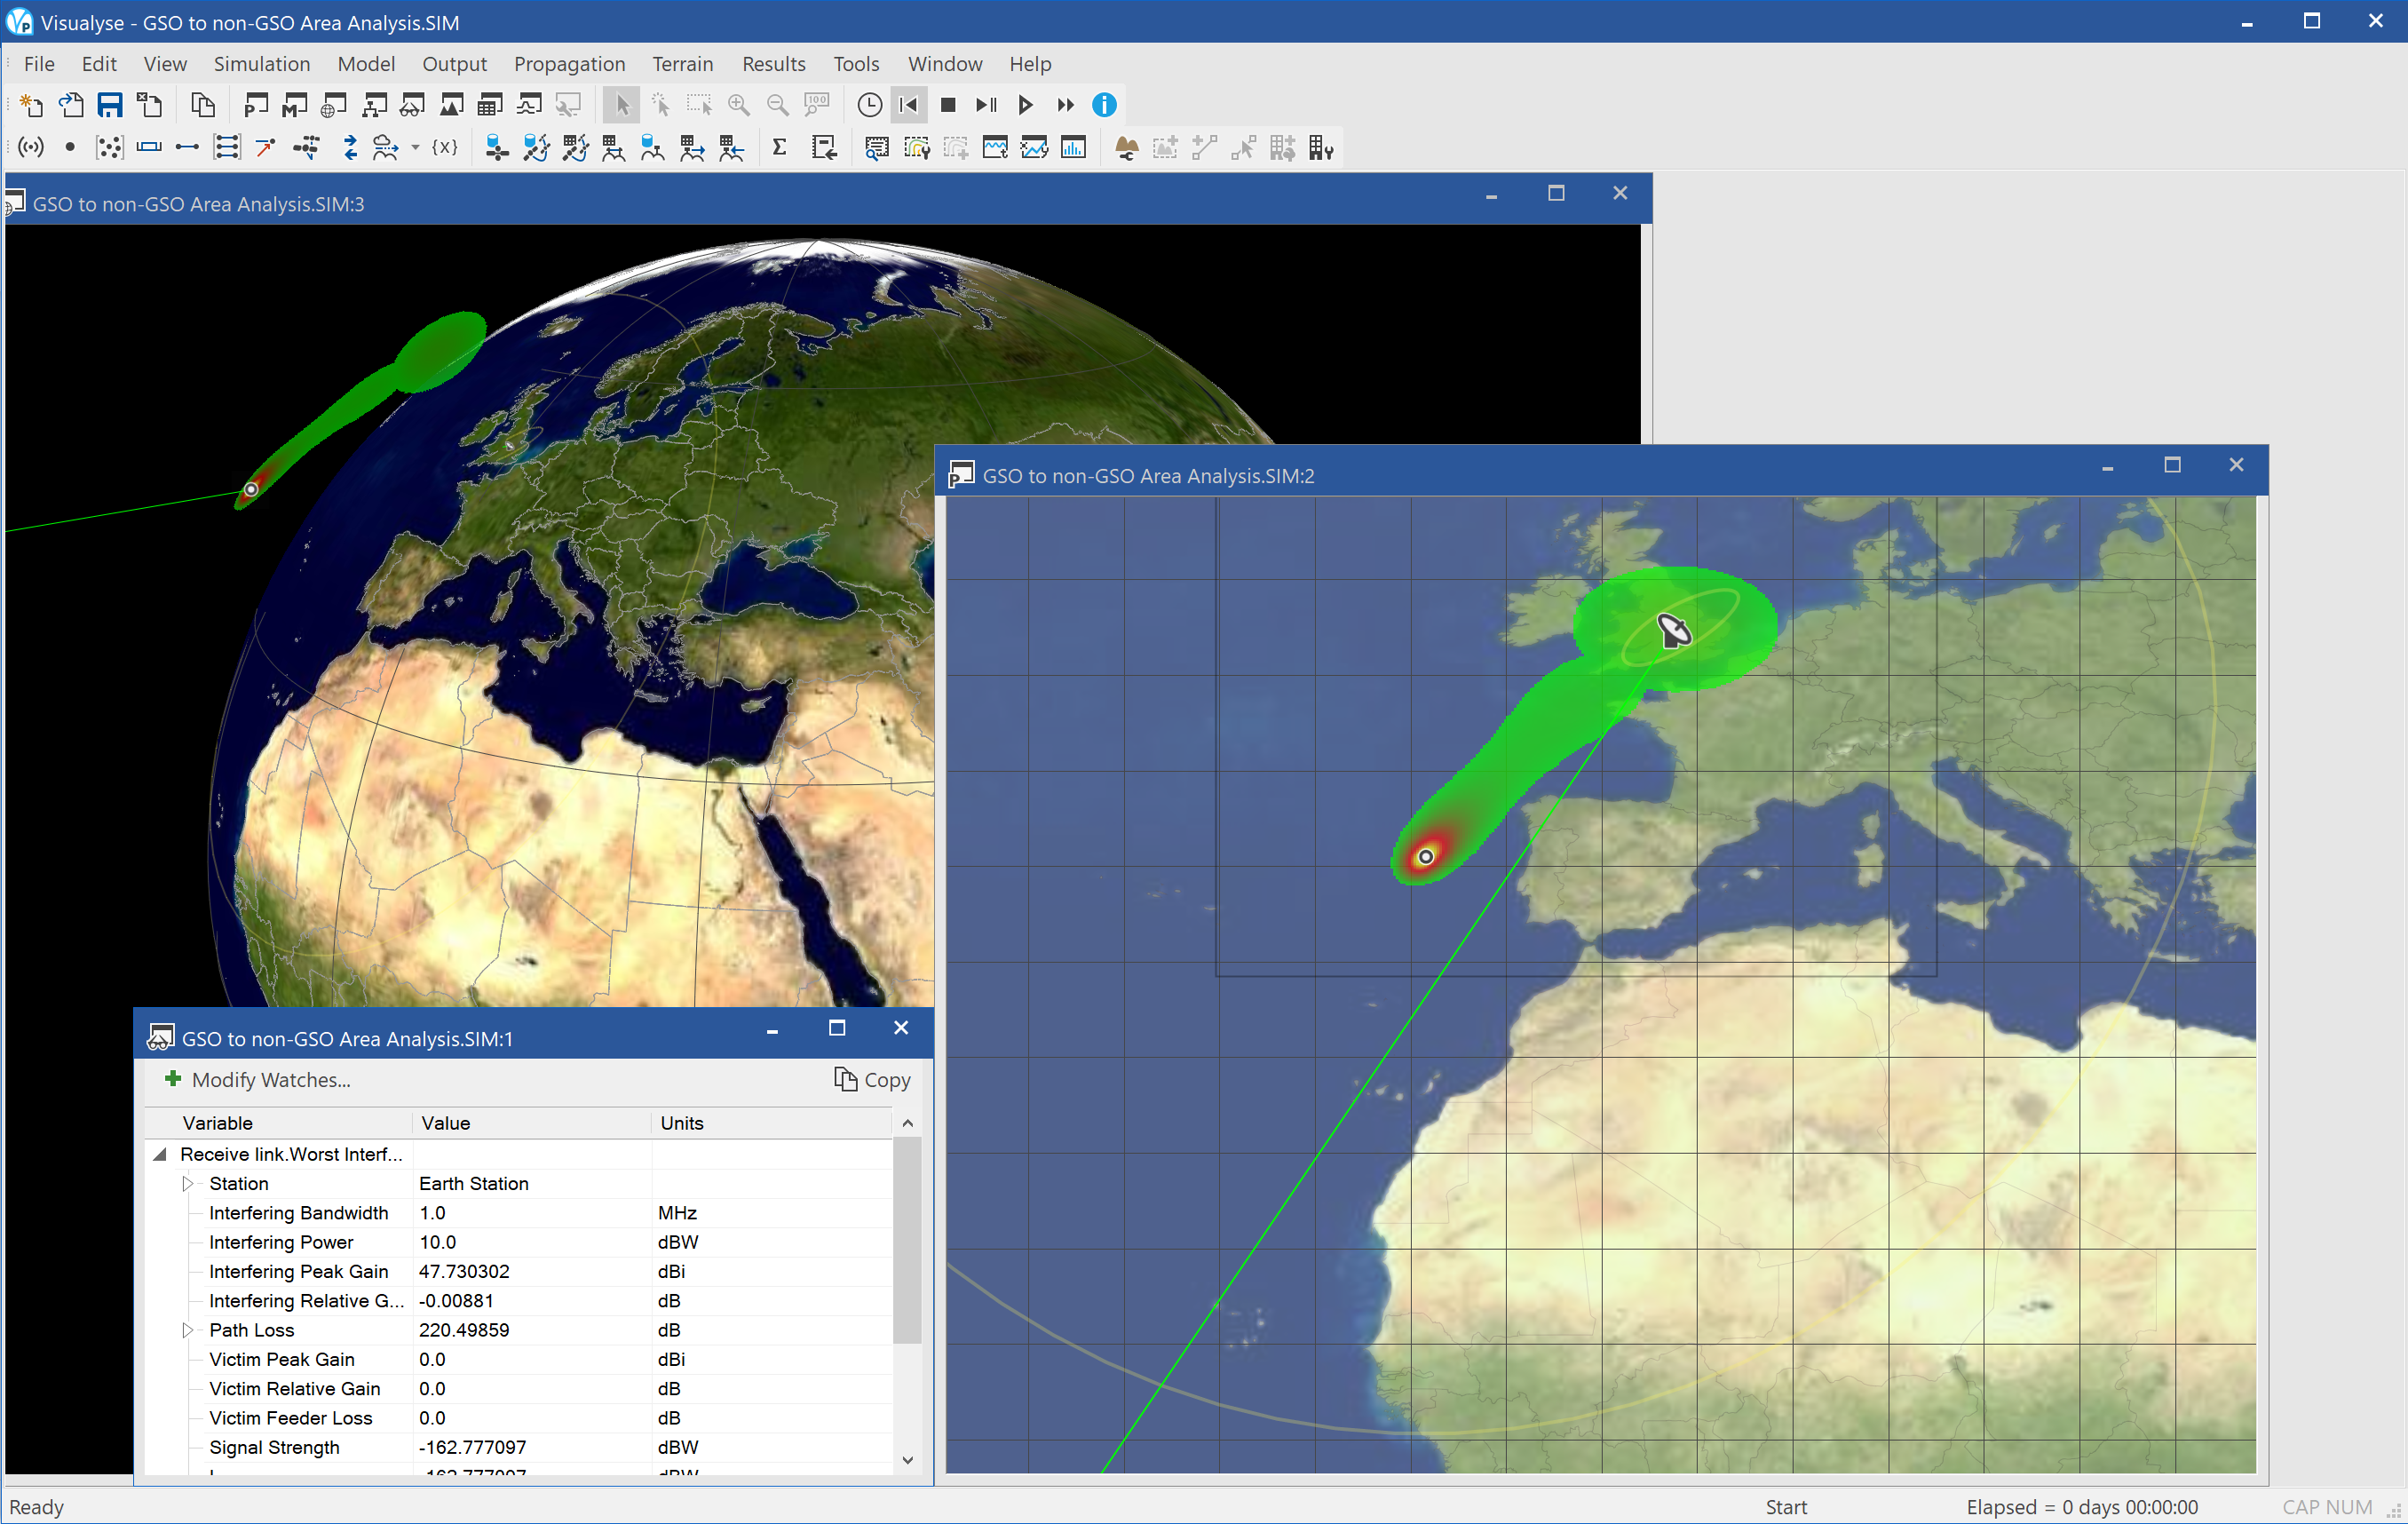
This example shows an analysis of where a non-GSO satellite would suffer interference from a GSO network’s uplink. An earth station in the UK is transmitting to a GSO satellite on the same frequency as a non-GSO network. The question is where about in the non-GSO satellite’s orbit it would suffer interference.
In this simulation a “floating” Area Analysis has been created with a test point at the same height as the non-GSO satellite. The PFD generated by the earth station as measured at the non-GSO satellite is then displayed with colour scheme that shows the intensity. Two areas can be seen:
- in the main beam of the earth station just to the left of Spain
- over the UK, nearby to the earth station from side-lobe interference
The simulation is configured with three views open:
- Plate Carrée view (right) showing the satellite, the earth station, the test point (small circle), the beams and the area analysis
- Watch window (bottom left) showing the calculation of the interference into an isotropic receiver at the test point
- 3D view (top left, behind the other two windows), showing the view from space including the Area Analysis.
If you select the 3D view and then rotate the Earth by holding the left mouse button down and moving the mouse you can see how the Area Analysis floats in space.
HEO into GSO DL at Ku band
| Action: | Run simulation |
| Modules used: | None |
| Terrain regions: | None |
| Frequency band: | Ku |
| Station types: | GSO Satellite, Non-GSO Satellite, Earth Station |
| Propagation models: | Free space |
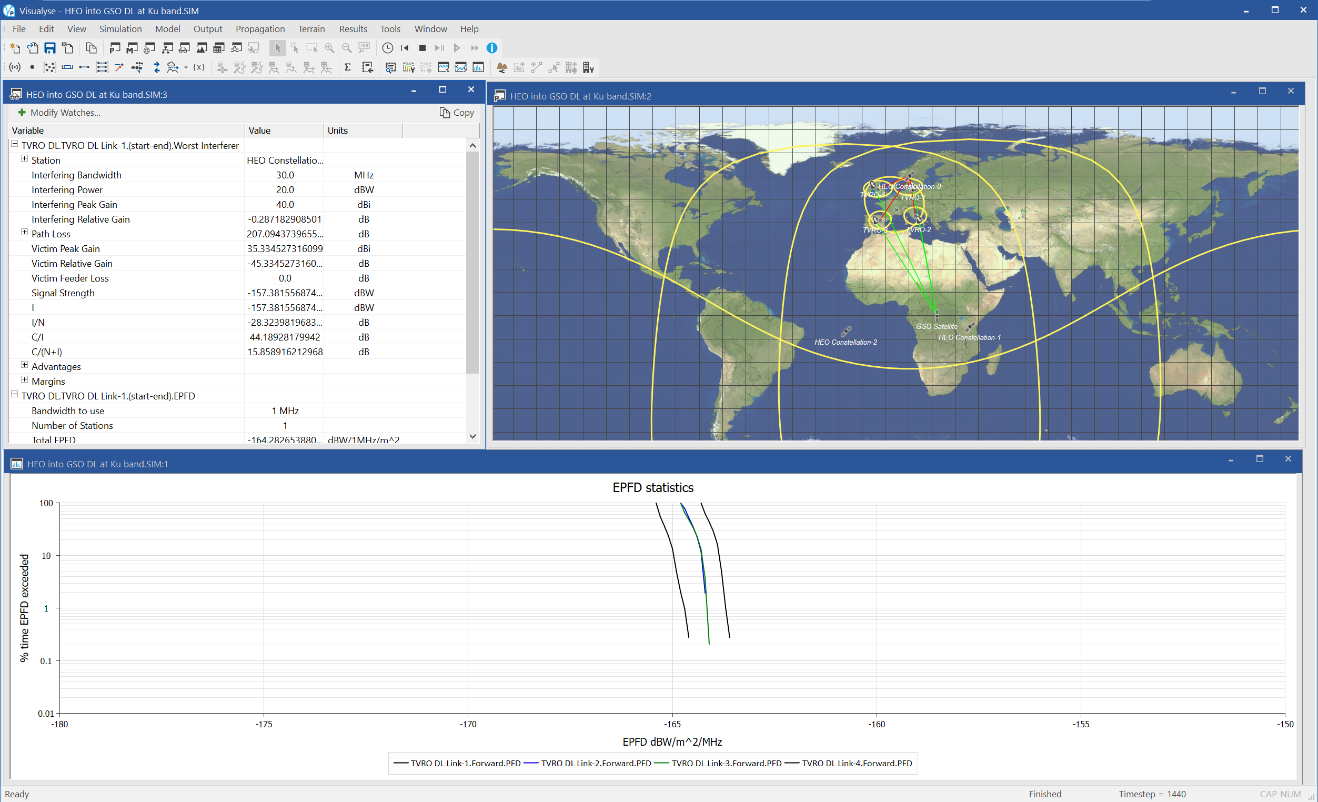
This example shows the calculation of Equivalent Power Flux Density (EPFD) from a constellation of satellites in Highly Elliptical Orbit (HEO) into a GSO satellite downlink.
The GSO satellite is providing satellite TV services to small aperture receive dishes – here modelled as 60cm dishes using the gain pattern in ITU-R Rec.S.465. It is operating in Ku band where transmissions from non-GSO networks, including HEO, must meet the EPFD limits in Article 22.2 of the Radio Regulations. In this case the limit is -160 dBW/m^2/40 kHz, or -174 dBW/m^2/MHz.
A HEO service proposes to operate co-frequency with the GSO network providing data services to VSATs using a series of spot beams to cover its main markets. The question is whether it would meet its requirements under 22.2.
The simulation has four test points at various extrema of the GSO satellite downlink, and constellation was built using the HEO Wizard with a tracking strategy to select the active satellite.
The screen shot above shows three windows:
- Plate Carrée view (right) showing the locations of the satellites, Earth stations, links, beams, and the ground tracks of the HEO satellites.
- Watch window (top left) showing the link budget from the HEO satellites into one of the test TV downlinks.
- Statistics graph (bottom left) showing the cumulative distribution function of the EPFD.
MSS Feeder links with spot beams
| Action: | Run simulation |
| Modules used: | None |
| Terrain regions: | None |
| Frequency band: | Ka |
| Station types: | Non-GSO Satellite, Earth Station |
| Propagation models: | Free space |
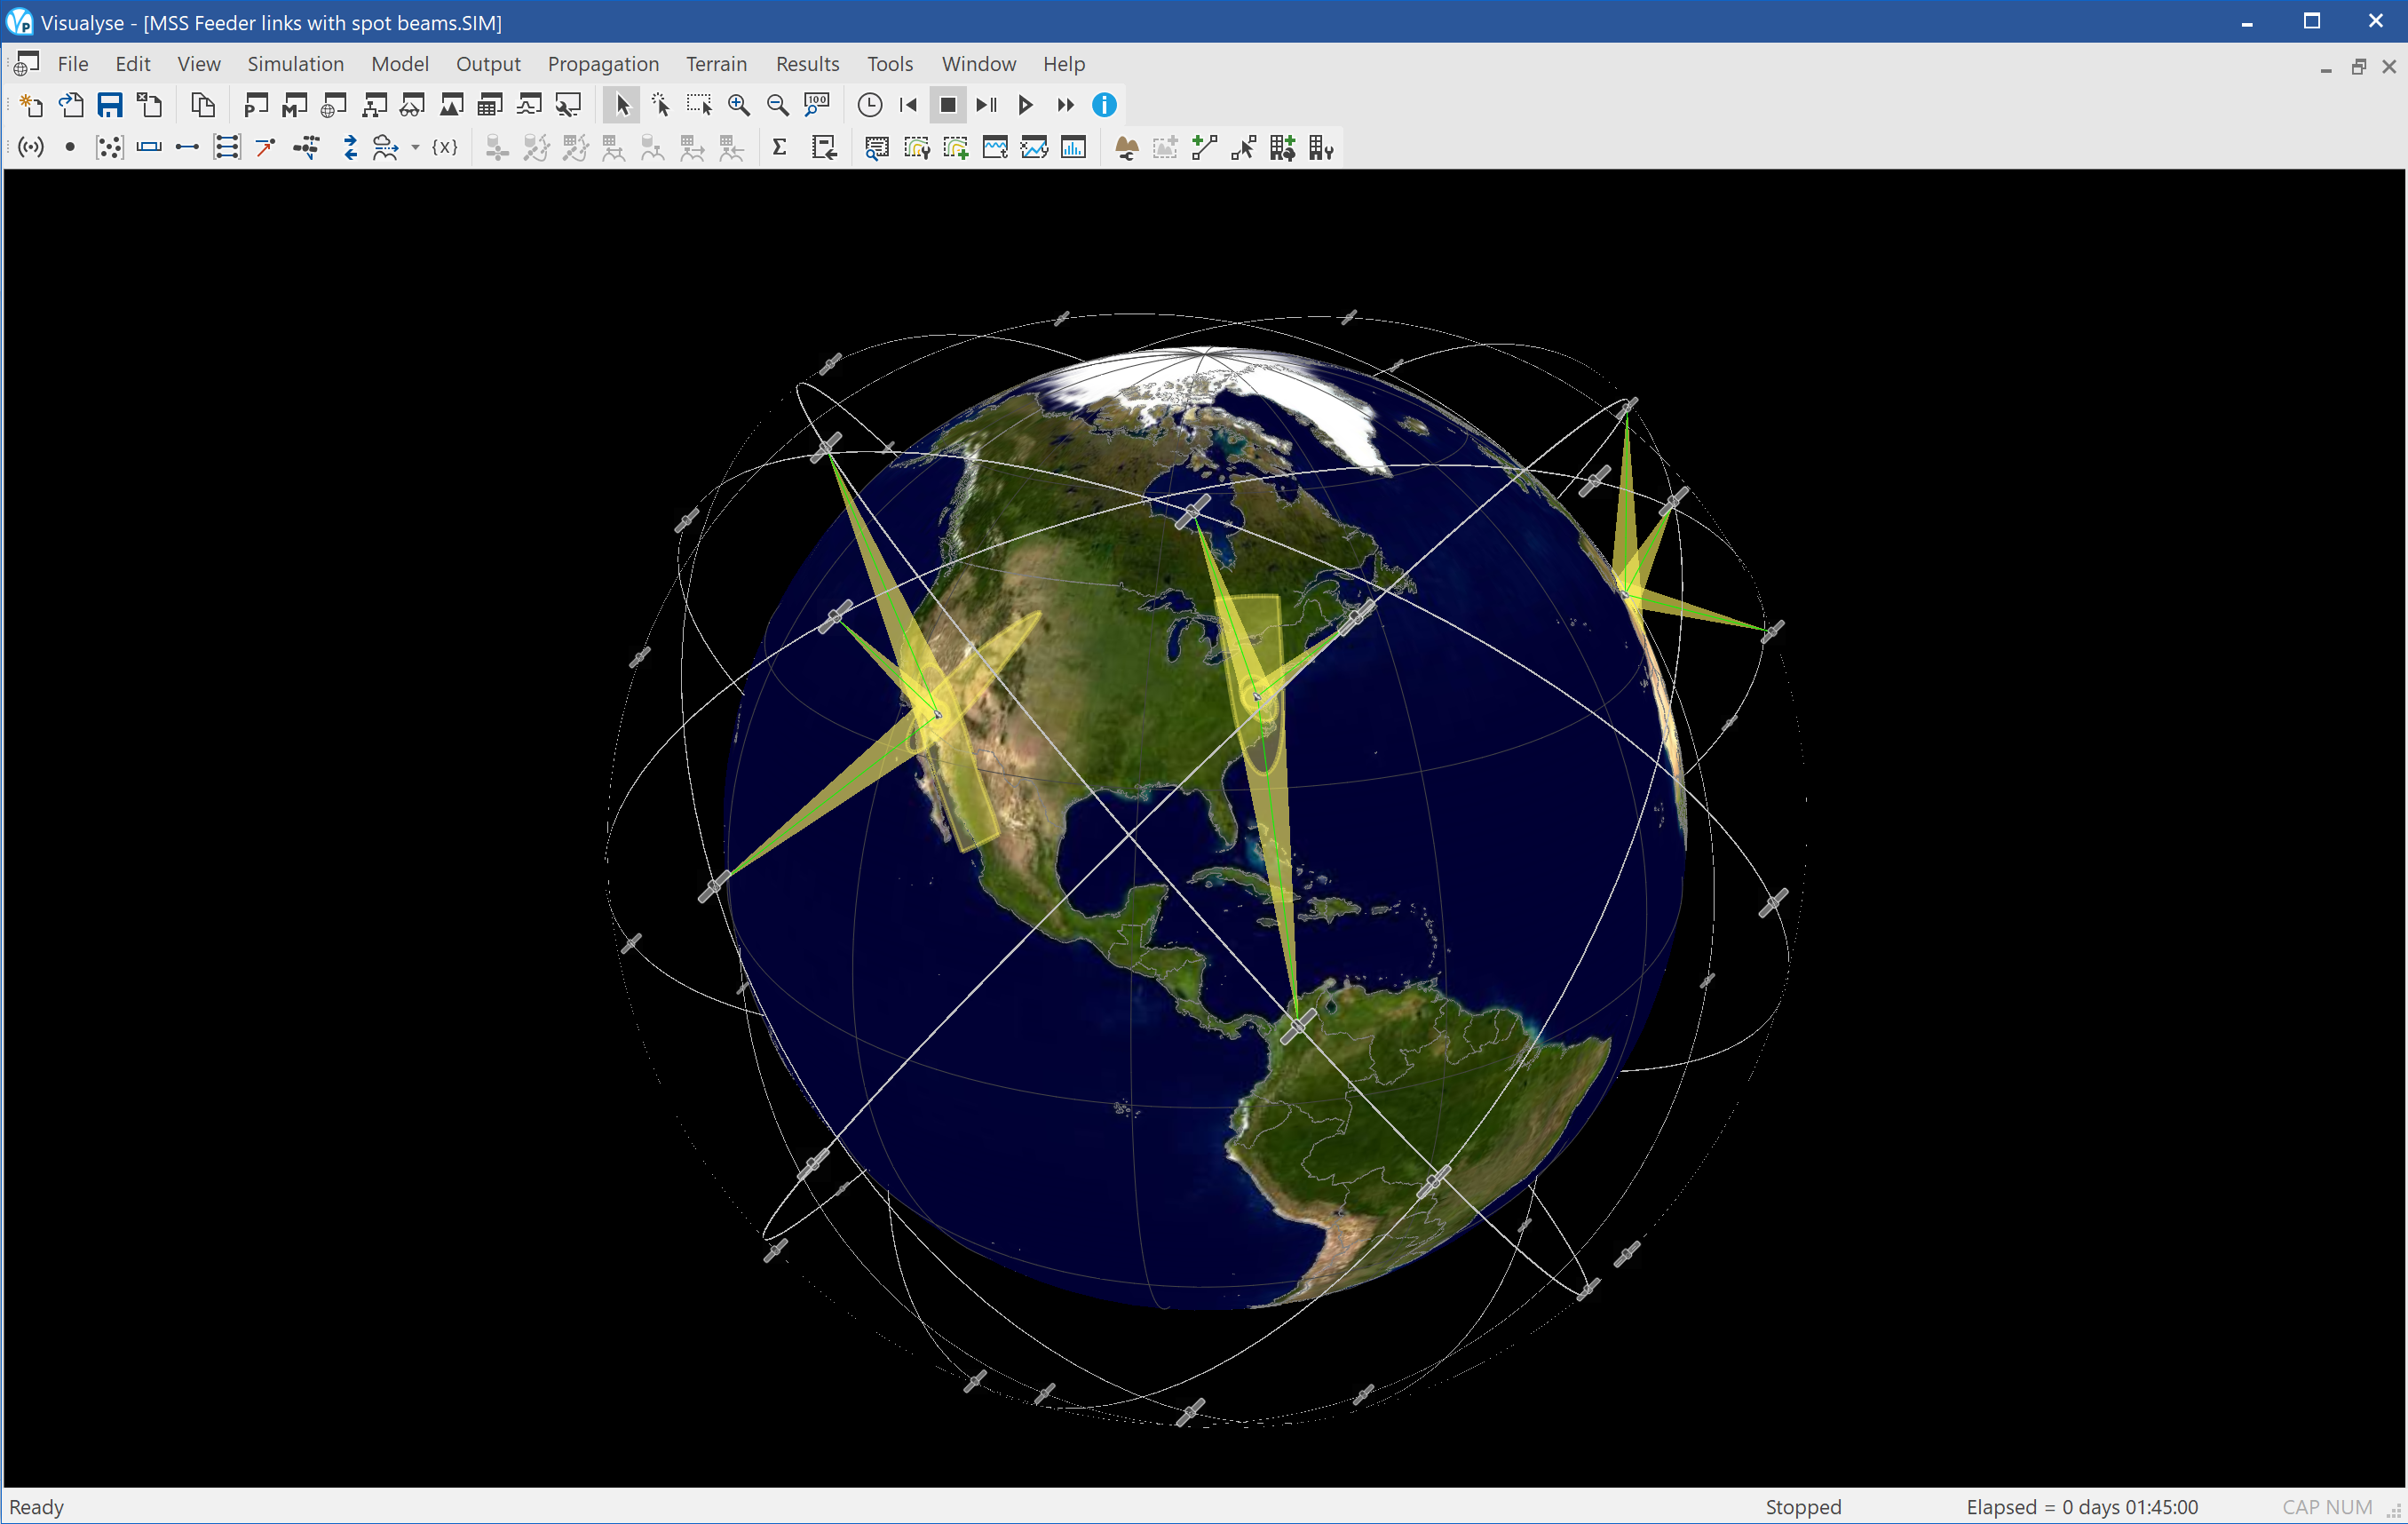
This example file shows a non-GSO constellation using steerable spot beams to provide feeder links with a number of gateway Earth Stations.
The gateways select the satellite using one of the pre-defined tracking strategies, and the satellites are configured with antennas that can generate electronically steerable beams as required by the link.
The simulation has been configured with a single 3D view showing the satellites, the beams, the gateway Earth Stations, and the satellite tracks. The view is fixed in inertial space, so we can see the rotation of the Earth below us.
Non-GSO MSS and Galileo
| Action: | Run simulation |
| Modules used: | None |
| Terrain regions: | None |
| Frequency band: | S |
| Station types: | Non-GSO Satellite, Mobile, Aeronautical |
| Propagation models: | Free space, ITU-R Rec.P.676 |
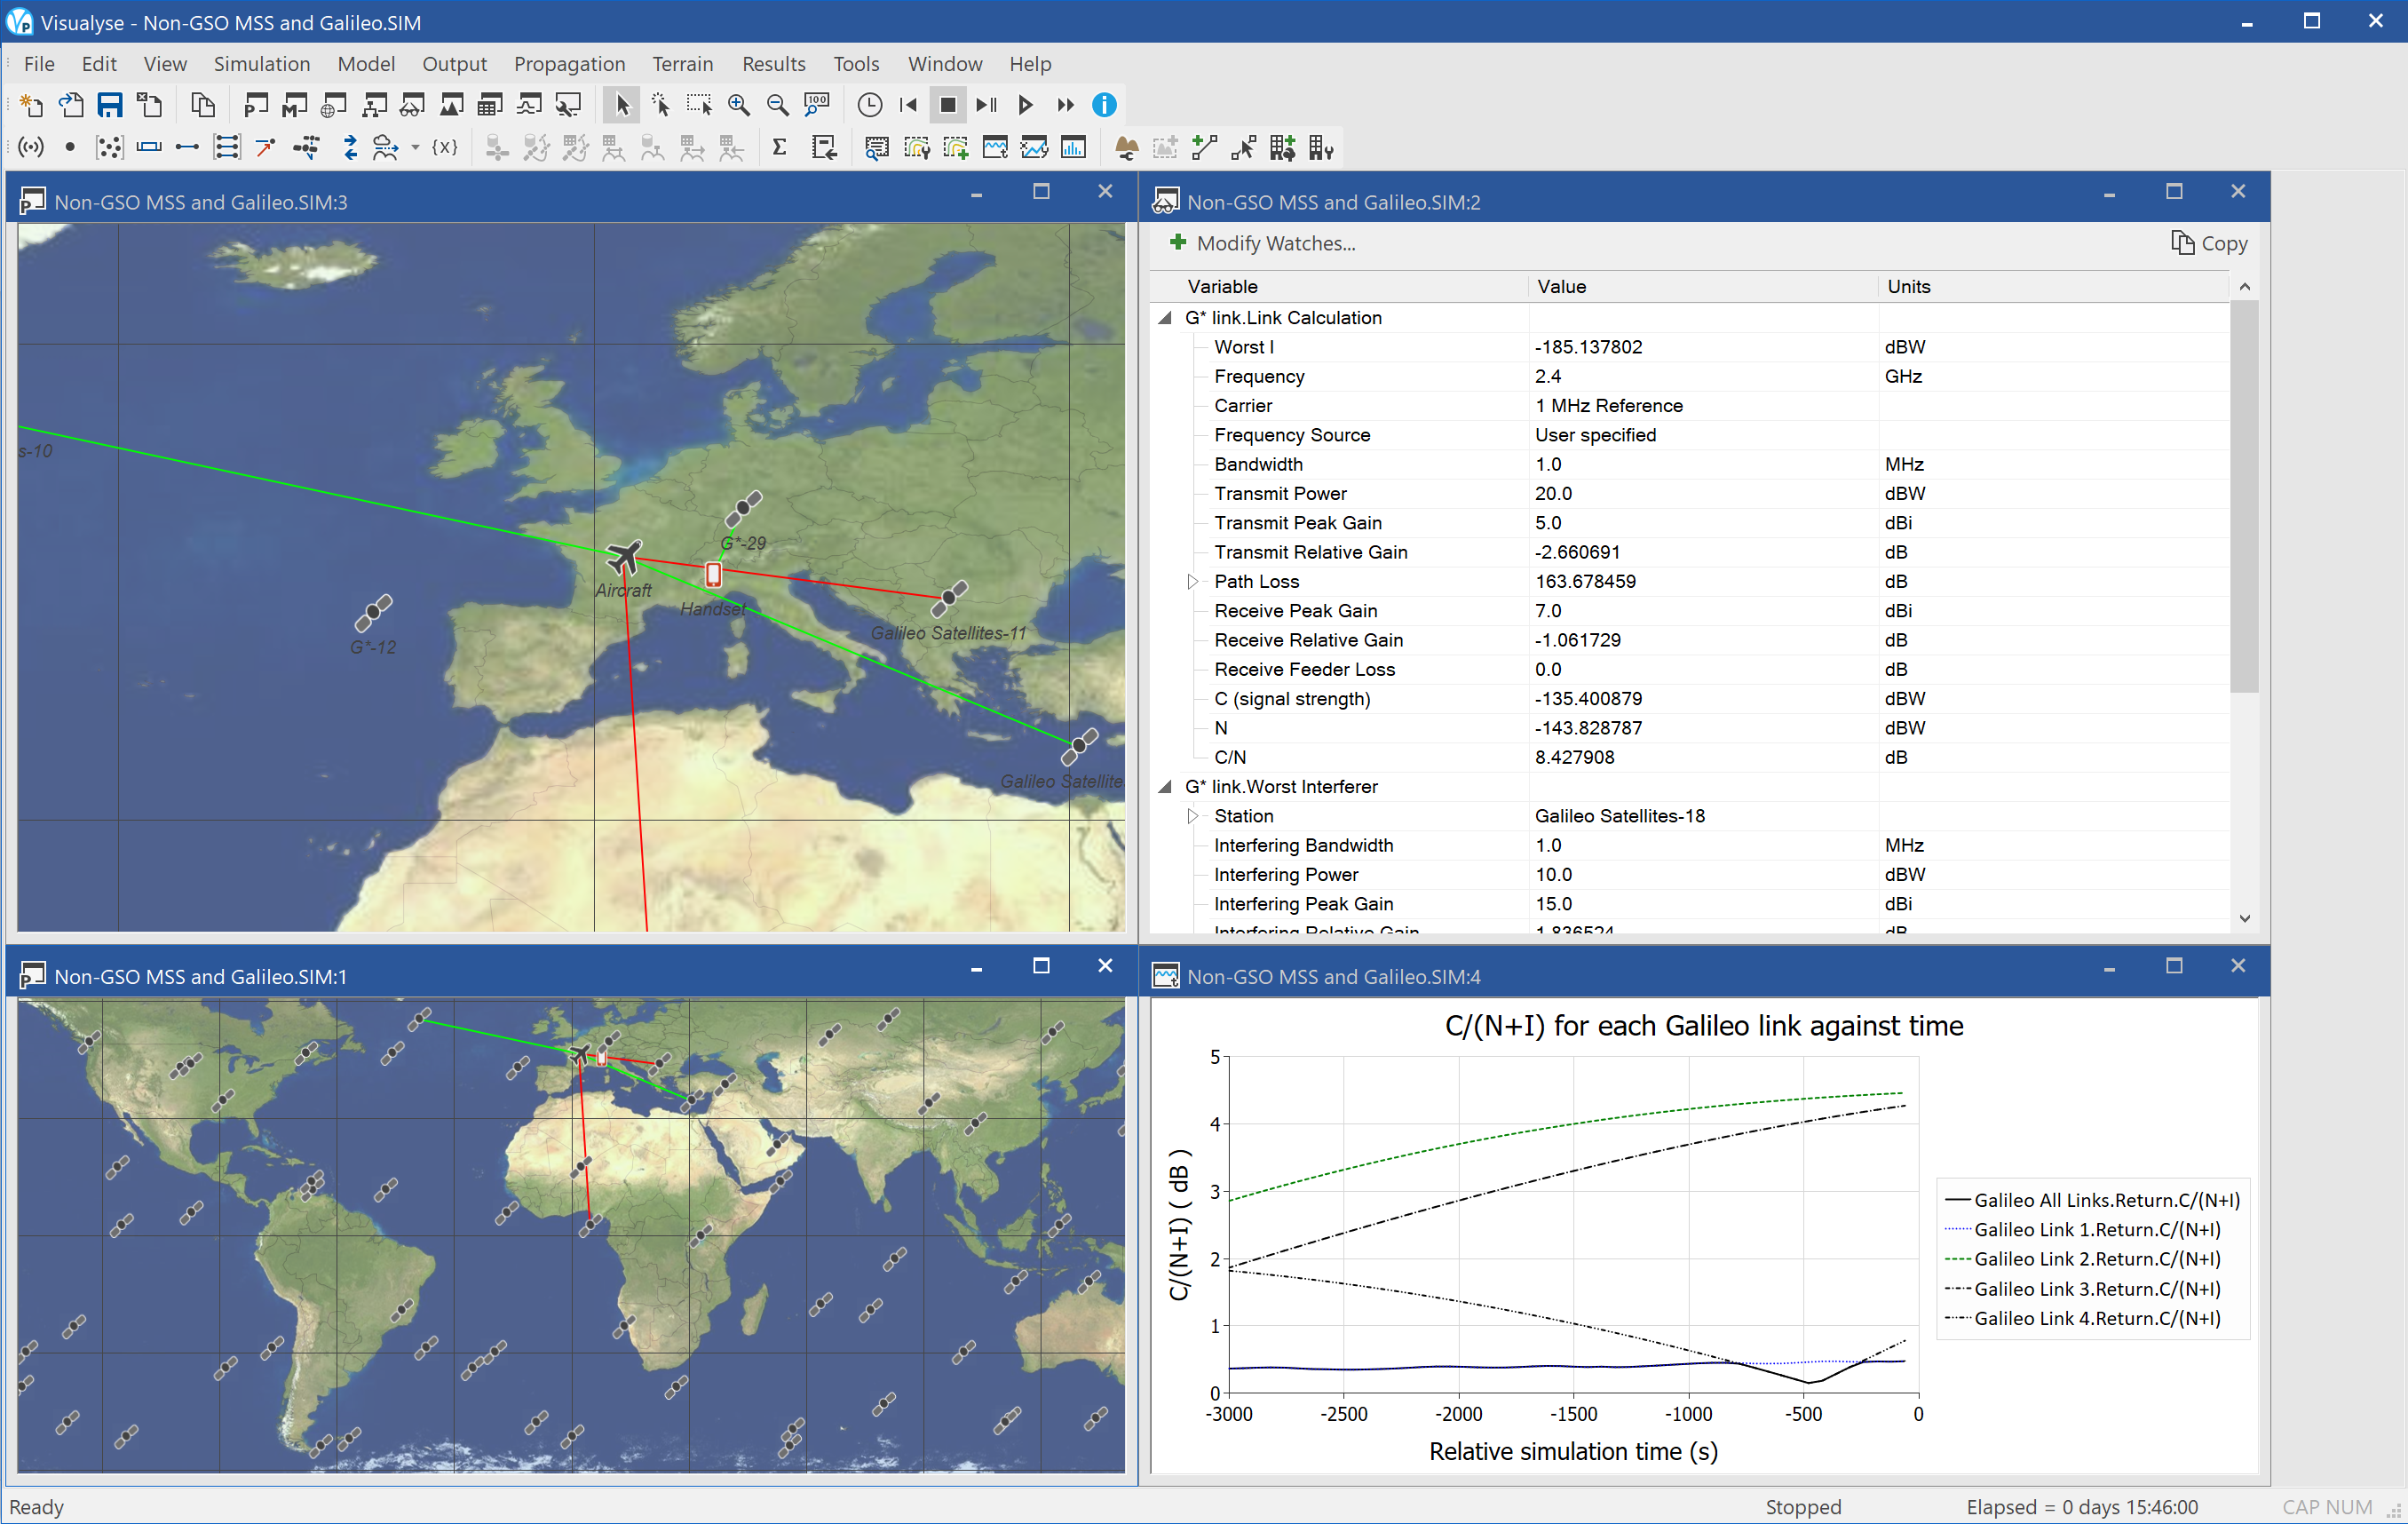
This example analysis the potential impact of introducing satellite radionavigation services such as Galileo into bands that are currently used for mobile satellite services such as Globalstar.
The motivation was to facilitate the integration of satellite navigation features into 3G enabled handsets by using adjacent frequency bands. As a primary band for 3G is the 2 500 – 2 690 MHz, there would be clear advantages in having a satellite navigation signal at the adjacent band 2 483 – 2 500 MHz, currently used for mobile satellite services (MSS). However this could raise compatibility issues.
This simulation includes two non-GSO constellations, one for the radionavigation service based upon Galileo parameters and another for the MSS service based upon Globalstar parameters. The constellations have been generated using Visualyse’s specialised wizard that takes account of the symmetry of the constellation: if actual orbit data was available in the Two-Line Element (TLE) format that could also be used.
The MSS handset is selecting the highest satellite from its constellation, while an airborne user of the satellite radionavigation services is using the tracking strategies to select the four highest elevation satellites from its constellation.
The screen shot above has been configured with four windows open:
- Plate Carrée view (top left) zoomed into Europe to show the aircraft and mobile stations and the selection of the satellite they use
- Plate Carrée view (bottom left) zoomed out to show most of the world, showing more of each constellation
- Watch window (top right) showing the wanted and worst single interferer link budget calculation for the MSS handset
- Quick graph (bottom right) showing how the C/N for the highest four elevation Galileo satellites vary with time and how a link group is used to work out the overall performance using the take-worst method.
PFD at GSO from NGSO MSS Feeder link
| Action: | Run simulation |
| Modules used: | None |
| Terrain regions: | None |
| Frequency band: | C |
| Station types: | GSO Satellite, Non-GSO Satellite, Earth Station |
| Propagation models: | Free space |
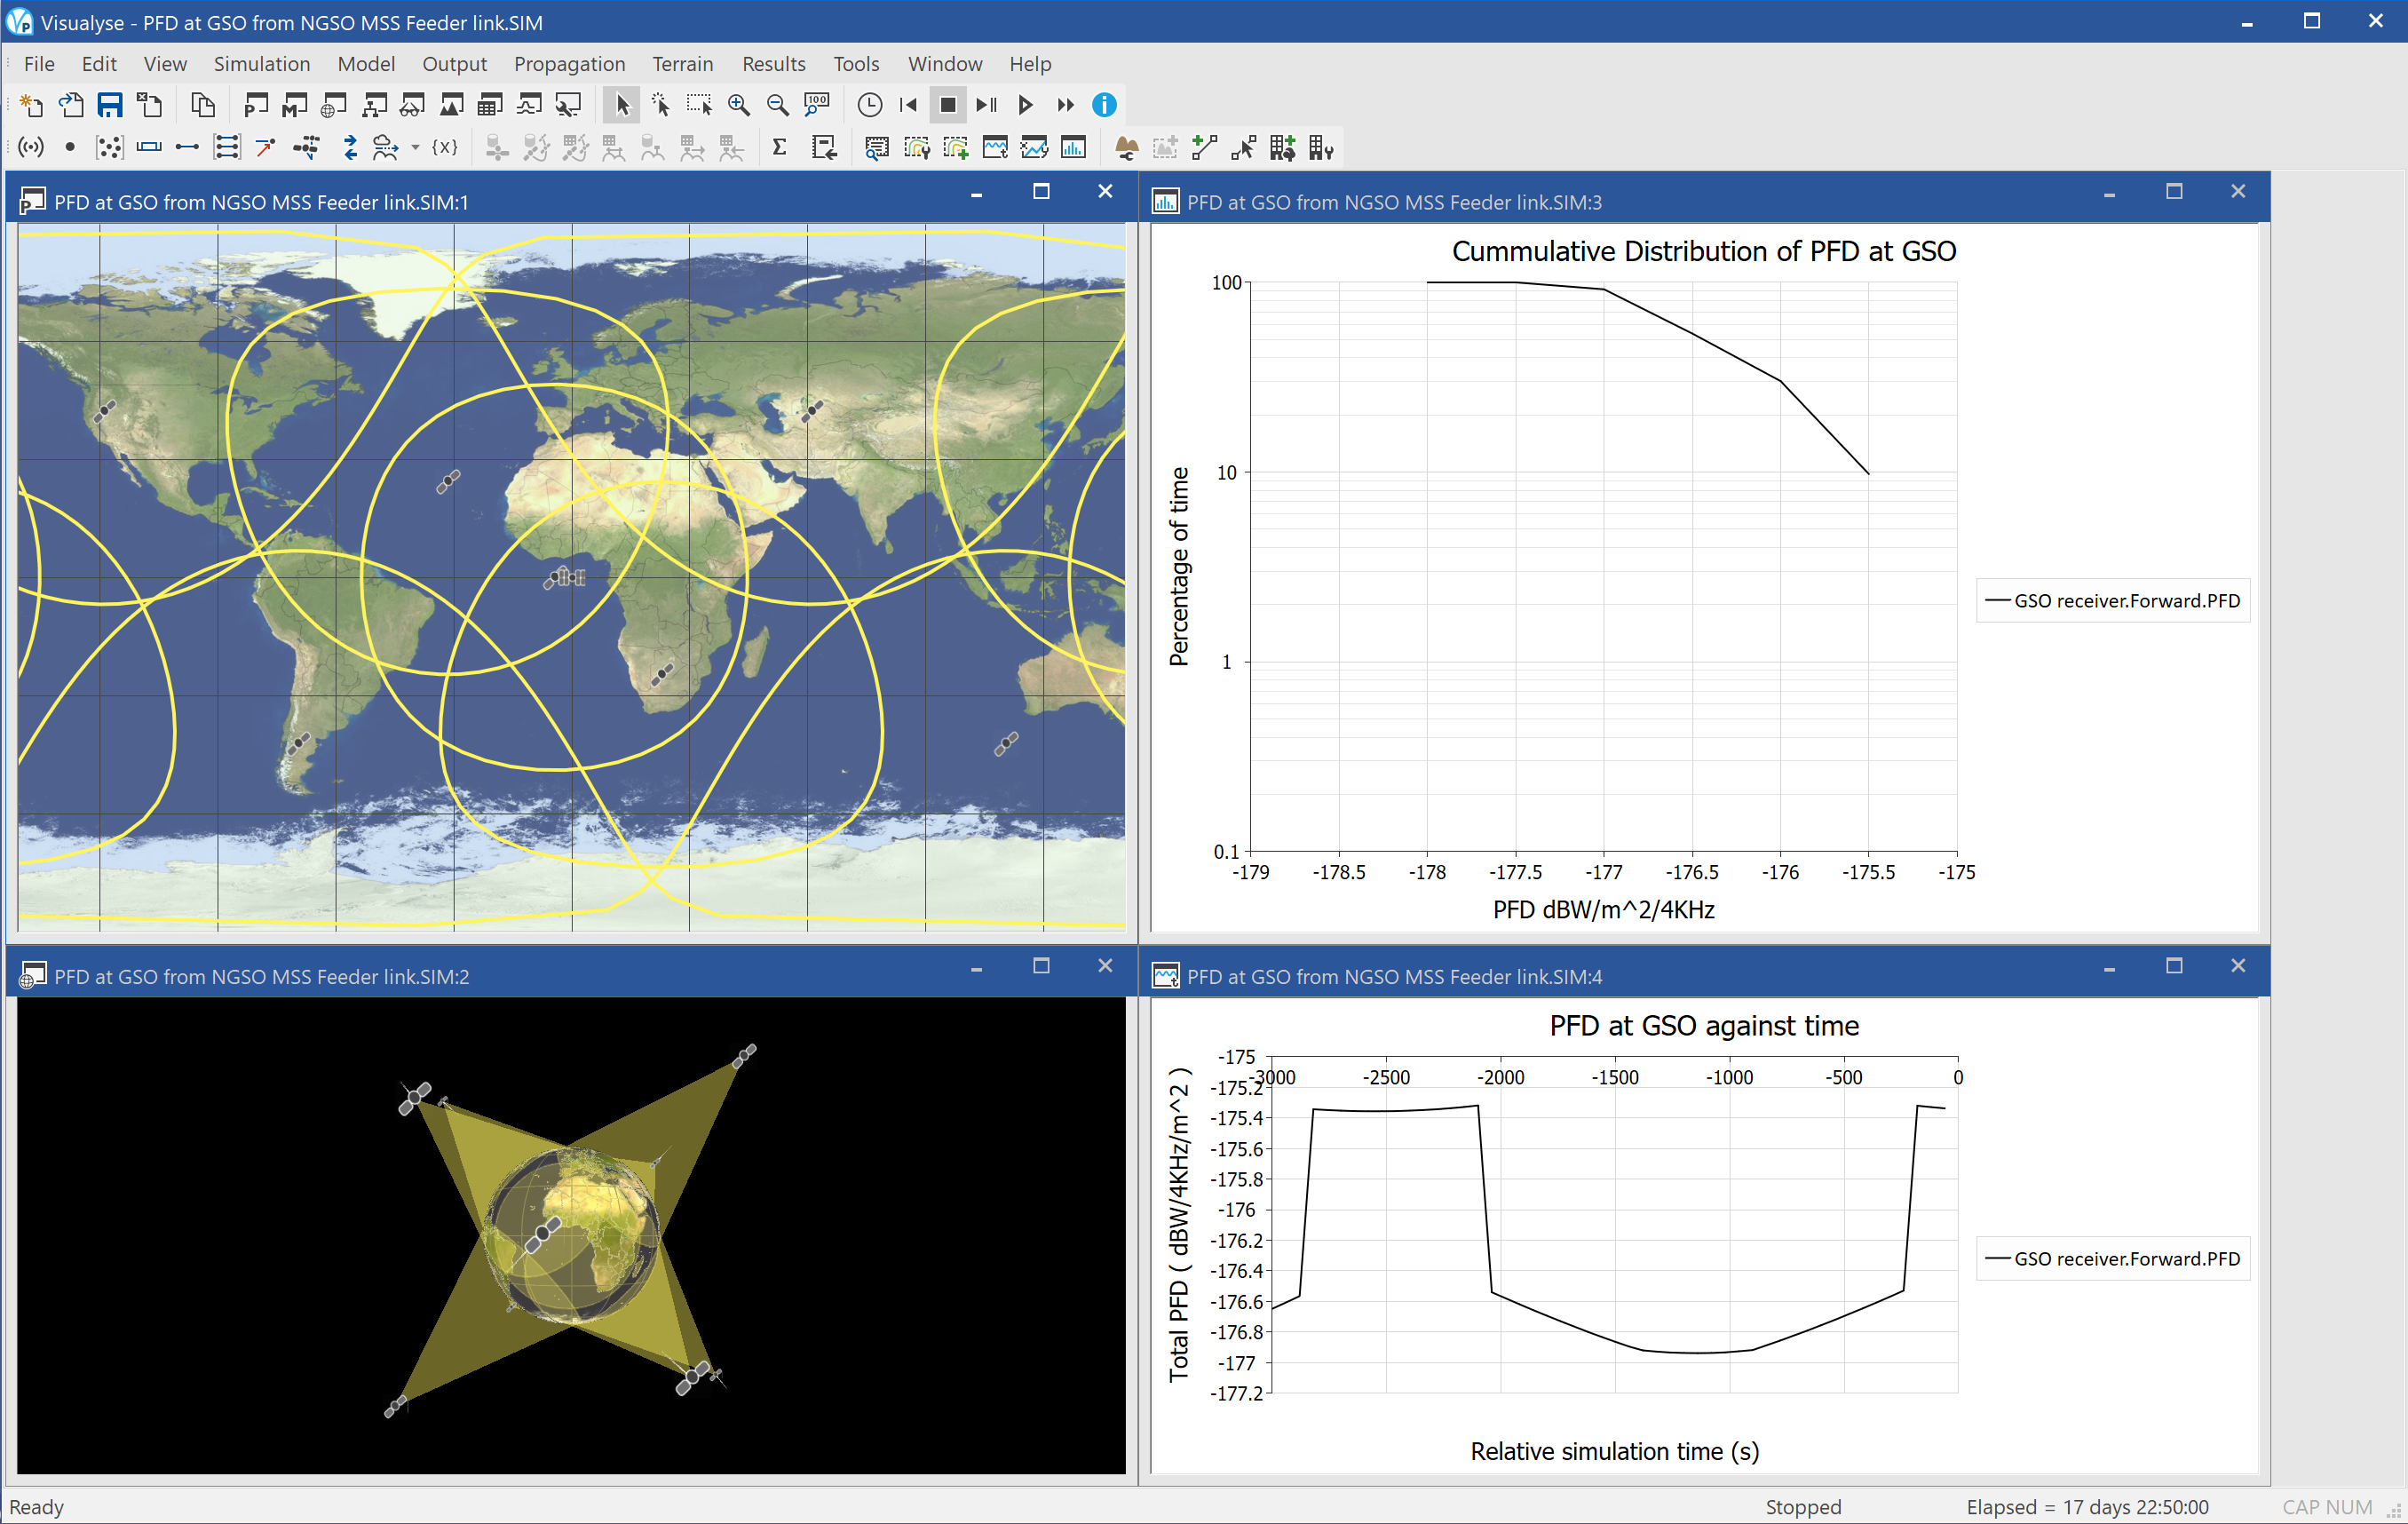
This example shows a simulation that checks whether a non-GSO network will meet the PFD levels in Article 22.5A of the Radio Regulations. These limit the PFD received at the geostationary orbit from downlinks from non-GSO MSS feeder links.
The relevant part of the Radio Regulations of 2004 is:

The simulation has been configured with four windows open:
- Plate Carrée map view (top left) showing the locations of the non-GSO satellites and their field of view, and the GSO satellite (at longitude = 0°)
- 3D view (bottom left) showing the non-GSO satellites and Earth from the perspective of the GSO satellite, with beams and satellite tracks
- Quick graph (bottom right) showing how the PFD at the GSO satellite from the non-GSO satellite downlink varies with time
- Statistics graph (top right) showing the cumulative distribution function of PFD at the GSO satellite from the non-GSO network: the key number is the maximum PFD calculated in the simulation to date which can be seen to be below the threshold of -169 dB(W/m^2) in any 4 kHz band
Teledesic & Celestri with constellation avoidance
| Action: | Run simulation |
| Modules used: | None |
| Terrain regions: | None |
| Frequency band: | Ka |
| Station types: | Non-GSO Satellite |
| Propagation models: | Free space, Rec.P.676 |
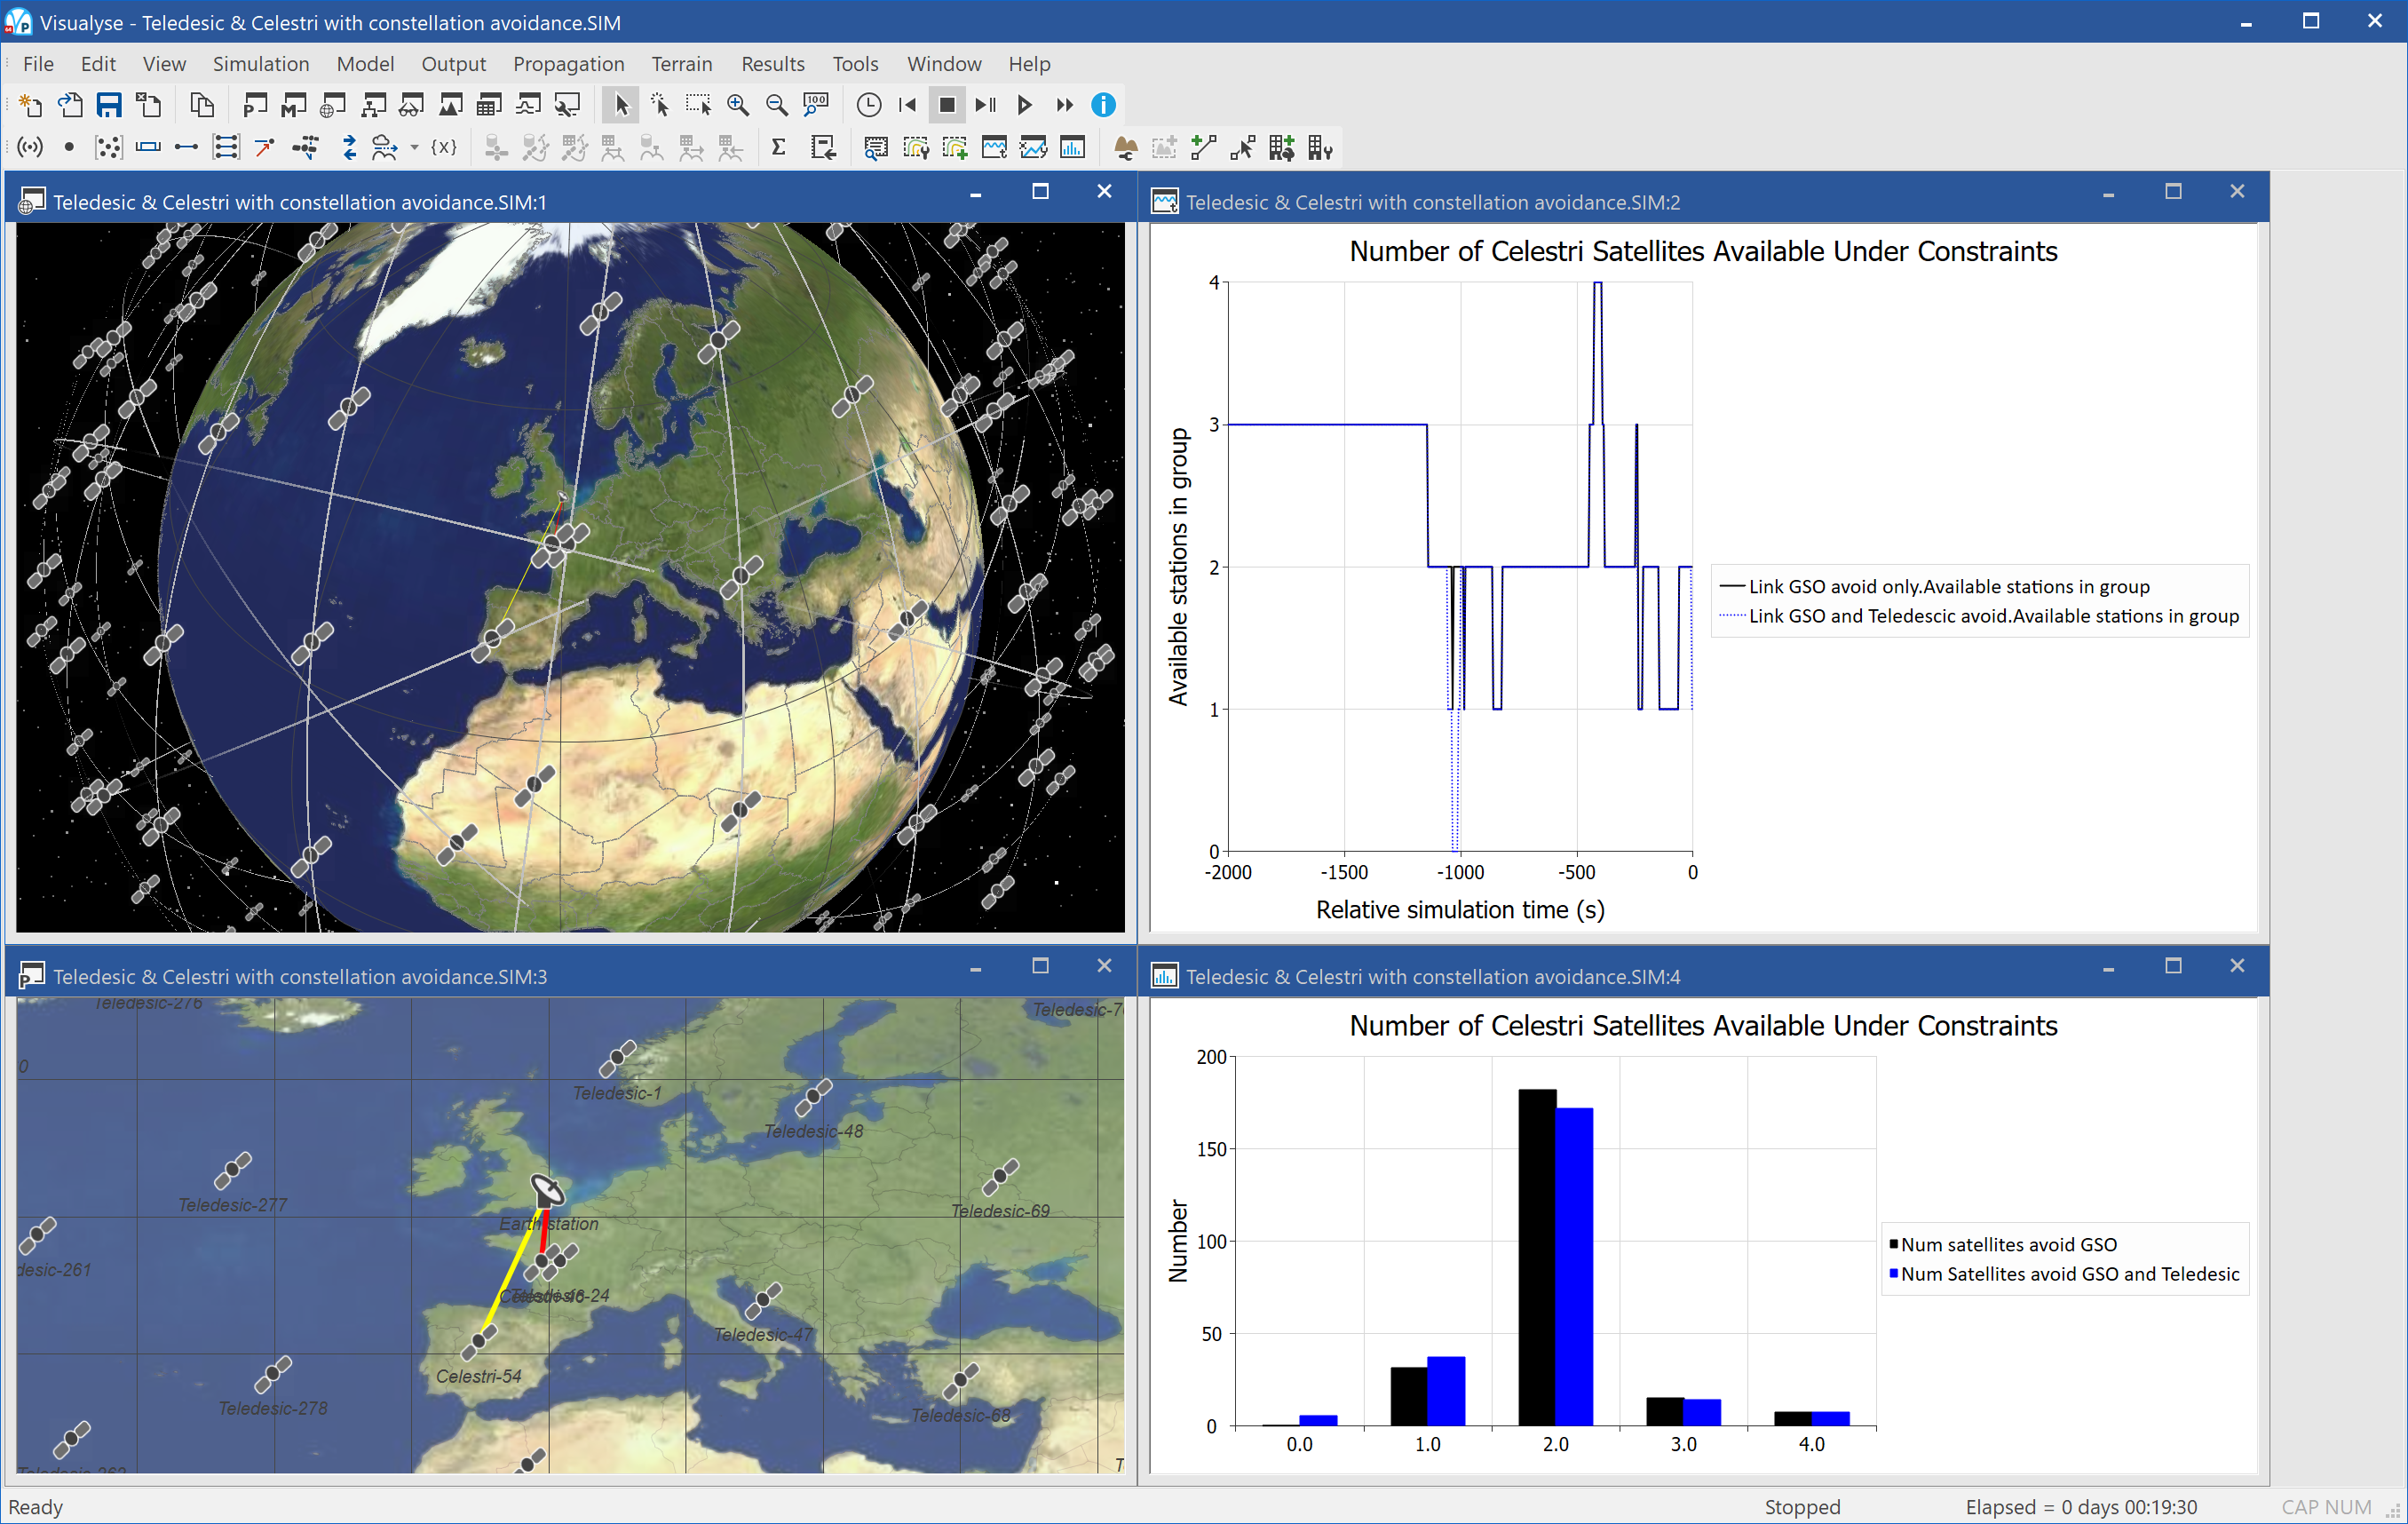
This example shows sharing between two non-GSO constellations, using tracking strategies to meet regulatory requirements and to coordinate between themselves.
Two non-GSO FSS networks are modelled in this simulation, namely the 288 satellite Teledesic configuration and Celestri. It is assumed that the Celestri network, which filed after Teledesic, must protect the other from interference. In addition, the Celestri network is assumed to need to protect the GSO arc (either due to EPFD constraints in Article 22 or actual filed networks).
One of the primary methods for a satellite network to protect another is to use pointing restrictions, which in Visualyse Professional are modelled in tracking strategies. In this example, there are two links with pointing constraints as follows:
- Link 1: point at the highest elevation satellite from those that are at least 16° above the horizon and at least 5° away from any point on the GSO arc
- Link 2: point at the highest elevation satellite from those that are at least 16° above the horizon and at least 5° away from any point on the GSO arc and at least 5° away from any of the Teledesic satellites
Link 2 therefore has more vigorous constraints: the question this simulation is addressing is the implications on this on the constellation to provide a service. By analysing the statistics of number of satellites that meet the criteria, it can be determine the service that can be provided while protecting another constellation from interference.
The simulation has the two links in different colour: most of the time they result in the earth station selecting the same satellite, but at times at which there would be an “in-line” event they diverge, with link 2 selecting a satellite that can be used without causing interference.
At some very rare times no satellite meets the criteria needed for link 2.
In the screen shot above there are four windows open:
- 3D view (top left), showing the satellites of both constellations, their tracks, the earth station, and the two links, coloured red and yellow
- Plate Carrée view (bottom left), showing the satellites of both constellations, the earth station, and the two links, coloured red and yellow
- Quick graph (top right) plotting how the number of satellites in the Celestri constellation that meets the criteria for Links 1 and 2 varies in time. Usually this is between 1 and 4, but sometimes the number of satellites that meets Link 2’s criteria is below that of Link 1, and sometimes it drops to zero
- Statistics graph (bottom right) plotting the histogram of number of satellites that meets the criteria of Links 1 and 2: it can be seen that Link 1 always has more satellites that meets its criteria and sometimes Link 2 is unable to connect.
Teledesic 840 satellite constellation
| Action: | Run simulation |
| Modules used: | None |
| Terrain regions: | None |
| Frequency band: | Ka |
| Station types: | Non-GSO Satellite |
| Propagation models: | n/a |
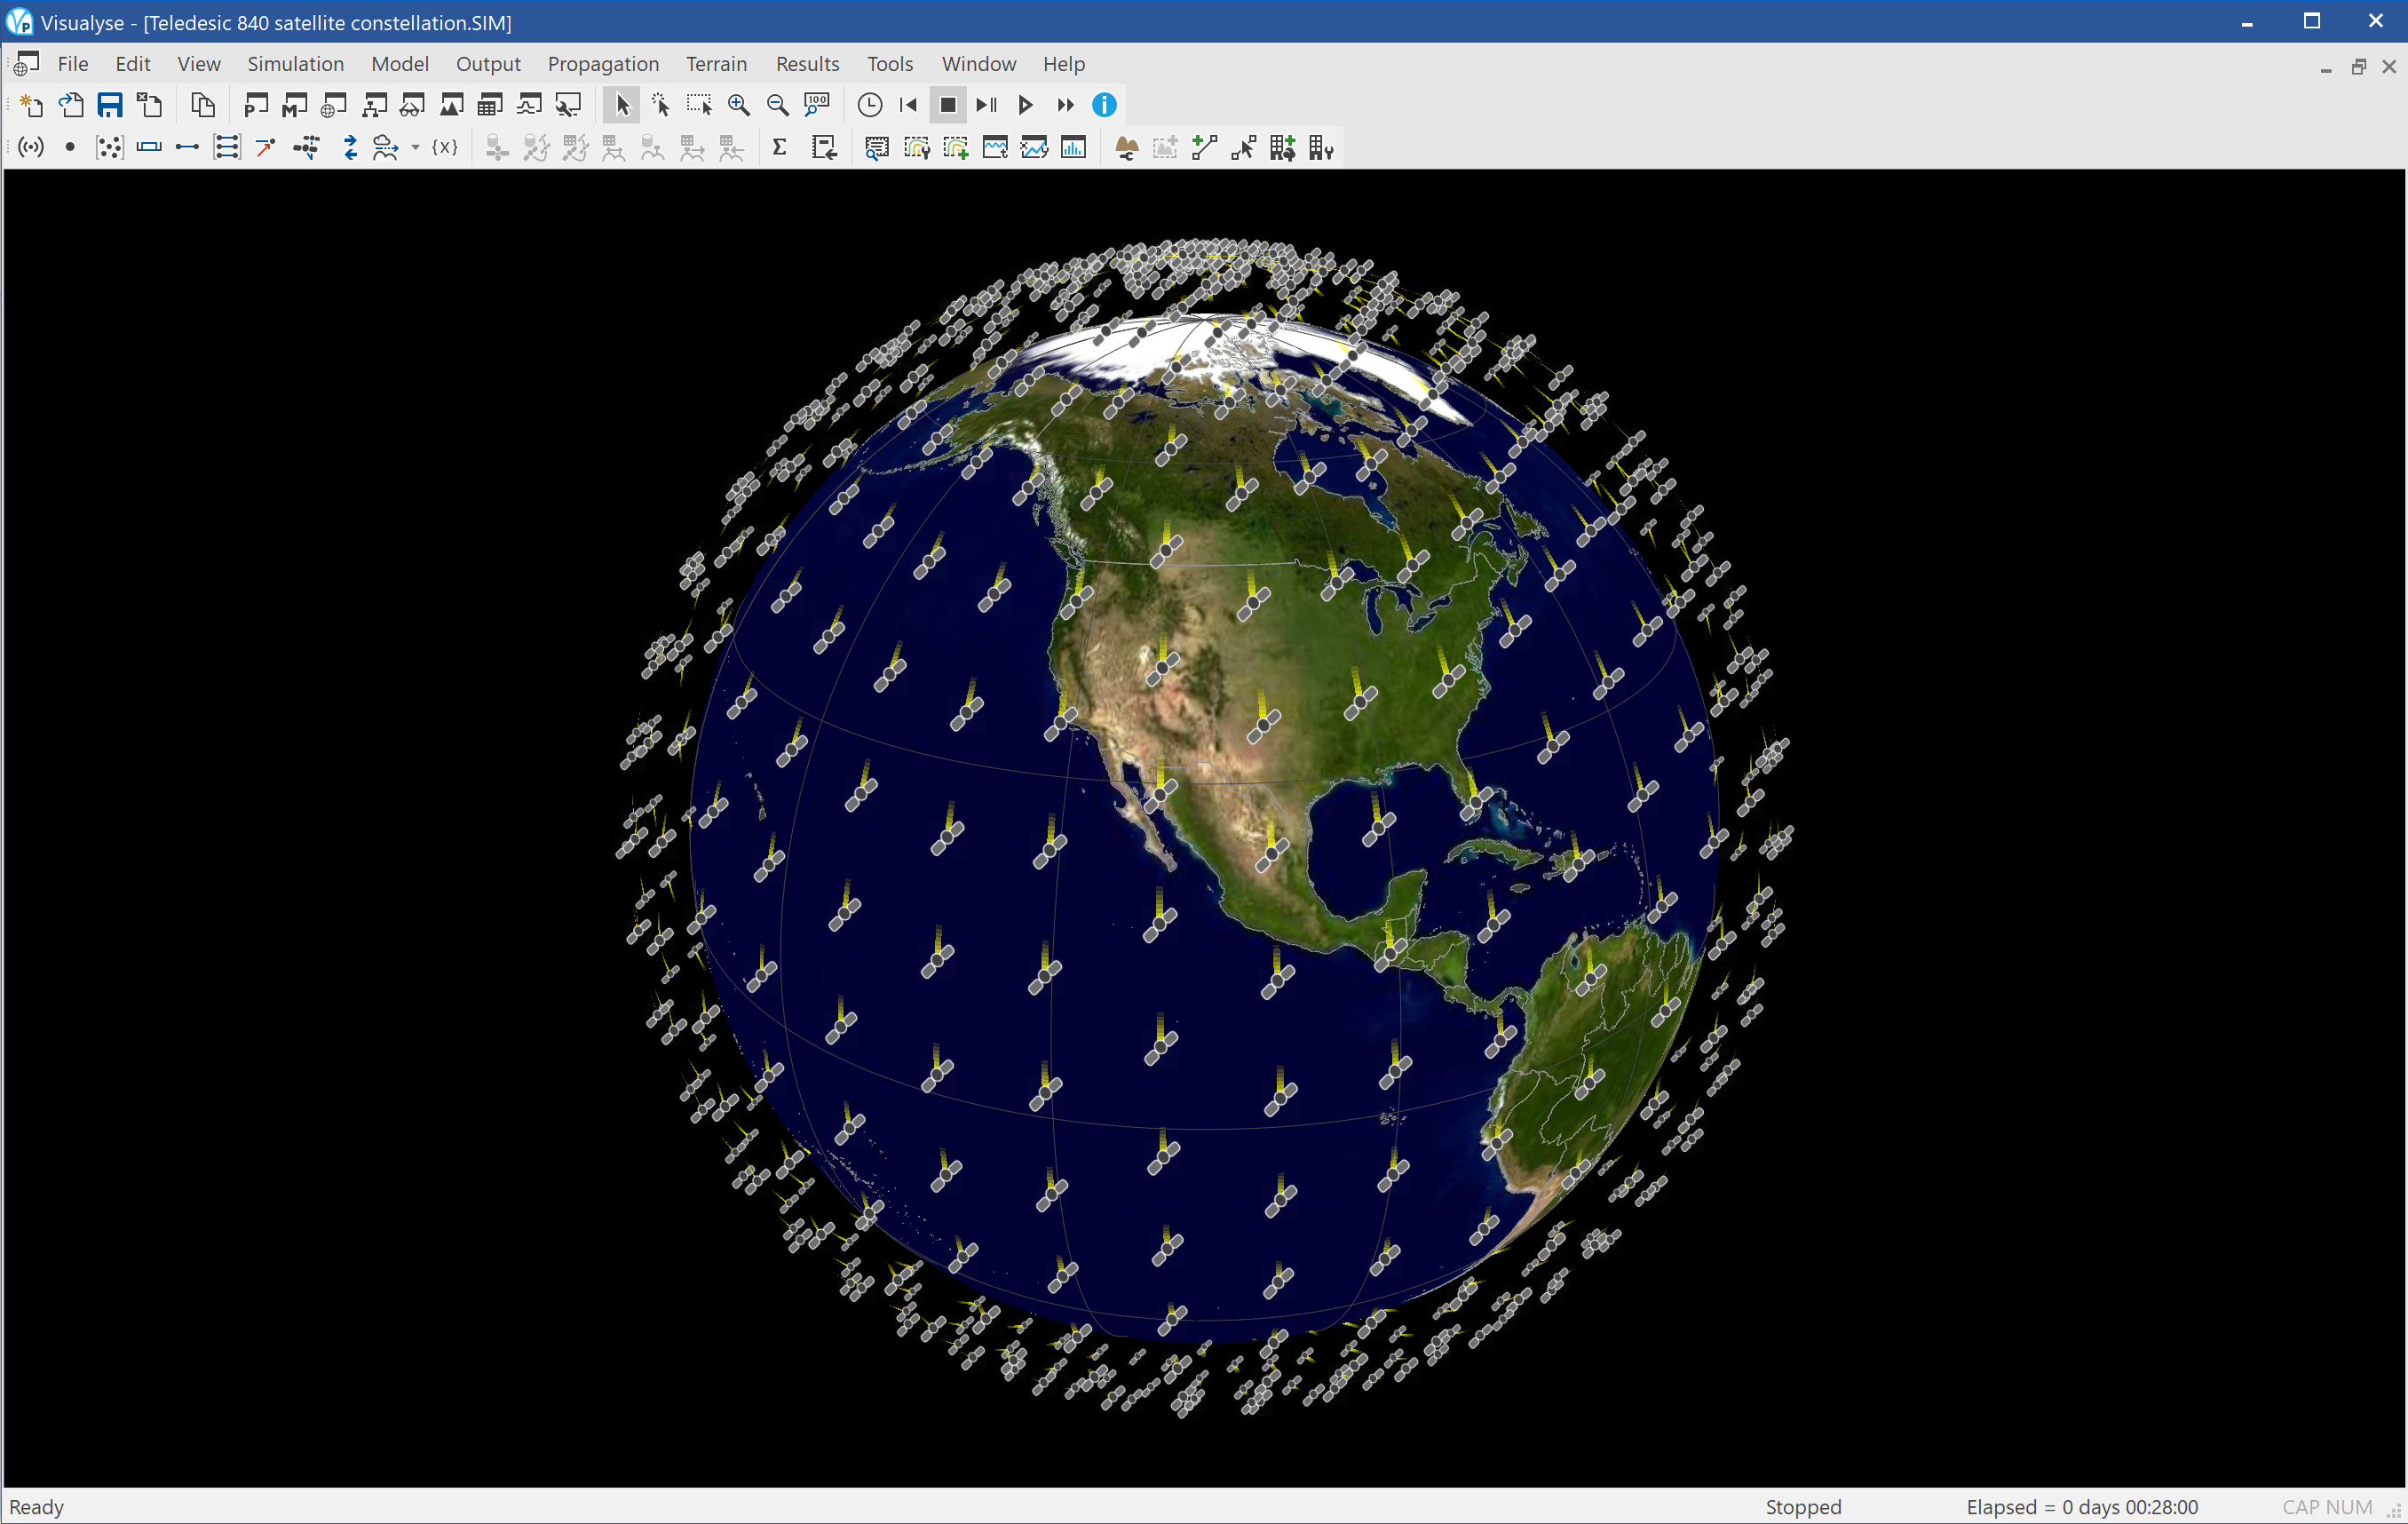
This example shows the original 840 satellite Teledesic constellation. This concept was developed in the 1990s to provide high speed broadband access globally using large numbers of satellites each of which would act as node and route traffic within the network.
Teledesic was successful in gaining access to 2 x 400 MHz at WRC 95 and a further 2 x 100 MHz at WRC 97. However the challenges of implementation and most crucially funding such a system proved too great, even after reducing the size of the constellation down to 288 satellites, and the network never entered operation.
The simulation only includes a single view showing the constellation in the 3D view together with space tracks. The congestion of the network around the poles can be seen – and the difficulty in avoiding collision and generation of space debris!
Others
This section contains the following examples:
HAPS with FS and FSS
| Action: | None |
| Modules used: | None |
| Terrain regions: | None |
| Frequency band: | C |
| Station types: | GSO Satellite, Earth Station, Fixed Station, Aeronautical |
| Propagation models: | Free space, ITU-R Rec.P.676 |
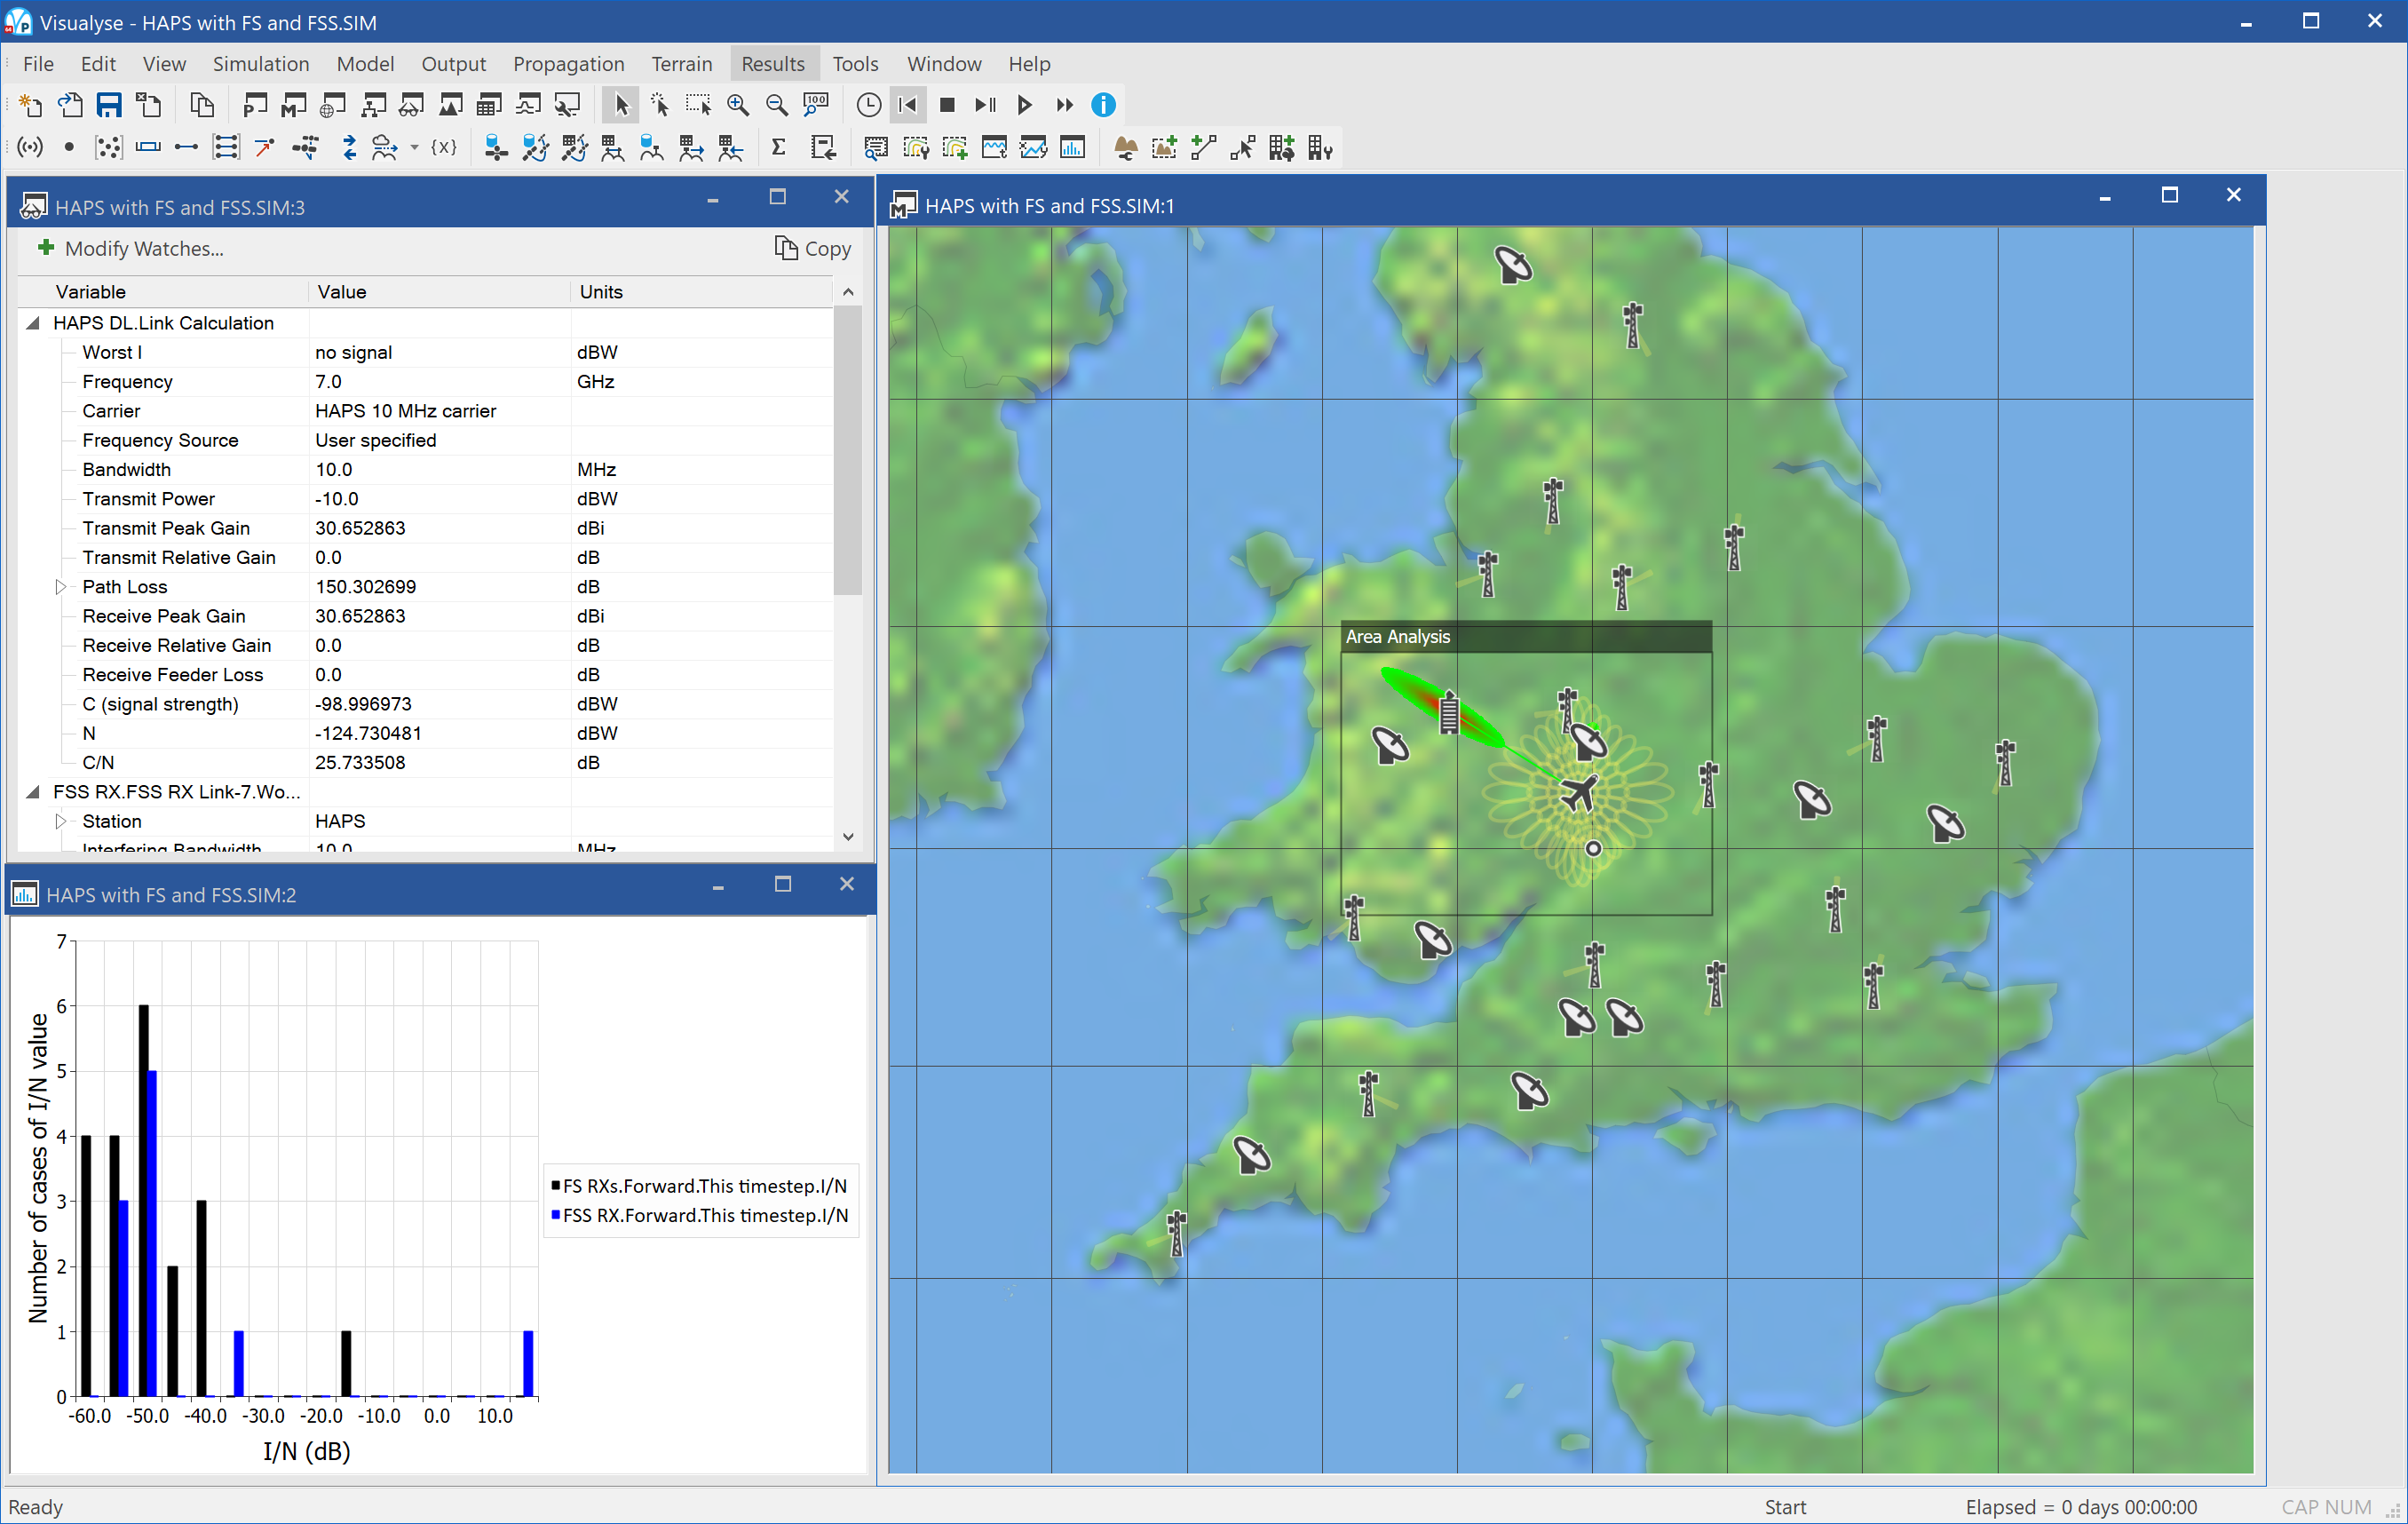
This example shows sharing between a High-Altitude Platform Station (HAPS) and terrestrial point to point Fixed Service station and satellite Earth Stations.
The HAPS network has been configured with two sets of antennas:
- Multiple beam service link antenna
- Spot beam used as feeder to gateway station
This example considers use of some of the upper parts of C band for the feeder link. It is assumed that this is shared with terrestrial receivers, which are modelled using ITU-R Rec.F.699 as the gain pattern and a range of locations (latitude, longitude) and pointing angles (azimuth, elevation). These could either come from real assignment data read in using one of:
- Interface to the ITU-R’s database of terrestrial assignments (IFIC)
- FS import tool using spreadsheet or CSV format data
There are also a number of GSO satellite earth stations which could suffer interference from the HAPS.
The simulation above shows the following windows:
- Mercator view (right) showing the HAPS aeronautical station, its service links beams, its feeder link, the HAPS gateway, the various earth stations, the fixed link stations and their azimuths
- Watch window (top left) showing the link budget for the HAPS downlink and also the interference calculation from the HAPS into one of the Earth Stations (the worst case one with I/N around 17 dB)
- Statistics graph (bottom left) showing a histogram of the I/N across the various fixed and fixed satellite service receivers. It can be seen that the worst I/N is around 17 dB
The view also shows an Area Analysis of locations where putting an Earth Station that could make it susceptible to interference. There are two vulnerable geometries:
- Around the HAPS gateway
- Cases where the HAPS would be directly in line between the Earth Station and its satellite.
Smart Antennas
| Action: | Run simulation |
| Modules used: | Define Variable |
| Terrain regions: | None |
| Frequency band: | S |
| Station types: | Mobile, Fixed |
| Propagation models: | Hata / COST231 |
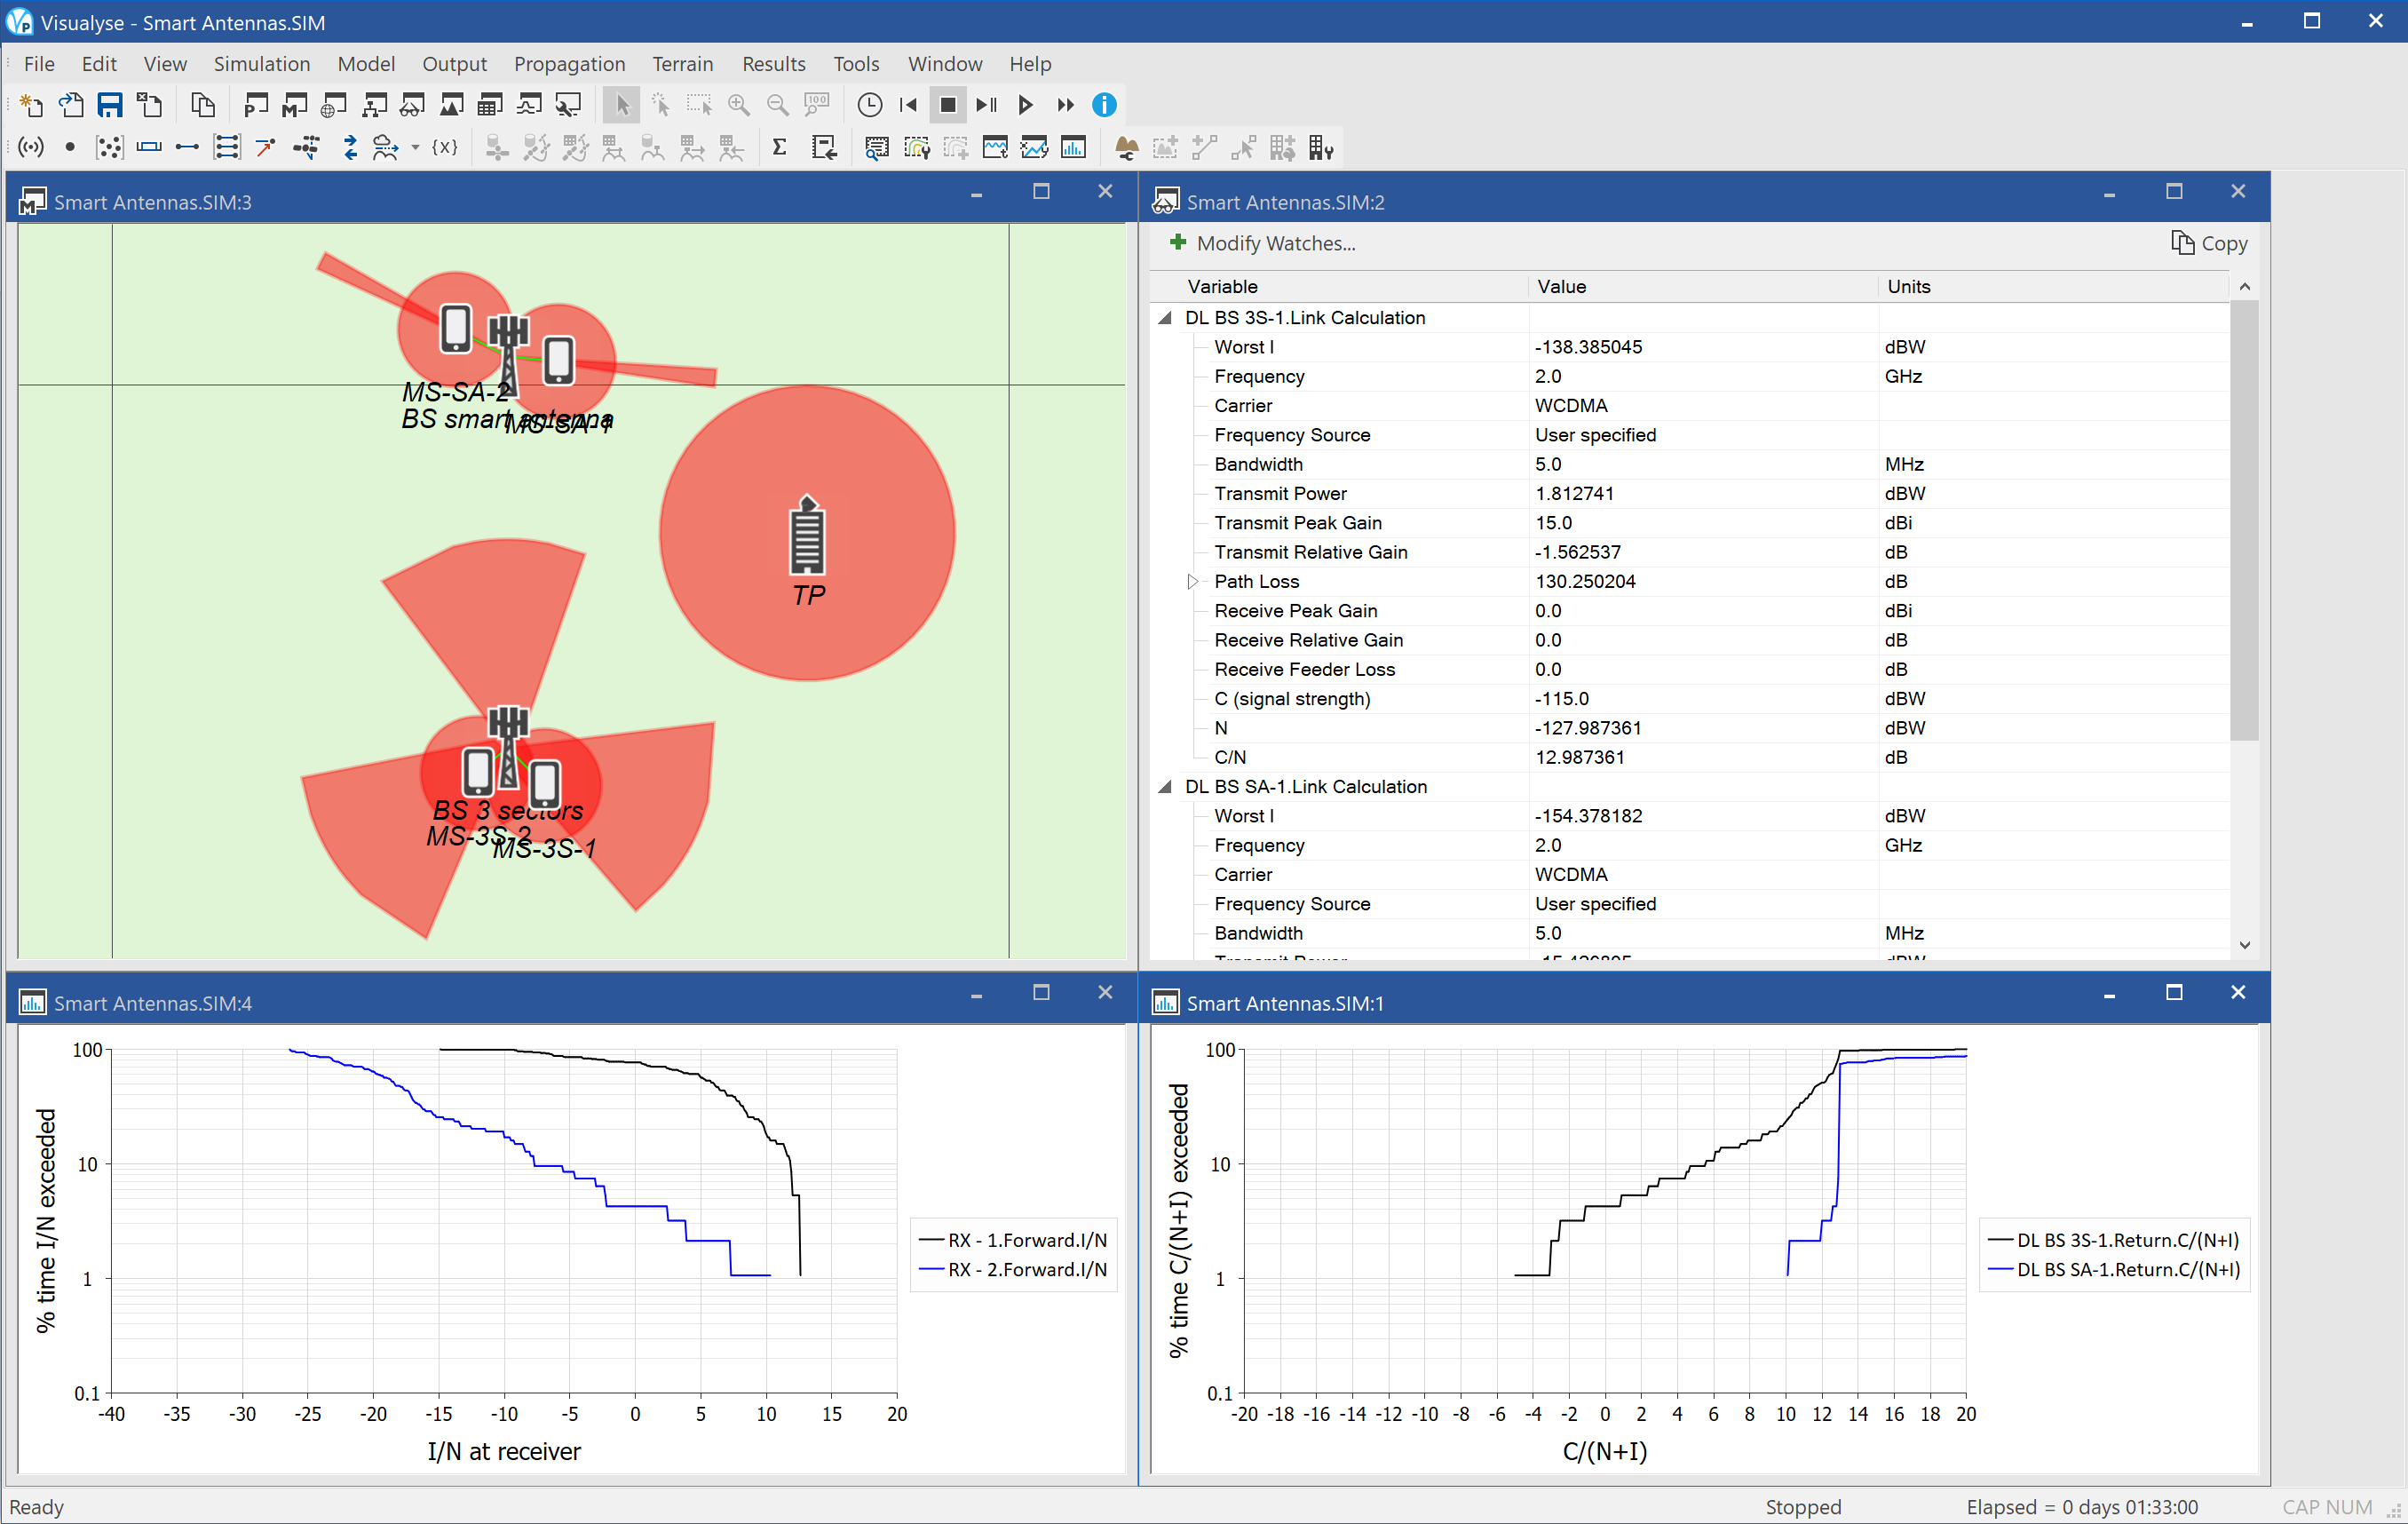
This simulation shows an example of the analysis of the impact of using smart antennas. These can be used, for example, by base stations of mobile networks to improve performance. Rather than having fixed pointing and cover a fixed area – for example 90° of azimuth – a smart antenna creates a focussed beam of energy towards the wanted direction.
In this simulation we have two base stations:
- Using conventional 120° sectors, with downtilt of 2° and peak gain 15 dBi
- Using a number (up to 25) narrow spot beams that point at a mobile as required with peak gain 30 dBi
Within the cell of each base station there located at random two mobile stations, and a link is set up using 3G/WCDMA parameters to close the link for a C/N of around 12.5 dB using power control to determine an appropriate transmit power.
Within this scenario two issues are being addressed:
- Which case would create the highest interference towards other receivers co-frequency?
- Which case would provide the least intra-system interference and hence could provide the highest capacity?
This is analysed by running a Monte Carlo style analysis and producing statistics of I/N at a victim receiver or C/(N+I) for each mobile link assuming the other mobile link also causes interference. It is assumed the intra-system interference path can use orthogonal coding to reduce interference by 10 dB.
Both the wanted and interfering paths are assumed to use the Hata / COST 231 propagation models and operate at a frequency of 2 GHz.
In the screen shot above there are four windows open:
- Mercator map view (top left) showing the locations of the two base stations, the mobiles they are services, their beams, and the test point.
- Statistics graph (bottom left) showing the cumulative distribution function of I/N from each of the two base stations into the receive test point. It can be seen that for all percentages of time the smart antenna base station causes lower levels of interference
- Statistics graph (bottom right) showing the cumulative distribution function of the C/(N+I) for one mobiles for each of the base station taking into account interference from the other within the cell.
- Watch window (top right) showing the wanted link budget calculation for a mobile from the 3 sector and smart antenna systems. The effect of power control on the variation in transmit power can be clearly seen.
Traffic and Exclusion Zone
| Action: | Run simulation |
| Modules used: | Define Variable, Traffic |
| Terrain regions: | None |
| Frequency band: | UHF |
| Station types: | Mobile, Radio astronomy |
| Propagation models: | Hata / COST231 |
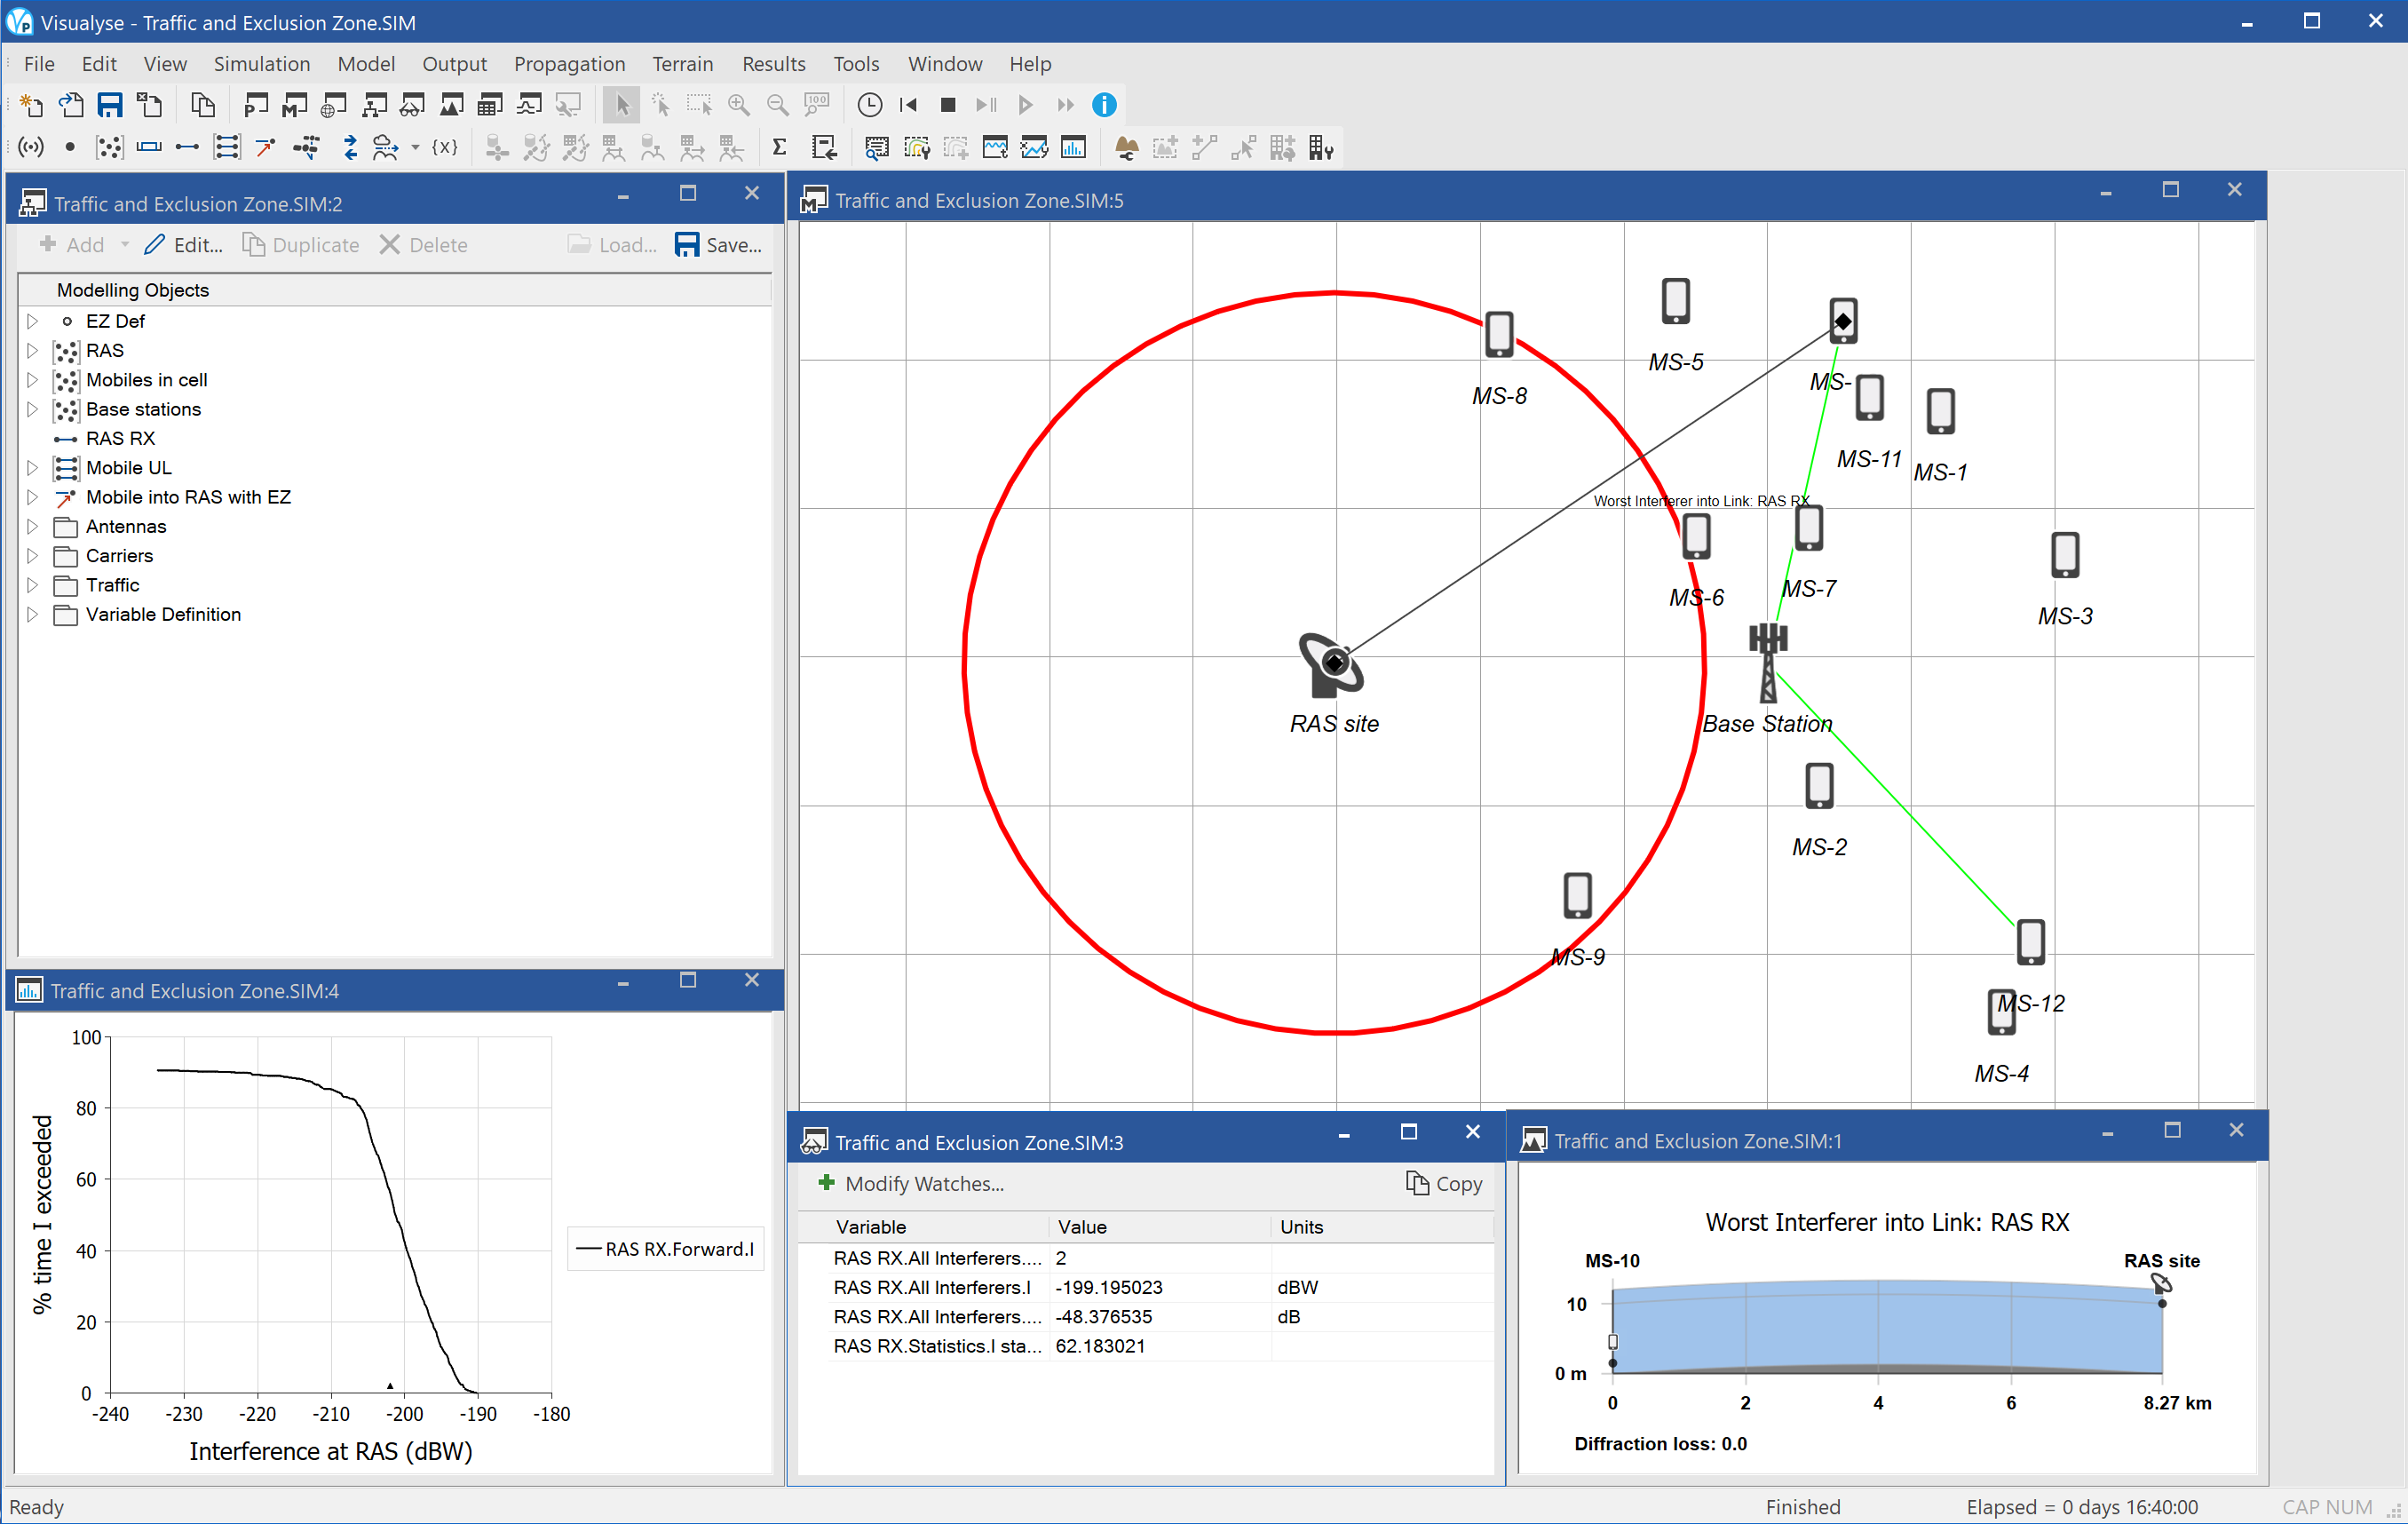
This example demonstrates how the Traffic module can be used to model more accurately the behaviour of a mobile network.
A mobile operator wants to deploy at base station in UHF band that would receive uplinks from mobile users in a channel adjacent to that used by the radio astronomy service (RAS). This service has very stringent protection requirements: Recommendation ITU-R RA.769 suggests a threshold of -202 dBW/MHz at the receiver for no more than 2% of time.
One way to protect the radio astronomy service is to employ an exclusion zone, and the mobile operator is suggesting one with radius 5 km would be sufficient. The question is how to test that assumption.
Interference from the uplink can be very variable due the randomisation of the number of active users and their location within the cell. In Visualyse Professional this can be modelled using the Define Variable and the Traffic Module, which can also be used to define an Exclusion Zone.
In this case a traffic object is defined such that a mobile user is active for 25% of the time and never when within 5 km of the RAS site. A variable definition is used to randomise the position of 12 users within a hexagonal cell.
We have assumed the base station at the centre of the cell and is located just outside the exclusion zone, being 6 km away. Power control is used on the uplink and the COST 231 / Hata propagation model used for both wanted and interfering paths.
The RAS is assumed to be operating in UHF channel 38, while the mobiles are in channel 37, so this is an adjacent band analysis. A fixed attenuation of 40 dB is assumed between the 5 MHz WCMDA carrier and a 1 MHz reference receiver bandwidth.
In the screen shot above there are five windows open:
- Model view (top left) showing the various simulation objects in a “file explorer” like display
- Mercator map view (top right) showing the locations of the radio astronomy site, the base station, the mobiles, the active links, and the exclusion zone. Grid lines are every 2 km
- Statistics graph (bottom left) showing the cumulative distribution function (CDF) of interference at the radio astronomy site, with the threshold from ITU-R Rec.RA.769 as a marker. Note how the CDF never reaches 100% as there are times when no mobiles outside the exclusion zones are active
- Watch window (bottom centre) showing the number of interfering entries, the total interference, the I/N at the RAS site, and the percentage of time interference would occur
- Path profile window (bottom right) showing path from the radio astronomy site to the worst single interferer
If you run the simulation you will see the interference exceeds the radio astronomy threshold by around 10 dB and so further mitigation would be required. One simple additional step would be to consider the effect of terrain and clutter.
Note also how the number of interferers changes due to variation in number of active users and whether they are within the exclusion zone or not.
Wi-Fi and ENG
| Action: | None |
| Modules used: | None |
| Terrain regions: | None |
| Frequency band: | S |
| Station types: | Fixed, Mobile |
| Propagation models: | ITU-R P.1791 |
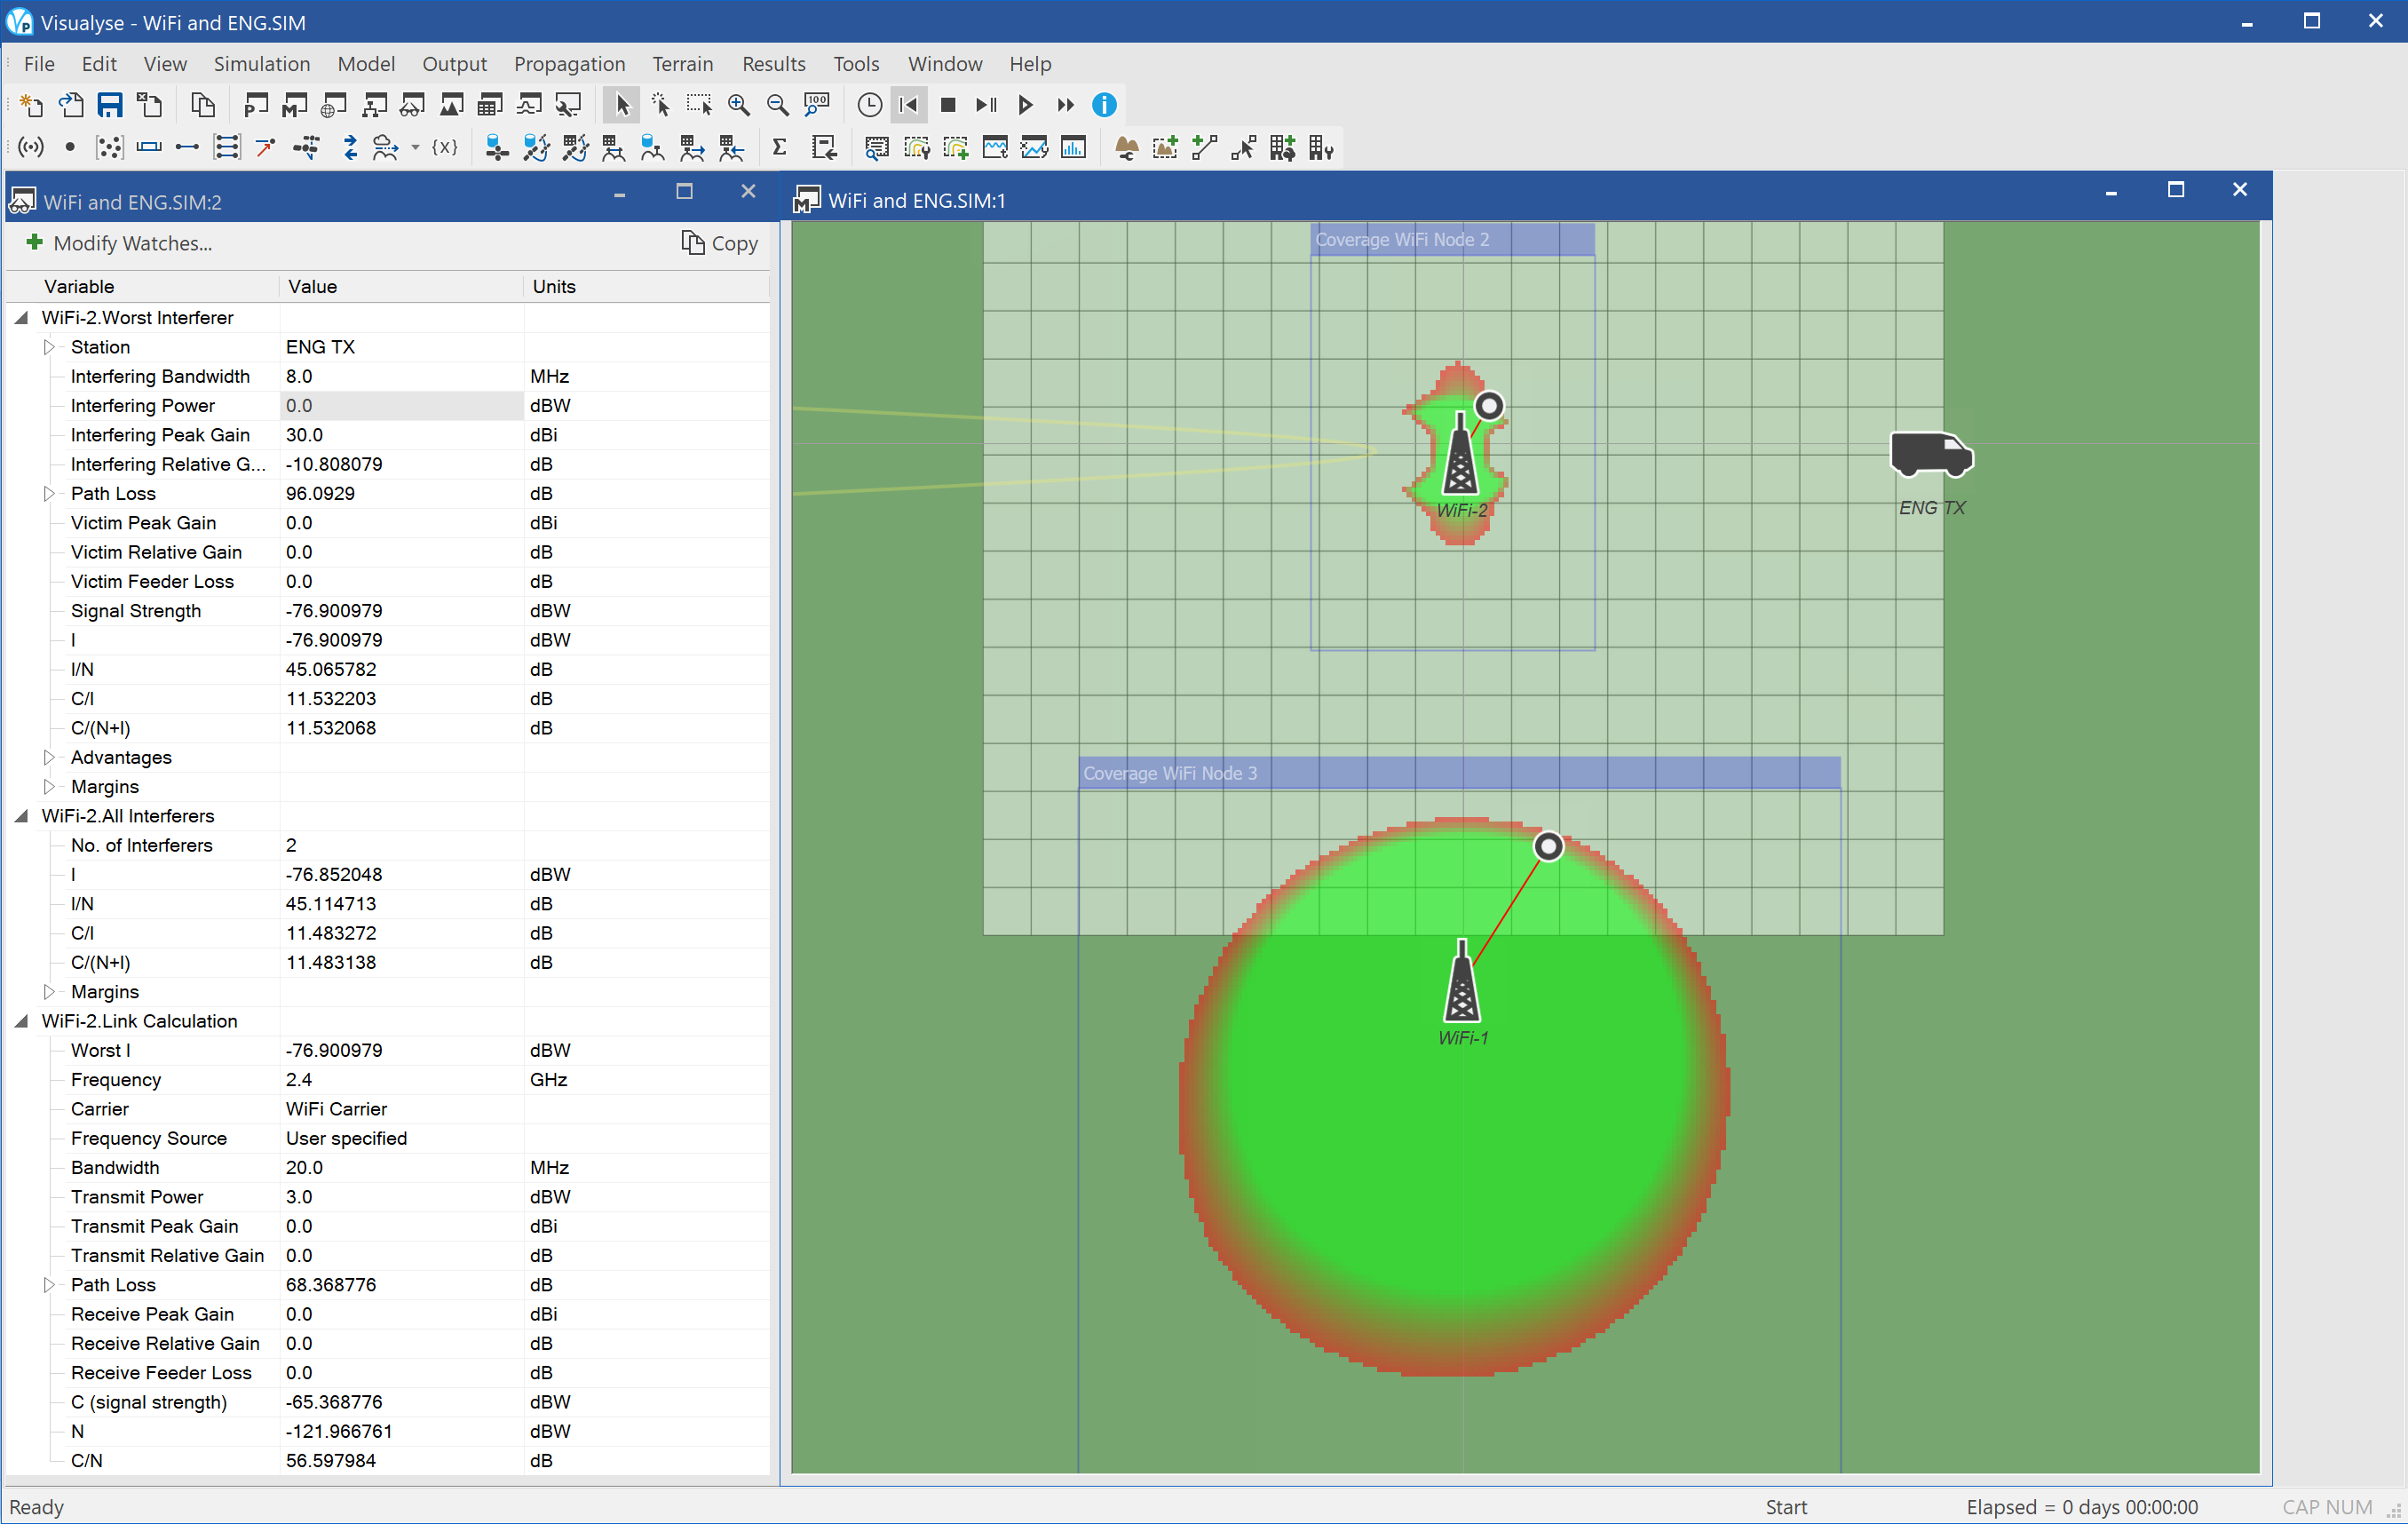
There are a number of bands that are or could be used for Electronic News Gathering (ENG). This example considers one such, use of the licence exempt 2.4 GHz band for ENG.
This is also widely used for wireless access networks using the 802.11 standard, Wi-Fi. The question is then what is the implication of widespread use of the 2.4 GHz band by ENG transmitters.
The scenario considers two Wi-Fi networks, with central node and remote user. The coverage is predicted using a dual slope propagation model based upon ITU-R Rec.P.1791. The simulation considers the downlink direction: it would also be necessary to consider the uplink in more detailed analysis.
An ENG is modelled as transmitting pointing directly at one of the Wi-Fi nodes, and the impact on coverage modelled taking into account this source of interference. The interference between the Wi-Fi networks is also included. It can be seen that the coverage of the Wi-Fi network is severely reduced by the impact of the ENG, while there is only minor reduction in coverage due to one Wi-Fi node on another1.
The figure above shows two windows open:
- Mercator view (right) showing locations of the Wi-Fi nodes, a test user, the ENG transmitter, and the coverage of each wireless network in the presence of interference. To give an idea on scale, the grid lines are spaced every 10 m.
- Watch window (left) showing link budgets of the wanted and interfering signals of the most effected Wi-Fi user.
-
Note that as 802.11 uses carrier detection to avoid collisions, there is usually time sharing of the radio spectrum between nearby Wi-Fi networks. ↩
PCS/AWS
On the 18th September 2006, the FCC’s Auction 66 completed, releasing the 1710-1755 MHz and 2110-2155 MHz bands for Advanced Wireless Services (AWS). This opened up new swaths of spectrum for advanced PCS applications, ranging from web browsing to TV, direct to any suitable handset.
However, these bands have a significant number of incumbents, including government (typically military) and private wireless services – in particular fixed links. These existing services have rights that are protected under Title 47 Part 24 of the Code of Federal Regulations, in which the FCC requires that new entrants do not cause them harmful interference. Furthermore the new entrants must accept interference into their networks from existing licensed systems.
In order to be able to provide a widespread high quality network it is important to be able to analyse this sharing scenario accurately, in order to:
- Identify scenarios where interference between PCS and incumbents would be acceptable
- Identify scenarios where interference between PCS and incumbents would not be acceptable
- Identify strategies that could be used to facilitate sharing in problem cases
- Support the migration of existing services to other bands if necessary
- Potentially offer ability to automate technical coordination via on-line web service
This section describes how Visualyse Professional could be used to support such analysis and contains the following examples:
Note that this sort of analysis could be used in other bands and in other geographic regions.
Analysis of FS into mobile RX
| Action: | None |
| Modules used: | Terrain |
| Terrain regions: | Virginia terrain |
| Frequency band: | L / S |
| Station types: | Fixed, Mobile |
| Propagation models: | ITU-R Rec. P.452 |
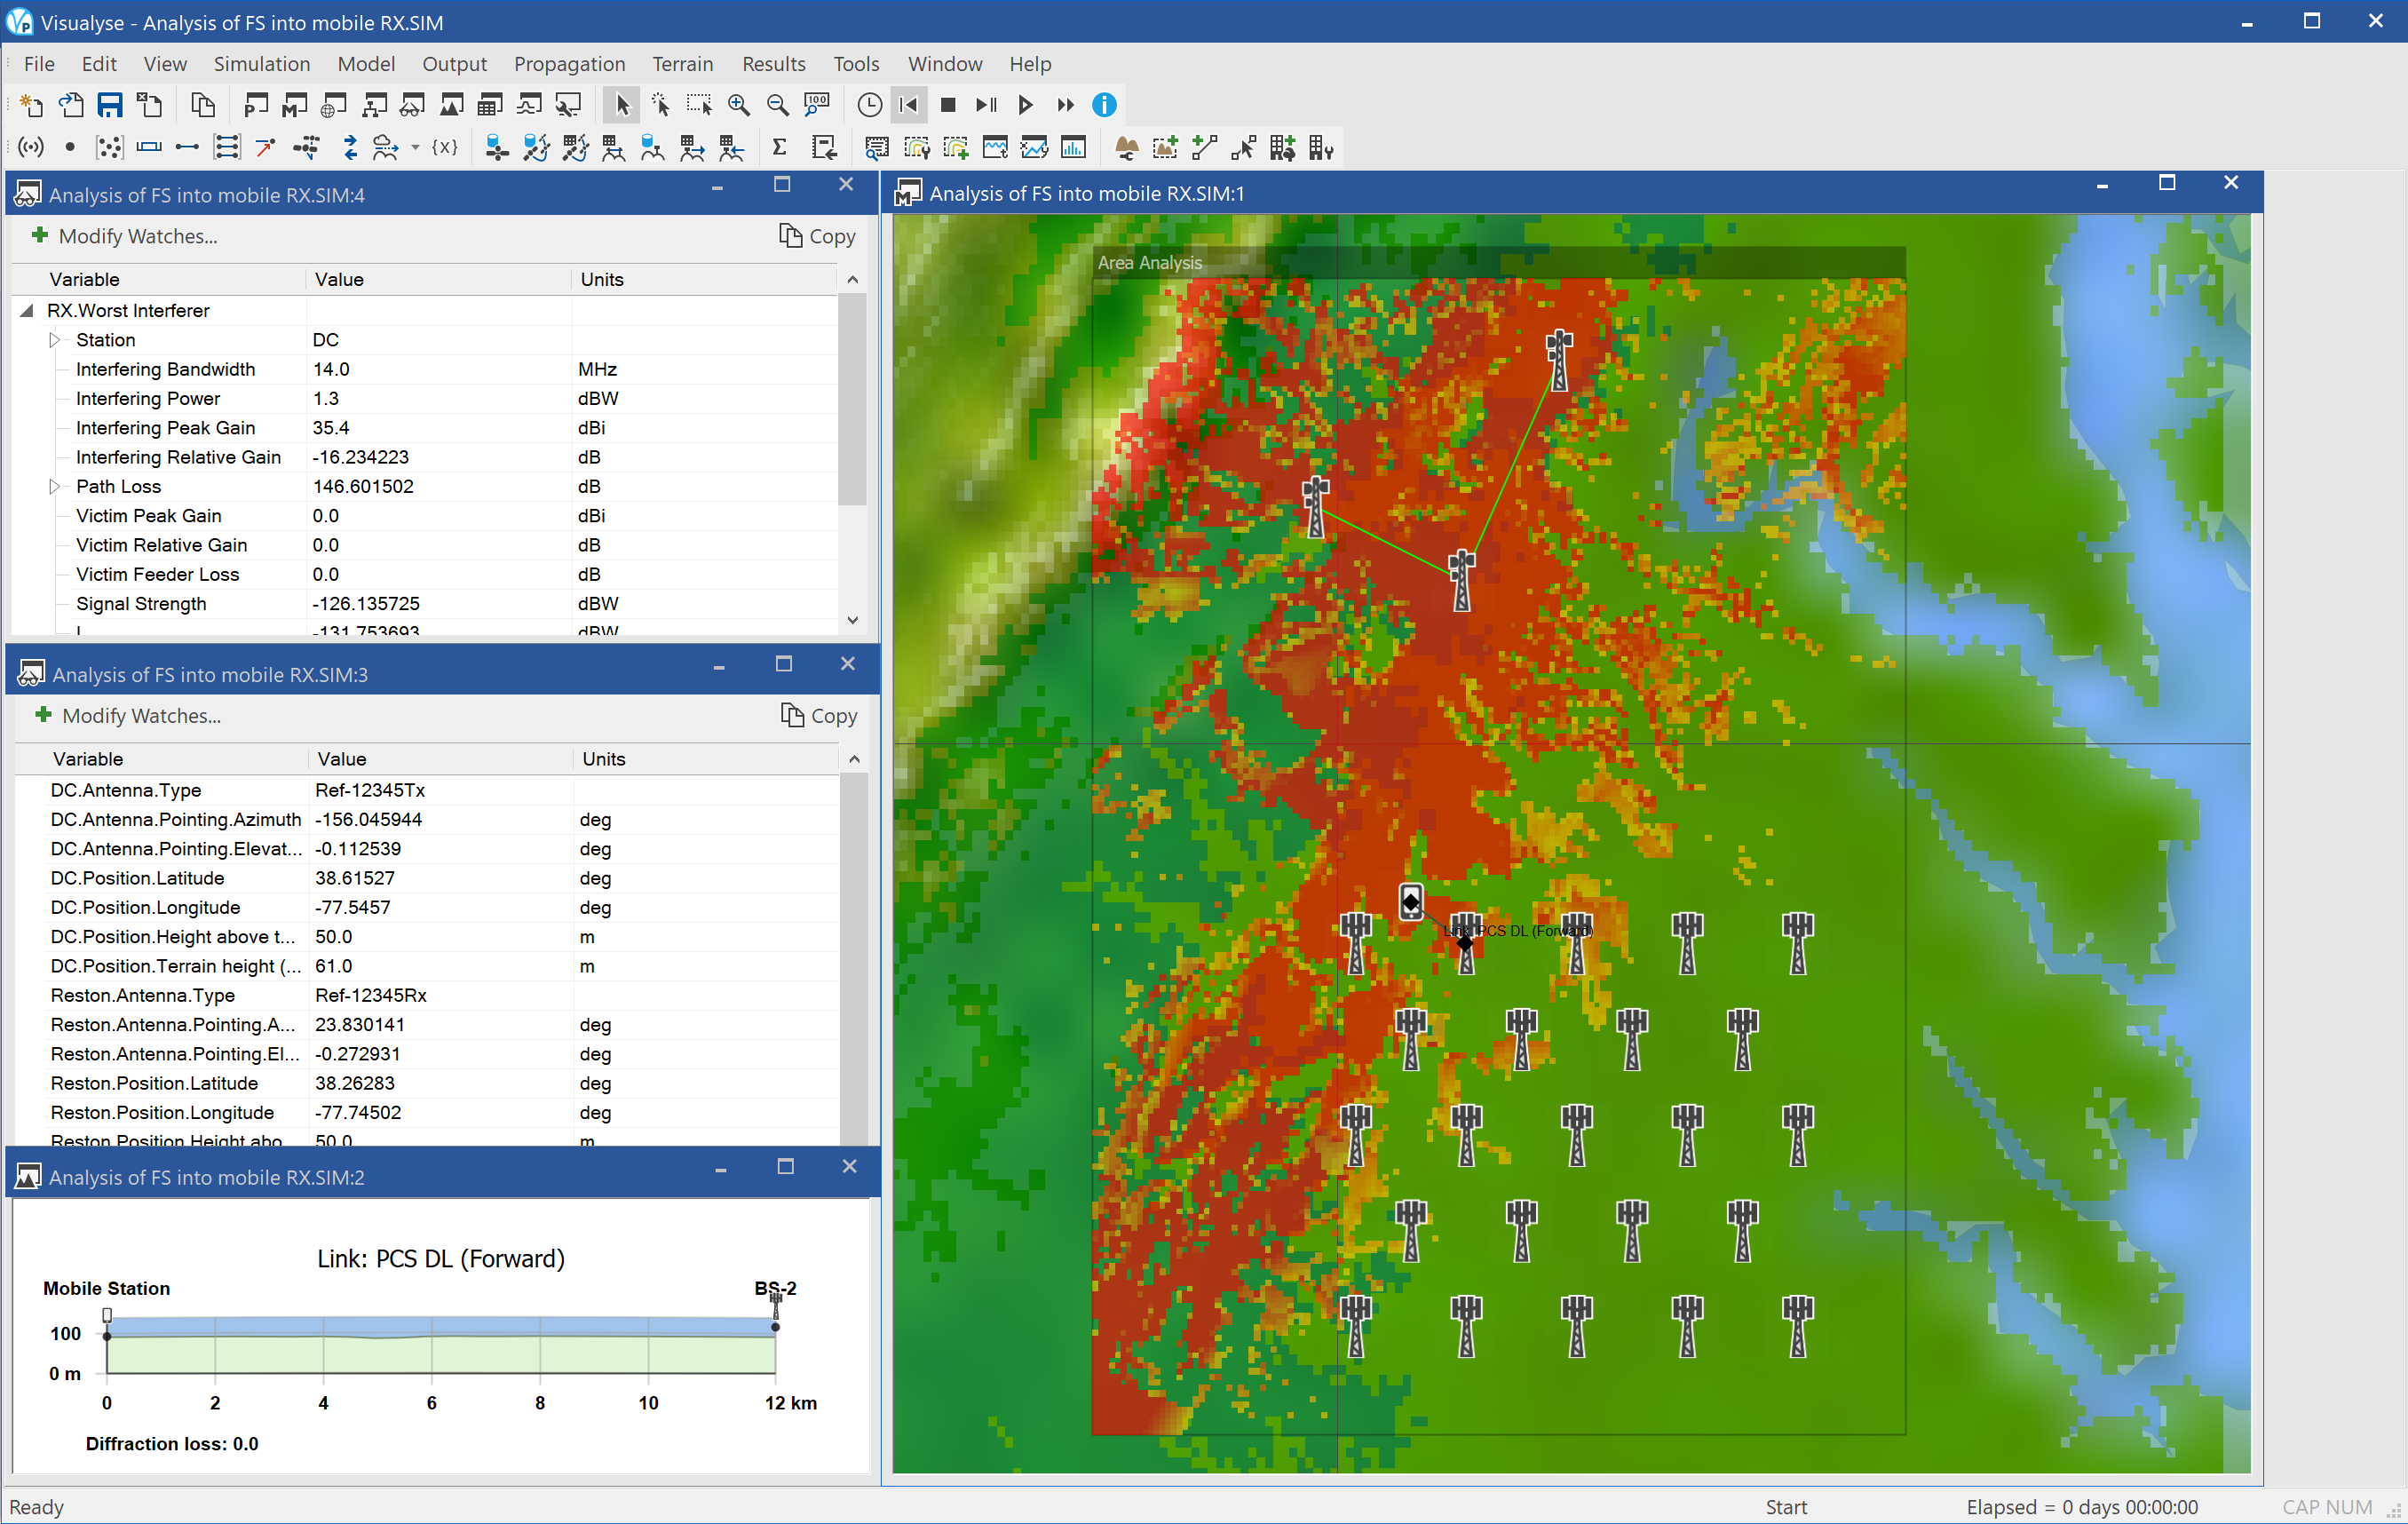
This example shows Visualyse Professional identifying the area where the downlink of a mobile network would suffer interference from a fixed service link.
The simulation contains two connected point to point fixed links in the area South-East of Washington DC. Around Richmond the PCS licence holder has deployed a grid of base stations and would like to identify those areas that could be affected by the fixed link.
The fixed link can be included in the simulation either by entering the parameters by hand, using the spreadsheet based FS import tool, or using the terrestrial IFIC interface (if the data is available).
An Area Analysis has been created that shows locations where the I/N would exceed -6 dB, i.e. increase the noise figure by 1 dB. At each pixel the interfering signal is calculated using the propagation model in ITU-R Rec.P.452 using a terrain database to derive path profiles.
The screen show above shows four windows open:
- Mercator view (right) showing a map1 of region South East of Washington, colour-tint of the terrain height, Area Analysis showing in red where I/N > - 6 dB, locations of stations
- Watch window (top left) showing some of the key simulation parameters
- Watch window (middle left) showing the link budget to a mobile located at the test point
- Path profile (bottom left) showing a slice through the terrain from one of the FS transmitters to the test point.
PCS-FS Demo - BS TX
| Action: | None |
| Modules used: | Terrain |
| Terrain regions: | Virginia terrain |
| Frequency band: | L / S |
| Station types: | Fixed, Mobile |
| Propagation models: | ITU-R Rec. P.452 |
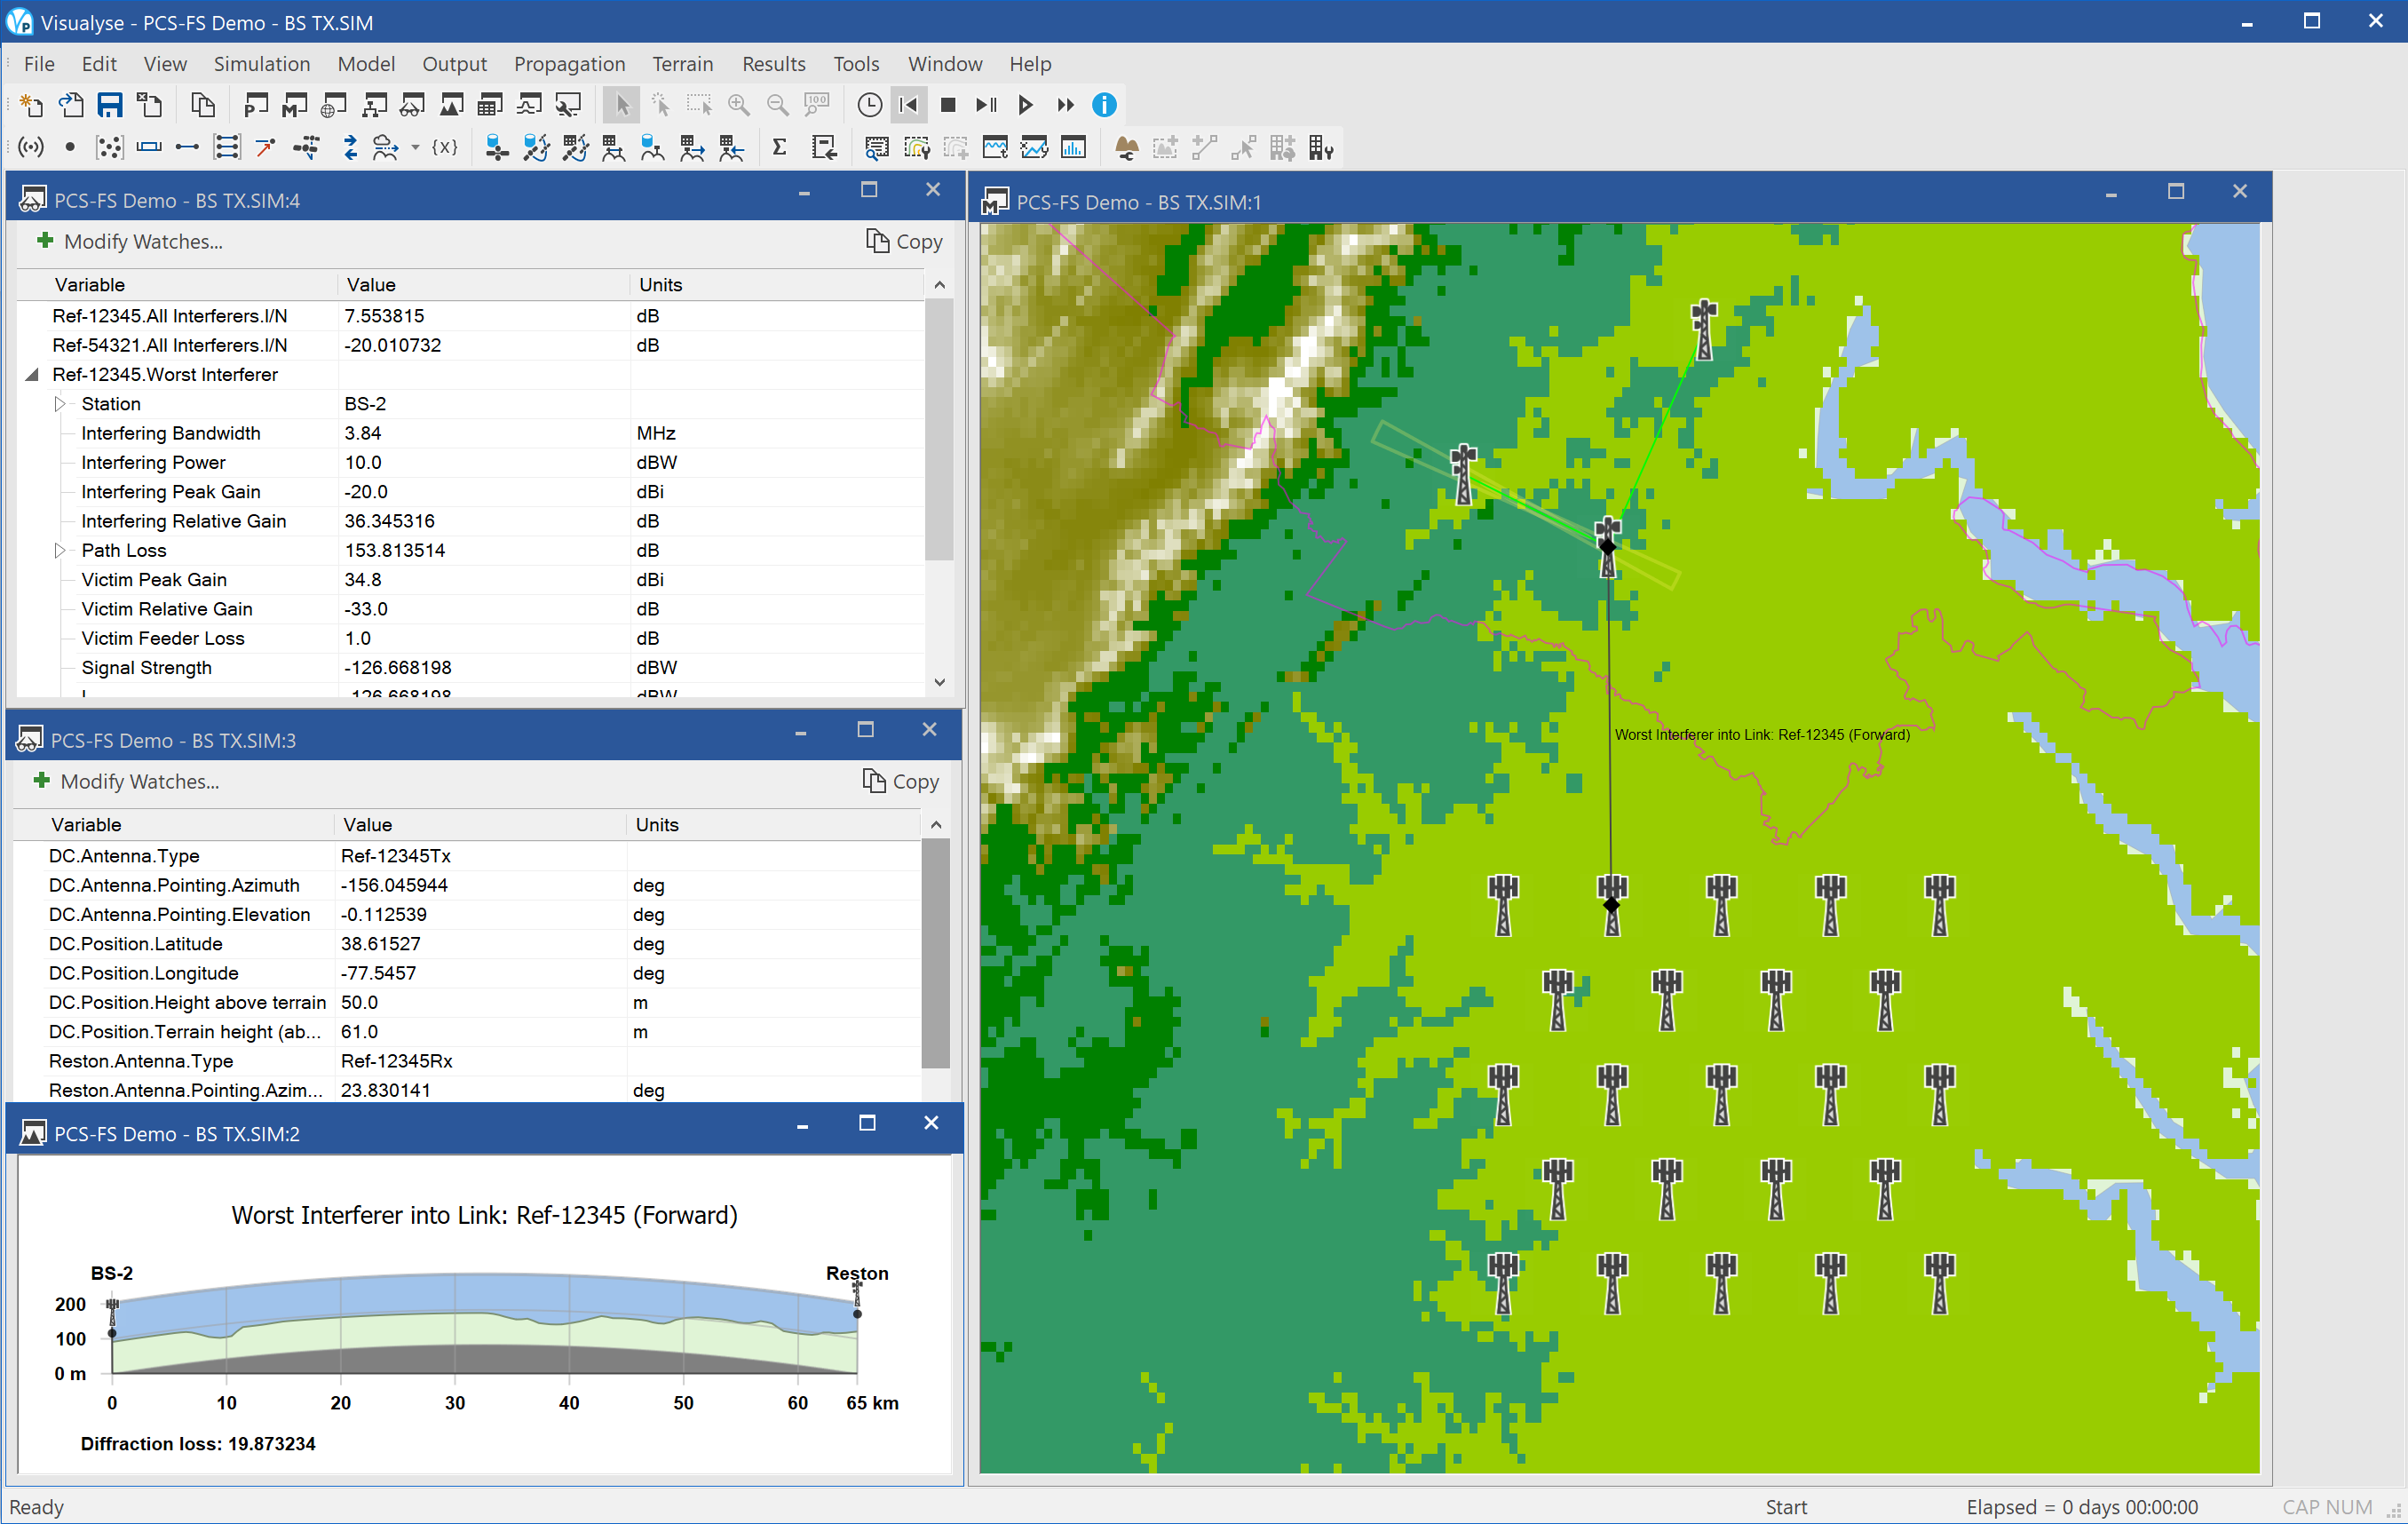
This example shows a scenario considering interference in the other direction – from the new entrant PCS/AWS network into an incumbent FS network, in particular from the downlink, Base Station (BS) transmit case.
The mobile operator has deployed a network of base stations in the area of Richmond South East of Washington DC and needs to identify the interference it would cause into the FS receivers.
There a number of ways in which the BS locations could be entered – either manually, using the hexagonal service area wizard, or if locations are known, using a CSV file containing (latitude, longitudes).
The base station antennas could be defined using standard patterns such as ITU-R Rec.F.1336 or in tables if available from the manufacturer such as in the figure below that shows the elevation slice of a pattern that uses downtilt.
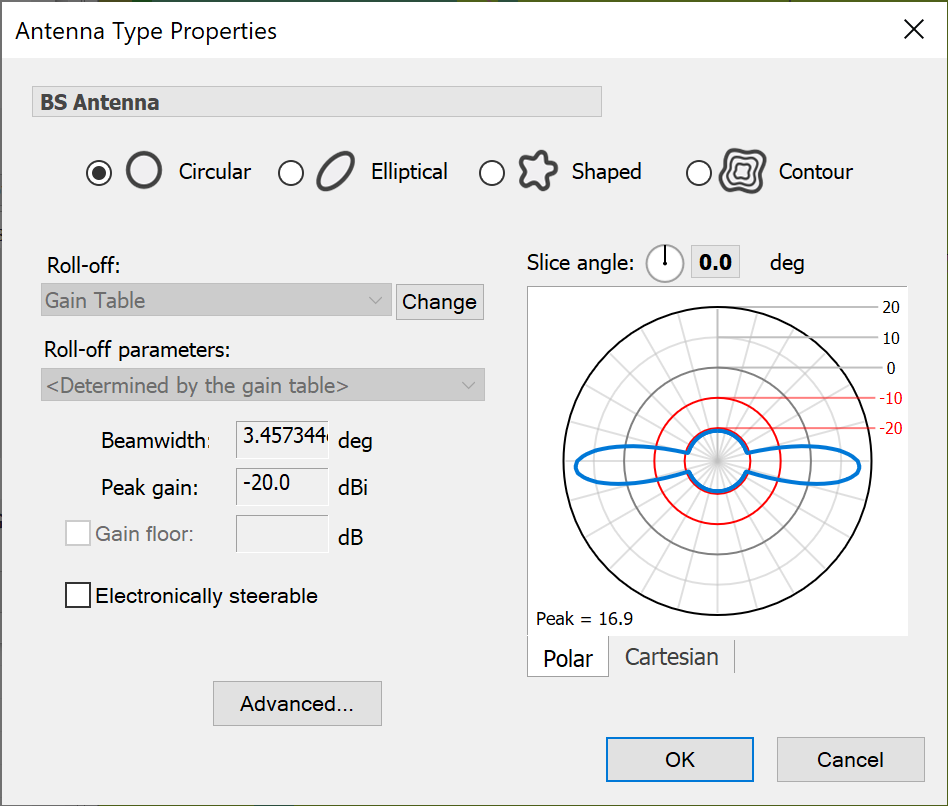
The fixed links have been modelled using the fade model in ITU-R Rec.P.530, but Visualyse Professional also includes the TIA Bulletin 10F fade model.
The screen show above shows four windows open:
- Mercator view (right) showing a map of region South East of Washington, colour-tint of the terrain height, locations of stations.
- Watch window (top left) showing some of the key simulation parameters
- Watch window (middle left) showing the link budget to one of the fixed service receivers
- Path profile (bottom left) showing a slice through the terrain to one of the FS receivers
As the simulation is static there is no need to run the simulation – the results are given directly in the watch windows. The simulation could be extended to do C/I analysis using Monte Carlo methods to convolve fading on the fixed link with variations in interfering signal due to propagation and traffic variation.
PCS-FS Demo - MS TX
| Action: | Run simulation |
| Modules used: | Terrain, Define Variable |
| Terrain regions: | Virginia terrain |
| Frequency band: | L / S |
| Station types: | Fixed, Mobile |
| Propagation models: | ITU-R Rec. P.452 |
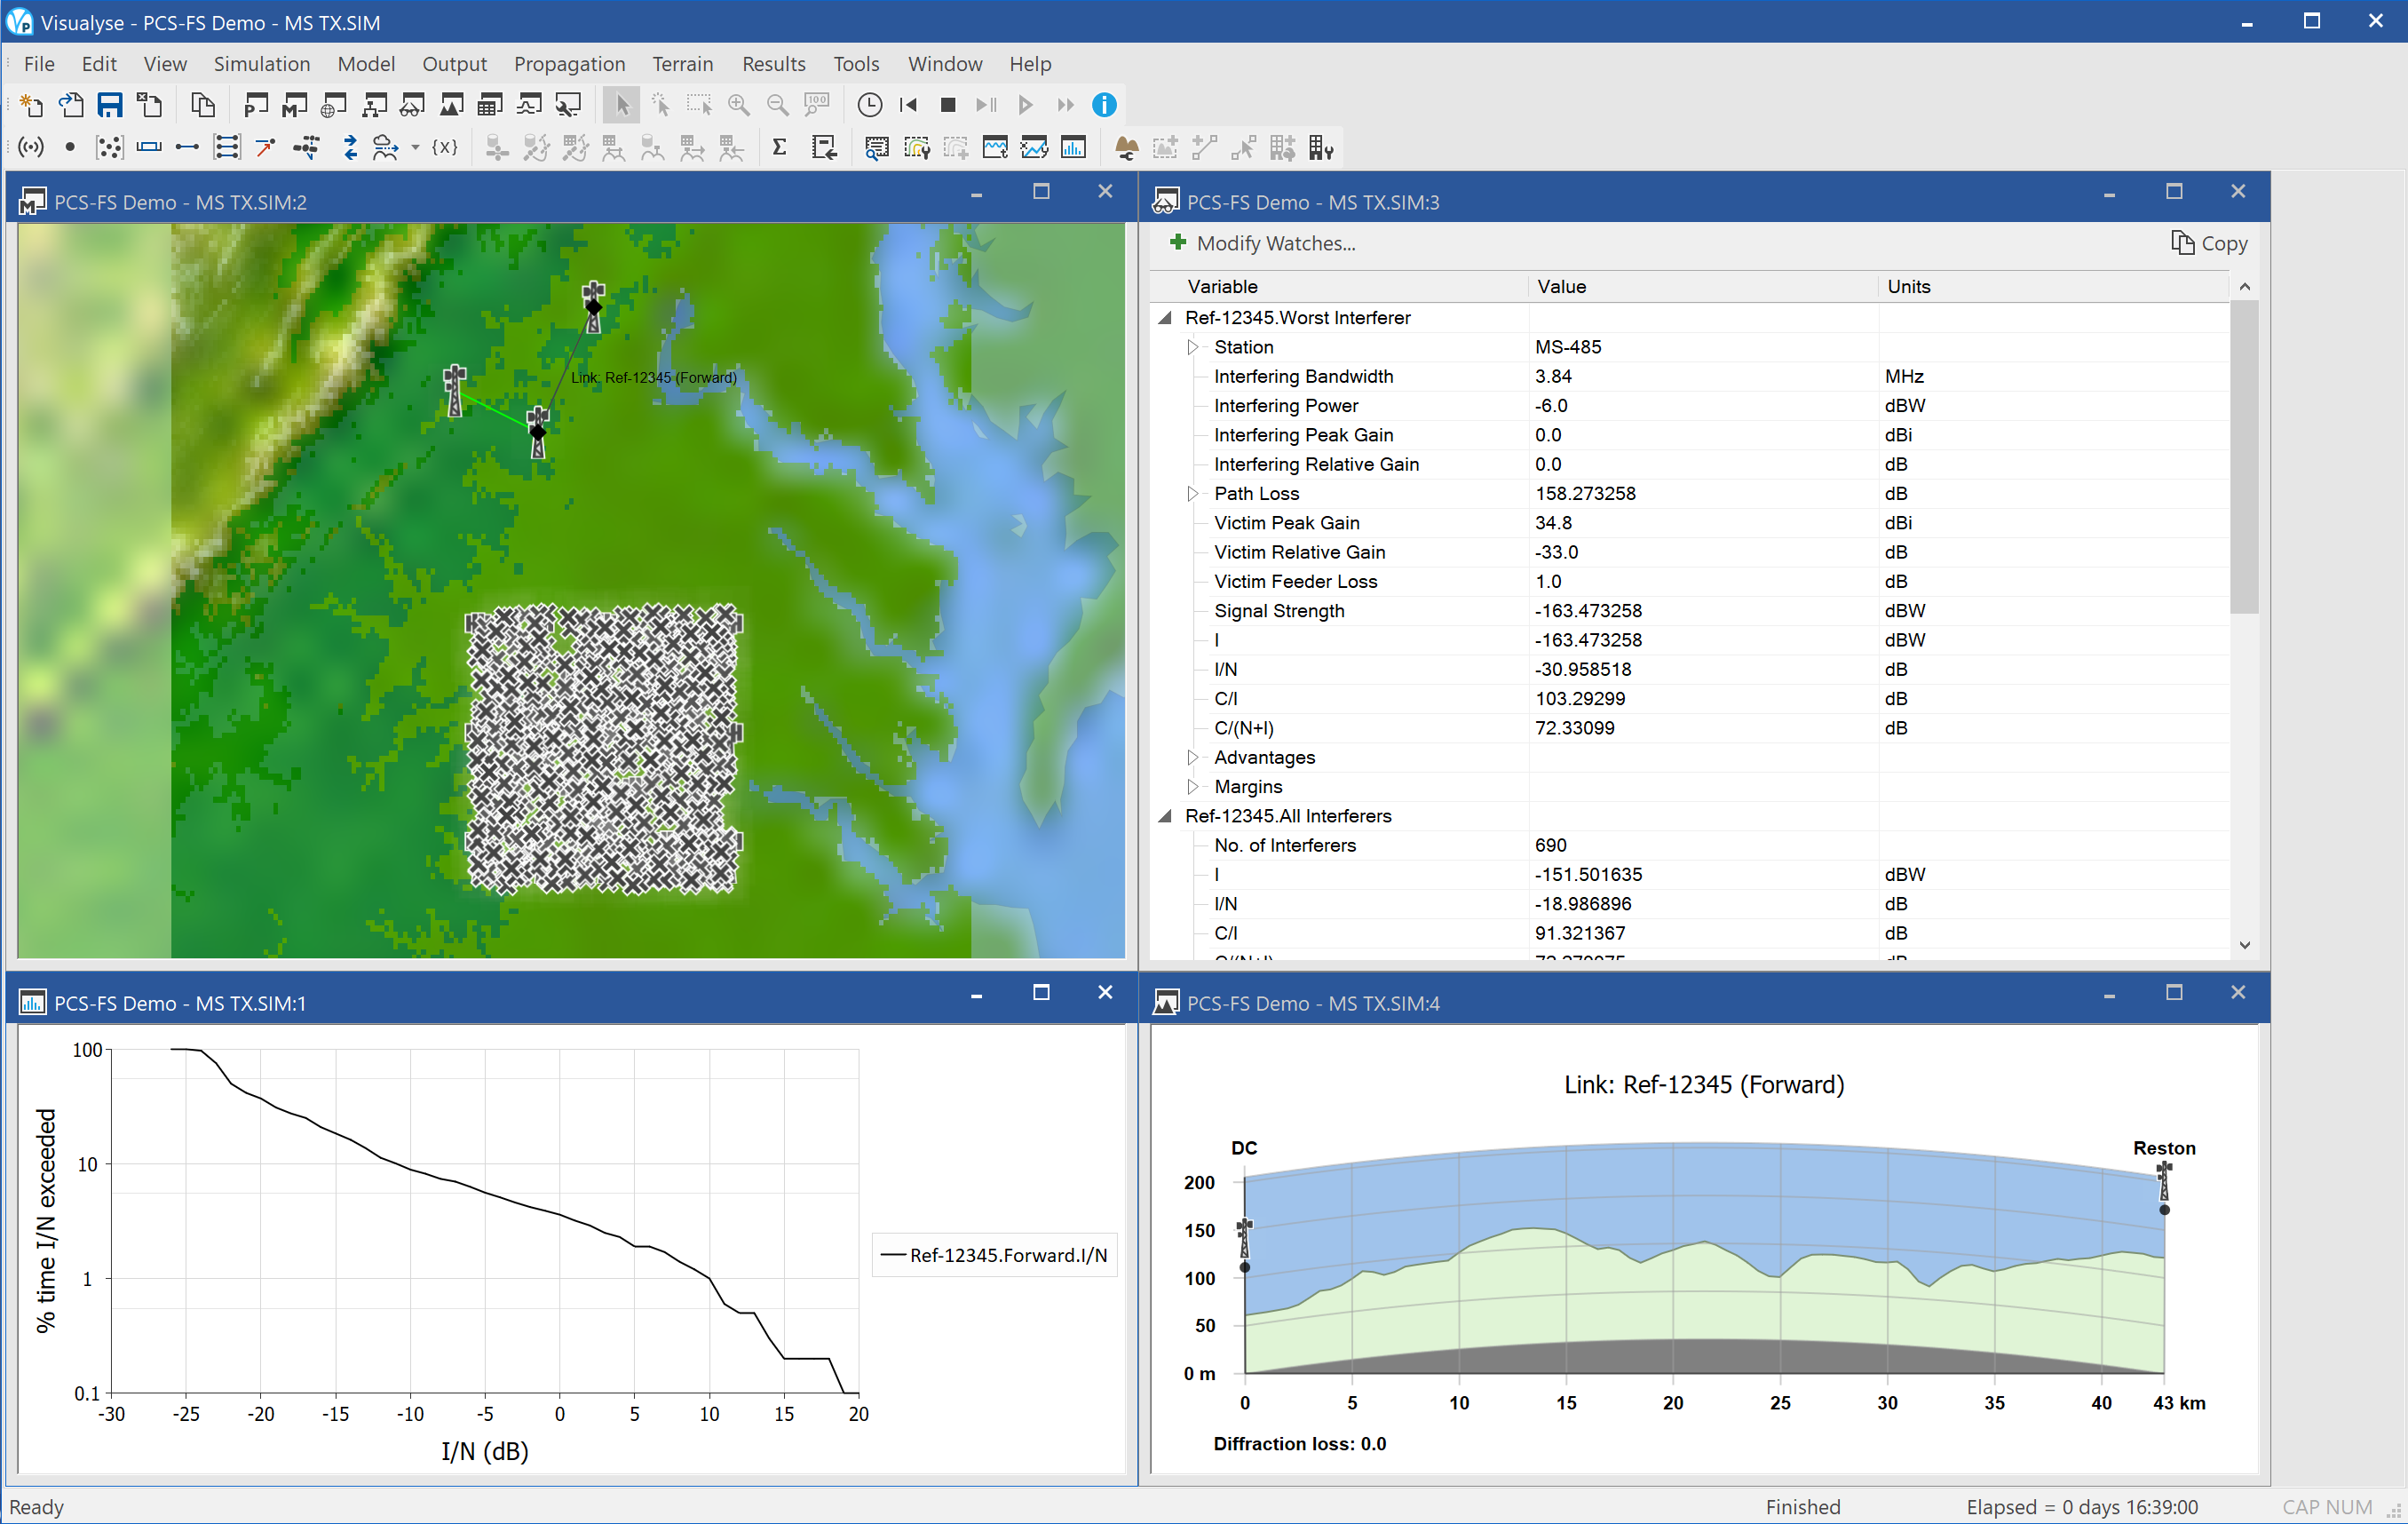
This example considers interference from the mobile uplink direction into a point to point fixed link. This requires Monte Carlo modelling methods, as there can be significant variation in interference due to variations in:
- Mobile traffic level
- Mobile location altering the gain at the FS receiver
- Mobile location varying the distance and path profile between mobile and FS receiver
- Mobile location impacting the EIRP when using power control
- Propagation conditions
This type of modelling can be easily done in Visualyse Professional using the Define Variable module to randomise various input parameters. The simulation has been created with a hexagonal grid of 23 base stations. Each base station is assumed to support 30 mobiles, making a total of 690 across the service area.
The location of each mobile has been randomised as has the percentage of time used in the propagation model in ITU-R Rec.P.452, which takes account of the terrain database. In this case the EIRP has been fixed at -6 dBW, i.e. -24 dBm, but more advanced simulations could use power control to meet the required quality of service.
In Monte Carlo modelling the interfering level will vary from time step to time step – from sample to sample. Hence the simulation must be run for a number of samples and statistics generated. In this case the key output is the cumulative distribution function (CDF) of the I/N at the FS receiver.
The simulation has been configured to run for 999 time steps to generate 1,000 samples, but it can be run for longer to get statistics for the smaller percentages of time.
The resulting I/N statistics can be used to determine whether the probabilistic interference thresholds have been met. These are typically of the form:
- Long term: I/N > -20 dB for no more than 20% of the time
- Short time: I/N > 18 dB for no more than 0.01% of the time
The screen shot above shows the simulation with four windows open:
- Mercator view (top left), showing a map colour-tinted with terrain, the location of the FS stations, the base stations, and each of the 690 mobiles (as crosses). The map also shows the boundary of the Washington BEA licence.
- Statistics graph (bottom left), showing the cumulative distribution function of I/N at one of the FS receivers
- Watch window (top right), showing the link budget for this sample at one of the FS receivers
- Path profile (bottom right), showing the terrain along one of the FS links
-
Note this map might not be available due to copyright restrictions ↩
Radiolocation
This section contains the following examples:
These examples give general methodologies for analysis of sharing between radar and other services which can be extended to other bands and services, such as:
- Compatibility between radar and broadcasting in UHF bands
- Compatibility between radar and radio astronomy around 15 GHz
Radar and Wind Farms Line of Sight
| Action: | Export to Google Earth |
| Modules used: | Terrain |
| Terrain regions: | South West England 30m |
| Frequency band: | Any |
| Station types: | Fixed, Mobile |
| Propagation models: | Free space, ITU-R Rec. P.526 |
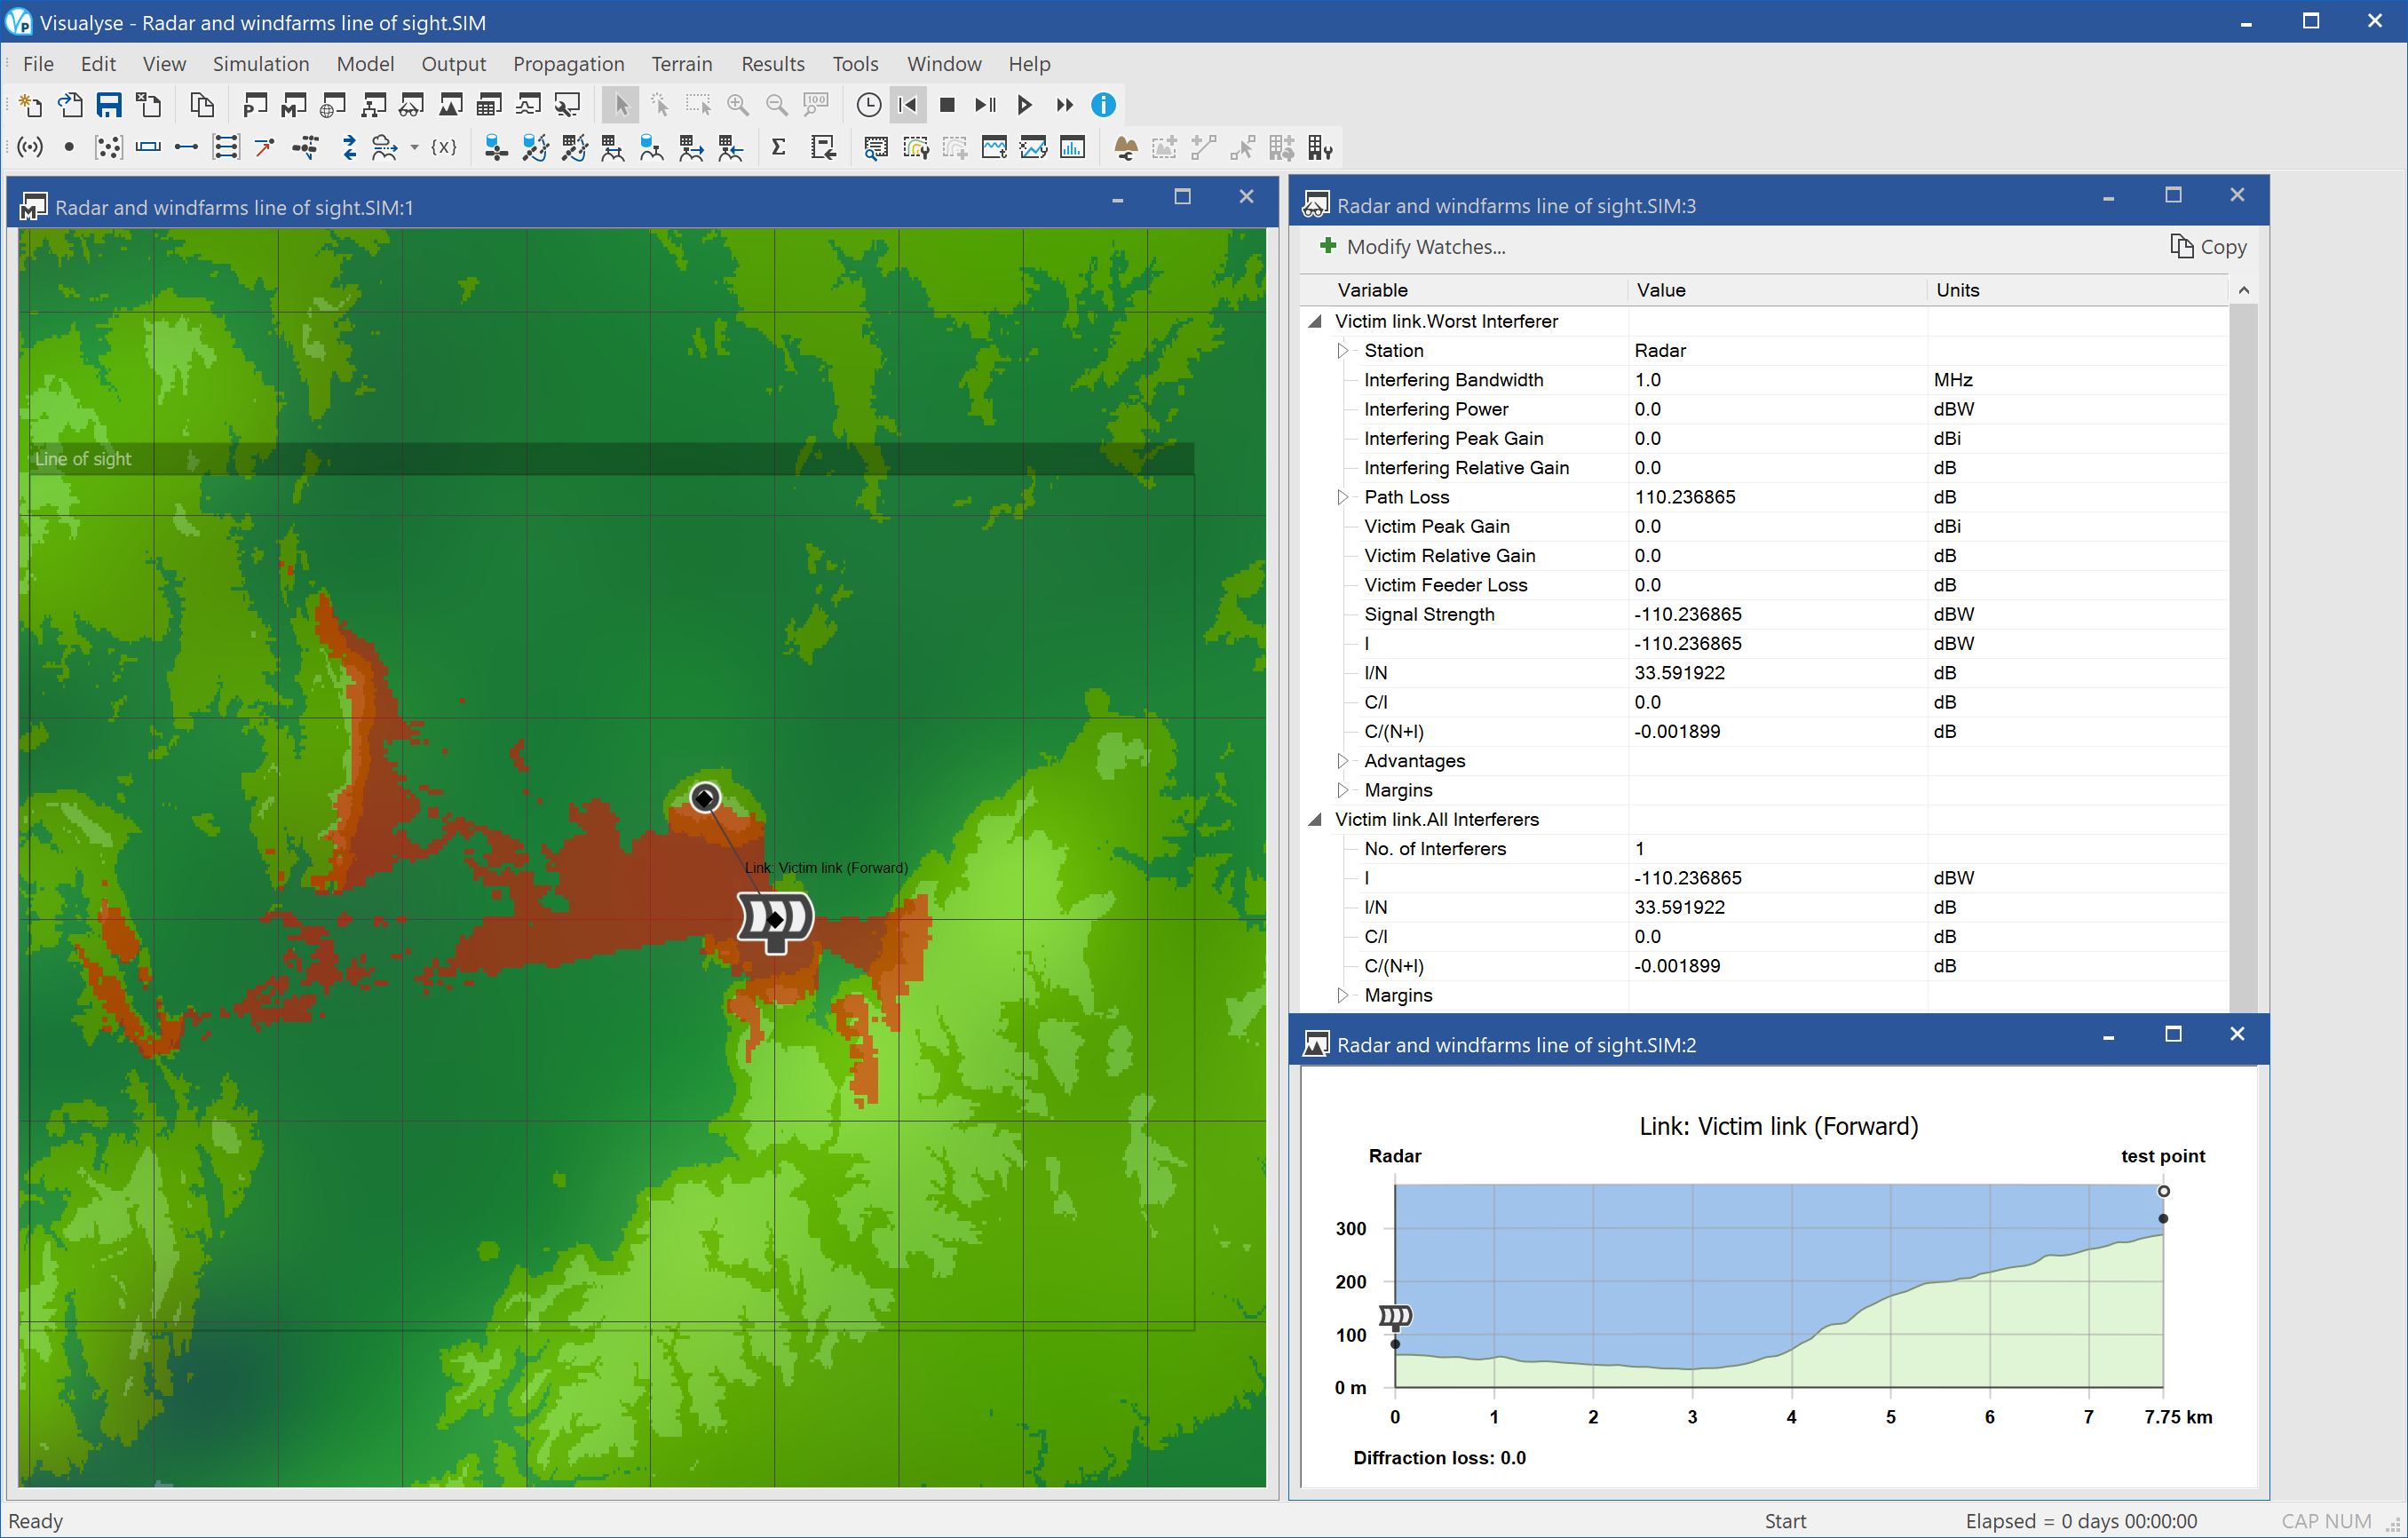
This example file analyses sharing issues related to siting of wind farms near radars. There is concern that the rotating blades of the turbines would create reflections that would be hard to filter out and hence reduce the radar’s effectiveness.
The issues were addressed in the report “The Effect of Windmill Farms On Military Readiness” prepared for the Congressional Defense Committees. It identified a number of mitigation methods, but suggested that the only reliable one was to avoid radar line of sight:
“The mitigations that exist at present to completely preclude any adverse impacts on air defense radars are limited to those methods that avoid locating the wind turbines in radar line of sight of such radars. These mitigations may be achieved by distance, terrain masking, or terrain relief and requires case-by-case analysis.”
This simulation file shows how to generate in Visualyse Professional the exclusion zone around an existing radar site where wind farms should not located.
The method is based upon using a terrain database together with the ITU-R Rec.P.526 diffraction model. Where there is no diffraction the path is classified as with the radio line of sight and hence should be part of the exclusion zone. This uses Visualyse Professional’s Area Analysis tool.
In the screen shot above three windows are open:
- Mercator view (left) showing the exclusion zone created by the Area Analysis, the location of the radar and a test point, and the terrain overlay
- Watch window (top right) showing two link budgets – the wanted signal that uses free space path loss and the interfering path that uses free space path loss with diffraction. As the only difference between the two is the diffraction element, the ratio of the wanted to interfering, is the diffraction term
- Path profile view (bottom right) showing the path through the terrain from the radar to the test point
If you select the Export to Google Earth option and configure the tool appropriately you should see something like the figure below. The masking effects of the terrain can be clearly seen.
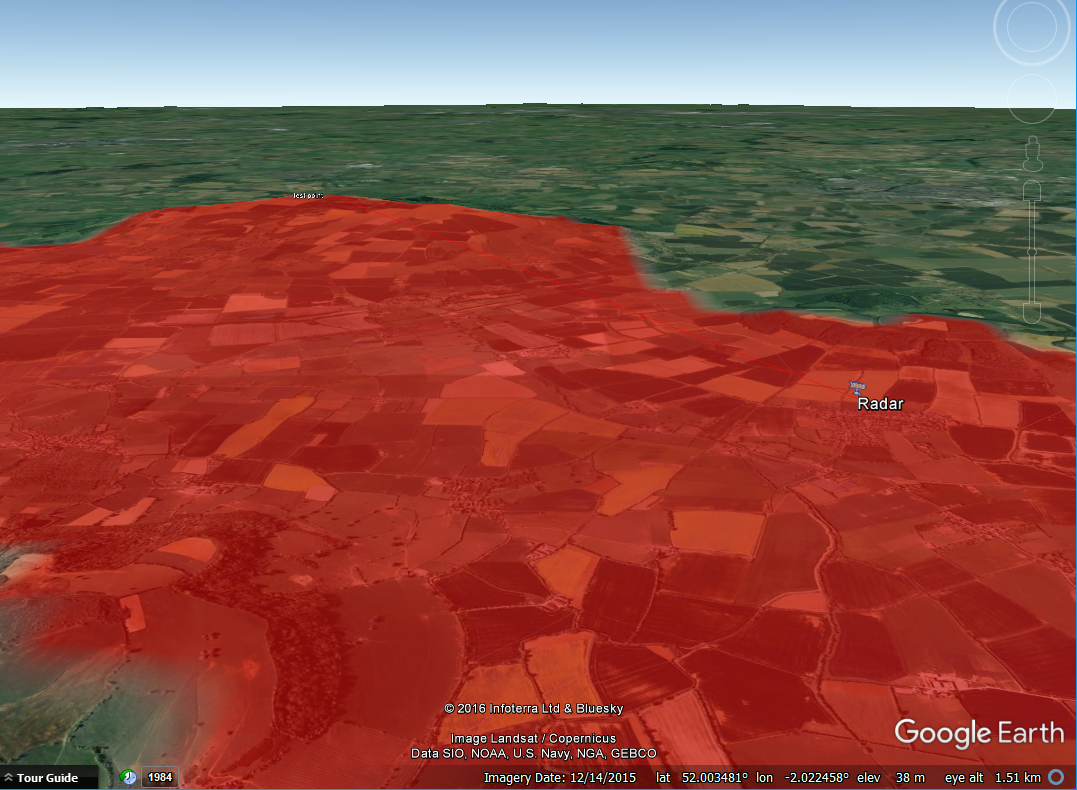
Radar into IMT BS
| Action: | Export to Google Earth |
| Modules used: | Terrain, IDWM |
| Terrain regions: | South East England |
| Frequency band: | S |
| Station types: | Fixed, Mobile, Other |
| Propagation models: | ITU-R Rec. P.452 |
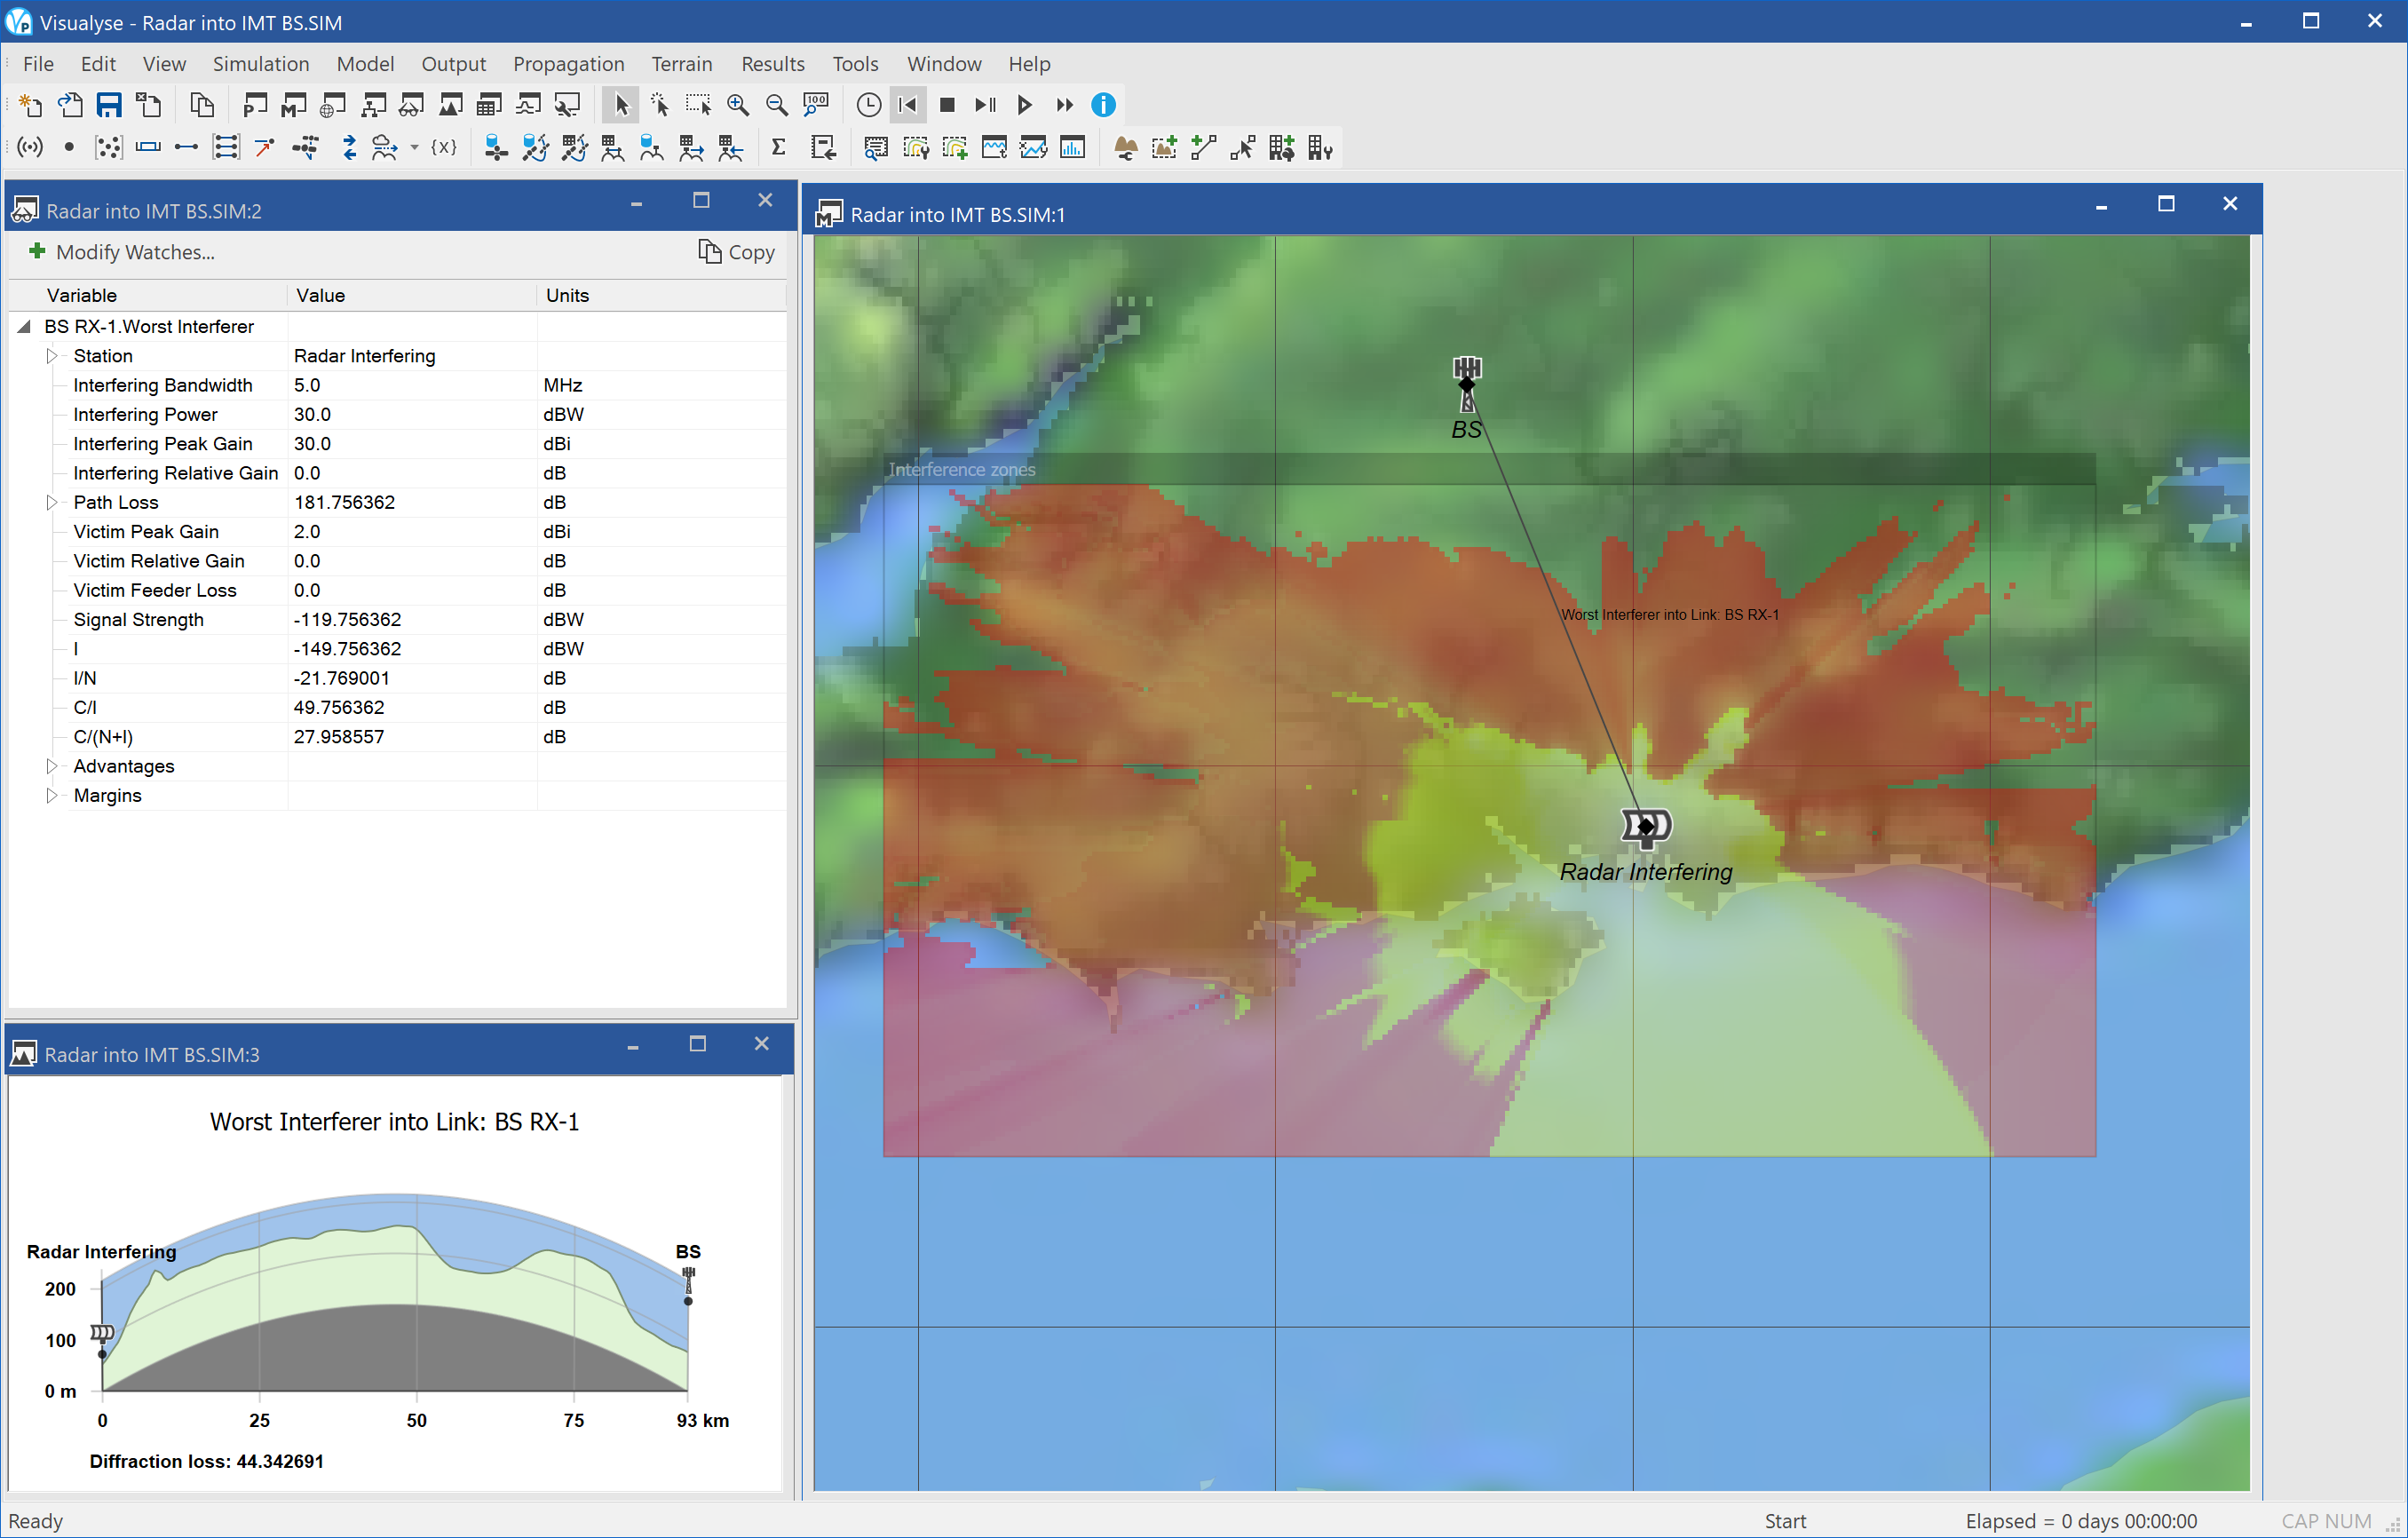
This example analyses the potential to use bands used for maritime radars for terrestrial mobile services at around 2.9 GHz. This is just above the top of the band 2.5 – 2.69 GHz which is allocated to terrestrial mobile, particularly IMT-2000. It would be useful if 3G services could expand into higher frequencies, but there is the danger of interference from radars. However, if these radars are located on the coastline to provide maritime surveillance then there might be the potential to operate inland.
This example identifies the areas where there could be interference from the radar that could exceed an interference threshold of an I/N = -10 dB at a base station, i.e. considering the mobile uplink. A similar analysis could also be done with the downlink.
A particular characteristic of this scenario is the extreme variation in signal from the radar, due to:
- Pulsed nature of signal at the very small scale of time
- Sweeping of the antenna with rotations in the order of a second or seconds
- Propagation variation between radar site and receiver over periods of months or a year
One method to undertake analysis to identify those regions that would suffer interference due radar antenna main beam or far side-lobe interference, i.e. eliminate the 2nd of these two variations. The impact of the first of these is likely to depend upon details of the victim system, in particular is susceptibility to pulsed interference, hence can be considered separately.
Hence for the purposes of this simulation two exclusion zones are identified: those where the I/N threshold is exceeded by main beam interference and those where it is exceeded even for far side lobes. In both cases we are considering the level that not be exceeded for more than 1% of the time due to propagation variation. The exclusion zones were generated using the Area Analysis tool.
The screen shot above shows three views open:
- Watch window (top left) showing the link budget from the radar to the location of the test IMT-2000 base station
- Path profile (bottom left) showing the path through the terrain from the radar to the location of the test IMT-2000 base station
- Mercator view (right) showing the location of the radar, the two exclusion zones in yellow and red and an overlay of the terrain data.
When the Area Analysis is exported to Google Earth the output should look similar to this:
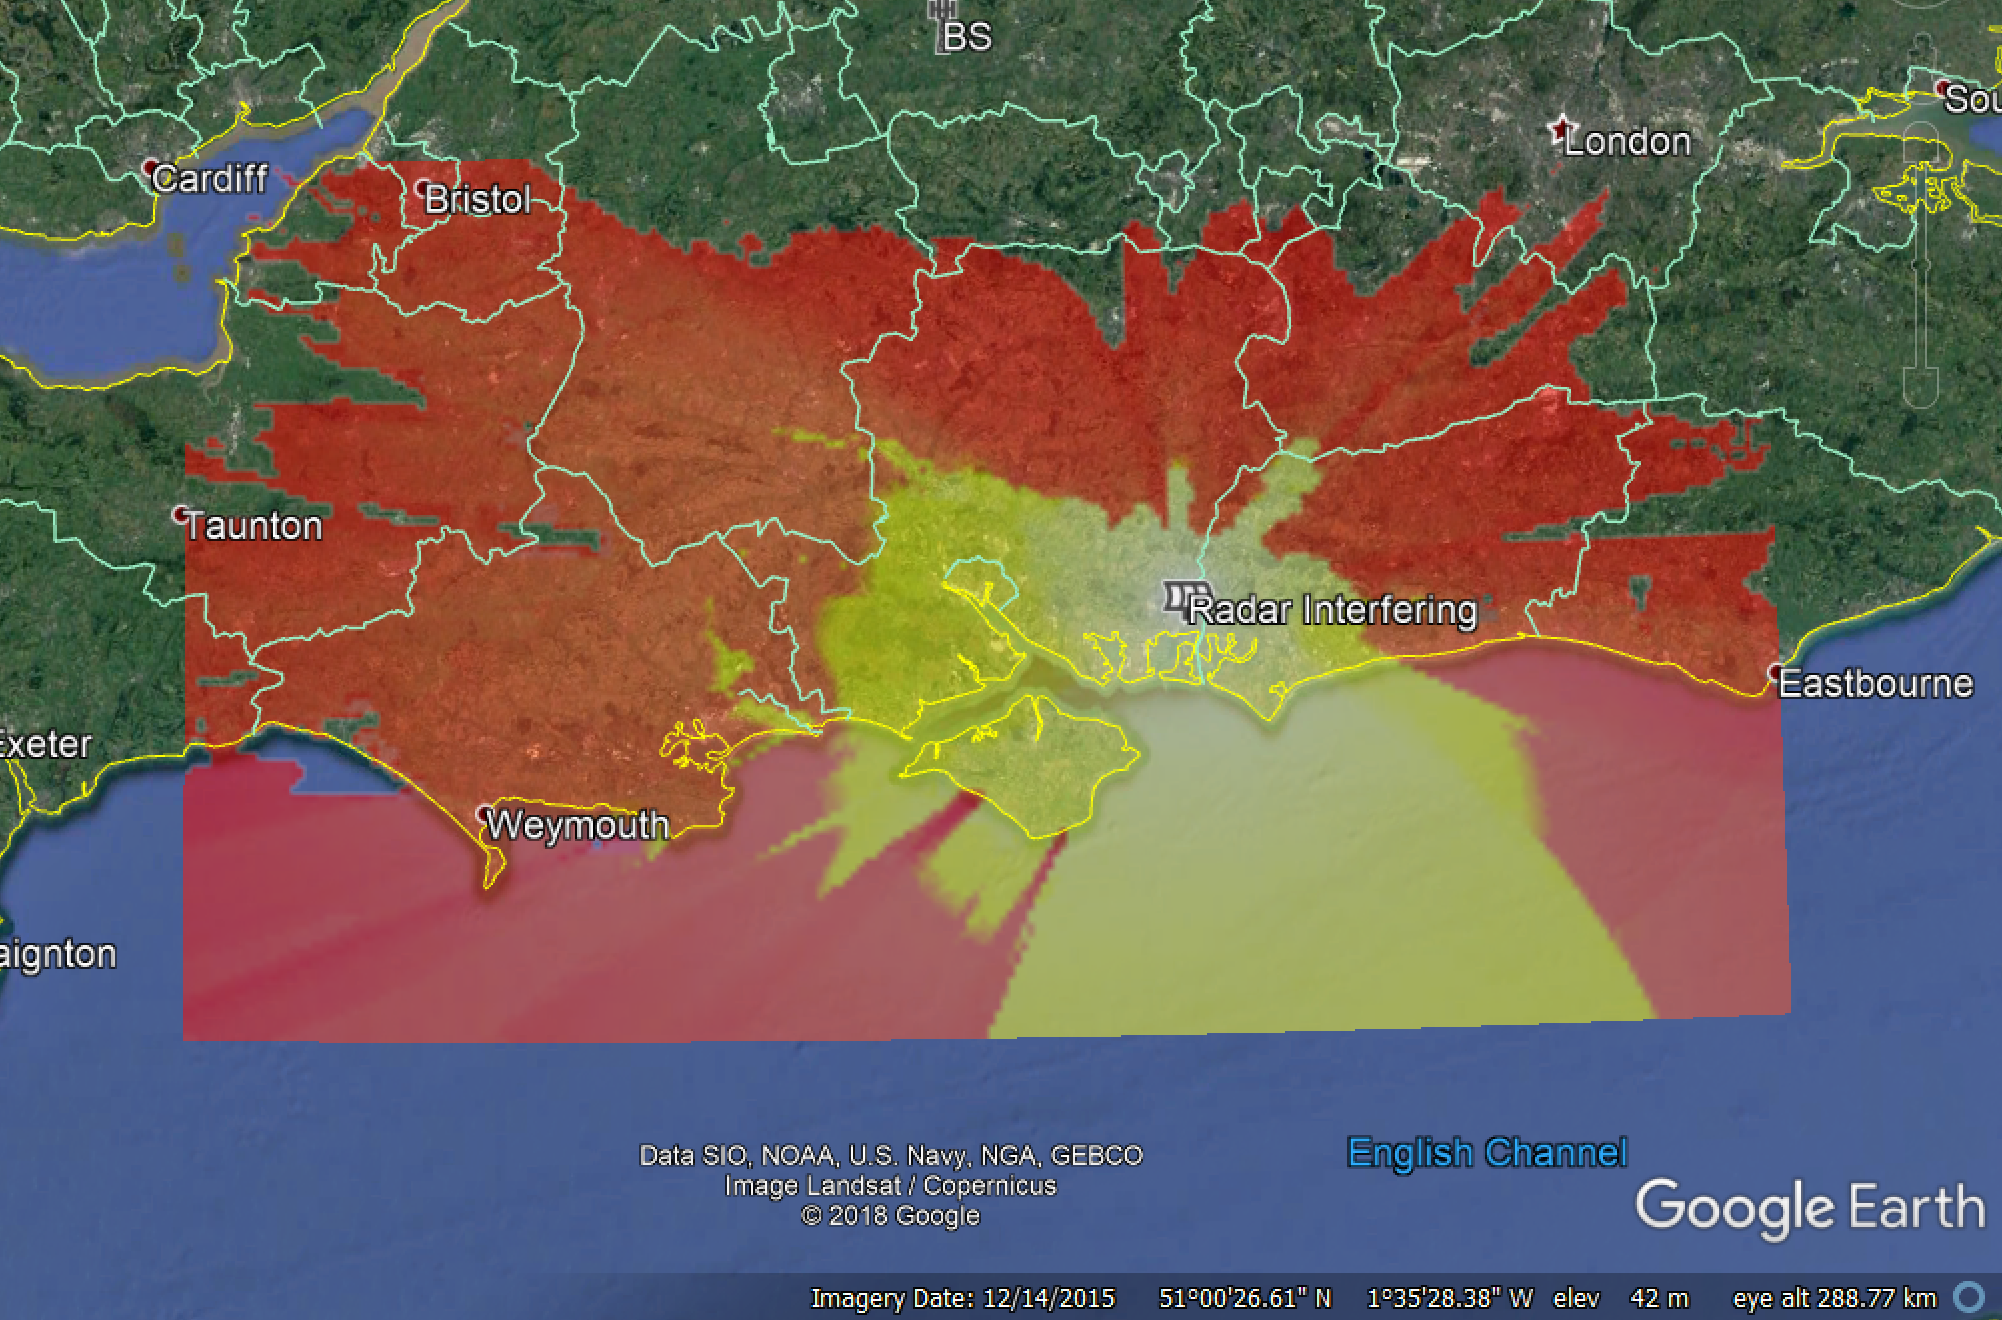
Satellite ES into Radar 13.75 GHz
| Action: | None |
| Modules used: | Terrain, IDWM |
| Terrain regions: | South East England |
| Frequency band: | Ku |
| Station types: | Satellite Earth Station, Other |
| Propagation models: | ITU-R Rec. P.452 |
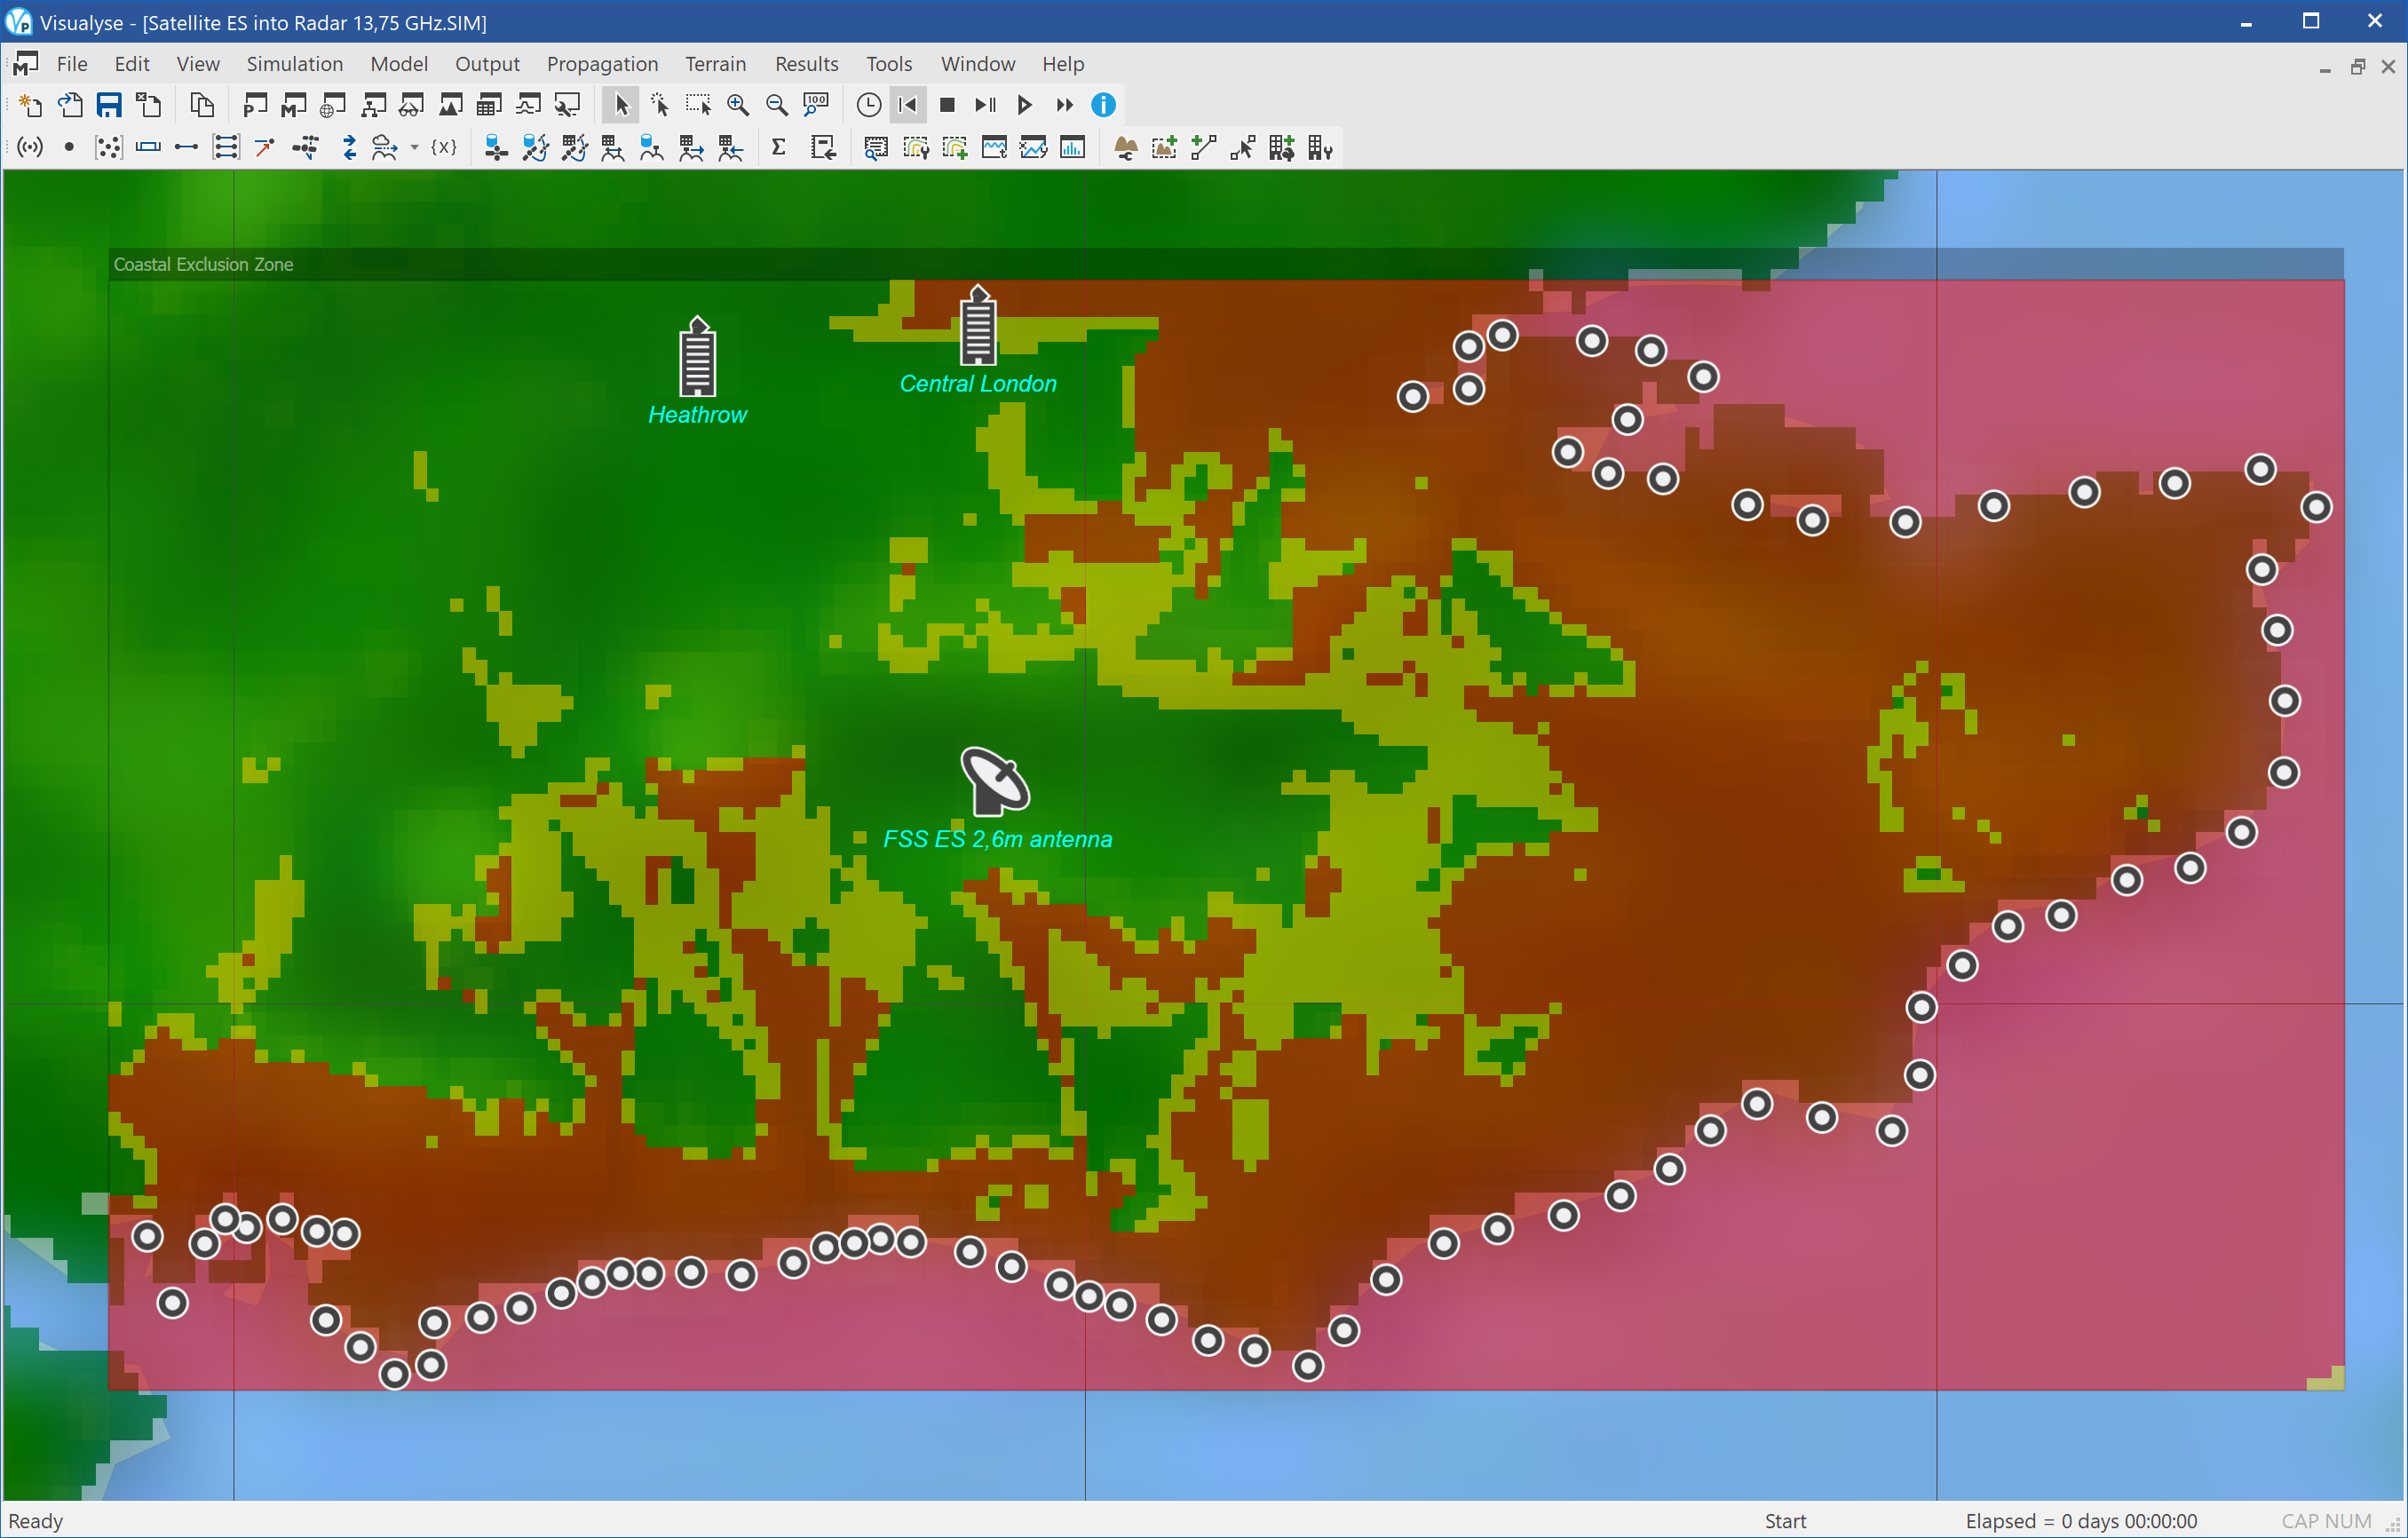
At WRC 2003 PFD limits of –115 dBW / m^2 / 10 MHz for no more than 1% of time were agreed in Article 5.502 of the Radio Regulations. Recently Study Group 4 has agreed S.1712 which contains “Methodologies for determining whether an FSS earth station at a given location could transmit in the band 13.75-14 GHz without exceeding the pfd limits in No. 5.502 of the Radio Regulations, and guidelines to mitigate excesses”.
This example shows how Visualyse Professional can be used to undertake analysis using the methodologies this Recommendation describes, in particular Method 2 in Annex 2, creation of a contour showing the locations where operation is acceptable as it would not exceed the PFD limits;
Visualyse Professional can also be used for analysis under Method 3 in Annex 3 to determine whether a specific location can be used or whether it would exceed the PFD limits. More information is given in a Technical Note available on request, which goes into this sharing scenario in a little more depth.
The aim of this simulation is to identify those locations where it would be feasible to locate a satellite Earth station and not trigger the PFD limits along a national border or, as in this case, a coastline. This was done by:
- Creating a reference satellite Earth station including antenna gain pattern using ITU-R Rec.S.465
- Creating a set of test points around the coastline and get them to transmit with the same EIRP as the satellite Earth station (this task can be assisted by Visualyse Professional’s service area wizard that can create test points along a country’s border).
- Moving the reference satellite Earth station across the area of interest
- At each pixel within the area of interest, calculating the interference from the test points at the Earth station and taking the worst (i.e. highest value). This corresponds to the highest power at the coastline from a transmitting Earth station at that location
- Colouring in that pixel according to the highest signal at the test point from the coastline (i.e. the highest power at the coastline from the test point)
The figure above shows the resulting Area Analysis. The colour scheme chosen was:
Yellow: interference exceeds the threshold but by less than 20 dB. Hence operation at these points might be feasible if site shielding is used
Red: interference exceeds the threshold by at least 20 dB. Hence operation at these points is unlikely to be approved.
Note the simulation used a 1 km grid and low resolution terrain database: the prediction could be improved using higher resolution terrain data and maybe also a land use database to predict clutter loss.
Export to Google Earth can be used to identify those locations where operation would be permitted, as in the example below.

Satellite & Terrestrial
This section contains the following examples:
HEO FSS and FS
| Action: | Run simulation |
| Modules used: | None |
| Terrain regions: | None |
| Frequency band: | Ka |
| Station types: | Non-GSO Satellite, Earth Station, Fixed |
| Propagation models: | Free space, ITU-R Rec.P.676 |
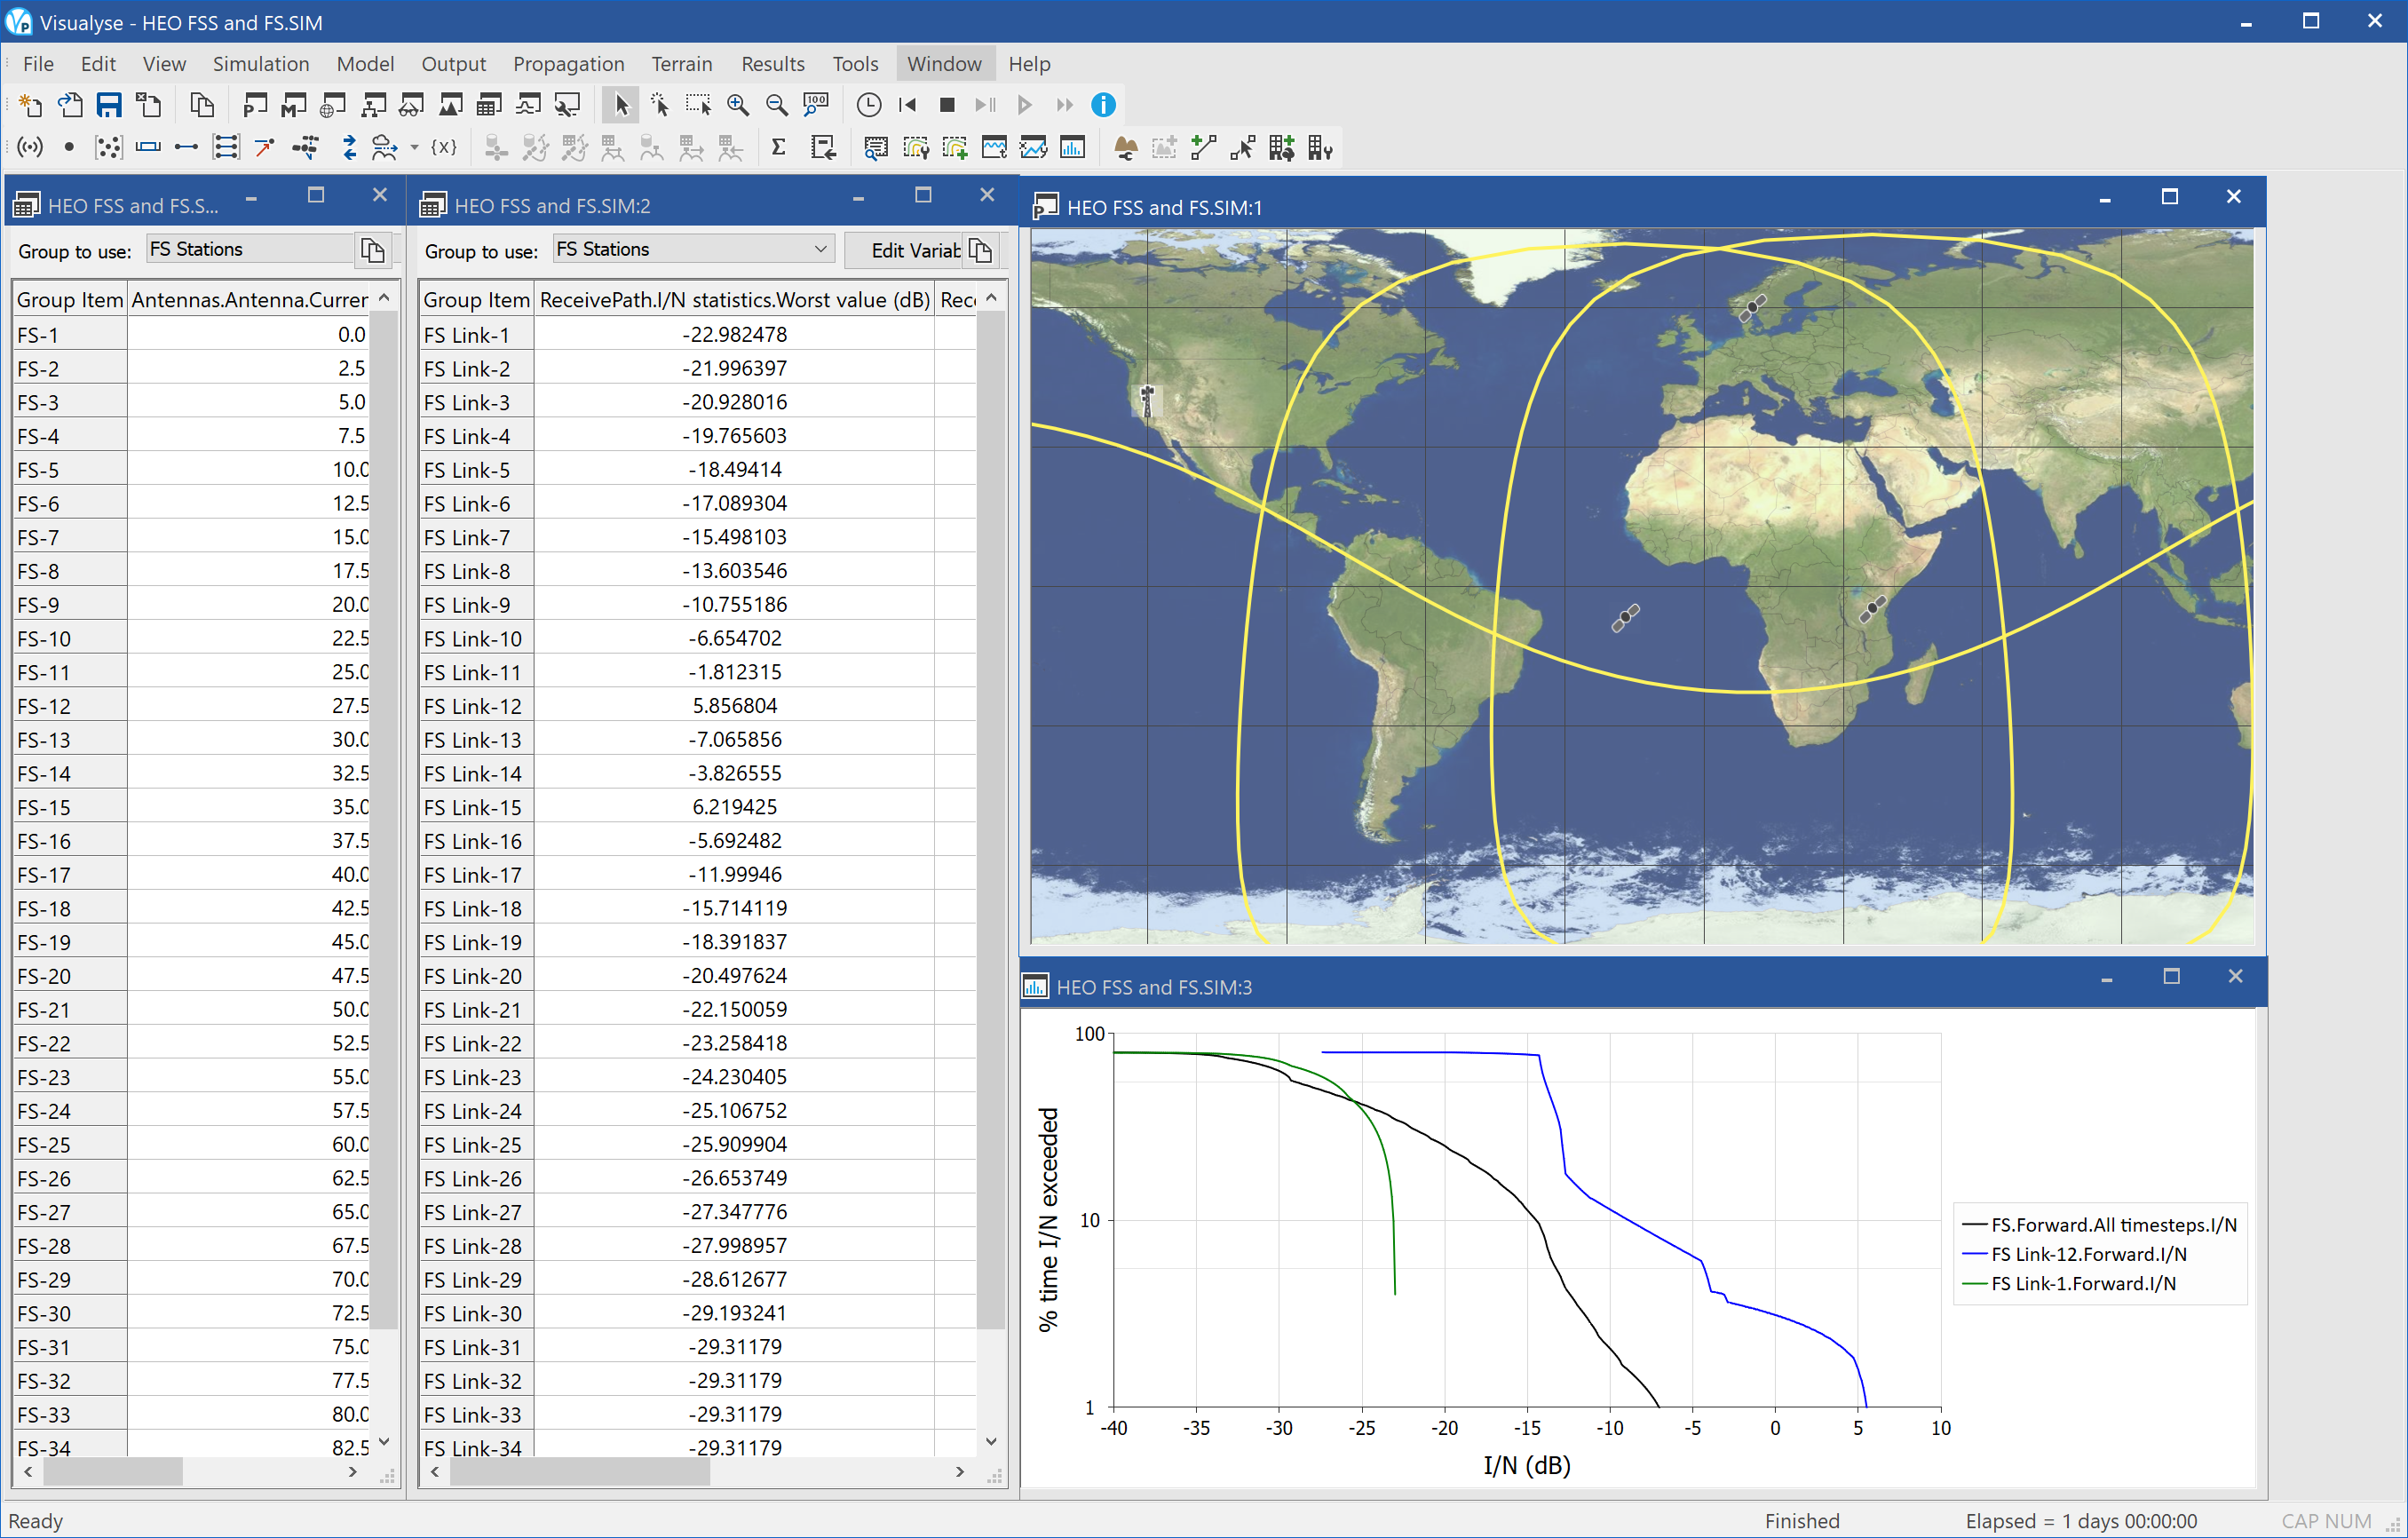
This example shows an example of analysis of the power flux density (PFD) mask that can protect terrestrial point to point fixed link from interference from constellations of satellites in highly eccentric orbits (HEO).
It is proposed that a PFD limits be -105 dBW / m^2 / MHz for elevation angles of arrival less 5°, -115 dBW / m^2 / MHz for elevation angles above 25°, and linear interpolation between 5° and 25°.
The interference that this PFD mask will generate will depend upon the characteristics of the satellite constellation. Therefore to check whether the mask is suitable not it is necessary to run a simulation assuming it applies and checking the predicted levels of interference.
The interference will also depend upon the characteristics of the FS receiver: in particular its:
- Latitude
- Longitude
- Antenna azimuth
- Antenna gain pattern
- Antenna height
In this example, we consider a single location, height and gain pattern and vary the azimuth, but other runs could analyse the impact of vary other parameters.
Interference is measured in terms of the I/N at the FS receiver and compared against a threshold I/N = -10 dB. Statistics are captured on what percentage of time this threshold is exceeded, and in addition what the worst I/N would be. Other statistics could be generated, such as the Fractional Degradation in Performance (FDP).
A 3-satellite HEO constellation is modelled with repeat period and hence simulation duration of 1 day, using a 10 second time step.
The screen shot above shows the following windows:
- Table view (far left) showing the azimuth angles of the test FS receivers, varying from 0° to 90° in 2.5° steps
- Table view (left) showing the worst I/N and percentage of time the I/N > -10 dB for each of these azimuths
- Plate Carrée view (top right) showing the location of the FS receivers, the satellites, and their foot prints
- Statistics view (bottom right) showing the cumulative distribution function of the I/N for all links and two in particular.
Note how the azimuth of the worst I/N is not the same as the azimuth of the receiver with the highest probability of interference!
Satellite ATC Example
| Action: | Run simulation |
| Modules used: | Define Variable |
| Terrain regions: | None |
| Frequency band: | L |
| Station types: | Non-GSO Satellite, Earth Station, Mobile |
| Propagation models: | Free space, ITU-R Rec.P.676, Hata, ITU-R Rec.P.452 |
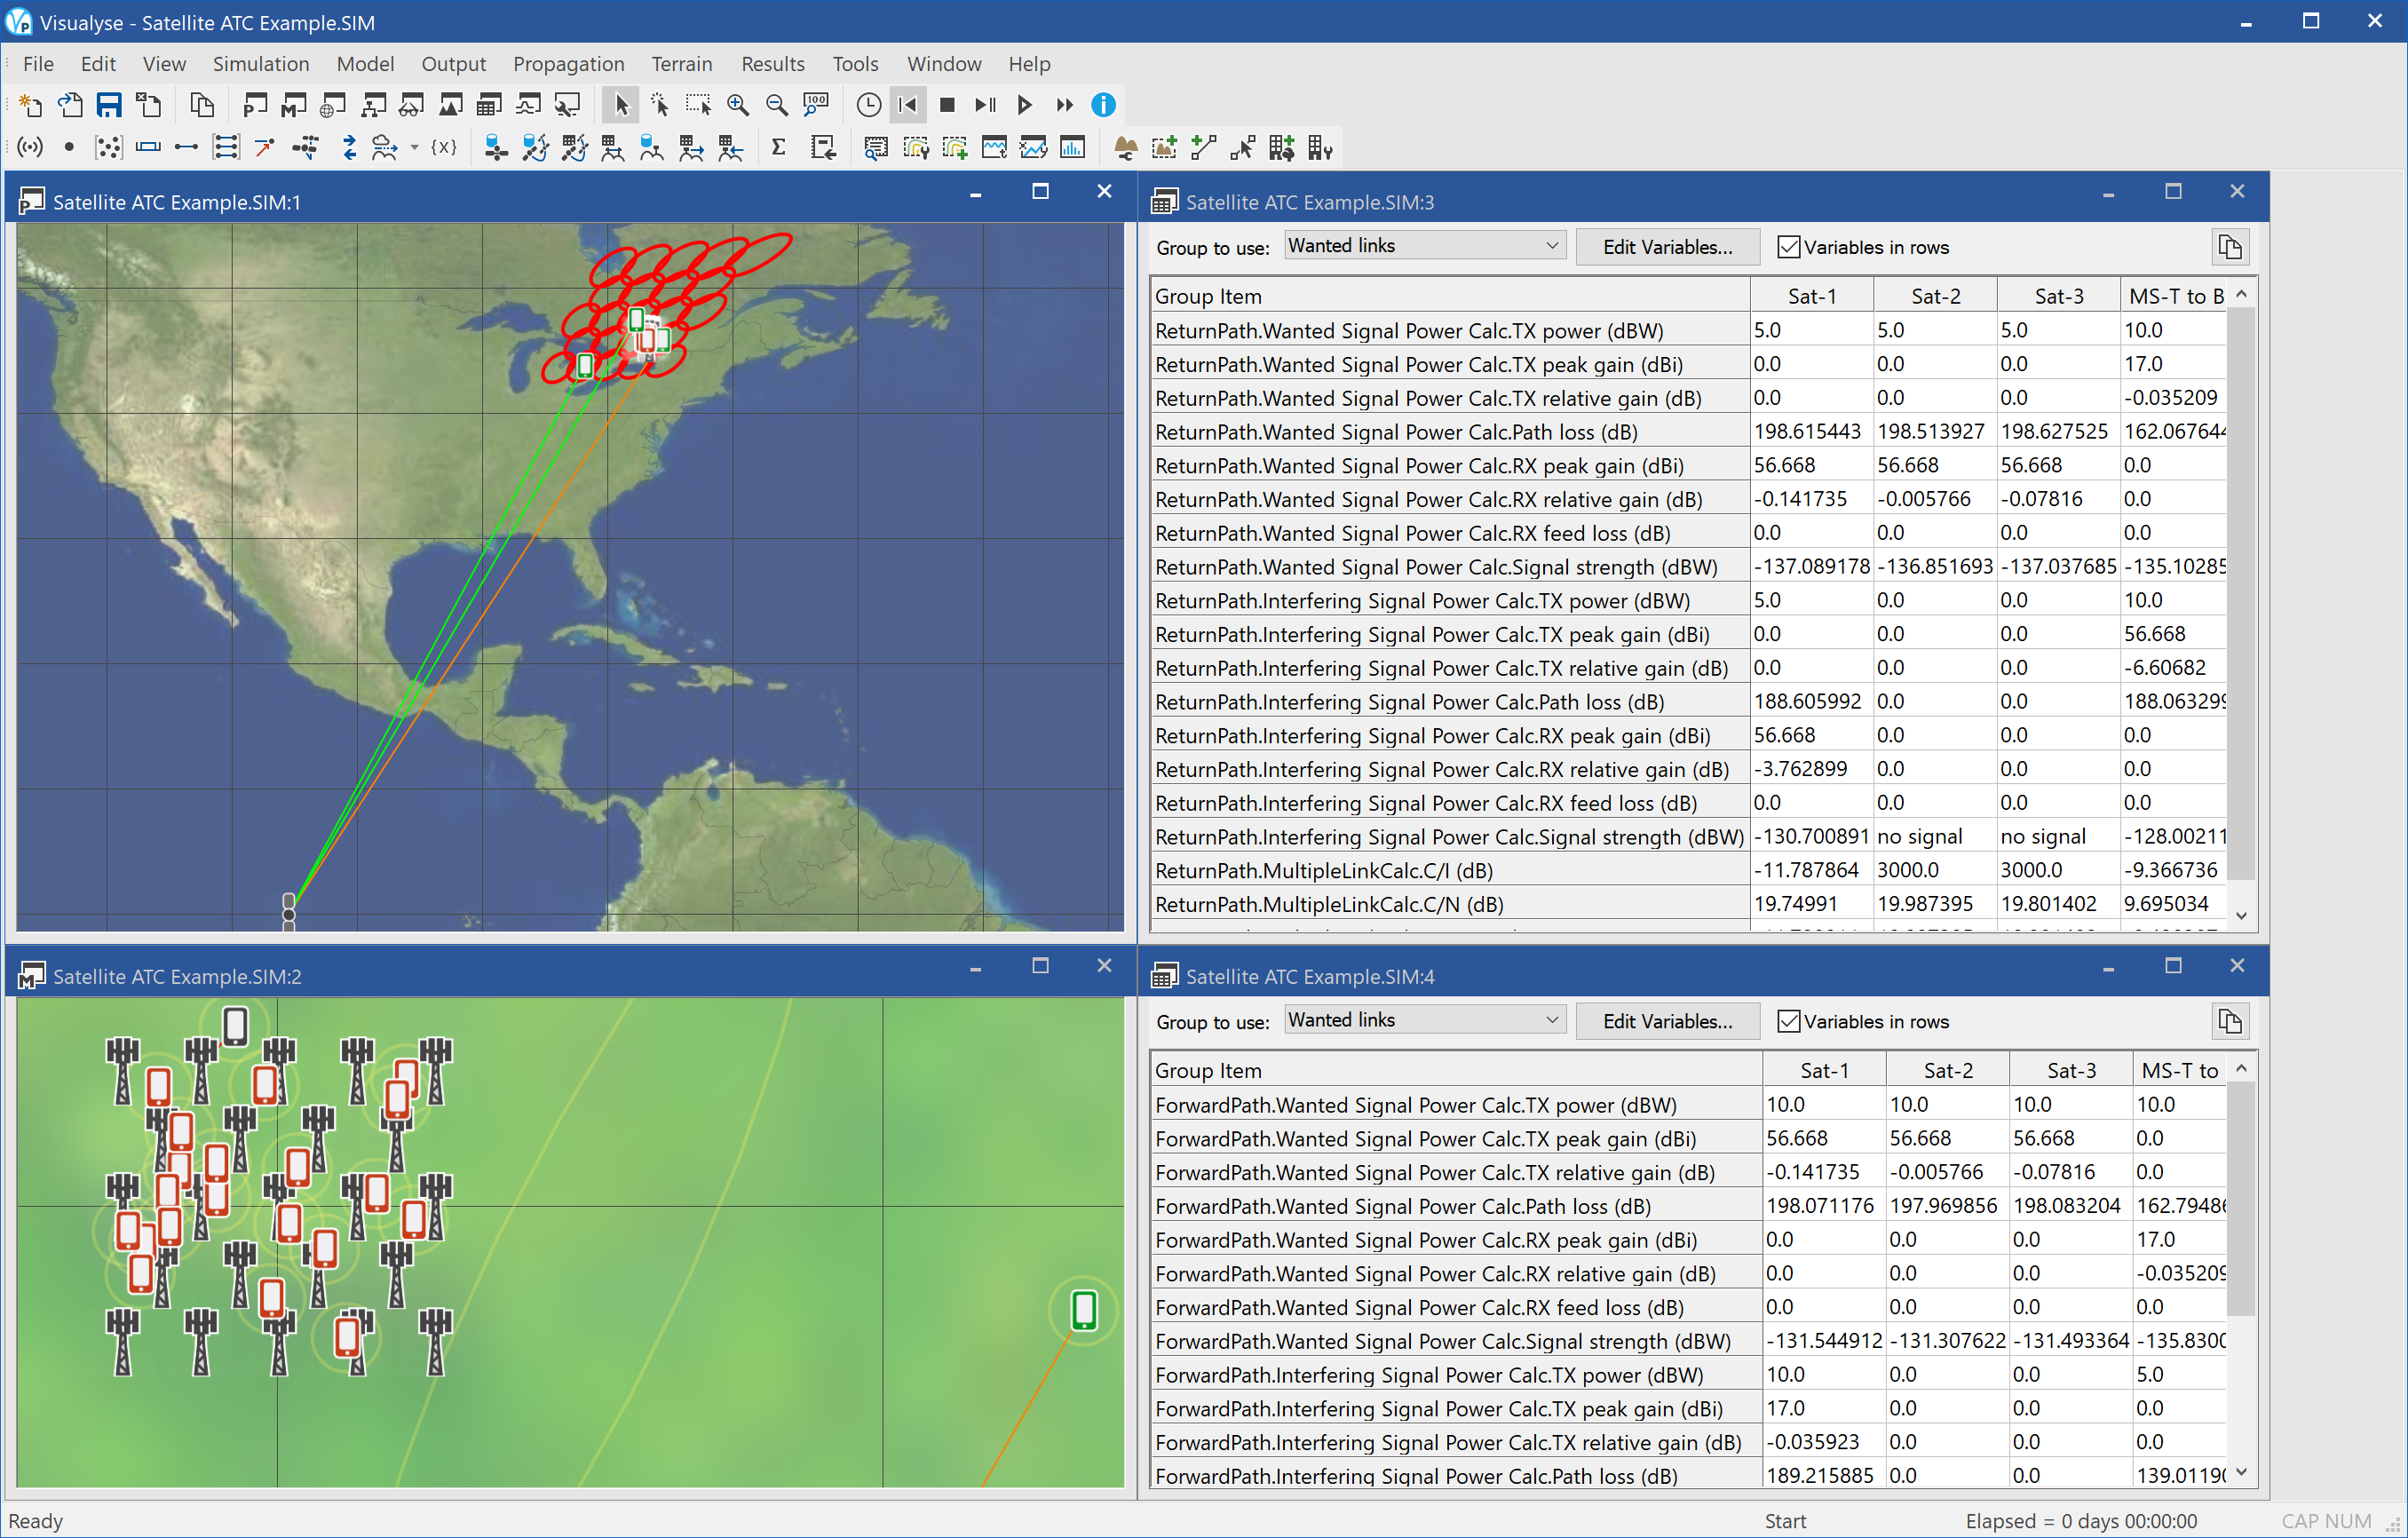
This example analyses interference with a satellite network employing Auxiliary Terrestrial Component (ATC). This is used to extend and improve the coverage and capacity of the satellite network, particularly in urban areas where there can be significant reduction in coverage due to clutter (see next example file for details).
To improve performance in urban areas, terrestrial repeaters or base stations are deployed, typically operating within the spectrum allocated to the satellite system. However this can result in interference if not managed correctly – either within the satellite / ATC network or into other networks either co-frequency or in adjacent bands.
One of the key strengths of Visualyse Professional is how it can analyse the various combinations of satellite and terrestrial systems. In this example file it is analysing both Uplink (UL) and Downlink (DL) and both satellite and terrestrial services in the same simulation file!
The various elements are shown in the following two figures. There are two sets of wanted paths:
- Space to Earth path between the satellite and the handsets operating in satellite mode, modelling used free space path loss and gaseous attenuation using Rec.P.676 plus 10 dB of clutter loss
- Terrestrial path between the ATC base stations and the handsets operating in GSM mode, modelling the short range urban path using the Hata / COST 231 propagation model
The first figure considers the downlink interference paths including:
- Space to Earth path: interference from the satellite DL into the ATC terrestrial component DL, modelling used free space path loss and gaseous attenuation using Rec.P.676
- Terrestrial path: interference from the ATC terrestrial component DL into the satellite DL, modelled using terrestrial propagation model ITU-R Rec.P.452
The second figure considers the uplink interference paths including:
- Terrestrial path: interference from the satellite UL into the ATC terrestrial component UL, modelled using terrestrial propagation model ITU-R Rec.P.452
- Space to Earth path: interference from the ATC terrestrial component DL into the satellite DL, modelling used free space path loss and gaseous attenuation using Rec.P.676
The simulation has been configured so that all links would work with adequate C/N in the absence of interference. However it can be seen that for three of the four interference paths the C/I is significantly negative.
The screen shot above shows four windows open:
- Plate Carrée view (top left), showing the locations of the satellite, handsets and base stations, and beam foot print of the satellite network (note only a sub-set of the spot beams have been included to simplify the simulation)
- Mercator view (bottom left), showing the grid of base stations, randomised deployment of mobiles, interference paths, and beam coverage
- Table view (top right) showing the wanted and interfering link budgets for the return paths (satellite downlinks and terrestrial uplinks)
- Table view (bottom right) showing the wanted and interfering link budgets for the forward paths (satellite uplinks and terrestrial downlinks)
This simulation could be developed further in many ways – contact us for more details.
Urban GSO S-DARS Coverage
| Action: | None |
| Modules used: | Terrain |
| Terrain regions: | S-DARS Lidar |
| Frequency band: | S |
| Station types: | GSO Satellite, Earth Station, Mobile |
| Propagation models: | Free space, ITU-R Rec.P.676, ITU-R Rec.P.452 |
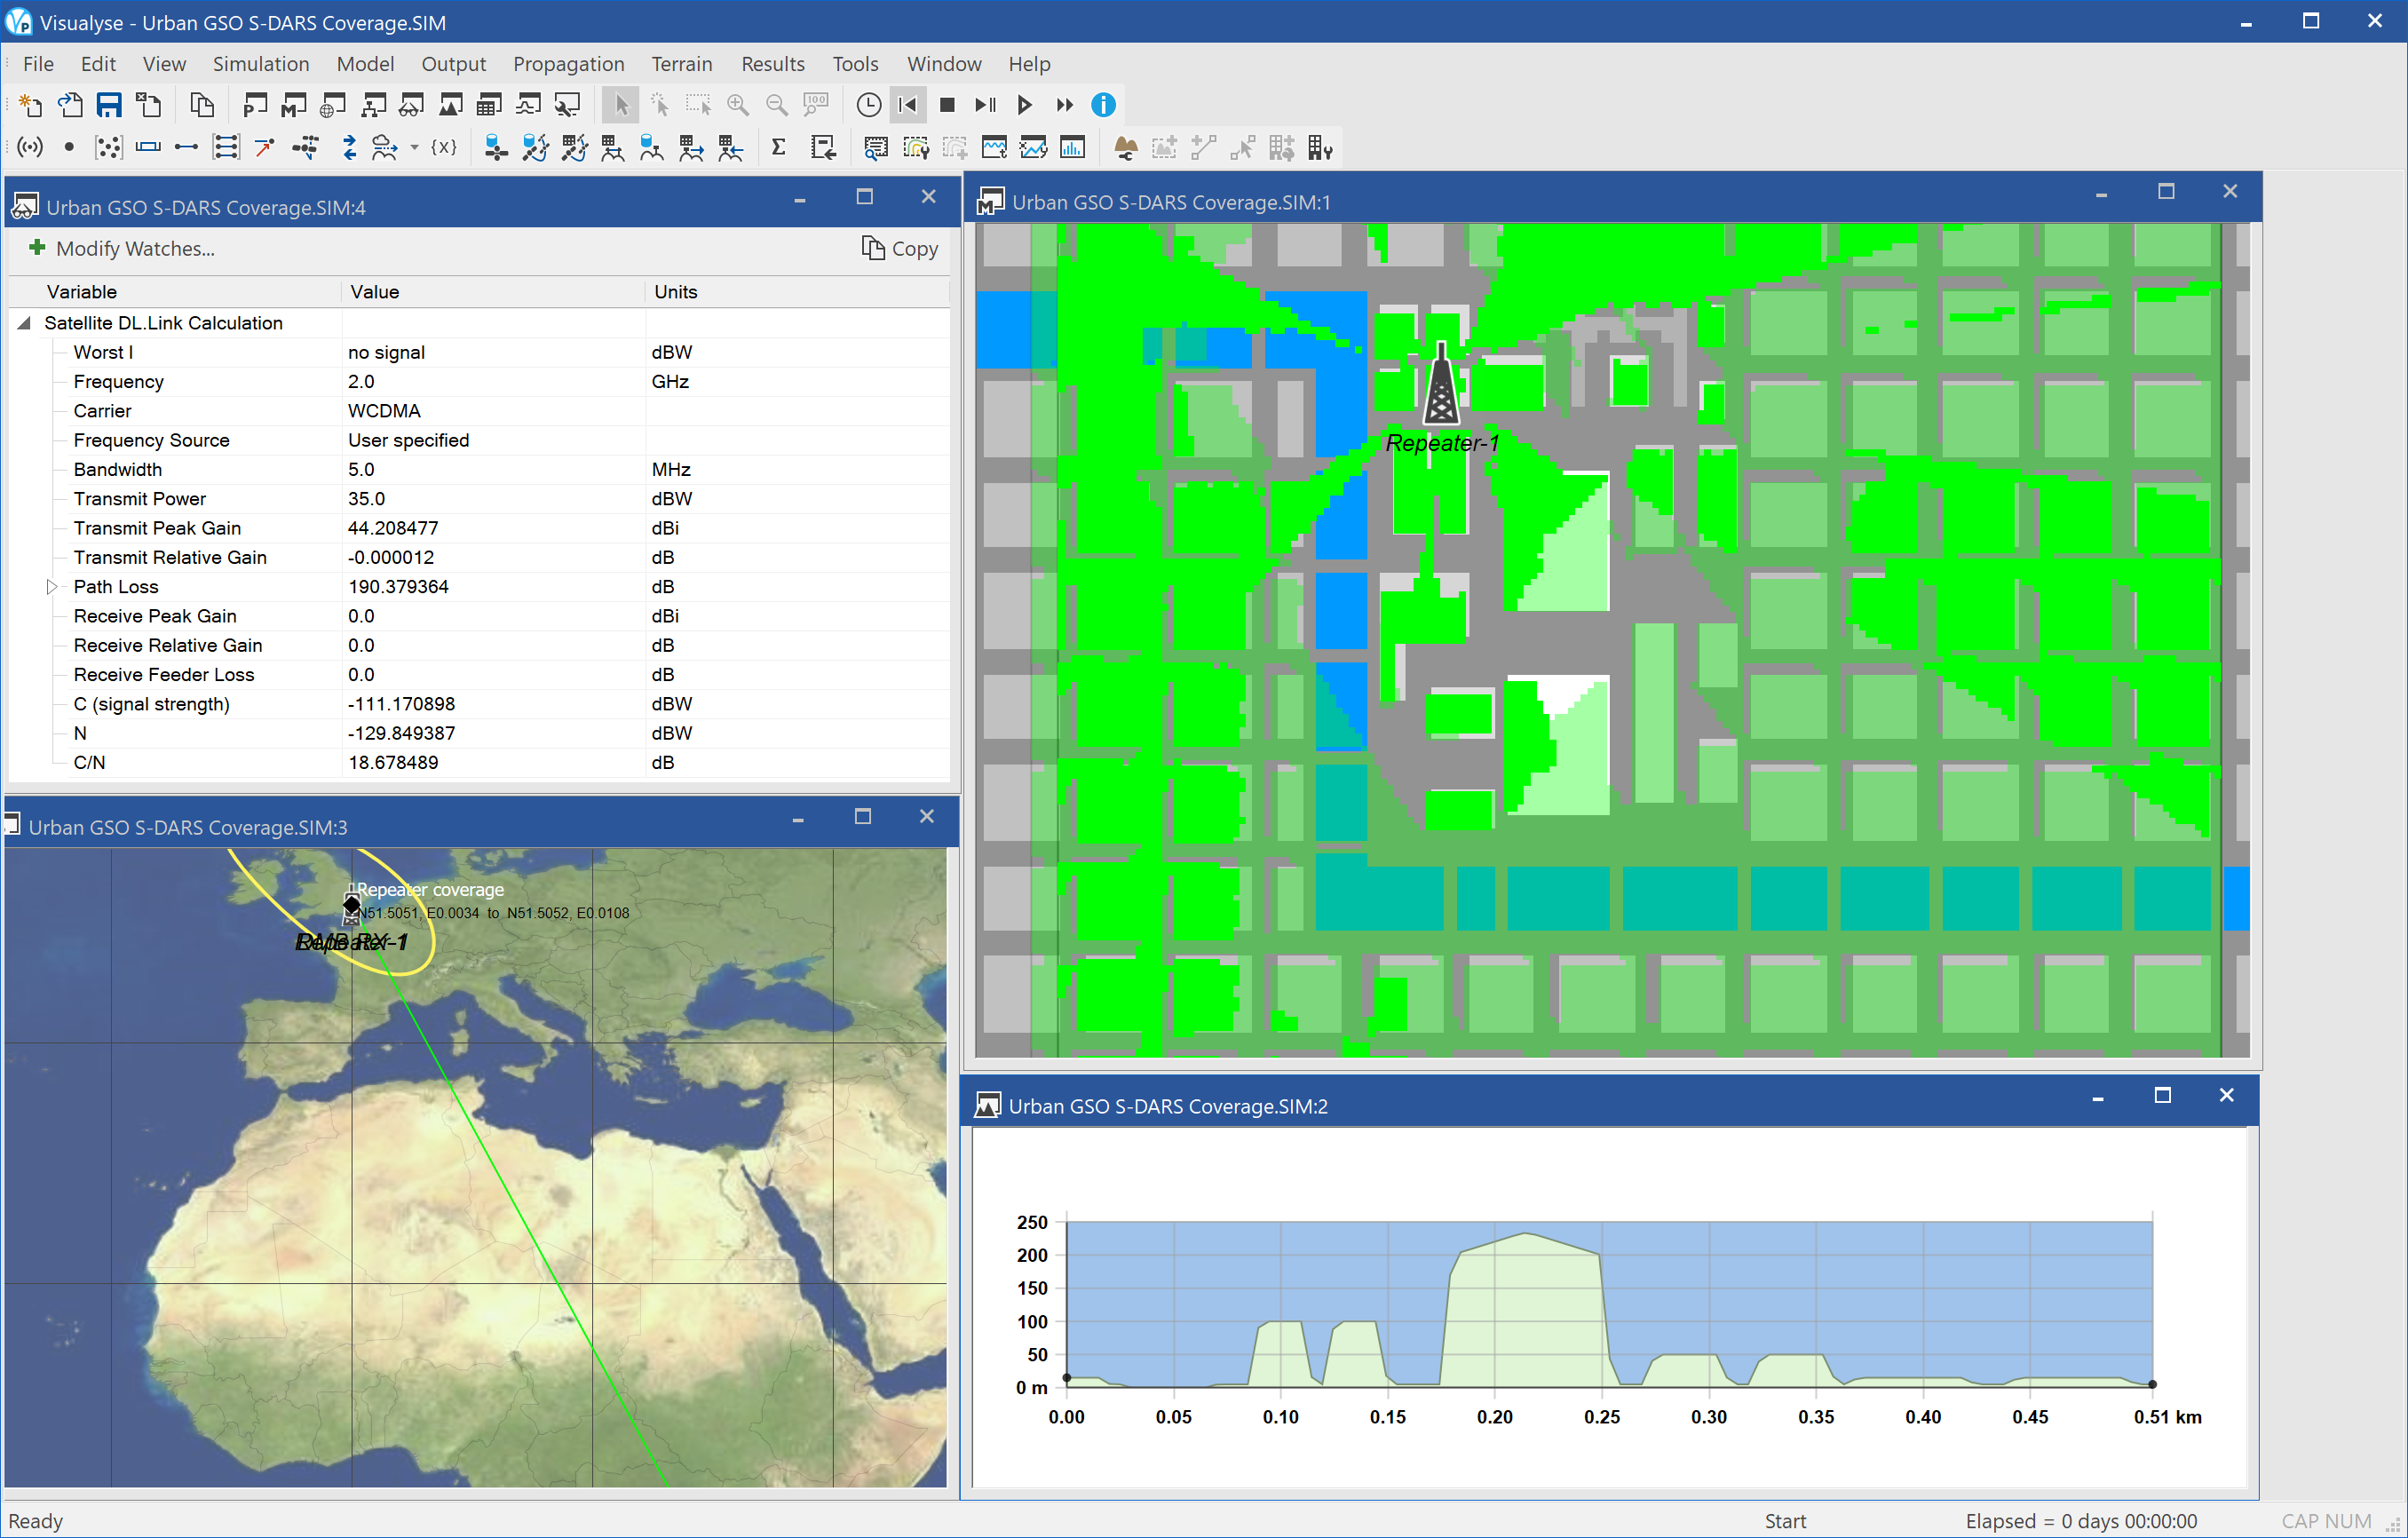
This example show Visualyse Professional being used to predict the coverage of a GSO satellite providing communication services and broadcasting multi-media to mobiles in urban areas. This can be problematic for areas of Europe, as the GSO arc is low on the horizon for the higher latitudes involved. This means that the direct path to the satellite is more likely to be obscured by a building, and in these cases with the minimal margin available the link will fail.
In this case an urban area has been created using the generic terrain file format containing streets between blocks, towers, plazas, and a river with bridges. Using only the GSO satellite the coverage is limited, particularly behind the towers, where there is considerable shadowing. To provide fill-in of these locations a terrestrial repeater has been included: the propagation has been modelled using the “over the top” path included in ITU-R Rec.P.452.
Two area analysis have been created:
- Dark green: showing where the C/N from the satellite exceeds 12 dB
- Light green: showing where the C/N from either the satellite or the terrestrial repeater exceeds 12 dB
The locations that are uncoloured show where there is coverage from neither the repeater nor the satellite.
In the screen shot above there are four windows open:
- Mercator view (top right), showing the terrain area, river in blue, and the two area analysis, colour coded in green
- Path profile view (bottom right), showing a path across the area, with the towers, streets, and rivers visible
- Plate Carrée map view (bottom left), showing the location of the test area, the handset, and the GSO satellite.
- Watch window (top left), showing the link budget from the satellite to the handset
This analysis could be extended to show the effect of using other architectures – such as Highly Eccentric Orbits (HEO).
Short range devices
This section contains the following examples:
SRR into FS
| Action: | Run simulation |
| Modules used: | Define Variable |
| Terrain regions: | None |
| Frequency band: | Ka |
| Station types: | Fixed, Mobile |
| Propagation models: | ITU-R Rec. P.1791 |
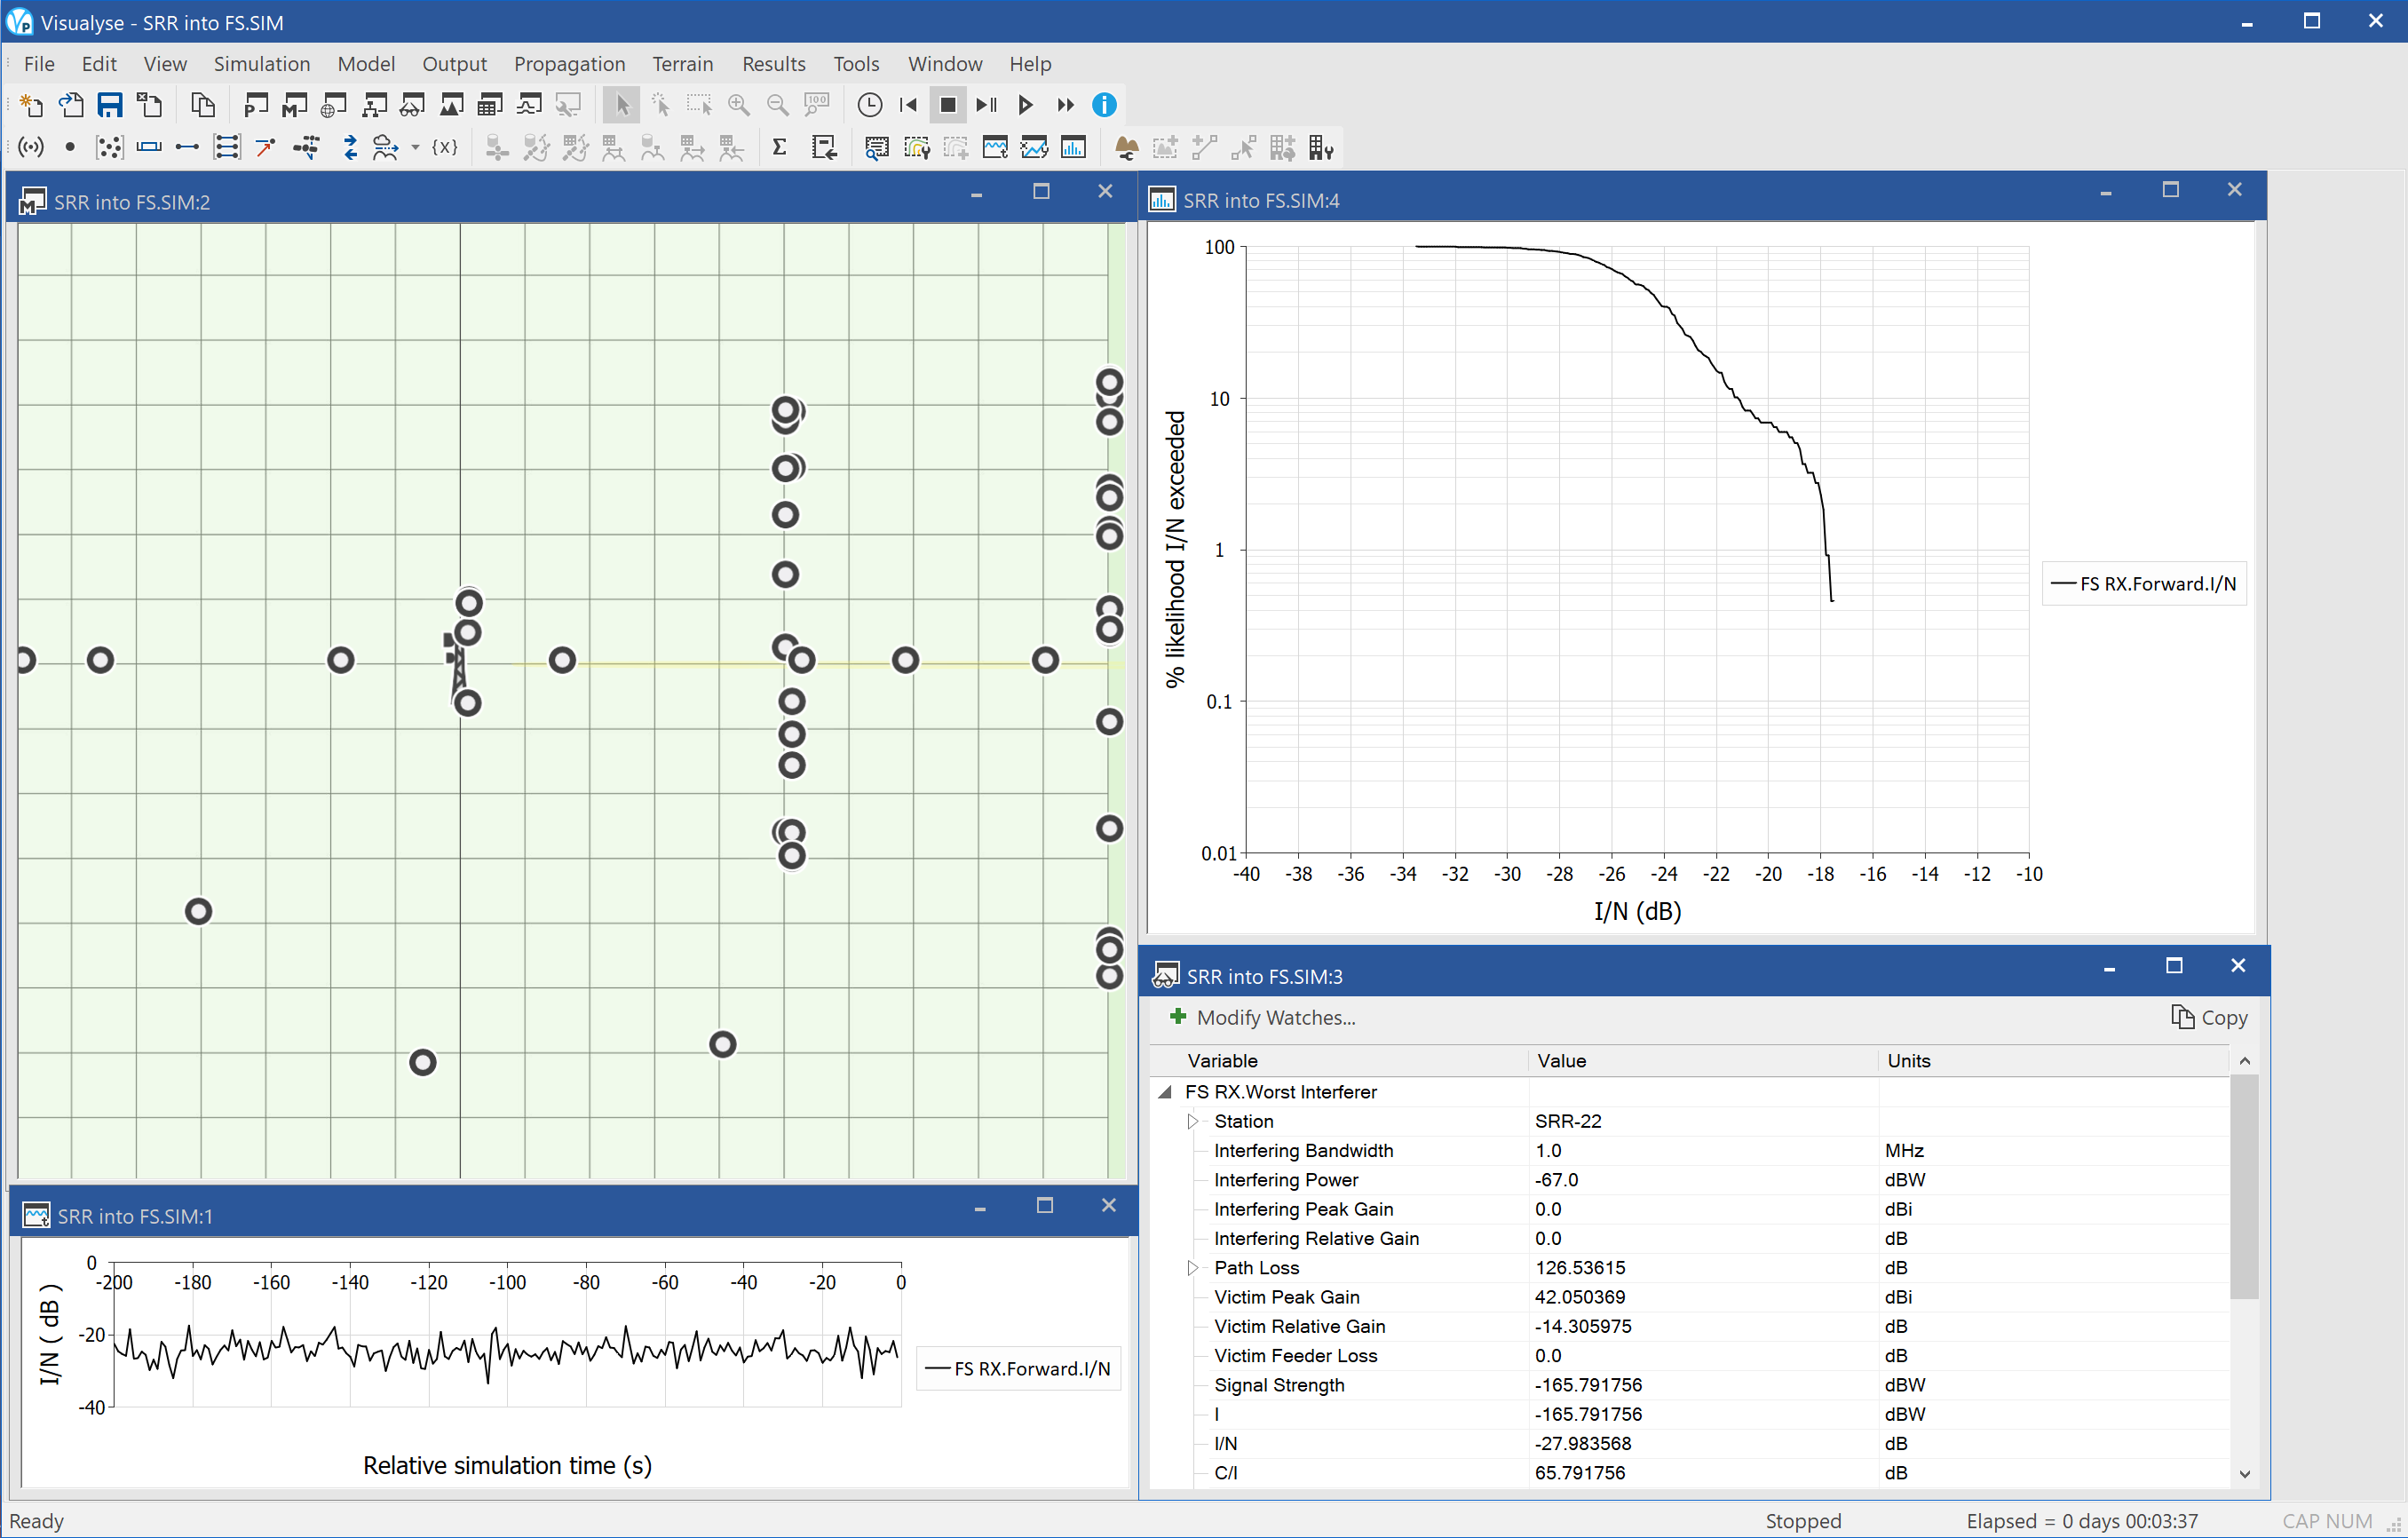
This example shows study of the impact of short range radars (SRRs) on point to point fixed links around 26 GHz.
A fixed service receiver station is modelled at the centre of the test area. Its antenna is modelled using the Rec.P.699 gain pattern with azimuth = 90° (due East) and elevation just below horizontal (-0.75°).
In the vicinity of this FS receiver are assumed to be a number of roads on which are vehicles. These have been modelled by randomising the position (lat, long) using the Define Variable module.
It is assumed there are two roads running North-South, one East-West and several other small roads modelled as vehicles at random locations across the area of interest.
Note that the task of defining these roads with all these vehicles is simplified by the use of the duplicate feature! This sort of randomisation makes this a Monte Carlo style simulation.
The SRRs are assumed to be transmitting at -73 dBW: this is -43 dBm / MHz as per FCC requirements plus two factors:
- 3 dB increase due to the gain at the transmit antenna
- 3 dB increase due to multiple transmitters on the vehicle
The net result is an equivalent EIRP per vehicle of -37 dBm or -67 dBW.
The propagation model is assumed to be dual slope with decay factor 2 until 1 km and then 3.
The figure above shows four windows:
- Mercator view (top left) showing the location of stations on a grid every 1 km for scale
- Quick graph view (bottom left) showing the variation in I/N at the FS receiver against Monte Carlo sample.
- Watch window (bottom right) single entry worst case interfering link budget and the aggregate interference from all 50 vehicles.
- Statistics graph (top right) I/N cumulative distribution functions for the FS receiver
Wi-Fi and BT
| Action: | Run simulation |
| Modules used: | Define Variable, Traffic |
| Terrain regions: | None |
| Frequency band: | S |
| Station types: | Mobile |
| Propagation models: | ITU-R Rec. P.1791 |
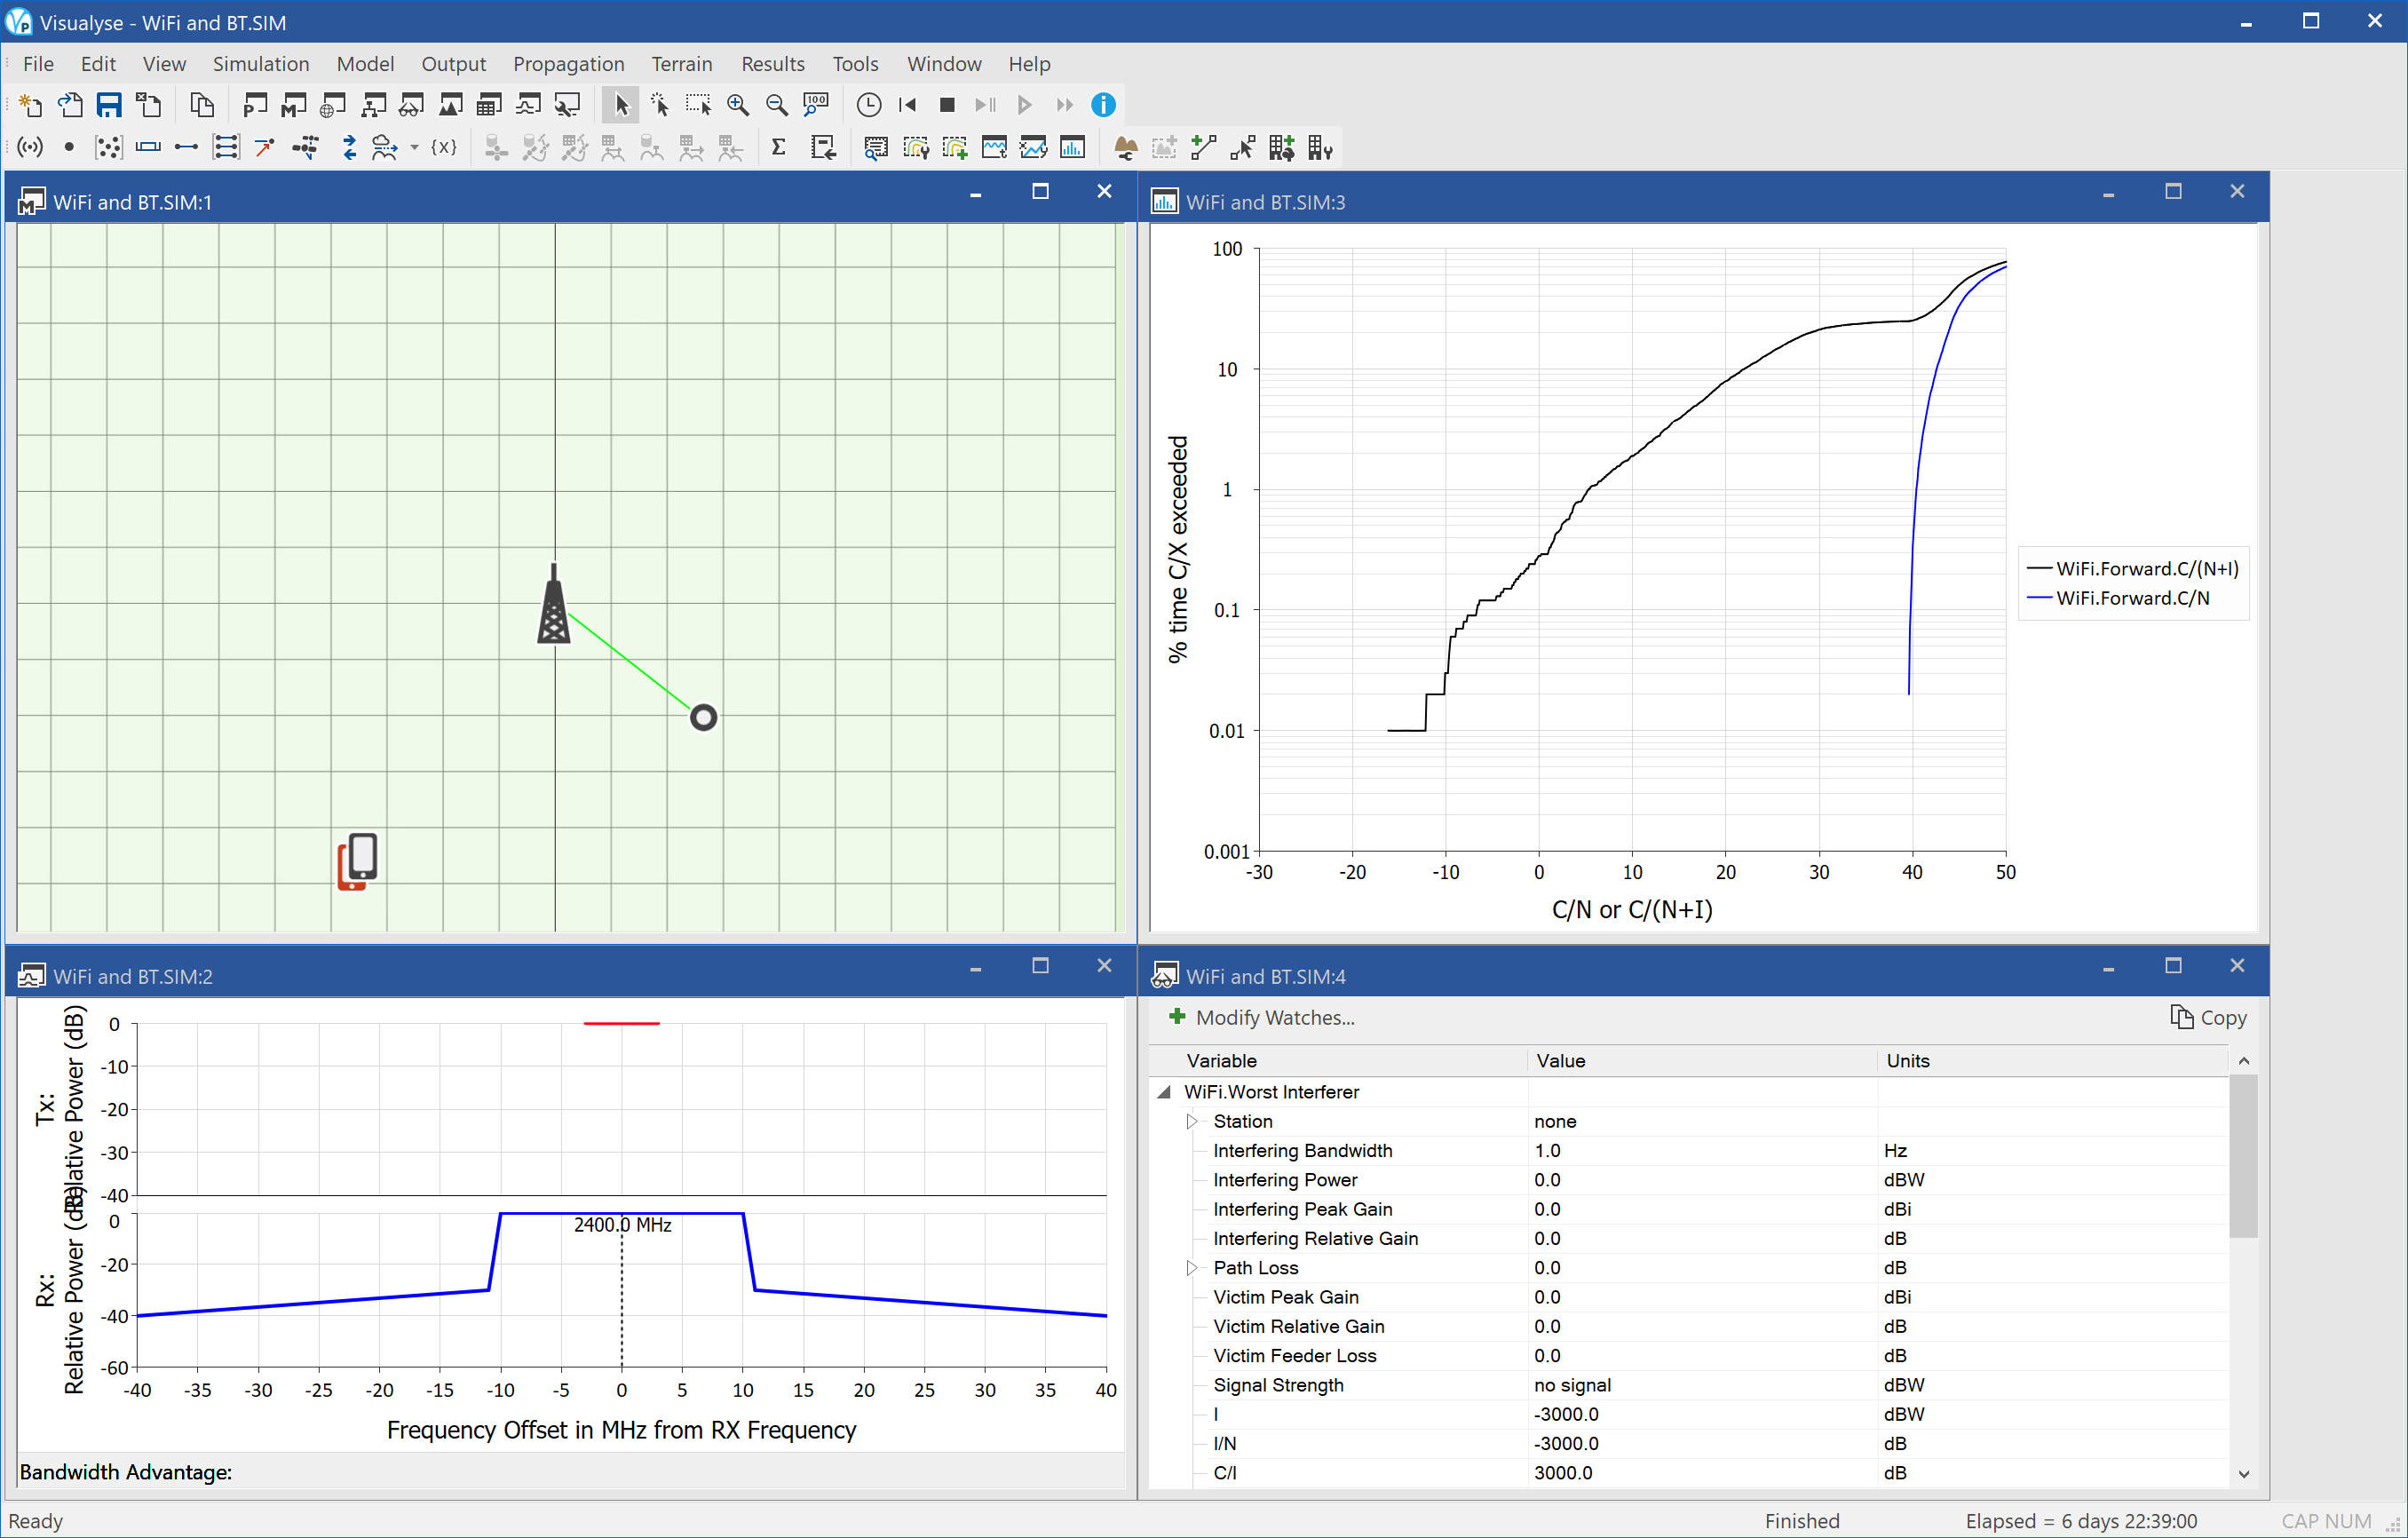
This example shows sharing between a Wi-Fi network and Bluetooth (BT) at around 2.4 GHz.
The simulation operates at short ranges with maximum radius of Wi-Fi network of 50m and paired BT devices 1 metre apart. The location of the user terminal is randomised within the Wi-Fi service area as is the paired BT device.
The wanted and interfering paths are assumed to use the propagation model in ITU-R Rec.P.1791, which is a dual slope model plus log-normal fading.
The Wi-Fi network is operating on one of the three non-overlapping 22 MHz channels while the BT device bandwidth is 1 MHz and is frequency hopping. BT devices can hop over all three channels but tend to avoid those where they suffer interference – such as when co-frequency with Wi-Fi networks. Hence in this example it is assume to hop at random outside the Wi-Fi’s channel.
Representative spectrum masks of both the Wi-Fi and BT have been used and for a given frequency offset Visualyse Professional 7 calculates the net filter discrimination (NFD).
An additional factor modelled is the activity ratio of the BT device which is assumed to be active for 25% of the time. Hence the simulation calculates the performance using Monte Carlo methods to convolve:
- Randomisation of location
- Randomisation of fading on wanted paths
- Randomisation of fading on interfering paths
- Random selection of frequency of BT operation, and hence relative frequency offset, and hence variation in NFD
- Random activation of BT link
The result is degradation in performance of each link due to the other. The figure above shows four windows:
- Mercator view (top left) showing the location of stations on a grid every 10m for scale
- Frequency view (bottom left) showing the spectrum mask of the BT (as interferer) and receive filter mask of the Wi-Fi (as victim)
- Watch window (top right) showing the wanted and interfering link budgets
- Statistics graph (bottom right) showing the C/(N+I) and C/N cumulative distribution functions, showing how performance of the Wi-Fi network is degraded due to the proximity of the BT network.
Space Science Service
This section contains the following examples:
- PFD from non-GSO satellite DL
- P-MP FS into EESS (passive)
- Sensor pointing at defined (az, el) angles
PFD from non-GSO satellite DL
| Action: | Run simulation |
| Modules used: | None |
| Terrain regions: | None |
| Frequency band: | X |
| Station types: | Non-GSO Satellite, Earth Station |
| Propagation models: | Free Space |
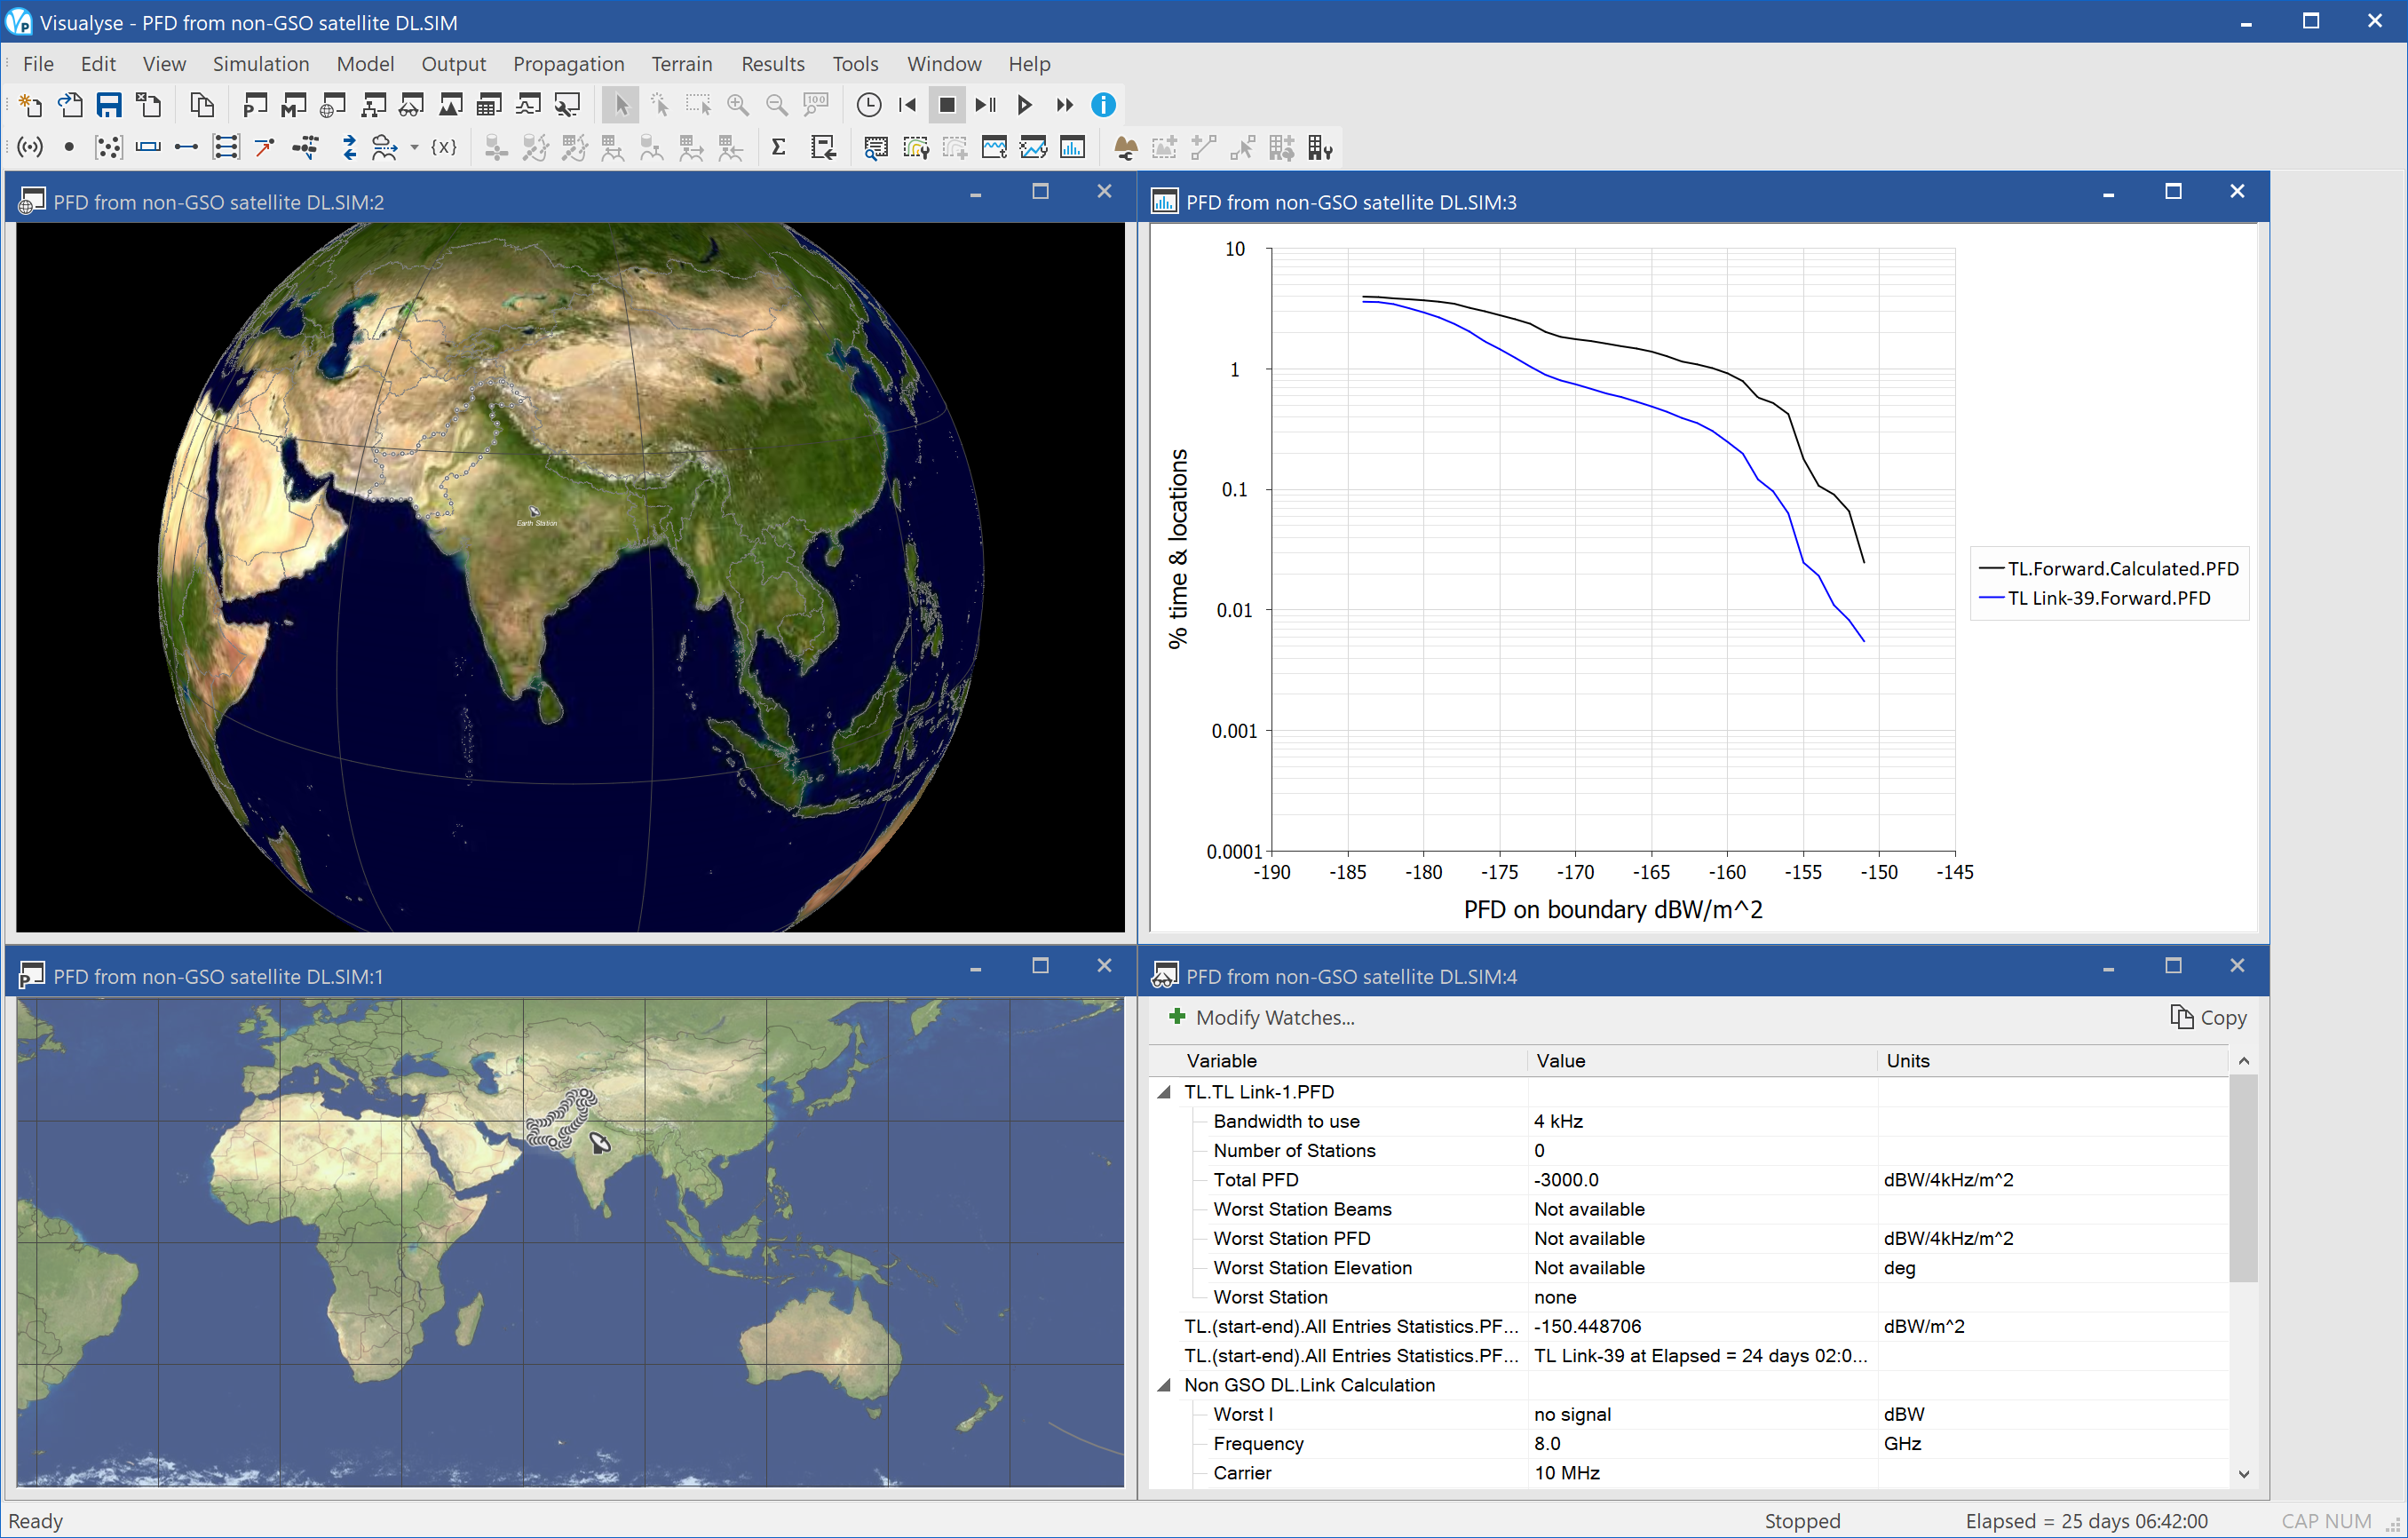
This example considers the case of a non-GSO satellite being used for remote sensing applications. It is downloading using a directional antenna to an Earth Station in the centre of a large country (India) but there is still the potential to exceed the relevant PFD limits.
These are defined in Article 21 of the Radio Regulations and for the part of X band under consideration, namely around 8 GHz, the limits are:
- -140 dBW/m^2/4 kHz for elevation angles greater than 25°
- Linear interpolation between -140 and -150 dBW/m^2/4 kHz for elevation angles between 5° and 25°
- -150 dBW/m^2/4 kHz for elevation angles less than 5°
The Radio Regulations give each Administration the right to exceed these levels within their own territory. The question is then would these PFD limits be exceeded in adjacent countries?
This simulation shows how Visualyse Professional can help analyse these problems. A set of test points have been defined around the border of a neighbouring country, Pakistan, and the PFD at each test point calculated as the satellite moves along its orbit.
The figure above shows four windows:
- 3D view (top left) showing the non-GSO satellite, its orbit track, the Earth Station, the beam from the non-GSO satellite to Earth Station, and the test points around the adjacent country
- Plate Carrée map view (bottom left), also showing the non-GSO satellite, its orbit track, the Earth Station, the beam from the non-GSO satellite to Earth Station, and the test points around the adjacent country
- Watch window (bottom right) showing the PFD calculation for one of the test points, the worst PFD over all the test points, and the link budget for the X-band downlink
- Statistics graph (top right) showing the cumulative distribution function of the worst PFD at each time step and the CDF of the PFD for one test point (number 39)
Note that the non-GSO satellite only transmits when it can see the Earth Station and the PFD statistics are only updated when the non-GSO satellite is transmitting and can see the test points: hence the statistics are unlikely to be valid for more than 10% of the time. However in this case it can be seen that the PFD limits are met as the PFD never exceeds -150 dBW/m^2/4 kHz.
This simulation can be extended to undertake more advanced analysis which takes account of how the PFD varies with elevation angle.
P-MP FS into EESS (passive)
| Action: | Run simulation |
| Modules used: | Define Variable |
| Terrain regions: | None |
| Frequency band: | Ku |
| Station types: | Non-GSO Satellite, Fixed |
| Propagation models: | Free space path loss, ITU-R Rec.P.676 |
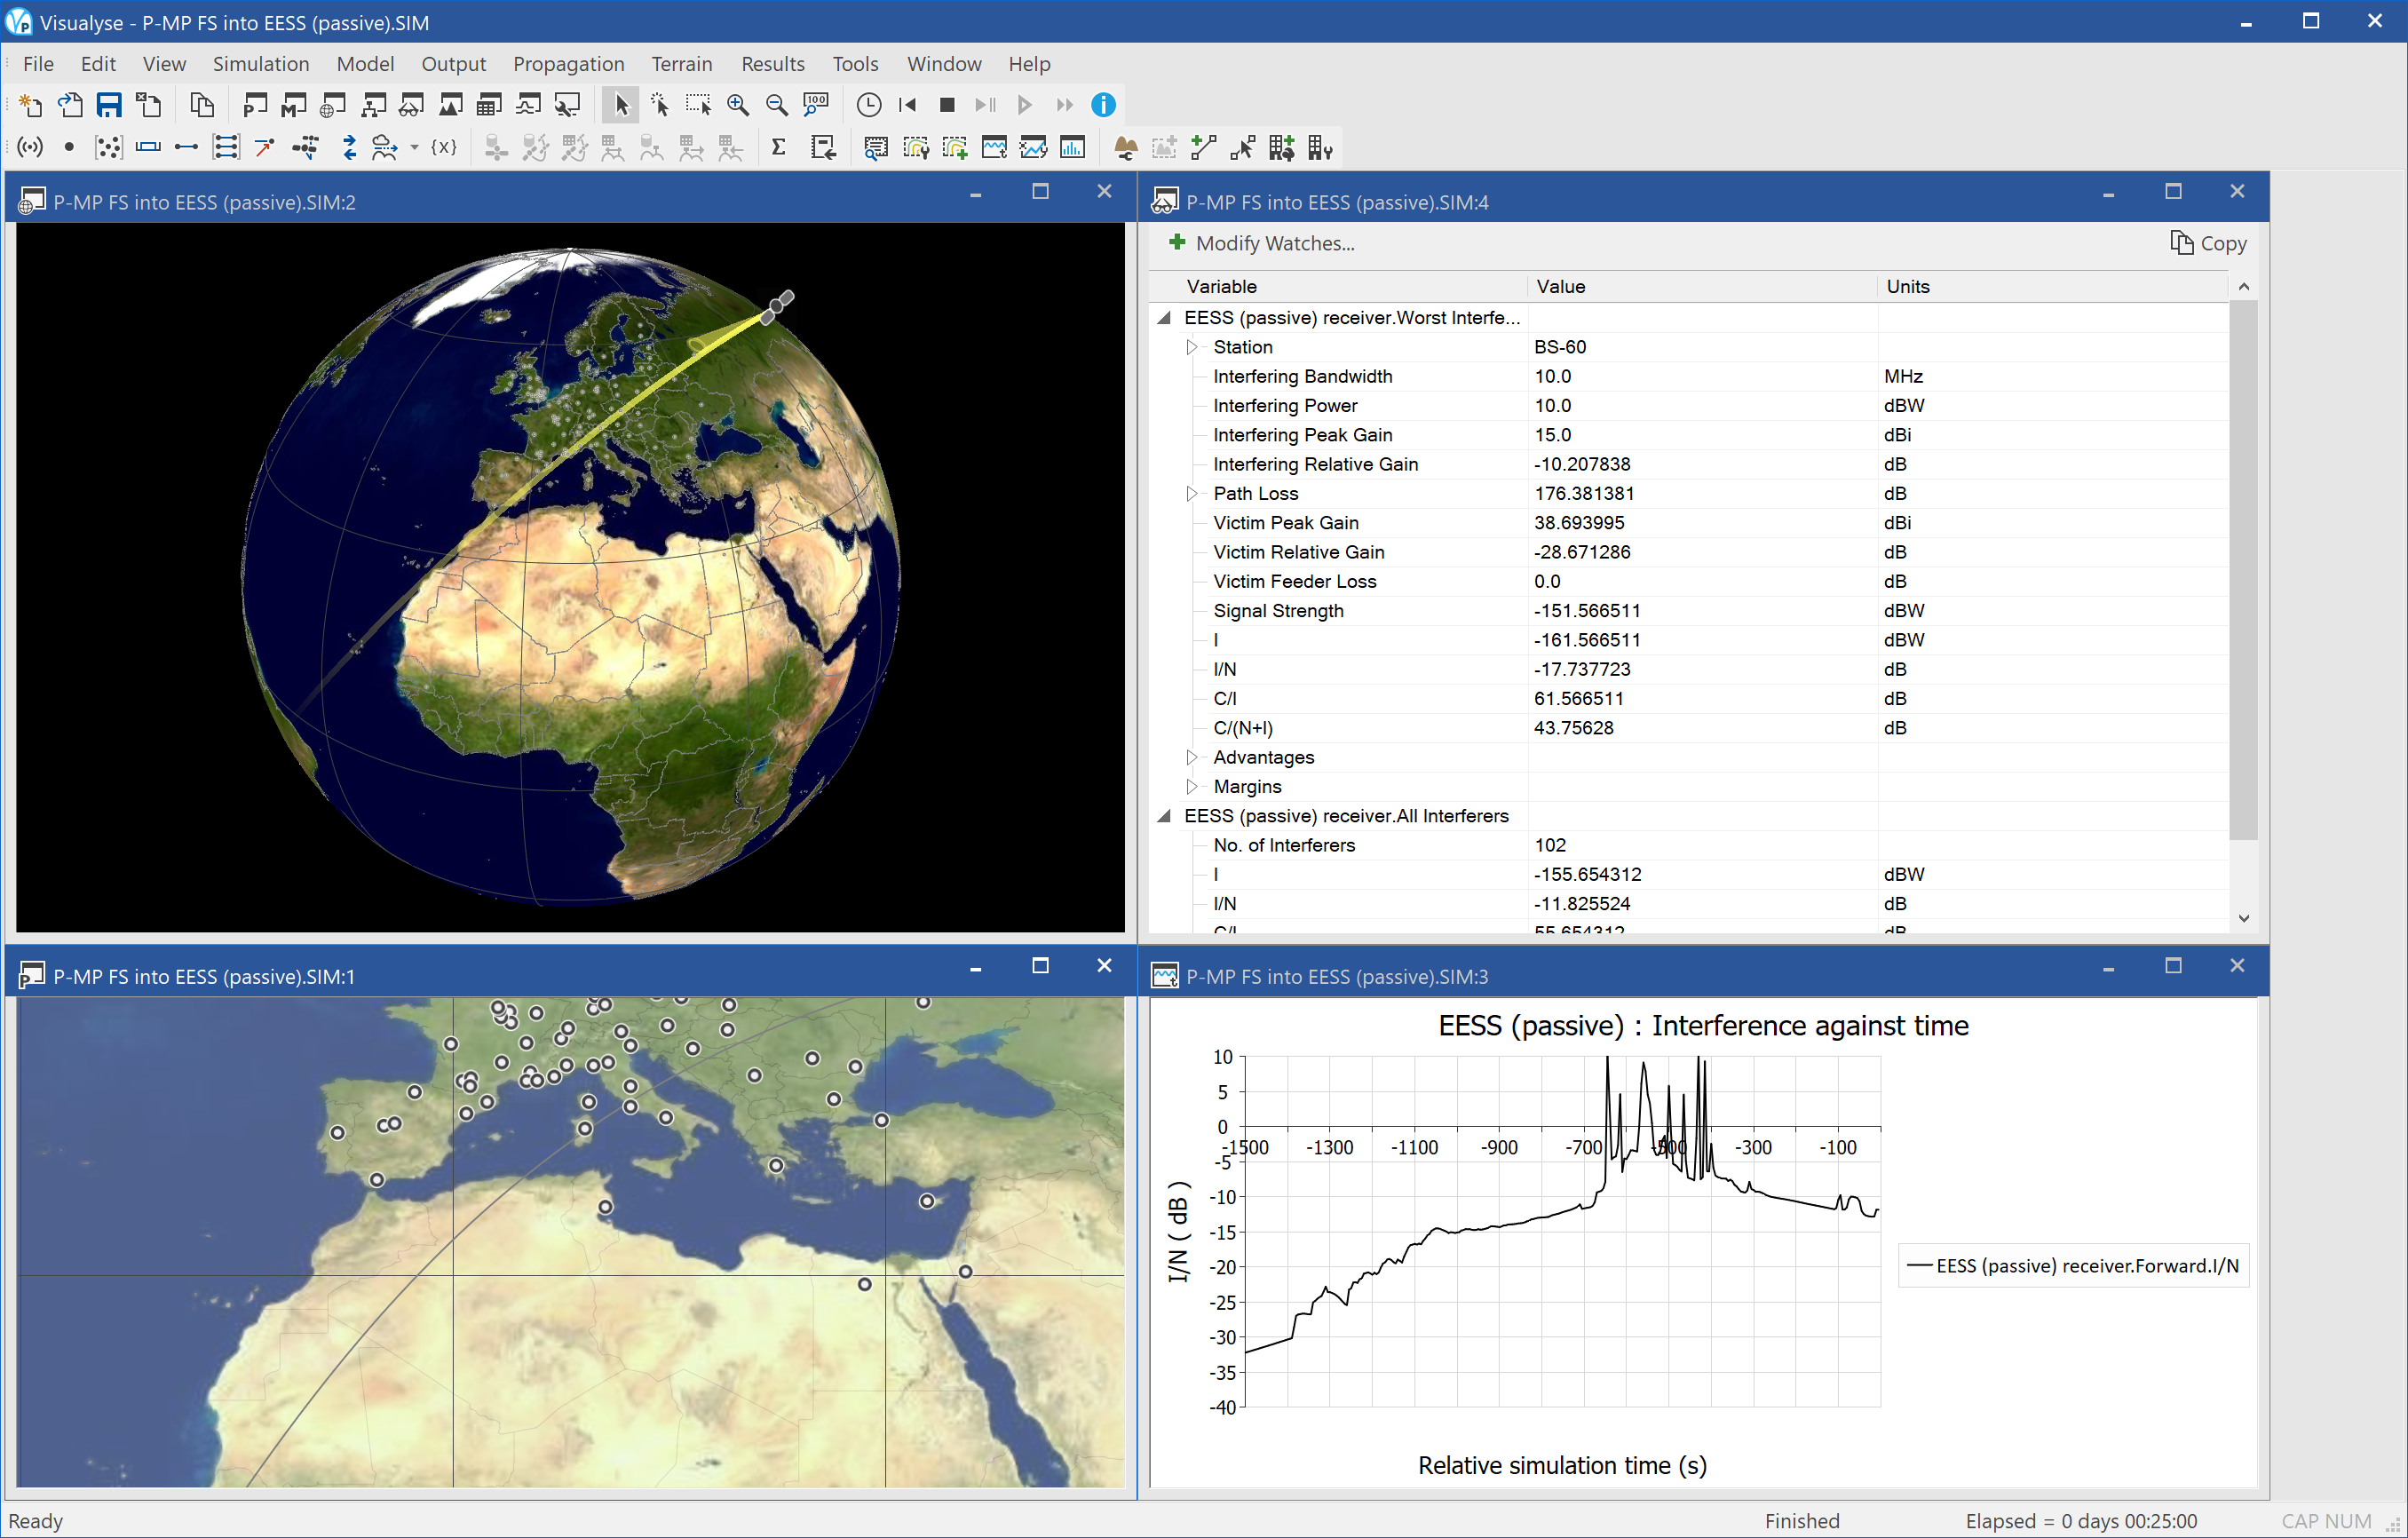
This example shows analysis from large numbers of terrestrial transmitters into a passive space-borne sensor. In this example it involves Ku band point to multi-point (P-MP) fixed service base station interfering with a satellite sensor. There are many other possible examples – including RLANs at 5 GHz into non-GSO MSS feeder links and Ka band SRR into EESS sensors.
In this example 105 P-MP base stations have been deployed across Europe. Their antenna is omni-directional with elevation dependency as in the figure below:
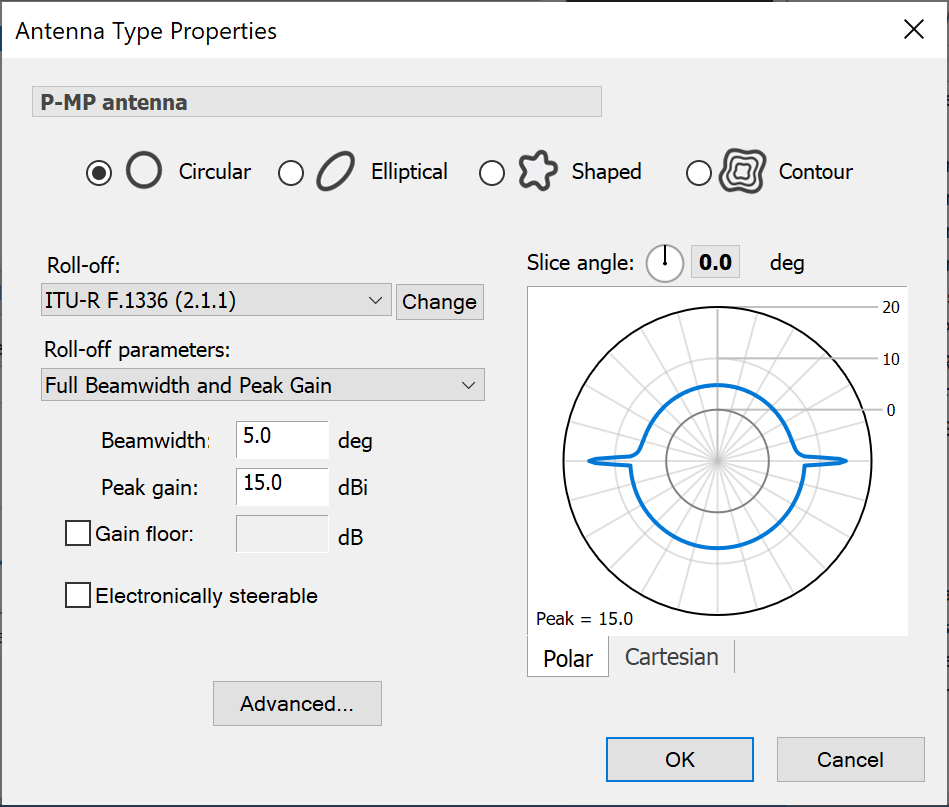
This uses one of the P-MP gain patterns in ITU-R Rec.F.1336. Each one is transmitting at 40 dBm i.e. 10 dBW across a WiMAX channel bandwidth of 10 MHz.
A remote sensing satellite is in orbit overhead, with sensor moving in pre-defined angles using the Define Variable Module. As it flies over Europe is suffers interference at its receiver, measured using the I/N metric.
The screen-shot above shows the following windows:
- 3D view (top left): showing the locations of the P-MP base stations, the satellite, its beam, and its space track
- Plate Carrée map (bottom left): showing the locations of the P-MP base stations, the satellite, its beam, and its ground track
- Watch window (top right): showing the link budget for the worst single interfering P-MP base station and the aggregation of all visible interferers
- Quick graph (bottom right): showing how the I/N varies with time as the satellite flies over
It can be seen that in this case the I/N peaks at around 10.8 dB – which could cause significant data loss.
Sensor pointing at defined (az, el) angles
| Action: | Run simulation |
| Modules used: | Define Variable |
| Terrain regions: | None |
| Frequency band: | Any |
| Station types: | Non-GSO Satellite |
| Propagation models: | n/a |
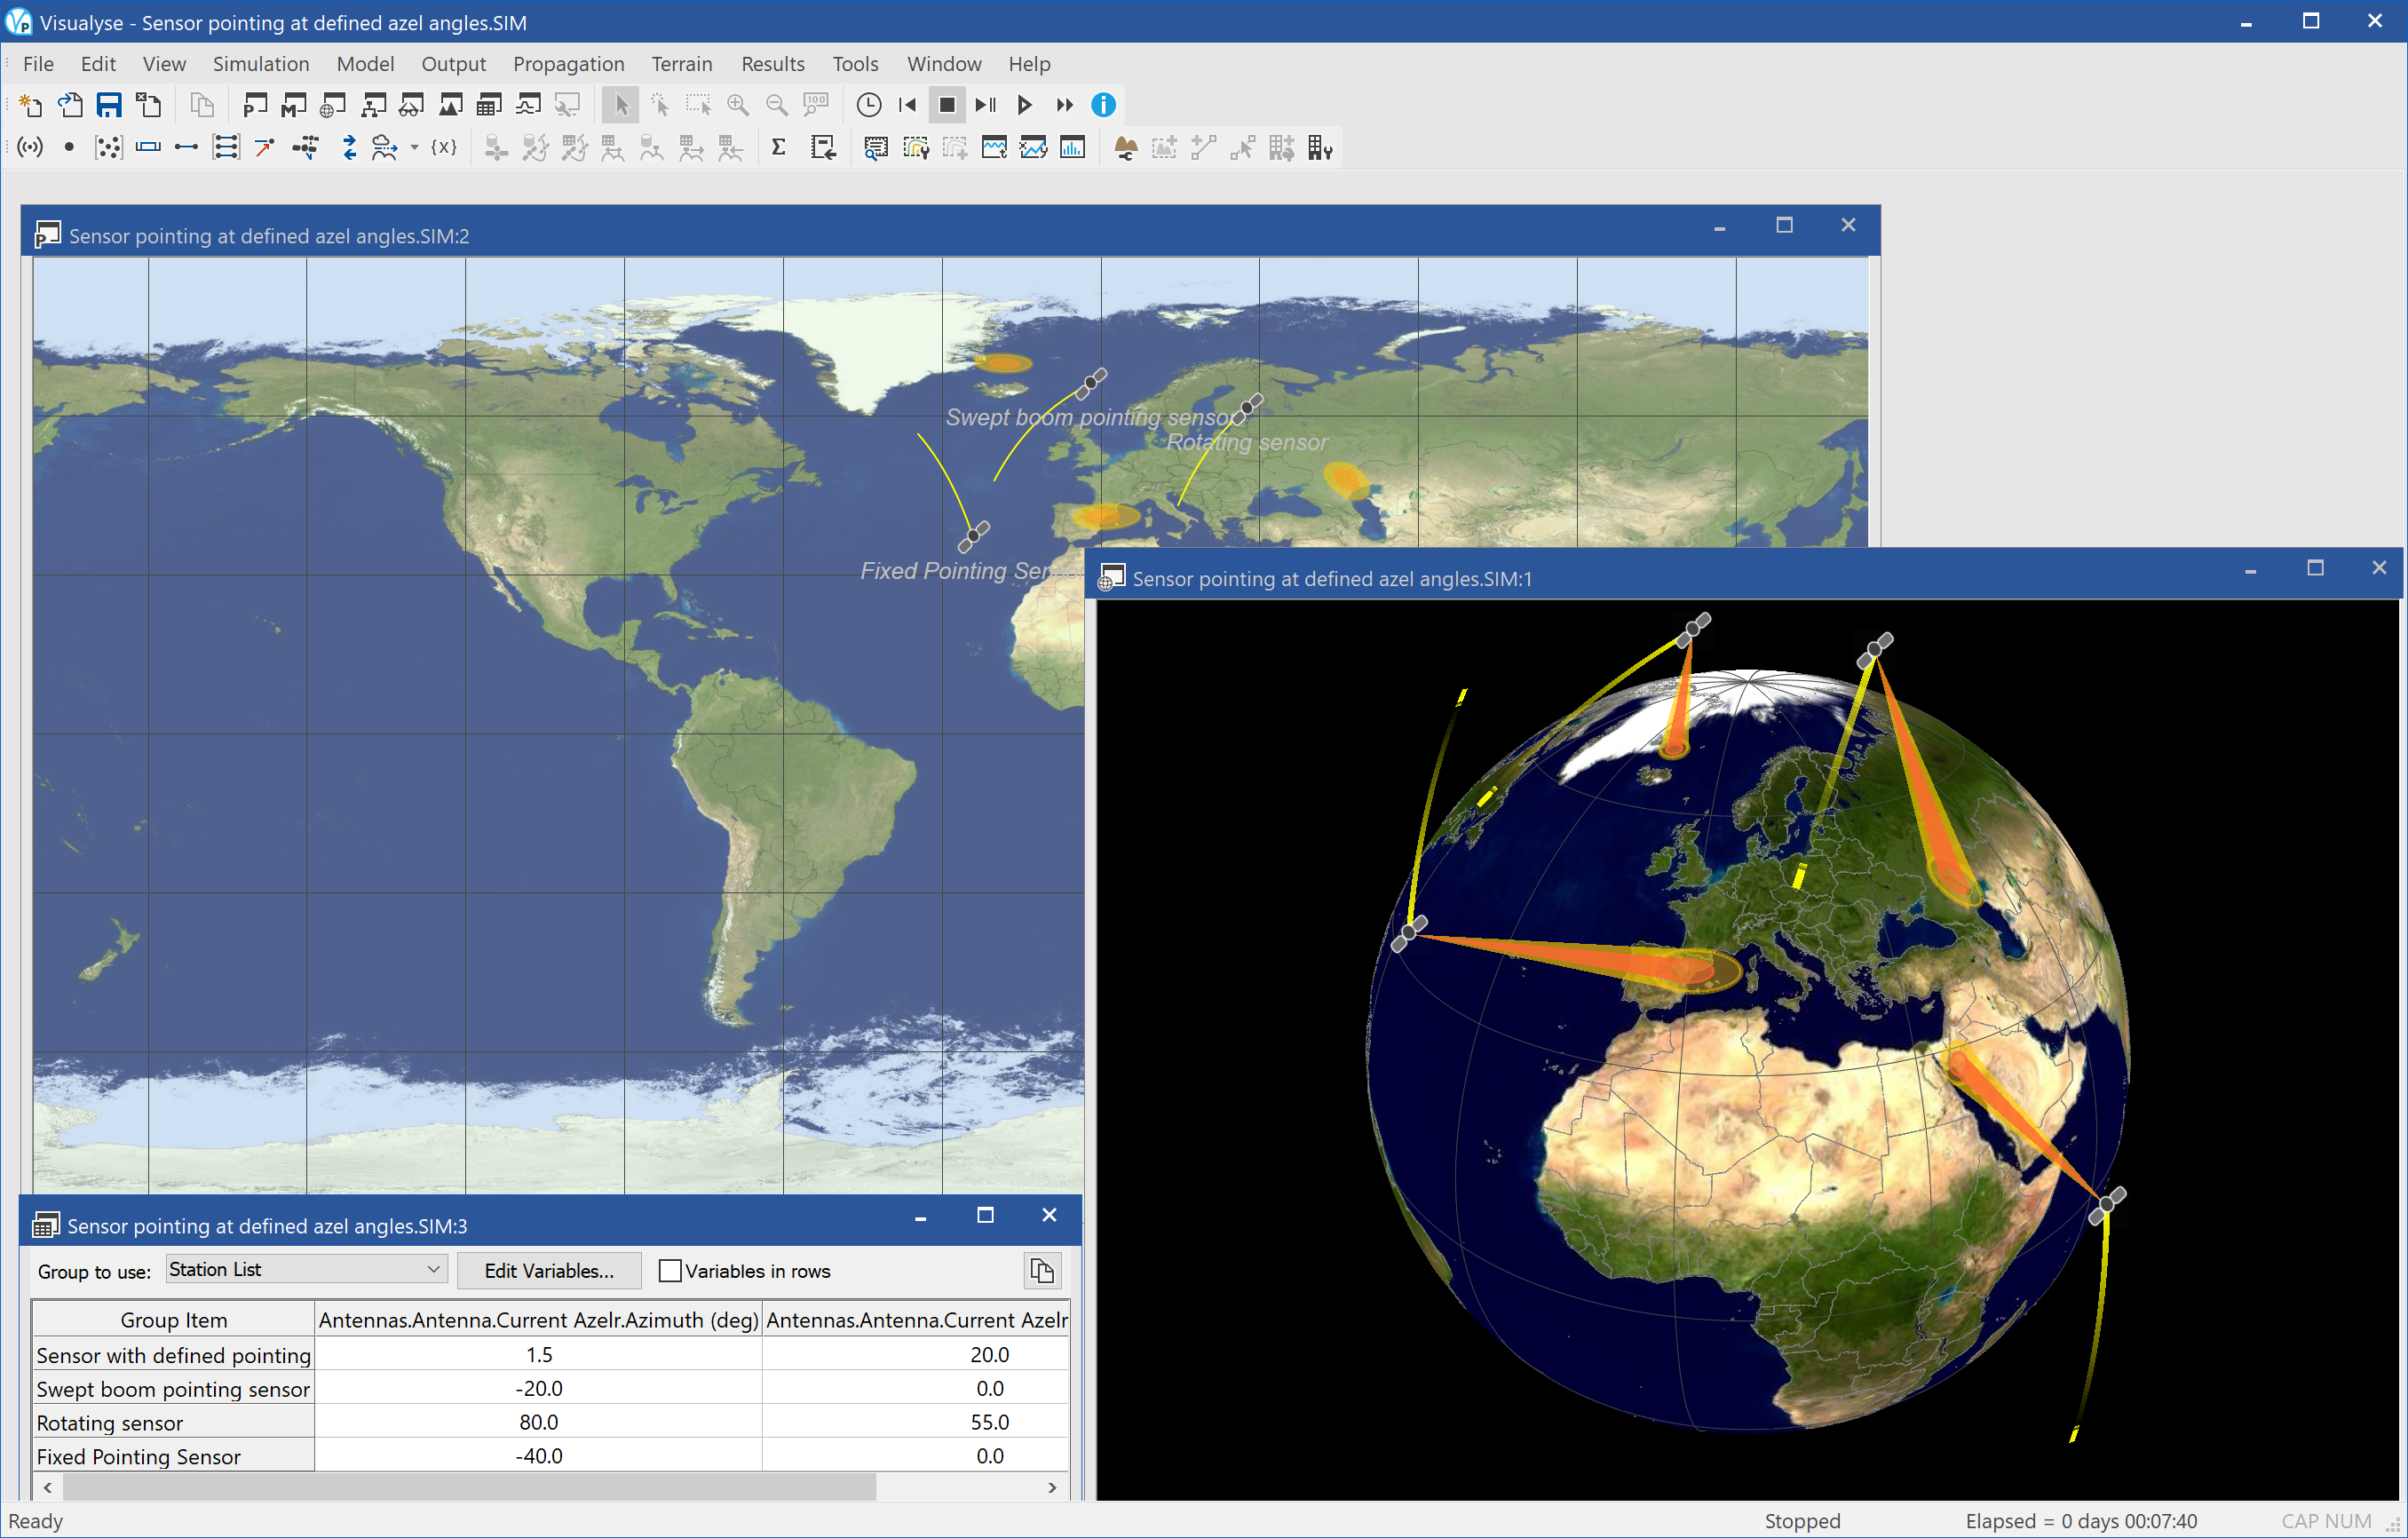
This example shows how the pointing angles of sensors can be defined in a range of different ways in Visualyse Professional. In this example the sensors are on a non-GSO satellite – for example a remote sensing satellite – but they could be on any station type.
There are four satellites each using a different method to point their sensor:
- Fixed pointing: the sensor points with (az, el) = (40°, 0°) for the duration of the simulation
- Swept broom pointing: the sensor scans back and forth between (az, el) angles of (-40°, 0°) and (+40°, 0°) at a rate of 1° per second
- Rotating: the sensor scans round around through-out 360° at a fixed elevation angle – in this case -55° – at a scan rate of 1° per second. Note that the scan platform was rotated through -90° of pitch using the Euler angles under “Advanced” so the rotation is around the required axis
- Pre-defined: the Define Variable Module was used to vary the pointing to specific locations at pre-defined times with interpolation between angles defined in the look-up tables
The simulation has been configured with three windows open:
- Plate Carrée map view (top) showing the location of the satellites, their beam footprints (-3 dB and -10 dB contours), and the ground tracks
- 3D view (right) showing the location of the satellites, their beam footprints (-3 dB and -10 dB contours), and the space tracks
- Table view (bottom left) showing the (az, el) angles of the sensors for each of the satellites.
Index of Examples by Frequency Band
This section gives an index of examples by frequency band.
Any Band
| Section | File |
|---|---|
| Aeronautical | Modelling air traffic routes |
| Radiolocation | Radar and windfarms line of sight |
| Space Science Service | Sensor pointing at defined AzEl angles |
VHF
| Section | File |
|---|---|
| Maritime | MRCC Coverage |
| Network Coverage | PMR Coverage |
UHF
| Section | File |
|---|---|
| Digital Dividend | 3G into DVB Punched Holes |
| Digital Dividend | DVB into 3G Punched Holes |
| Digital Dividend | Monte Carlo Mobile into DTT Fixed Receive |
| Network Coverage | Broadcast coverage |
| Other | Traffic and Exclusion Zone |
L-band
| Section | File |
|---|---|
| Aeronautical | Aeronautical satellite service |
| Earth station coordination | Little Leo gateways into FS |
| GSO to GSO | GSO to GSO MSS availability |
| Satellite & Terrestrial | Satellite ATC Example |
| PCS/AWS | Analysis of FS into mobile RX |
| PCS/AWS | PCS-FS Demo - BS TX |
| PCS/AWS | PCS-FS Demo - MS TX |
S-band
| Section | File |
|---|---|
| Aeronautical | Aircraft with pre-set track across US and interference from FS |
| Network Coverage | Mobile coverage |
| Non-GSO | Galileo with HEO overlay |
| Non-GSO | Non-GSO MSS and Galileo |
| Others | Smart Antennas |
| Others | Wi-Fi and ENG |
| Radiolocation | Radar into IMT BS |
| Satellite & Terrestrial | Urban GSO S-DARS Coverage |
| Short range devices | Wi-Fi and BT example |
| Military | UAV demo |
| PCS/AWS | Analysis of FS into mobile RX |
| PCS/AWS | PCS-FS Demo - BS TX |
| PCS/AWS | PCS-FS Demo - MS TX |
C-band
| Section | File |
|---|---|
| Aeronautical | AMT vs Globalstar |
| Earth station coordination | ES Exclusion Zone around WiMAX BS |
| Fixed planning and coordination | FS Import from IFIC |
| Fixed planning and coordination | PtMP UT Deployment |
| Maritime | ESV Interference Area |
| Maritime | GSO ES on ship entering Seattle Port into FS |
| Non-GSO | PFD at GSO from NGSO MSS Feeder link |
| Others | HAPS with FS and FSS |
X-band
| Section | File |
|---|---|
| Military | Missile telemetry with jamming |
| Space Science Service | PFD from non-GSO satellite DL |
Ku-band
| Section | File |
|---|---|
| Aeronautical | Aircraft into FS stations |
| Earth station coordination | Coordination contours |
| GSO to GSO | GSO transfer orbit TTC with interference from populated GSO arc |
| GSO to GSO | LUX 28,2 coverage |
| GSO to GSO | Lux Arabsat coordination |
| Non-GSO | HEO into GSO DL at Ku band |
| Radiolocation | Satellite ES into Radar 13,75 GHz |
| Space Science Service | P-MP FS into EESS (passive) |
Ka-band
| Section | File |
|---|---|
| Fixed planning and coordination | PtP link planning |
| GSO to GSO | GSO downlink with rain loss |
| Military | UAV Demo |
| Non-GSO | Data relay satellite end to end route with handover |
| Non-GSO | GSO to non-GSO Area Analysis |
| Non-GSO | MSS Feeder links with spot beams |
| Non-GSO | Teledesic & Celestri with constellation avoidance |
| Non-GSO | Teledesic 840 satellite constellation |
| Satellite & Terrestrial | HEO FSS and FS |
| Short range devices | SRR into FS |
V-band
| Section | File |
|---|---|
| Military | UAV Demo |
More Information
Please contact us with any questions you might have or if you have a suggestion for a new demonstration file.
We can be contacted at:
Address Transfinite Systems Ltd
Suite 24 (5th Floor)
AMP House
Dingwall Road
Croydon CR0 2LX
United Kingdom
Phone +44 (0)20 3904 3220
Email info@transfinite.com
Acronyms and Abbreviations
| Acronym / Abbreviation | Description |
|---|---|
| AMT | Aeronautical Mobile Telemetry |
| ATC | Auxiliary Terrestrial Component |
| AWS | Advanced Wireless Services |
| BEA | Bureau of Economic Analysis Economic Area |
| BS | Base Station |
| BSS | Broadcast Satellite Service |
| BT | Bluetooth |
| CDF | Cumulative Distribution Function |
| CSV | Comma Separated Values |
| DL | Downlink |
| DTT | Digital Terrestrial Television |
| DVB | Digital Video Broadcasting |
| EESS | Earth Exploration Satellite Service |
| EIRP | Equivalent Isotropic Radiated Power |
| ENG | Electronic News Gathering |
| EPFD | Equivalent Power Flux Density |
| ES | Earth Station |
| ETSI | European Telecommunication Standards Institute |
| FCC | Federal Communications Commission |
| FDP | Fractional Degradation in Performance |
| FS | Fixed Service |
| FSS | Fixed Satellite Service |
| GSM | Global System for Mobiles |
| GSO | Geostationary Orbit |
| HAPS | High Altitude Platform Station |
| HEO | Highly Elliptical Orbit |
| IDWM | ITU Digitised World Map |
| IFIC | International Frequency Information Circular |
| IMT-2000 | International Mobile Telecommunications - 2000 |
| ITU | International Telecommunications Union |
| LEO | Low Earth Orbit |
| MRCC | Maritime Rescue Co-ordination Centres |
| MS | Mobile station |
| MSS | Mobile Satellite Service |
| NFD | Net Filter Discrimination |
| NGSO | Non-Geostationary Orbit |
| PCS | Personal Communication Services |
| PFD | Power Flux Density |
| PMR | Private Mobile Radio |
| PtMP | Point to Multi-Point |
| PtP | Point to Point |
| RAS | Radio Astronomy Service |
| RX | Receive |
| S-DARS | Satellite Digital Audio Radio Service |
| SRR | Short Range Radar |
| SRS | Space Radiocommunication Stations |
| TIA | Telecommunication Industry Association |
| TLE | Two Line Element |
| TT&C | Telemetry Telecommand and Control |
| TVRO | Television Receive Only |
| TX | Transmit |
| UAV | Unmanned Aerial Vehicle |
| UE | User Equipment (typically a mobile handset) |
| UL | Uplink |
| UT | User Terminal |
| WCDMA | Wideband Code Division Multiple Access |
| WRC | World Radiocommunications Conference |
Visualyse 7 Maintenance History
This document describes the changes that have been made to Visualyse 7 for each maintenance release.
If an existing feature has been modified, or a new feature has been added, information on how to use it can be found in the online user guide.
To access this, select User Guide from the Help menu within the application.
Release 7.11.0.3 (December/2025)
The following changes have been made in this release:
- Update to Traffic module to allow more flexible Exclusion Zones.
- Update to Traffic module to allow TDD synchronised in Time and Direction.
Release 7.11.0.2 (November/2025)
The following changes have been made in this release:
- Fix possible issue when closing the Visualyse Settings dialog.
Release 7.11.0.1 (November/2025)
The following changes have been made in this release:
- Fix possible OpenGL issue when loading textures on File | Open.
- Fix possible OpenGL issue when changing the map gridlines when multiple SIMs are open.
- Fix possible issue with ITU-R P.676 dialog.
- Ensure errors are handled correctly when opening SIMs from a version greater than this.
- Fix possible issue with Area Analysis being invalidated (removed) when editing a SIM.
- Only show one notification when importing multiple files.
Release 7.11.0.0 (November/2025)
The following changes have been made in this release:
- Added ITU-R P.840-9, ITU-R P.1812-8. ITU-R P.2001-6, ITU-R P.530-18, ITU-R P.530-19, ITU-R P.676-13, ITU-R P.618-14, ITU-R P.837-8, ITU-R P.452-18, Revision to P2108-1 (3/41-E Rev 1), (5D/629-E) [Added to Extra Models]
Release 7.10.11.8 (October/2025)
The following changes have been made in this release:
- Fix possible issue logging multiple items in a group.
- Fix issue displaying large Clutter regions on 2D views.
- Fix issue with textures not being refreshed on 3D view.
- Limit terrain / clutter texture size more conservatively when using D2D to avoid display issues.
Release 7.10.11.7 (September/2025)
The following changes have been made in this release:
- Fix issue with Service Area Wizard not applying icon changes.
- Fix possible issue with ITU-R P.530 Rain sleet calculation.
- Persist and restore Terrestrial IFIC data source last used mode (IFIC, DVD, DVD NEW) alongside its path.
- Improve error message for missing 'SQLite3 ODBC Driver'.
- Fix issue with P530 Multipath dialog (combo order/default percentage).
- Fix issues with Terrestrial IFIC import dialog.
- Add link to SRSConvert in error message when attempting to load a non-V10 SRS.
Release 7.10.11.6 (August/2025)
The following changes have been made in this release:
- Add option to randomise the reliability and confidence in Longley-Rice model.
- Add Detailed Link Design option to ITU-R P.530.
- Add ITU-R P.1812-7, ITU-R P.2001-5, ITU-R P.2109-2.
- Fix display issues on ITU-R P.676 dialog when invoked from ITU-R P.452 dialog.
Release 7.10.11.5 (August/2025)
The following changes have been made in this release:
- Add the gain pattern in Rec ITU-R S.1528 recommends 1.4.
- Enable the avoid GSO arc and avoid GSO arc system tracking strategy options to be used in the reverse direction when the start station is a satellite and end station the Earth station.
- Prompt the user about sorting TLE data when importing a TLE file.
- Performance improvement.
- Fix possible issue re-ordering overlays.
- Fix possible display issue with Contour Area Analysis.
Release 7.10.11.4 (July/2025)
The following changes have been made in this release:
- Fix possible licencing issue on X86 releases.
- Don’t display DK2 Network Server connection dialog if not needed at startup.
Release 7.10.11.3 (July/2025)
The following changes have been made in this release:
- Fix Traffic object tree control visibility issue.
Release 7.10.11.2 (July/2025)
The following changes have been made in this release:
- Fix alignment issue on Visualyse Settings dialog.
- Resolve possible issue when re-running Wizards when SIM has Area Analysis active.
- Fix possible locale issue when using TXT files in locales that use comma as decimal separator.
- Improve reporting of Importing overriding Propagation / Statistics.
- Fix possible issue when using Import with TXT files.
Release 7.10.11.1 (June/2025)
The following changes have been made in this release:
- Fix display issue on “About Visualyse” dialog.
- Fix possible performance issue on ARM devices.
- Fix issue with displaying driver version for ARM devices.
- Fix issue with Station Groups on Watch Window.
Release 7.10.11.0 (June/2025)
The following changes have been made in this release:
- Improve performance of Tree Controls – Watch Window, Model View, Variable select dialog etc.
- Add new licencing options on Settings dialog.
- Fix possible issue on Rec. ITU-R P.530 Multipath dialog.
- Make Clutter / Terrain Settings dialogs resizable.
- Don't re-attempt to connect to GIMS Shaped Beam if config fails.
- Revise Terrain / Clutter DLLs that use GDAL.
- Fix possible issue when re-running the Link to Station Group Wizard.
- Fix possible memory issue with large terrain / clutter areas.
- Reorganise installed data files.
- Fix possible issue with Frequency View when link is deleted
Release 7.10.10.9 (May/2025)
The following changes have been made in this release:
- Fix possible issue on Advanced Beam Options dialog.
Release 7.10.10.8 (May/2025)
The following changes have been made in this release:
- Support importing from new format Terrestrial BR IFIC (>= 3042).
- Fix possible issue with Throughput calculations when using bits.
- Make Propagation Properties dialog resizable.
- Fix possible issues when a Watch is invalidated in the Watch Window.
- Improve error reporting when loading TXT files.
- Fix typo on Import Data File dialog.
- Fix possible file format issues when saving/loading old files.
Release 7.10.10.7 (April/2025)
The following changes have been made in this release:
- Include tests for bin rounding down/up in the PFD analysis tool.
- Fix issue with TXT files that use Hexagonal Service Area.
- Fix issue in some scenarios if you delete all the links for a link group and save the SIM.
Release 7.10.10.6 (March/2025)
The following changes have been made in this release:
- Add back in support for Windows 8.1/Server 2012 R2.
- Improve error display when importing from a TXT file.
- Orbit Advanced dialog: specify Epoch Time is UTC and must not be after start time.
- Extend field to specify timesteps between logs.
- Fix possible issue with statistics when using Import Rx Systems.
- Fix issue when using Def Var on Interference – Other Advantages.
- Fix possible redraw issue on Link dialogs.
- Fix issue with HEO Wizard.
Release 7.10.10.5 (February/2025)
The following changes have been made in this release:
- Clutter Configuration Dialog: make resizable / fix import when large number.
- Add Bessel Standard pattern as detailed here: https://docs.transfinite.com/visualyse/annex_gain_patterns#bessel-standard
- Define Variable Service Area: add a new option that allows the position of a group of Stations (e.g. mobiles) to be randomised with respect to another group of Stations (e.g. base stations (BSs)) with a 1:1 mapping. As detailed here: https://docs.transfinite.com/visualyse/modules_define_variable#monte-carlo-mobiles
- Add a new Statistics rounding option as detailed here: https://docs.transfinite.com/visualyse/user_guide_visualyse_statistics_collection#statistic-calculation-options
- Fix issue in Area Analysis in some scenarios.
- Add ITU-R S.1428-1 Rec: This gain pattern is the same as the existing Rec. ITU-R S.1428-1 but uses the Recommendation equations to calculate the peak gain rather than from the efficiency.
- Resolve back compatibility issue so old files use the original Rec. ITU-R S.1428-1.
- Fix possible issue when using Statistics on Link Groups and selecting the Calculation Options dialog.
Release 7.10.10.4 (January/2025)
The following changes have been made in this release:
- Add an error message when try to save a multiple beam antenna type with no beams.
- Add support for v10 SRS databases.
- Fix typo on HEO Wizard dialog.
- Fix error message when setting Num DP to > 12.
- Fix horizontal scrolling on Terrestrial IFIC Search Results dialog.
- Make Terrestrial IFIC Search Results / Terrestrial IFIC Failed Systems dialogs resizable.
- Fix issue with Import GSO Systems / Import non-GSO Systems when fail to connect then select a valid DB not updating list.
- Visualyse 7 no longer runs on Windows 7. Further details can be found here: https://www.transfinite.com/content/VisualyseWindows7
It is recommended all users install the latest DK2 device drivers (V8.28.33) from https://www.transfinite.com/content/dongledriverinstall_V8_28_33
Release 7.10.10.3 (December/2024)
The following changes have been made in this release:
- Add an error message when try to save a multiple beam antenna type with no beams.
- Ensure if gain pattern is isotropic/omni, can't select dish size/footprint size options.
- Make Terrain Regions / Land Use Regions dialogs resizable.
- Fix issue when selecting large number of files with long paths in Terrain Regions / Land Use Regions dialogs.
- Warning about no (current) support for v10 SRS databases.
- Constellation Wizard – default to not showing tracks.
- Fix issue with HEO Wizard / Constellation Wizard showing extra application icon on task bar when displayed.
- Improve performance when showing dialogs with large number of items in list/tree.
Release 7.10.10.2 (November/2024)
The following changes have been made in this release:
- Add new Throughput options as detailed in the Technical Note: Spectrum Efficiency and Throughput Calculations.
Release 7.10.10.1 (November/2024)
The following changes have been made in this release:
- Make Visualyse Simulation Settings dialog resizable to better facilitate users adding information in the “Description” field to describe the ISIM file.
- Add Save/Load to Area Analysis Block Settings dialog to allow Export / Import of settings.
- Fix possible issue on Link Path page.
- Fix possible issue on System Link Group Calculation tab.
- Minor revisions to Object Tree.
Release 7.10.10.0 (November/2024)
The following changes have been made in this release:
- Add new Transmit Power options as detailed in the Technical Note: Transmit Power Options.
- Make the Population Data Settings, Warning and Tracking Constraint dialogs resizable.
- Performance improvements for larger SIMs.
- Allow Grid Control copy and paste to handle larger number of elements.
- Improve Map View performance when lots of U.I elements are displayed.
Release 7.10.9.9 (September/2024)
The following changes have been made in this release:
- Make Station ViewInfo visible to the Change Variable Wizard.
Release 7.10.9.8 (August/2024)
The following changes have been made in this release:
- Make Antenna Type List resizable.
- TXT file import of non-GSO can raise errors in some scenarios.
- Fix possible issue after using CVW to change a Tracking Strategy from a built-in to user defined.
- Improve Data vs Time graph when dealing with small value changes.
- Performance improvements.-
Release 7.10.9.7 (August/2024)
The following changes have been made in this release:
- Add Advanced PFD Analysis features as detailed in this Technical Note: PFD Analysis Features.
- Add Ctrl-Click to list dialogs to move item to top/bottom
Release 7.10.9.6 (June/2024)
The following changes have been made in this release:
- Modification to the PFD Mask Antenna Type to add an option for masks to be defined by Alpha Angle not Elevation Angle.
- Update Shaped Beam Antenna Type to allow multiple Gain(az,el) tables for different (az, el) pointing angles.
- Fix dialog icon button drawing issues.
- Fix issue when using Define Variable on a link and re-running the Link Group Wizard.
- Fix dialog validation issue when using Elevation by Latitude.
Release 7.10.9.5 (June/2024)
The following changes have been made in this release:
- Fix possible issue with Area Analysis with Tracking Strategies.
- Fix issue with Custom Selection Method dialog not allowing decimal values for Minimum Track Angle.
- Allow both Antenna and Beams to track at the same time.
Release 7.10.9.4 (May/2024)
The following changes have been made in this release:
- Table View – ensure “Group to use” dropdown is updated as lists change.
- Fix possible issue on the Tracking Strategy dialog when using “Advanced” option.
- Allow Constellation Avoid to use the same constellation as under consideration.
Release 7.10.9.3 (May/2024)
The following changes have been made in this release:
- Add new Tracking Strategy options as detailed in this Technical Note: Making Tracking Strategies
Release 7.10.9.2 (April/2024)
The following changes have been made in this release:
- Add new setting for GIMS Database location.
- Fix possible dialog issue on selecting built in Tracking Strategy - Avoid Constellation.
Release 7.10.9.1 (April/2024)
The following changes have been made in this release:
- Add ITU-R RA.1631, ITU-R SA.509 Rec 1.1, ITU-R SA.509 Rec 1.2
- Refactor Help menu.
- Fix issue where 3D view was unable to scroll in some scenarios.
Release 7.10.9.0 (March/2024)
The following changes have been made in this release:
- Add ability to set the maximum number of active links that can use a single Traffic object.
- Add some new Tracking Strategy Options as detailed in this Technical Note: Making Tracking Strategies
- Add ability to reorder items on all the object lists.
- Add toolbar icons for Change Variable Wizard.
- Improve horizontal scrolling on the list dialogs.
- Default File | Open directory to Example Files on first installation.
- Fix issue loading example files using terrain when software not installed in default location.
- Replace Watch Window "Modify Watches..." with "Show Object Tree..." and "Hide Object Tree..." for improved clarity.
- Fix icon issue on Object Tree.
- Fix some spelling errors on some dialogs.
- Make the Tracking Strategy and Handover Options dialogs resizable.
- Enable horizontal scrolling on the Station/Link Group dialogs.
- Use enhanced Combo Box on the Group Avoidance dialog.
Release 7.10.8.6 (February/2024)
The following changes have been made in this release:
- Fix possible issue with losing connection to DK2 Network Server when PC goes to sleep.
- Fix possible locale issue when importing GXT files.
- Revise Lat/Long format to be 3.4 when exporting GXT files.
Release 7.10.8.5 (December/2023)
The following changes have been made in this release:
- Warn that Propagation/Statistics are overridden when using File | Import.
- Fix registry Application ID issue.
- Handle DK2 HID devices on About dialog.
Release 7.10.8.4 (November/2023)
The following changes have been made in this release:
- Add interface to new release of population data. See: https://www.transfinite.com/content/population_data
Release 7.10.8.3 (October/2023)
The following changes have been made in this release:
- Add option to have Tracking Strategy filter where the Minimum Elevation Angle varies by Azimuth.
- Make Visualyse Message dialog resizable.
- Add extra validation when loading TXT files to better catch issues with Antenna Types.
- Add notification when user loads a file created with a version of the software greater than the current version.
Release 7.10.8.2 (September/2023)
The following changes have been made in this release:
- Allow user to enter a User Defined Clutter Model where the clutter loss can vary by azimuth angle at Tx and Rx ends.
- Fix scaling of saved/loaded views to better take into account Microsoft Windows scaling factors.
- Fix possible issue loading dynamic links from TXT file.
- Improve loading Antenna Types from TXT files.
- Fix possible TXT file loading issue with NGSO orbits.
Release 7.10.8.1 (September/2023)
The following changes have been made in this release:
- Revise and improve the antenna/beam locking strategy by clearing the locks of all antennas and beams prior to the simulation update sequence undertaken at each time step.
Release 7.10.8.0 (August/2023)
The following changes have been made in this release:
- Fix possible issue when loading a GXT file.
Release 7.10.7.9 (August/2023)
The following changes have been made in this release:
- Resolve possible issue when saving/loading simulations to/from TXT file when using links with built-in Tracking Strategy.
- Fix possible initial selection issue on Object Tree when item selection is in [all station objects] or [all link objects].
Release 7.10.7.8 (August/2023)
The following changes have been made in this release:
- Fixes redraw issue when maximising Model View.
Release 7.10.7.7 (August/2023)
The following changes have been made in this release:
- Fix filter on Clutter Configuration Import dialog.
- Fix Traffic sub-menu being slow to display.
- Ensure OpenGL station textures are created when running import wizards.
Release 7.10.7.6 (July/2023)
The following changes have been made in this release:
- Fix issue when selecting invalid items to log.
- Reconfigure Chart Settings dialog to accommodate users with low resolution screens.
- Improve startup time of Chart Settings dialog.
- Fix space tracks drawing issue on 3D View.
- Handle SRS import errors better when MDB files haven’t been linked correctly.
- Fix scrolling issue on Interfering Links tab.
- Fix possible GIMS error when running x86 version on Windows 7.
- Update installed DK2 DLL.
It is recommended all users install the latest DK2 device drivers (V8.22.26) from https://www.transfinite.com/content/dongledriverinstall_V8_22_26
Release 7.10.7.5 (May/2023)
The following changes have been made in this release:
- Add Suspend/Activate all Area Analysis option.
- Add some new Menu icons.
- Fix possible crash in Change Variable Wizard.
- Fix DPI scaling issues on OpenGL views.
- Fix Overlay drawing issues on OpenGL views.
- Fix possible issues with Date control on the Simulation Run Time dialog.
- Fix drawing issue on the Simulation Run Time dialog.
- Fix possible redraw issues when using Shaped Beam Editor.
- Fix locale issues when pasting to grid control.
- Better address 2038 issues on Simulation Run Time dialog.
- Resolve possible OpenGL issues on 3D View.
Release 7.10.7.4 (March/2023)
The following changes have been made in this release:
- Modification to the PFD Mask Antenna Type to add an option to specify the PFD mask is used for RNSS calculations under Resolution 609.
- Add ability to calculate GDOP into a Link Group.
- Fix issue with Model/Watch view when using large toolbar icons
Release 7.10.7.3 (March/2023)
The following changes have been made in this release:
- Fix possible Toolbar icon redraw issue on low DPI displays.
Release 7.10.7.2 (March/2023)
The following changes have been made in this release:
- Add new Setting "Show Update Dialog at Startup".
- Fix Station | Advanced Roll/Pitch/Yaw issue.
- Fix redraw issues on Custom Selection Method dialog.
Release 7.10.7.1 (February/2023)
The following changes have been made in this release:
- Handle Cancel consistently on Graph selection dialogs.
- Fix issue when reloading a SIM file that has an incorrectly configured Graph plot.
- Address possible locale issue when importing from TLE.
Release 7.10.7.0 (February/2023)
The following changes have been made in this release:
- Add “Use Large Icons” and “Reset” toolbar options under View | Toolbars.
- Fix issue when importing non-GSO systems from SRS when phase_ang is NULL.
Release 7.10.6.9 (February/2023)
The following changes have been made in this release:
- Fix DPI issues on Link Statistics page when using lots of D.P
- Fix DPI scaling on Station Antenna Page.
- Add Notification when Windows Scaling is set to a value that can cause truncated U.I elements.
- Add Notification when Windows Resolution is less than the minimum of 1280x1024.
- Provide more information when there are ITU Database connection issues.
- Fix issues with Frequency View not allowing Return direction for a SIM with only that direction.
Release 7.10.6.8 (January/2023)
The following changes have been made in this release:
- Show both percentage bad (all steps) and percentage bad (active steps).
- Allow option to select whether graph CDF should be over all steps or active steps.
Release 7.10.6.7 (January/2023)
The following changes have been made in this release:
- Fix possible issue with Distribution Chart redraw.
- Resolve issue on Tracking Strategy dialog where Min Track Angle not being updated when change the Exclude Antennas option.
- Resolve load/save issue with P.618 setting Maximum Percentage.
- Fix issue on Chart Settings Dialog with invalid options (when using log-axis) being potentially displayed on initial display.
Release 7.10.6.6 (December/2022)
The following changes have been made in this release:
- Allow more than 6 Gain Tables to be used in Advanced Beam Options.
- Fix issue setting CDF to use log Y-Axis in some scenarios.
- Resolve issue with Area Analysis contour label drawing at offset.
- Resolve CDF drawing issue.
- Fix issue with TXT file import when icon starts with a number.
- Fix issue in IDWM when path length is 0.
- Resolve possible drawing issues with Area Analysis in Direct2D mode.
- Fix issue in Tracking Strategy: Continue to Track.
Release 7.10.6.5 (September/2022)
The following changes have been made in this release:
- Add option on Constellation Wizard to switch off ground tracks in preview.
Release 7.10.6.4 (September/2022)
The following changes have been made in this release:
- Add initial implementation of Generic GRD/GRC interface for Clutter/Terrain data.
- Ensure elevations increase in new user defined Clutter Model where Clutter Loss can vary by elevation angle.
Release 7.10.6.3 (August/2022)
The following changes have been made in this release:
- Allow users to enter a user defined Clutter Model where the Clutter Loss can vary by elevation angle at Tx and Rx ends.
- Initial support for a Generic GeoTIFF Terrain/Clutter DLL.
- Add support for ITU regions to Country Service Area Wizard.
- Fix error message when loading clutter file.
- In (unlikely) event of issues loading overlay information, only report errors once.
- Allow Export/Import of Clutter Configuration.
- Fix possible memory issue when loading large Terrain/Clutter images.
- Set Document modified flag when importing GSO/NGSO.
- Add P2108 revision to Clutter Extra Models.
- Fix "Don't draw" handling on Terrain Colours Dialog.
- Fix issue drawing countries with opacity when using Direct2D.
- Fix issue click selecting country in Service Area Wizard Area page.
- Fix possible issue loading map data if two instances of Visualyse are opened at same time (prevent file lock).
Release 7.10.6.2 (July/2022)
The following changes have been made in this release:
- Fix DPI issue on Traffic Settings dialog.
- Fix possible issue when using Traffic Exclusion Distance on a Dynamic Link.
Release 7.10.6.1 (June/2022)
The following changes have been made in this release:
- Fix issue scaling Views when loading files saved with an older version.
Release 7.10.6.0 (June/2022)
The following changes have been made in this release:
-
Fix issue displaying the Variable Definition dialog when running on Windows Server 2012 (R2). (Note: we generally recommend the software is installed on Windows 10/11).
-
Add a search bar to the Application Title bar. This allows users to search the menu options.
-
Add a notification icon to the Application Title Bar. This displays a badge with the number of notifications. Clicking displays the Notifications View. At present this is used to display general application information (new software updates, DK2 driver updates etc).
-
Implemented Windows 11 Snap Layout. When the program is running on Windows 11 and the maximize/restore caption button is hovered, the layout popup menu will appear near this button.
-
Update installed DK2 DLL.
It is recommended all users install the latest DK2 device drivers (V8.20.21) from https://www.transfinite.com/content/dongledriverinstall
Release 7.10.5.9 (May/2022)
The following changes have been made in this release:
- Revise P.2109 elevation angle at building calculation.
Release 7.10.5.8 (May/2022)
The following changes have been made in this release:
- Get the Interferer carrier for M.1461 continuous/chirped equations rather than wanted.
Release 7.10.5.7 (May/2022)
The following changes have been made in this release:
- Add ability to change Chart legend fonts.
- Make the OTR term visible in the watch window and object tree, not part of the bandwidth adjustment.
- Force the inclination angle to in the range [0, 180] and for the GSO inclination to be in the range [0, 90].
- Results | View Results shows internal not display units in some cases.
Release 7.10.5.6 (April/2022)
The following changes have been made in this release:
- Fix possible issue when SIM has Area Analysis defined with area less than pixel size.
Release 7.10.5.5 (April/2022)
The following changes have been made in this release:
- Performance improvements in P528-5 implementation.
Release 7.10.5.4 (April/2022)
The following changes have been made in this release:
- Add P1812-6 implementation.
Release 7.10.5.3 (April/2022)
The following changes have been made in this release:
- Add P452-17 implementation.
Release 7.10.5.2 (April/2022)
The following changes have been made in this release:
- Add P2108-1 implementation.
Release 7.10.5.1 (April/2022)
The following changes have been made in this release:
- Add P1546-6 and revise dialog to include new options.
Release 7.10.5.0 (April/2022)
The following changes have been made in this release:
- Add implementations of P2001-4, P2109-1, P528-5, P1812-5.
Release 7.10.4.2 (March/2022)
The following changes have been made in this release:
- Fix possible bug when changing the number of groundtracks.
Release 7.10.4.1 (March/2022)
The following changes have been made in this release:
- Allow Point Mass plus J2 to be set in the NGSO Import.
- Minor revision to Power Control “Use Freespace only” calculation.
- Fix ground track save/load issues.
Release 7.10.4.0 (March/2022)
The following changes have been made in this release:
- Remove PREVIEW from Title Bar.
Release 7.10.3.9 (March/2022)
The following changes have been made in this release:
- Add seven new satellite icons.
- Update M.2101 dialog to make clear horizontal/vertical = columns/rows
Release 7.10.3.8 (March/2022)
The following changes have been made in this release:
- Fix issue exporting ITU M.2101 parameters in TXT file.
- Fix DPI display issue with Advanced Beam Options dialog.
- Add Option under File menu – “Save Inputs Report” to export SIM input parameters.
Release 7.10.3.7 (February/2022)
The following changes have been made in this release:
- Include the OTR term in the Bandwidth Adjustment Factor shown.
Release 7.10.3.6 (February/2022)
The following changes have been made in this release:
- Add throughput calculations in S-2131-1
- Add ability to set statistics calculation options in links and link groups
- Update shaped gain table advanced options label to say sub-satellite point or zenith for cases where multiple tables are used by ES/UTs.
- Fix problems saving / loading text files when the DefVar Monte Carlo uses a table.
- Resolve issues with TXT file loading/saving when using certain options for Dynamic Links.
Release 7.10.3.5 (February/2022)
The following changes have been made in this release:
- Fix issue with icons not updating on Model View after using the Import dialogs.
Release 7.10.3.4 (February/2022)
The following changes have been made in this release:
- Fix issue with propagation/statistics environment when loading TXT files.
Release 7.10.3.3 (February/2022)
The following changes have been made in this release:
- Performance improvements.
- Fix warning when loading .TXT files that use P.618.
- Fix dialog display refresh when duplicating station antennas.
- Improve text for the tracking strategy selection method “avoid tracking station tracked by another antenna”.
Release 7.10.3.2 (January/2022)
The following changes have been made in this release:
- Fix issue with Rec. ITU-R F.1336-5.
Release 7.10.3.1 (January/2022)
The following changes have been made in this release:
- Fix issue changing Latitude/Longitude grid spacing when using OpenGL 2D Views.
- Fix possible crash when changing station Antenna Types.
Release 7.10.3.0 (December/2021)
The following changes have been made in this release:
- Fix issue with applying colours to certain icons.
- On Import override propagation / statistics environment for links. Don't override global data.
- Fix issue with Contour Antenna Type Properties dialog.
- Fix issue with Beam colour getting lost when antenna type is updated.
- Fix colouring by Antenna Type on Map Views.
Release 7.10.2.9 (December/2021)
The following changes have been made in this release:
- Fix issue when using File | Import multiple times.
Release 7.10.2.8 (December/2021)
The following changes have been made in this release:
- Fix some issue when using Probability Distribution graph.
- Fix issues drawing Polar Plot / Line Graph when very -ve values.
- Define Variable Service Area revise loading order in Text file to prevent issues.
- Define Variable Service Area format output better in Text file.
- Fix missing power variable in Object Tree.
- Fix issue with duplicated output in Define Powers in Text file.
- Fix issue in Data vs Time graph where number of points increased, and number of plots increased in same update.
Release 7.10.2.7 (November/2021)
The following changes have been made in this release:
- Add missing power variables in Object Tree.
Release 7.10.2.6 (November/2021)
The following changes have been made in this release:
- Fix issue in alpha PC algorithm.
Release 7.10.2.5 (November/2021)
The following changes have been made in this release:
- Fix display issue on “About Visualyse” dialog.
Release 7.10.2.4 (November/2021)
The following changes have been made in this release:
- Improve field spacing on Link Statistics tab on Simulation Results dialog
- Improve frames and popup windows appearance on Windows 11.
Release 7.10.2.3 (October/2021)
The following changes have been made in this release:
- Add analytic alpha calculation to vector and use it in the GSO tracking strategy.
- Fix issue with EPFD/PFD in table view being shown as N/A.
Release 7.10.2.2 (October/2021)
The following changes have been made in this release:
- Include option to synchronise all links using TDD so that all are on DL / UL at the same timestep
- Terrestrial IFIC Search Results: Make Failed button more obvious
- Fix possible issue when Earth Station located at North Pole.
- Enable buttons better in Model View
- Improve speed when SIM is running in non-interactive mode.
- Enable/Disable Model View Add menu items for DefVar/Traffic depending on dongle status
- Add DefVar to Model View menu
- Support 1064 && 1065 population files
Release 7.10.2.1 (September/2021)
The following changes have been made in this release:
- Speed up loading of SIM files that contain a large number of objects.
- Make app more responsive on loading large files.
- Fix possible issue when using a setup that falls back to the default “Microsoft Generic” software renderer.
- Resolve DPI issue on Link Transmit Page.
- Fix possible issue when loading old files.
- Make application more responsive when initialising.
- Fix issue displaying ground tracks on Mercator view.
- Support population data containing 1064 and 1065 files.
- Resolve “Forward Call to SPBM_ANTGAINEX” error when using Edit Contours dialog.
Release 7.10.2.0 (August/2021)
The following changes have been made in this release:
-
Update installed DK2 DLL.
It is recommended all users install the latest DK2 device drivers (V8.19.7) from https://www.transfinite.com/content/dongledriverinstall
Release 7.10.1.9 (August/2021)
The following changes have been made in this release:
- Add option to export Beams to Google Earth.
- Fix issue on Antenna Type Properties dialog.
Release 7.10.1.8 (August/2021)
The following changes have been made in this release:
- Display DK2 driver version on About dialog.
- Fix issues with Link Type and User Defined option on Watch View / Allow CVW to properly set this.
- Add VisObj variables for Override Propagation / Stats.
Release 7.10.1.7 (July/2021)
The following changes have been made in this release:
- Fix DPI issue on Watch Window.
- Make fonts consistent on top and bottom trees of Watch Window.
- Fix drawing glitch when clicking "Modify Watches..." on Watch Window.
Release 7.10.1.6 (July/2021)
The following changes have been made in this release:
- Fix HANDLE leak in Map View when zooming/panning map when using Direct2D.
- Fix issues loading a TXT format file when using Dynamic Links.
- Revise and improve command line interface:
Options are now:
-x Close Visualyse at End
-s Save SIM file at End
-c Close SIM file at End
-r Run SIM non-interactively - Improve logic for handling “missing” values when loading old TXT files.
Release 7.10.1.5 (July/2021)
The following changes have been made in this release:
- Update alpha PC algorithm to allow use of minimum power.
Release 7.10.1.4 (June/2021)
The following changes have been made in this release:
- Include M.2101 power control algorithm.
- Fix issue in M.2101 extended gain pattern.
- Update M.2101 gain pattern dialog with tilt units.
Release 7.10.1.3 (June/2021)
The following changes have been made in this release:
- Include enhanced M.2101 gain pattern.
- Improve start-up time.
- Add implementation of ITU-R F.699-8, ITU-R F.1245-3.
- Add new “Extra Clutter Model” to Extra Models. Details in Technical Annex.
Release 7.10.1.2 (June/2021)
The following changes have been made in this release:
- Resolve issue where nan can be returned from 528-4 implementation.
Release 7.10.1.1 (June/2021)
The following changes have been made in this release:
- Fix issue with F.1336-5 implementation.
- Add option to have service area define variable with shape sixth of hexagon with inner and outer radius.
- Handle loading an old SIM file that used a Scatter Graph (make width = 0, turn on markers).
- Fix possible issue loading old SIM files created using Graphics Server.
- Handle error conditions in P.676-11, P.676-12 better.
- Resolve issue using double-click in Model View.
Release 7.10.1.0 (June/2021)
The following changes have been made to the software:
- Add V and H D/L and max scan angles.
- Handle max scan angles in beam pointing.
- Handle beam footprint for IMT gain pattern.
- Label power as power at antenna.
- Label beamwidth as half-power beamwidth.
- Update peak gain when change IMT parameters.
- Fix possible antenna/beam lock bug with SIM in which both antenna and beam are steerable.
- Fix issue with RX import tool not setting RX temperature.
- Fix DPI issue on Roll-Off Dialog.
Release 7.10.0.9 (May/2021)
The following changes have been made to the software:
- Initial public release.
Release 7.10.0.8 (May/2021)
The following changes have been made to the software:
- Add implementation of ITU-R P-676-12.
- Revise GIMS error handling for V13.
- Install newer DK2 DLL.
Release 7.10.0.7 (March/2021)
The following changes have been made to the software:
- Add F.1336-5 gain patterns including option to edit that pattern's parameters.
- Add a generic M.2101 gain pattern including option to edit that pattern's parameters.
Release 7.10.0.6 (March/2021)
The following changes have been made to the software:
- Improve speed of Watch/Model View in large SIMs.
- Add new Chart markers (Triangle, Left Triangle, Down Triangle Right, Pentagon, Hexagon, Star, Cross)
- Add UI to access number of beam points used when drawing beams on Map Views. Note: higher values will impact drawing performance.
Release 7.10.0.5 (March/2021)
The following changes have been made to the software:
- Add total throughput, calculated using equations (2) and (3) of Recommendation ITU-R S.2131, to statistics C/N and C/NI and show on results.
- Update DefVar service area to allow selection for stations to be sea only i.e., converse of land only.
Release 7.10.0.4 (March/2021)
The following changes have been made to the software:
- Add new UI / VisObj variables for code limiting PMax in P.618.
Release 7.10.0.3 (March/2021)
The following changes have been made to the software:
- Improve way min Gain / max Gain is calculated in Polar Plot / Line Graph (improves display of lower limit).
Release 7.10.0.2 (March/2021)
The following changes have been made to the software:
- Don’t theme built in dialogs.
- Try to improve startup speed by optimising locale setting.
- Fix DPI issues on font used in some dialogs in non-western locales.
Release 7.10.0.1 (March/2021)
The following changes have been made to the software:
- Fix possible threading issue when using Area Analysis and ITU ShapedBM.
- When loading old files ensure graph legends are in a similar position.
- Fix DPI issues on Contour Beam dialog.
Release 7.10.0.0 (March/2021)
The following features have been added to the software:
High DPI
Visualyse 7 now supports high DPI displays. Improvements have been made to the Toolbar Icons, Map View, Path Profile View, Station Icons, Graphing Controls. Full details of any major changes are in the User Guides.
ITU-R Recommendations
Visualyse 7 now supports ITU-R P.453-14, ITU-R P.526-15, ITU-R P.528-4, ITU-R P.530-17, ITU-R P.618-13, ITU-R P.676-11, ITU-R P.836-6, ITU-R P.837-7, ITU-R P.840-8, ITU-R P.1510-1, ITU-R P.2001-3.
Further recommendation updates will be provided in upcoming maintenance releases.
ITU-R P.530
It is now possible to select the revision of ITU-R P.453 that ITU-P.530 uses.
It is also now possible to select the revision of ITU-R P.837, ITU-R P.838 and ITU-R P.839 that ITU-R P.530 (Rain) uses.
ITU-R P.618
It is now possible to select the revision of ITU-R P.839 that ITU-P.618 uses.
ITU-R P.676
It is now possible to select the revision of ITU-R P.836, ITU-R P.1510 that ITU-R P.676 uses.
ITU-R P 840
It is now possible to randomise the Probability value.
Visualyse 7 x64
Visualyse 7 is now available in a 64-bit version. This can be useful in scenarios where the existing 32-bit version used a lot of RAM when performing the analysis. Note: a working installation of the x64 Access Database Engine is required to use this version with the ITU databases.
The following other features have been added:
- Handle resize events better in the various Import dialogs.
- Rename ITU-R P.CLUTTER to ITU-R Rec. P.2108.
- Rename ITU-R P.BEL to ITU-R Rec. P.2109.
- If using IMT antenna turn on Electronically Steerable,
- Improve speed when loading from SRS.
- Don’t send SIM updates when adding logs.
- Fix potential issues displaying 3D/Mercator views when using low powered graphics cards.
- General performance improvements.
- Add stars overlay on 3D View
- Resolve various drawing issues on 3D View.
- Add setting to save SIM at end of run.
- Add settings to control various aspects of the Frequency View drawing.
Release < 7.10.0.0
The Maintenance History document for versions prior to V7.10.0.0 can be found at https://www.transfinite.com/MaintenanceRelease/Visualyse_Pre_V7_10_MaintenanceHistory.pdf