Non-GSO Satellites
This section contains the following examples:
- Non-GSO Satellites
- Data relay satellite end to end route with handover
- Galileo with HEO overlay
- GSO to non-GSO Area Analysis
- HEO into GSO DL at Ku band
- MSS Feeder links with spot beams
- Non-GSO MSS and Galileo
- PFD at GSO from NGSO MSS Feeder link
- Teledesic & Celestri with constellation avoidance
- Teledesic 840 satellite constellation
Data relay satellite end to end route with handover
| Action: | Run simulation |
| Modules used: | None |
| Terrain regions: | None |
| Frequency band: | Ka |
| Station types: | GSO Satellite, Non-GSO Satellite, Earth Stations |
| Propagation models: | Free space, ITU-R Rec.P.676 |
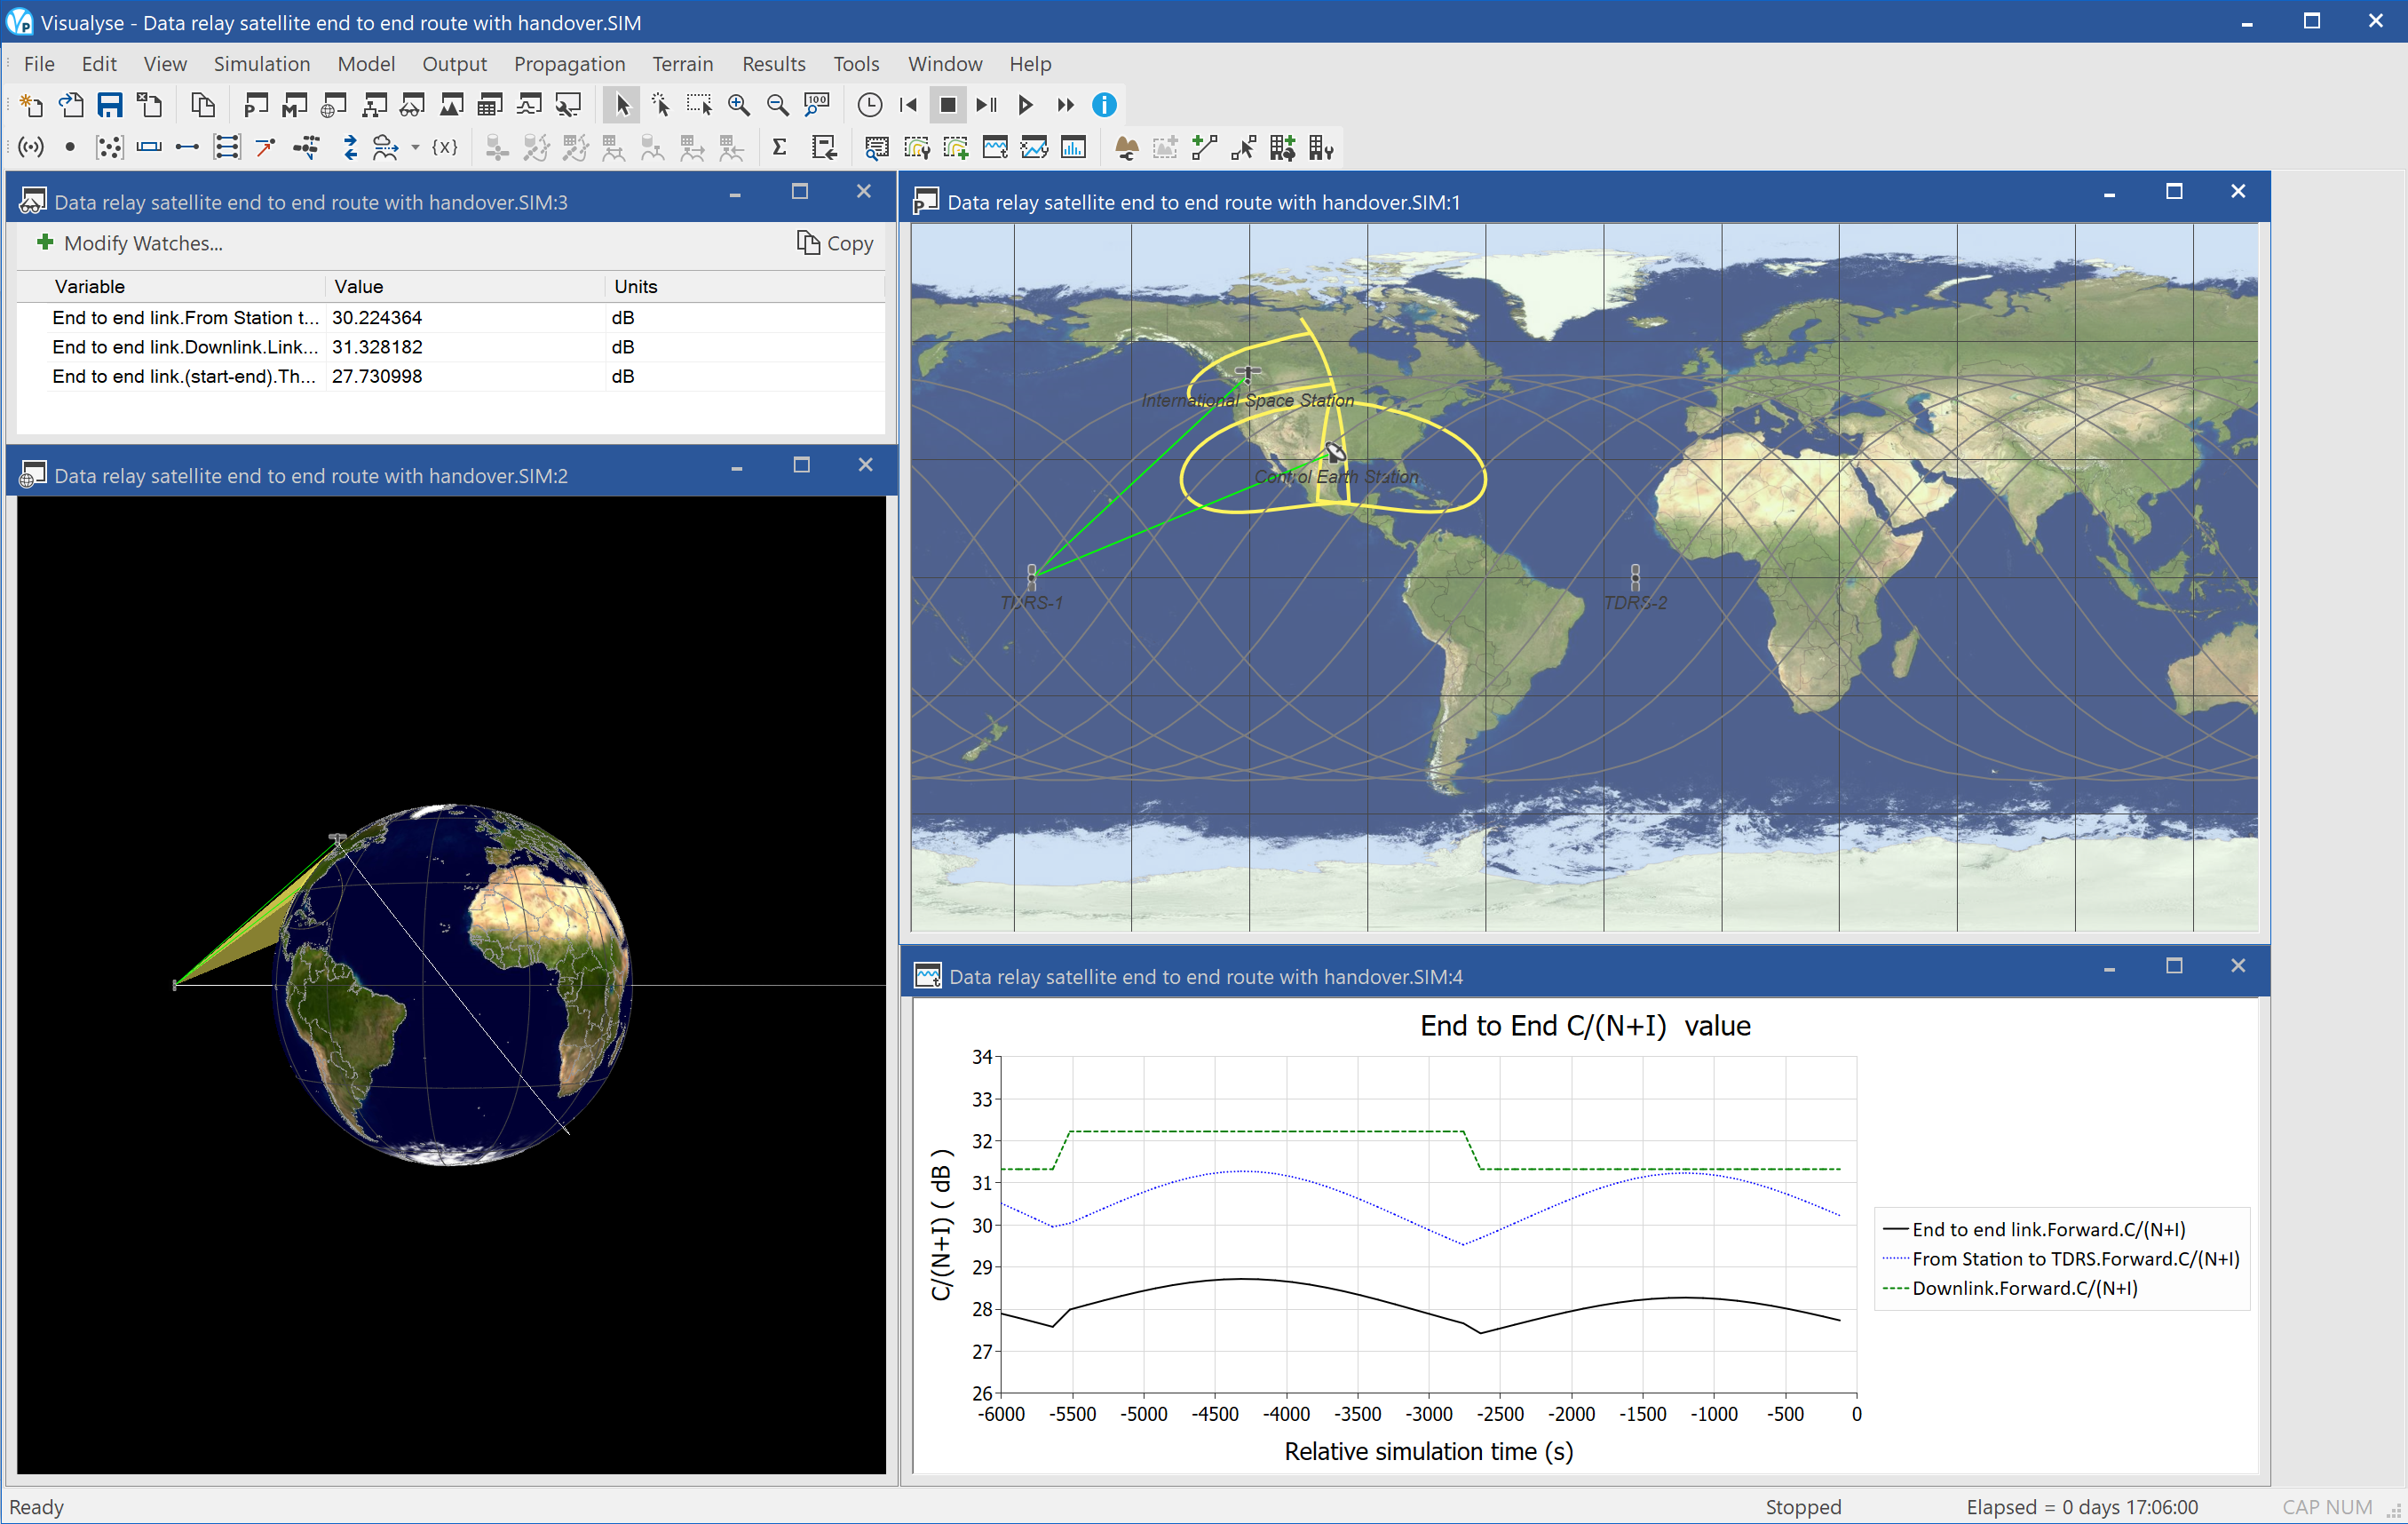
This example shows an end to end communications link from a non-GSO satellite (in this case the international space station) to its control centre, routing via one of two data relay satellites.
The space station selects which of the two tracking satellites to use and then the link down to the earth station starts at the end point of that link. As the space station moves the tracking satellite to use changes.
Visualyse Professional derives the C/N for each of the individual hops and also the end to end link assuming a bent-pipe or non-regenerative payload so that the overall performance can be calculated using thermal addition. The earth-space paths include the attenuation due to atmospheric gases in ITU-R Rec.P.676.
The simulation is configured with four views open:
- Plate Carrée map view (top right) showing the location of the two tracking satellites, the ground station, the current location of the space station, the ground track of the space station, and the footprints of the various beams.
- 3D view (bottom left) showing the view from one of the tracking satellites of the world, the space station, its orbit, the other tracking satellite, and the ground station.
- Quick graph (bottom right) showing how the C/N of each of the links and of the end to end link varies with time
- Watch window (top left) showing the value of each of the C/Ns shown in the Quick graph.
Galileo with HEO overlay
| Action: | Run Simulation |
| Modules used: | None |
| Terrain regions: | None |
| Frequency band: | S |
| Station types: | GSO Satellite, Non-GSO Satellite, Earth Stations |
| Propagation models: | Free space |
This example file shows analysis of the increase in availability for navigation services of using an overlay from a constellation of satellites in Highly Eccentric Orbits (HEO).
One objective of navigation services is to be able to provide accurate location within urban areas. However in cities there are likely to be tall buildings that obscure the view of the sky and hence reduce the number of satellites that can be used to gain a fix. This effect can be compensated by adding more satellites to the constellation, but this can be inefficient as any coverage improvement is by nature global.
One possible solution that can bring significant coverage improvements without requiring large numbers of additional satellites is to provide an overlay using a HEO constellation.
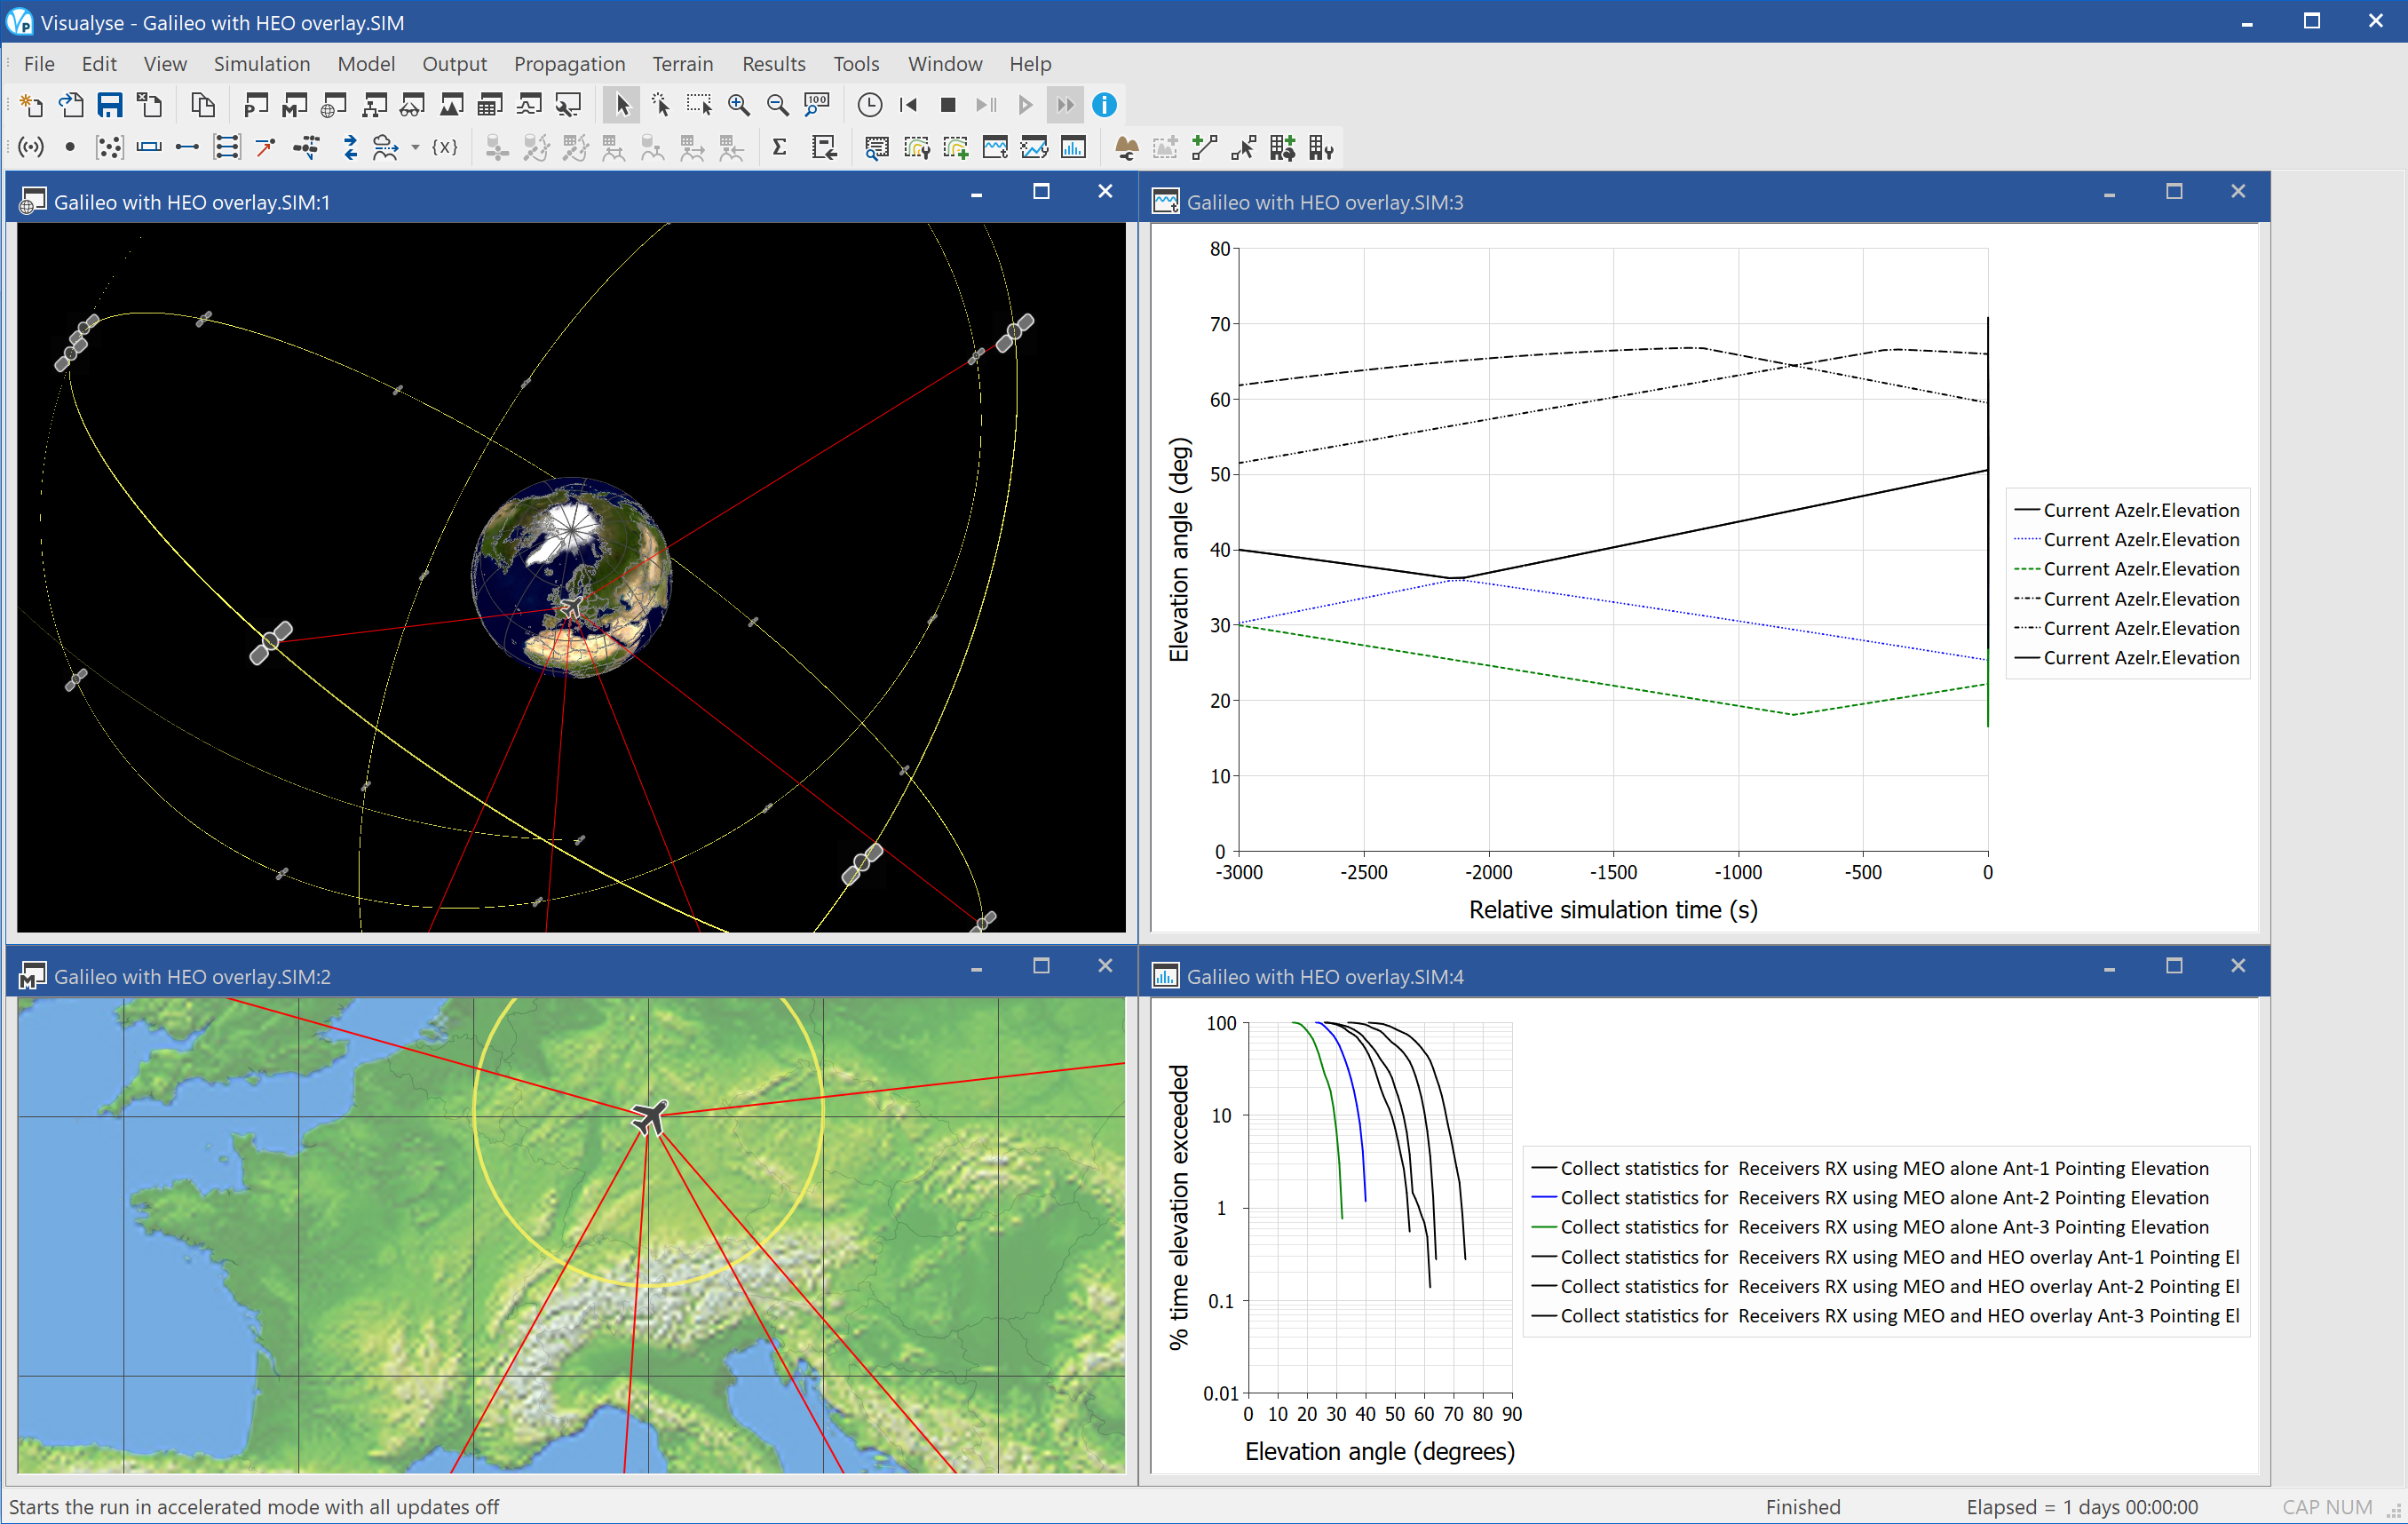
The screen shot above shows one such analysis, with four windows open:
- 3D view (top left), showing a Galileo like constellation of 27 satellites in circular orbit plus 4 in a HEO constellation, the ground tracks, and location of test point. The view point is that of one of the HEO satellites, so will change during the simulation as the satellite moves
- Mercator view (bottom left) showing the test point location in more detail and the various links to highest N satellites
- Quick graph (top right) showing how the elevation angle of the tracked satellite varies with time
- Statistics graph (bottom right) showing the cumulative distribution function of the links to the four highest circular orbit satellites and two highest HEO satellites
It can be seen that both of the two highest HEO satellites are typically better than the 2nd highest circular orbit constellation satellite. Hence using a HEO overlay would significantly improve the statistics of the best four satellites required to make a fix.
GSO to non-GSO Area Analysis
| Action: | Select 3D view and rotate Earth |
| Modules used: | None |
| Terrain regions: | None |
| Frequency band: | Ka |
| Station types: | GSO Satellite, Non-GSO Satellite, Earth Stations |
| Propagation models: | Free space, ITU-R Rec.P.676 |
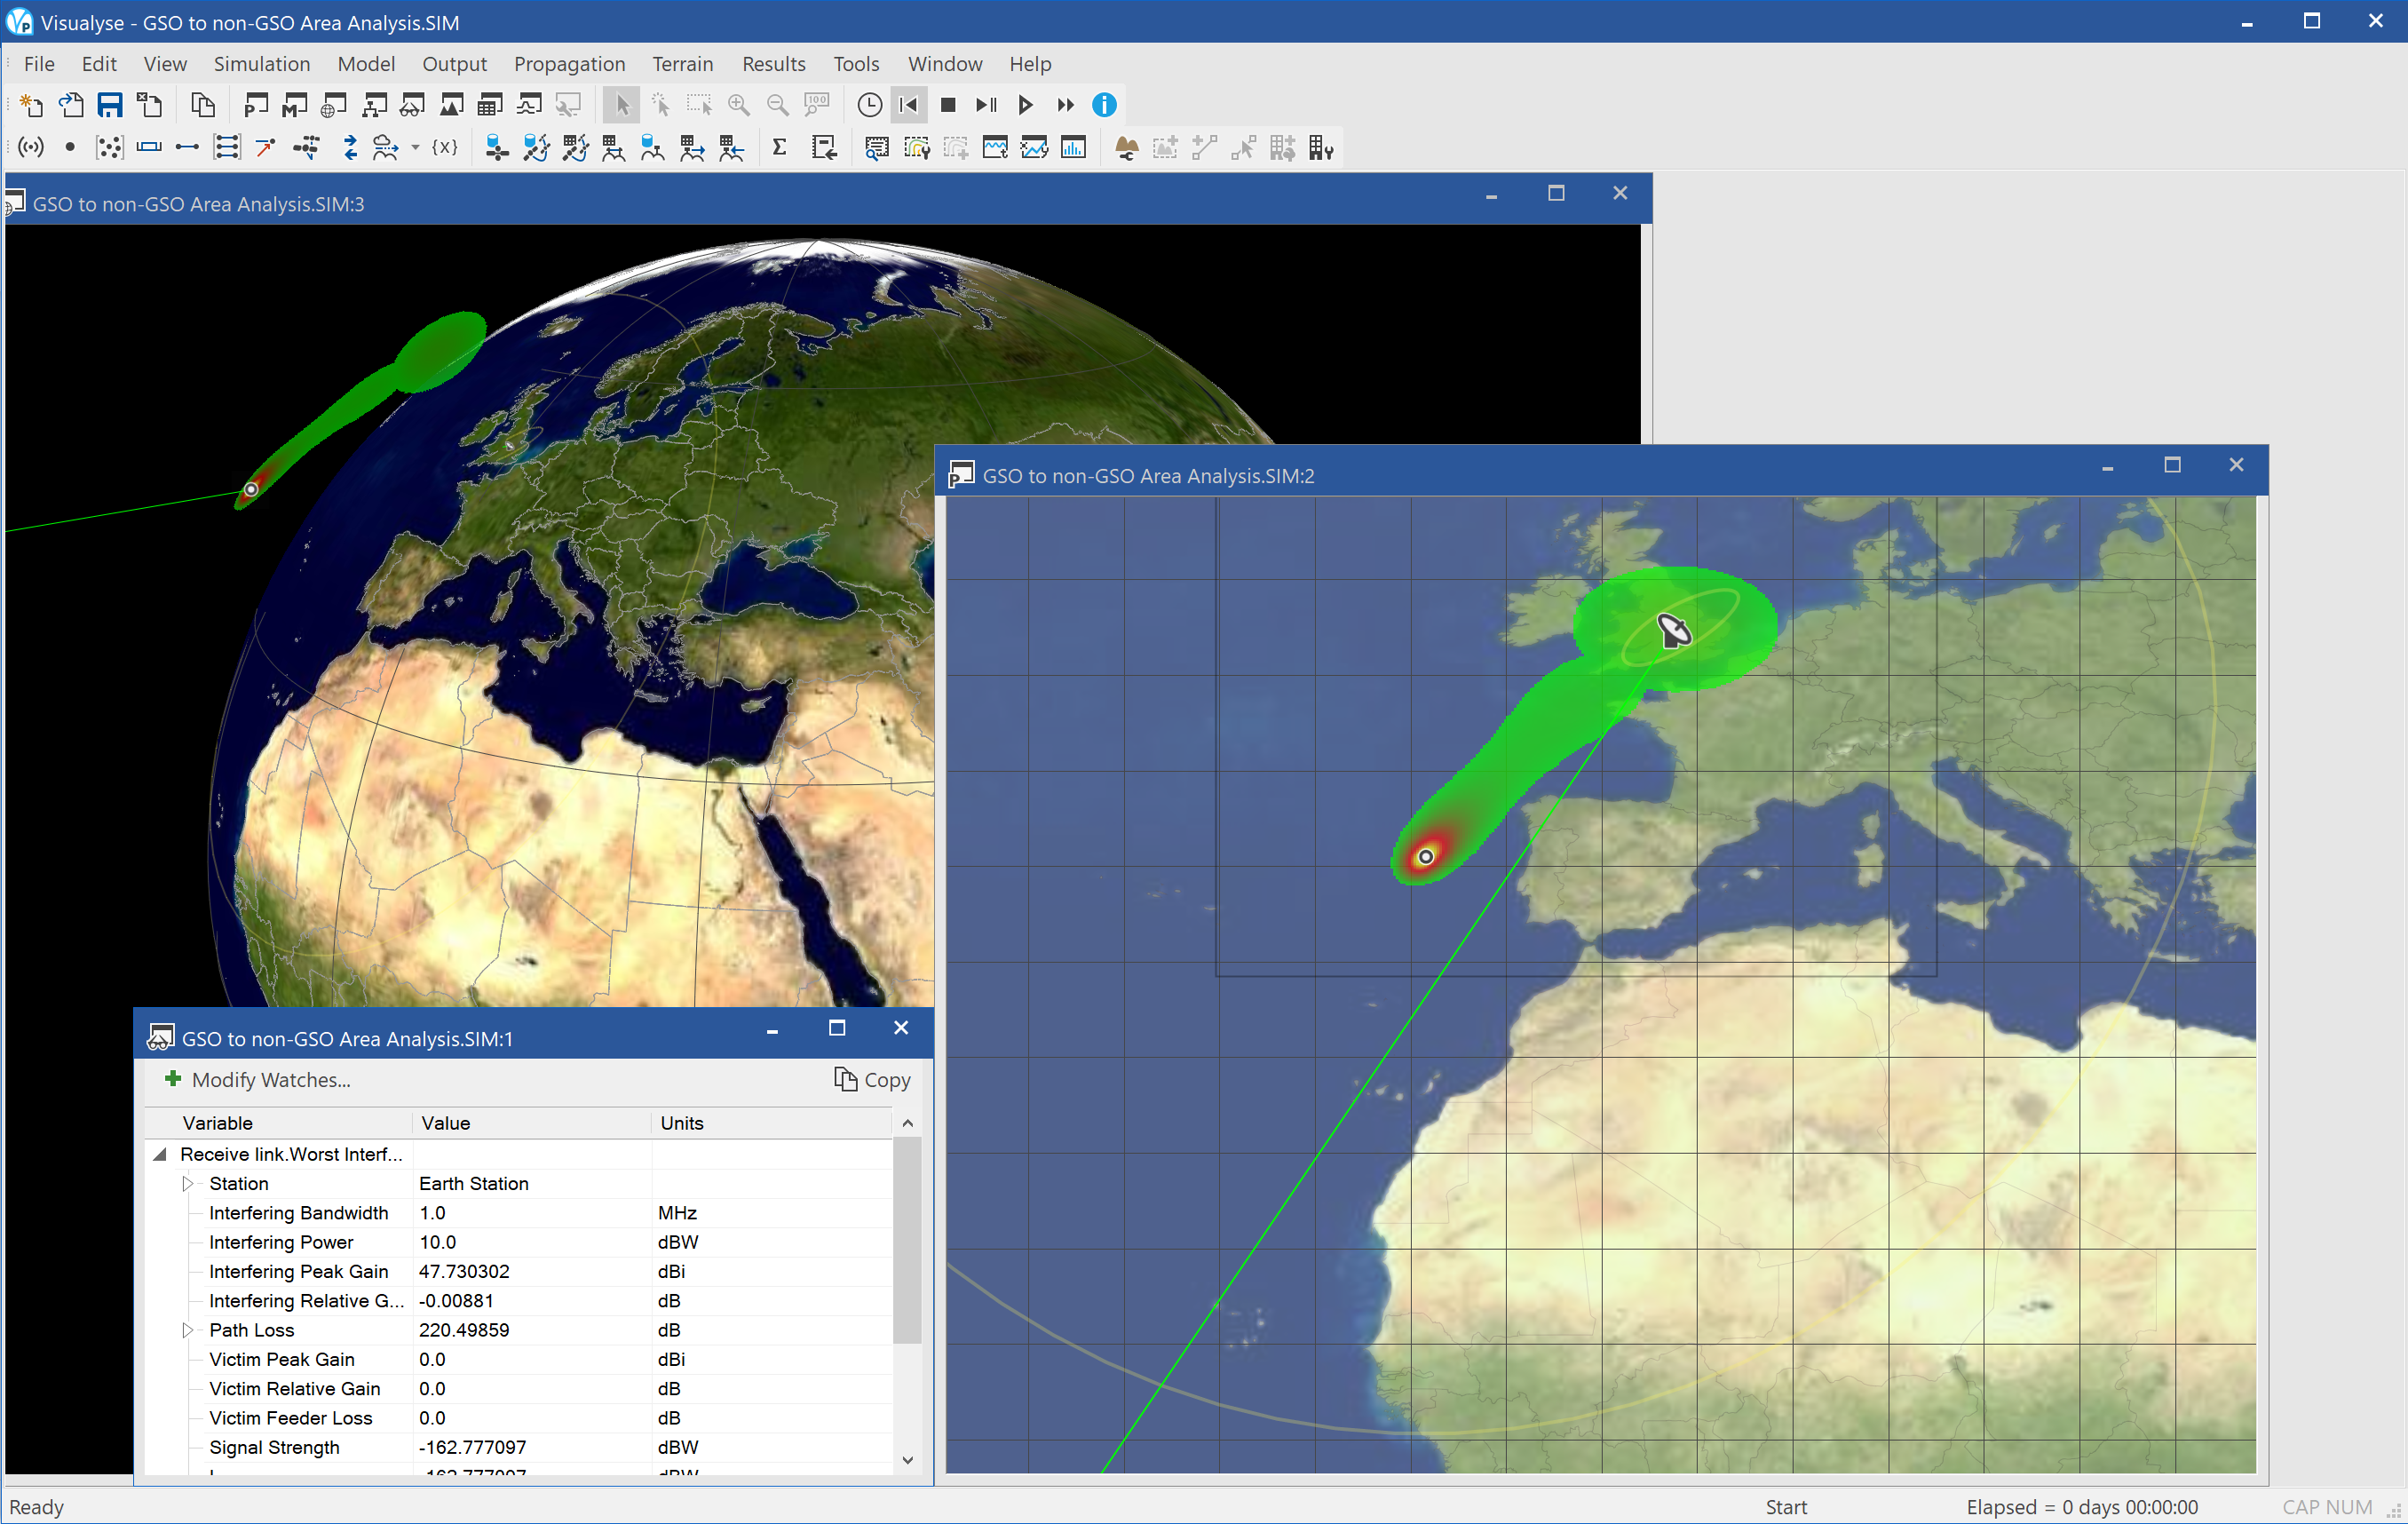
This example shows an analysis of where a non-GSO satellite would suffer interference from a GSO network’s uplink. An earth station in the UK is transmitting to a GSO satellite on the same frequency as a non-GSO network. The question is where about in the non-GSO satellite’s orbit it would suffer interference.
In this simulation a “floating” Area Analysis has been created with a test point at the same height as the non-GSO satellite. The PFD generated by the earth station as measured at the non-GSO satellite is then displayed with colour scheme that shows the intensity. Two areas can be seen:
- in the main beam of the earth station just to the left of Spain
- over the UK, nearby to the earth station from side-lobe interference
The simulation is configured with three views open:
- Plate Carrée view (right) showing the satellite, the earth station, the test point (small circle), the beams and the area analysis
- Watch window (bottom left) showing the calculation of the interference into an isotropic receiver at the test point
- 3D view (top left, behind the other two windows), showing the view from space including the Area Analysis.
If you select the 3D view and then rotate the Earth by holding the left mouse button down and moving the mouse you can see how the Area Analysis floats in space.
HEO into GSO DL at Ku band
| Action: | Run simulation |
| Modules used: | None |
| Terrain regions: | None |
| Frequency band: | Ku |
| Station types: | GSO Satellite, Non-GSO Satellite, Earth Station |
| Propagation models: | Free space |
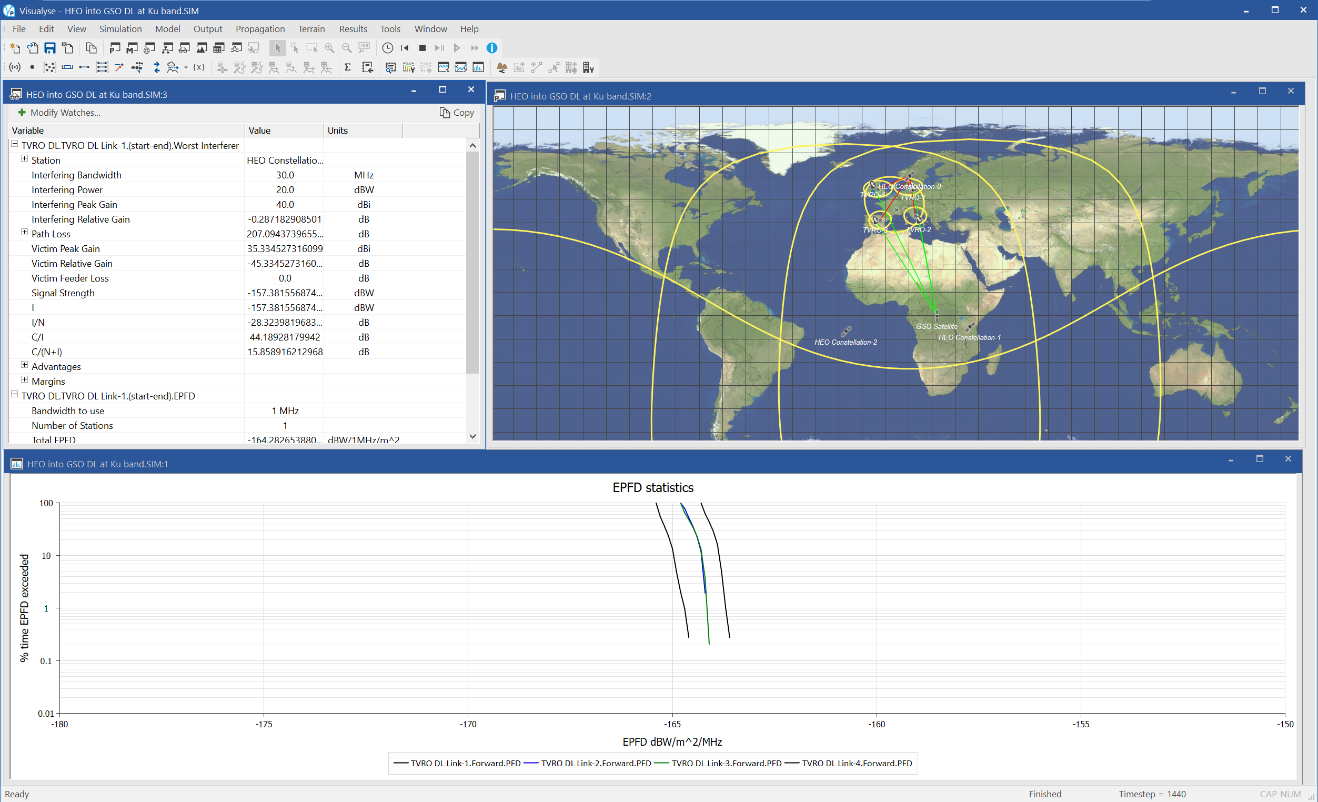
This example shows the calculation of Equivalent Power Flux Density (EPFD) from a constellation of satellites in Highly Elliptical Orbit (HEO) into a GSO satellite downlink.
The GSO satellite is providing satellite TV services to small aperture receive dishes – here modelled as 60cm dishes using the gain pattern in ITU-R Rec.S.465. It is operating in Ku band where transmissions from non-GSO networks, including HEO, must meet the EPFD limits in Article 22.2 of the Radio Regulations. In this case the limit is -160 dBW/m^2/40 kHz, or -174 dBW/m^2/MHz.
A HEO service proposes to operate co-frequency with the GSO network providing data services to VSATs using a series of spot beams to cover its main markets. The question is whether it would meet its requirements under 22.2.
The simulation has four test points at various extrema of the GSO satellite downlink, and constellation was built using the HEO Wizard with a tracking strategy to select the active satellite.
The screen shot above shows three windows:
- Plate Carrée view (right) showing the locations of the satellites, Earth stations, links, beams, and the ground tracks of the HEO satellites.
- Watch window (top left) showing the link budget from the HEO satellites into one of the test TV downlinks.
- Statistics graph (bottom left) showing the cumulative distribution function of the EPFD.
MSS Feeder links with spot beams
| Action: | Run simulation |
| Modules used: | None |
| Terrain regions: | None |
| Frequency band: | Ka |
| Station types: | Non-GSO Satellite, Earth Station |
| Propagation models: | Free space |
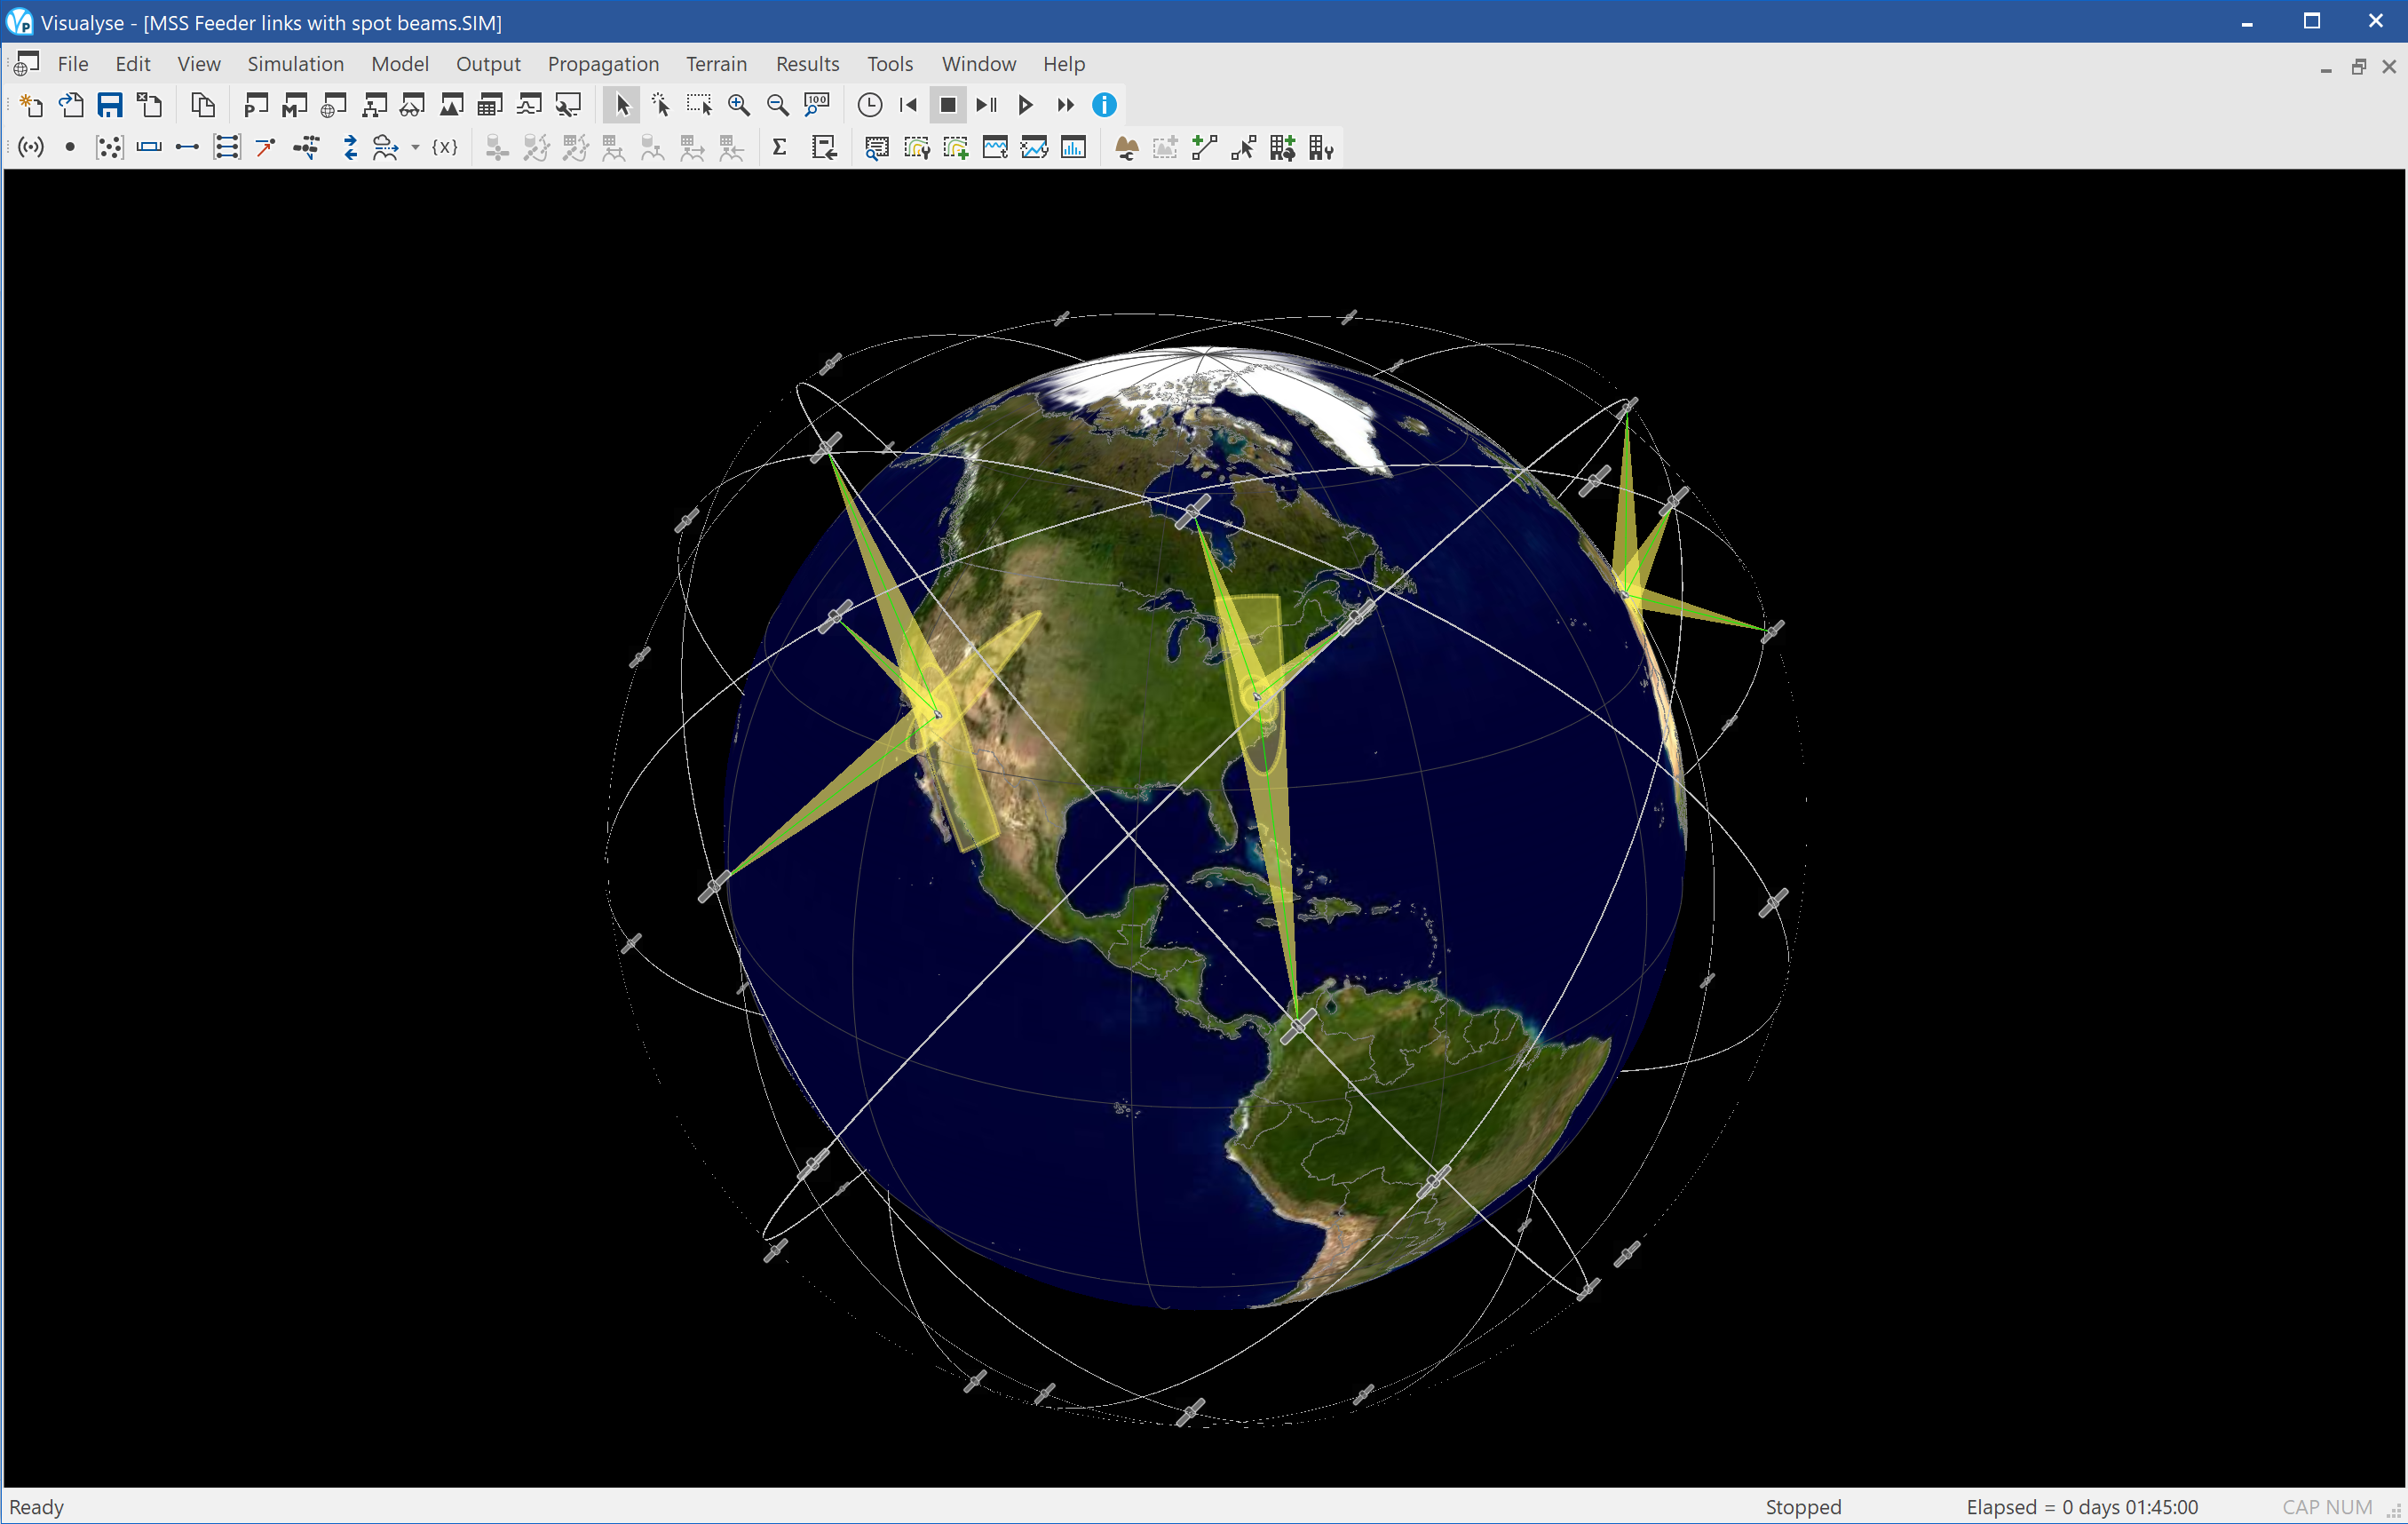
This example file shows a non-GSO constellation using steerable spot beams to provide feeder links with a number of gateway Earth Stations.
The gateways select the satellite using one of the pre-defined tracking strategies, and the satellites are configured with antennas that can generate electronically steerable beams as required by the link.
The simulation has been configured with a single 3D view showing the satellites, the beams, the gateway Earth Stations, and the satellite tracks. The view is fixed in inertial space, so we can see the rotation of the Earth below us.
Non-GSO MSS and Galileo
| Action: | Run simulation |
| Modules used: | None |
| Terrain regions: | None |
| Frequency band: | S |
| Station types: | Non-GSO Satellite, Mobile, Aeronautical |
| Propagation models: | Free space, ITU-R Rec.P.676 |
This example analysis the potential impact of introducing satellite radionavigation services such as Galileo into bands that are currently used for mobile satellite services such as Globalstar.
The motivation was to facilitate the integration of satellite navigation features into 3G enabled handsets by using adjacent frequency bands. As a primary band for 3G is the 2 500 – 2 690 MHz, there would be clear advantages in having a satellite navigation signal at the adjacent band 2 483 – 2 500 MHz, currently used for mobile satellite services (MSS). However this could raise compatibility issues.
This simulation includes two non-GSO constellations, one for the radionavigation service based upon Galileo parameters and another for the MSS service based upon Globalstar parameters. The constellations have been generated using Visualyse’s specialised wizard that takes account of the symmetry of the constellation: if actual orbit data was available in the Two-Line Element (TLE) format that could also be used.
The MSS handset is selecting the highest satellite from its constellation, while an airborne user of the satellite radionavigation services is using the tracking strategies to select the four highest elevation satellites from its constellation.
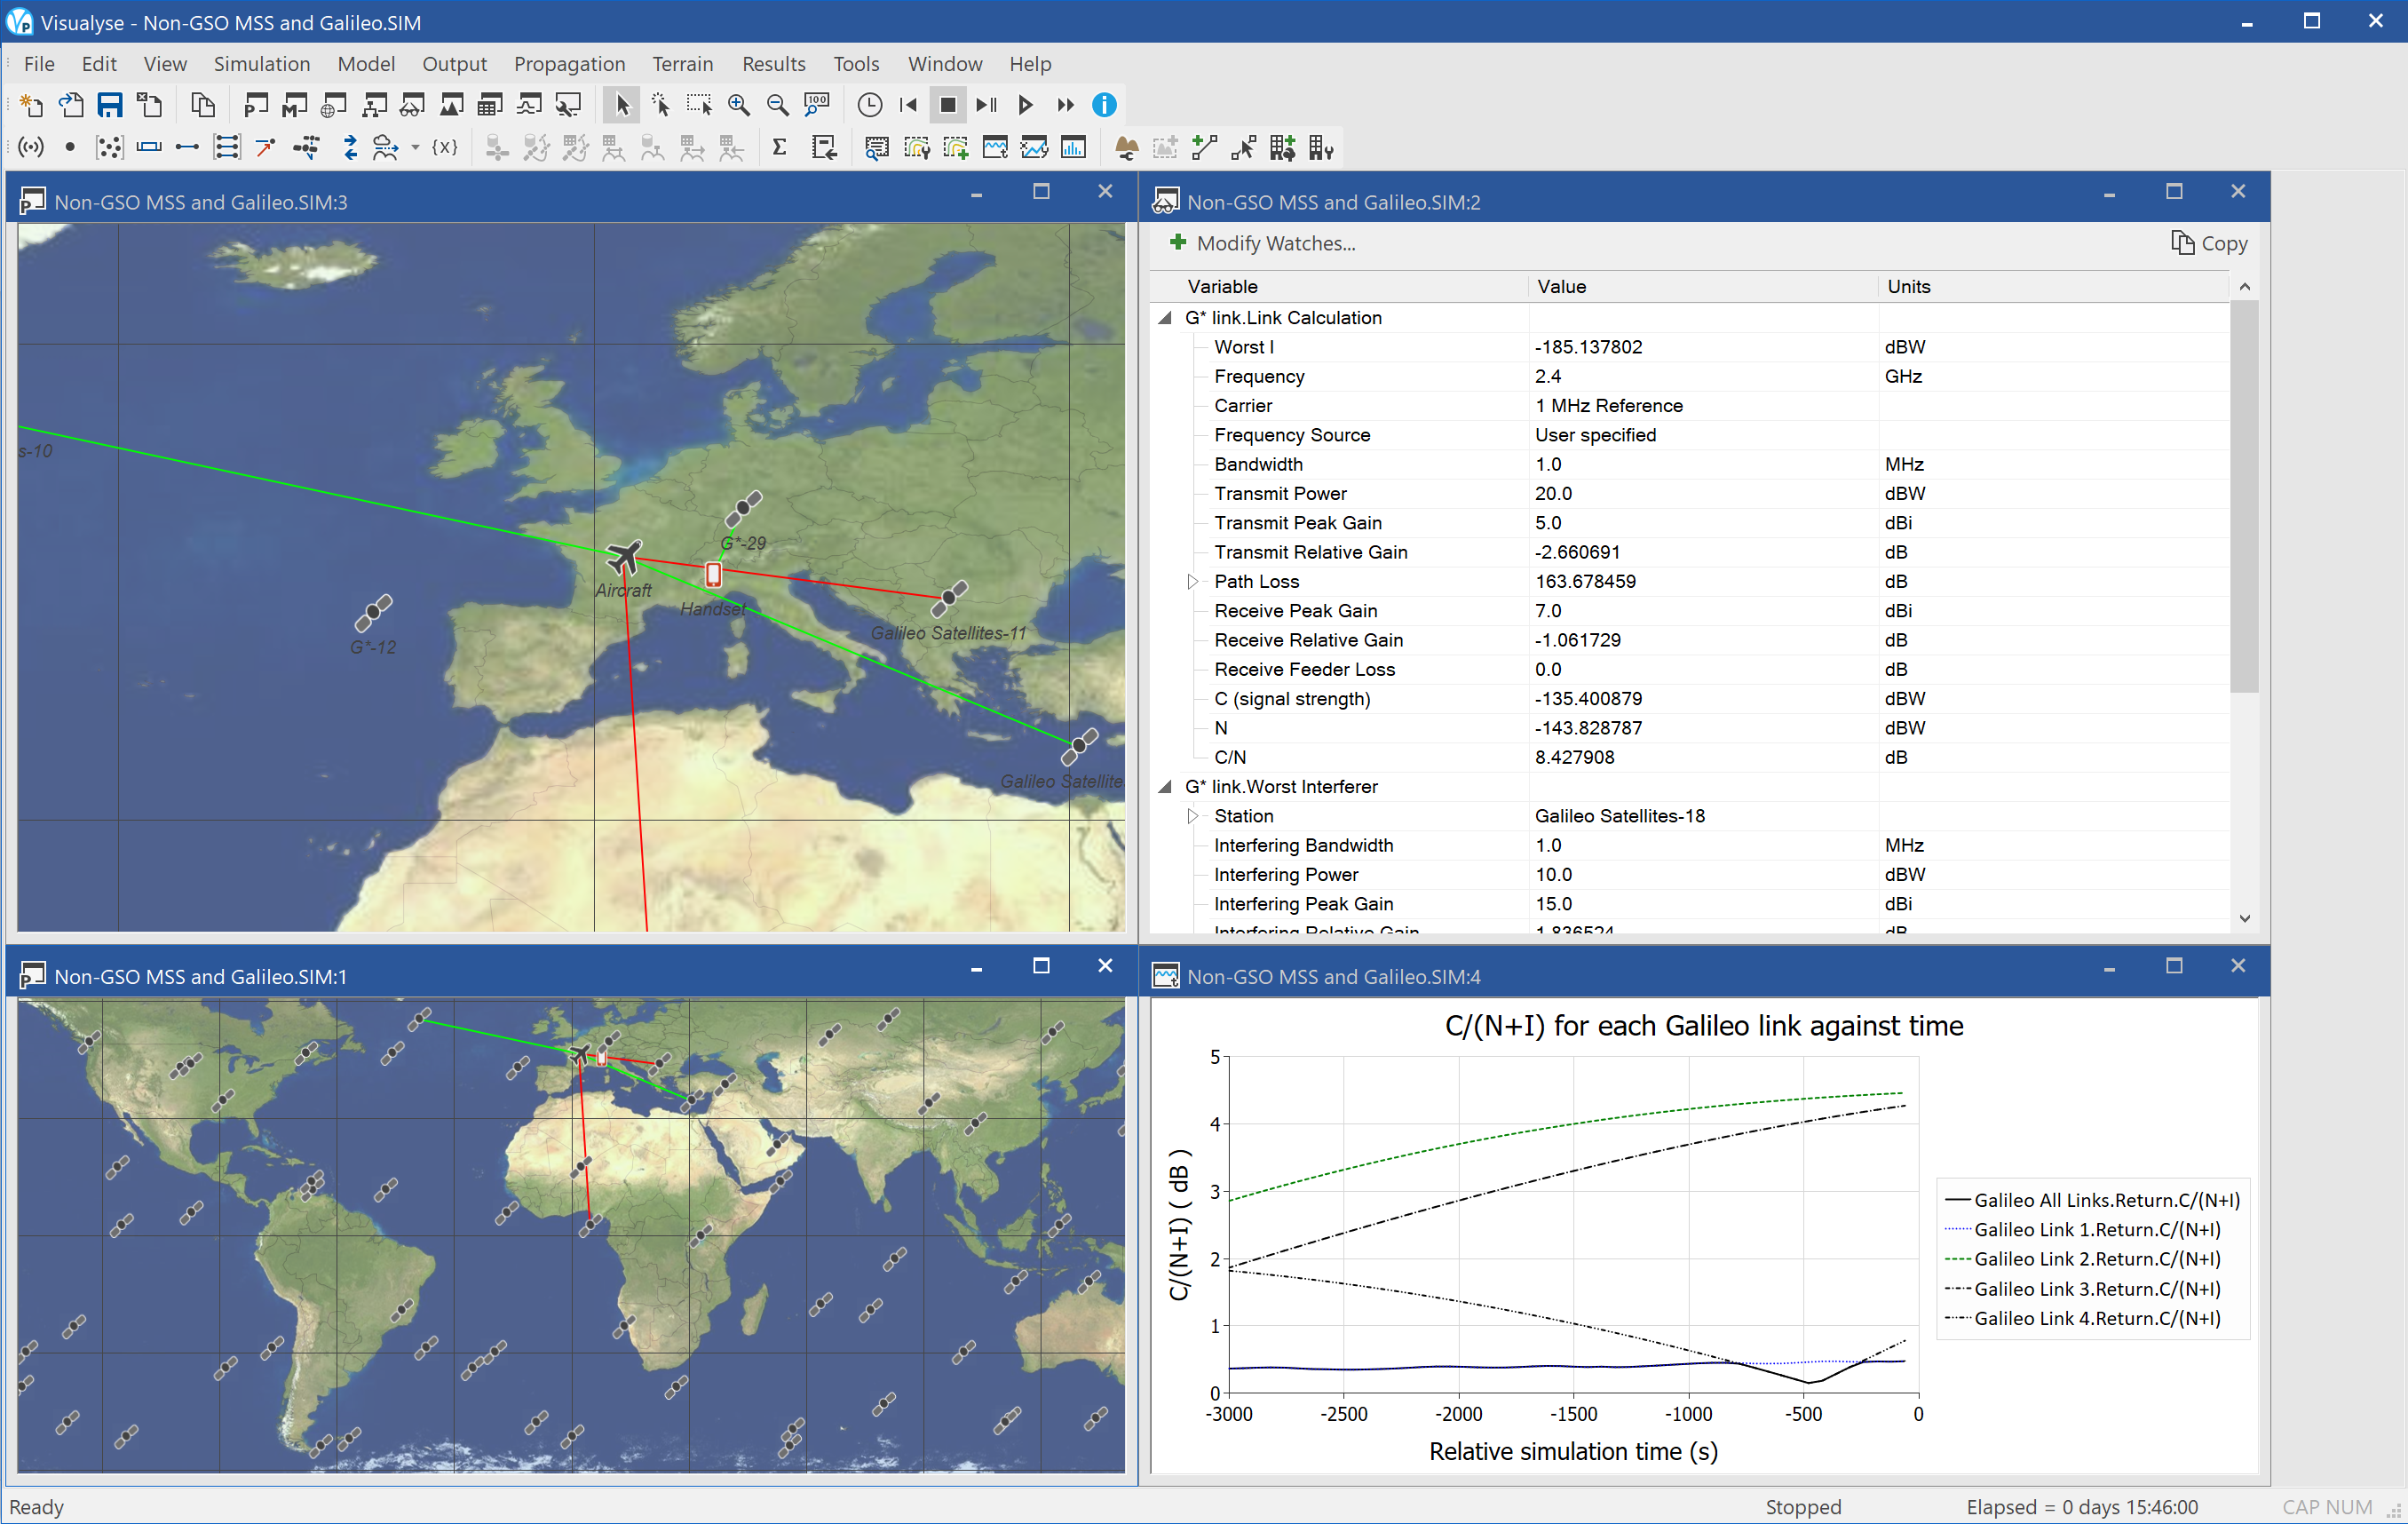
The screen shot above has been configured with four windows open:
- Plate Carrée view (top left) zoomed into Europe to show the aircraft and mobile stations and the selection of the satellite they use
- Plate Carrée view (bottom left) zoomed out to show most of the world, showing more of each constellation
- Watch window (top right) showing the wanted and worst single interferer link budget calculation for the MSS handset
- Quick graph (bottom right) showing how the C/N for the highest four elevation Galileo satellites vary with time and how a link group is used to work out the overall performance using the take-worst method.
PFD at GSO from NGSO MSS Feeder link
| Action: | Run simulation |
| Modules used: | None |
| Terrain regions: | None |
| Frequency band: | C |
| Station types: | GSO Satellite, Non-GSO Satellite, Earth Station |
| Propagation models: | Free space |
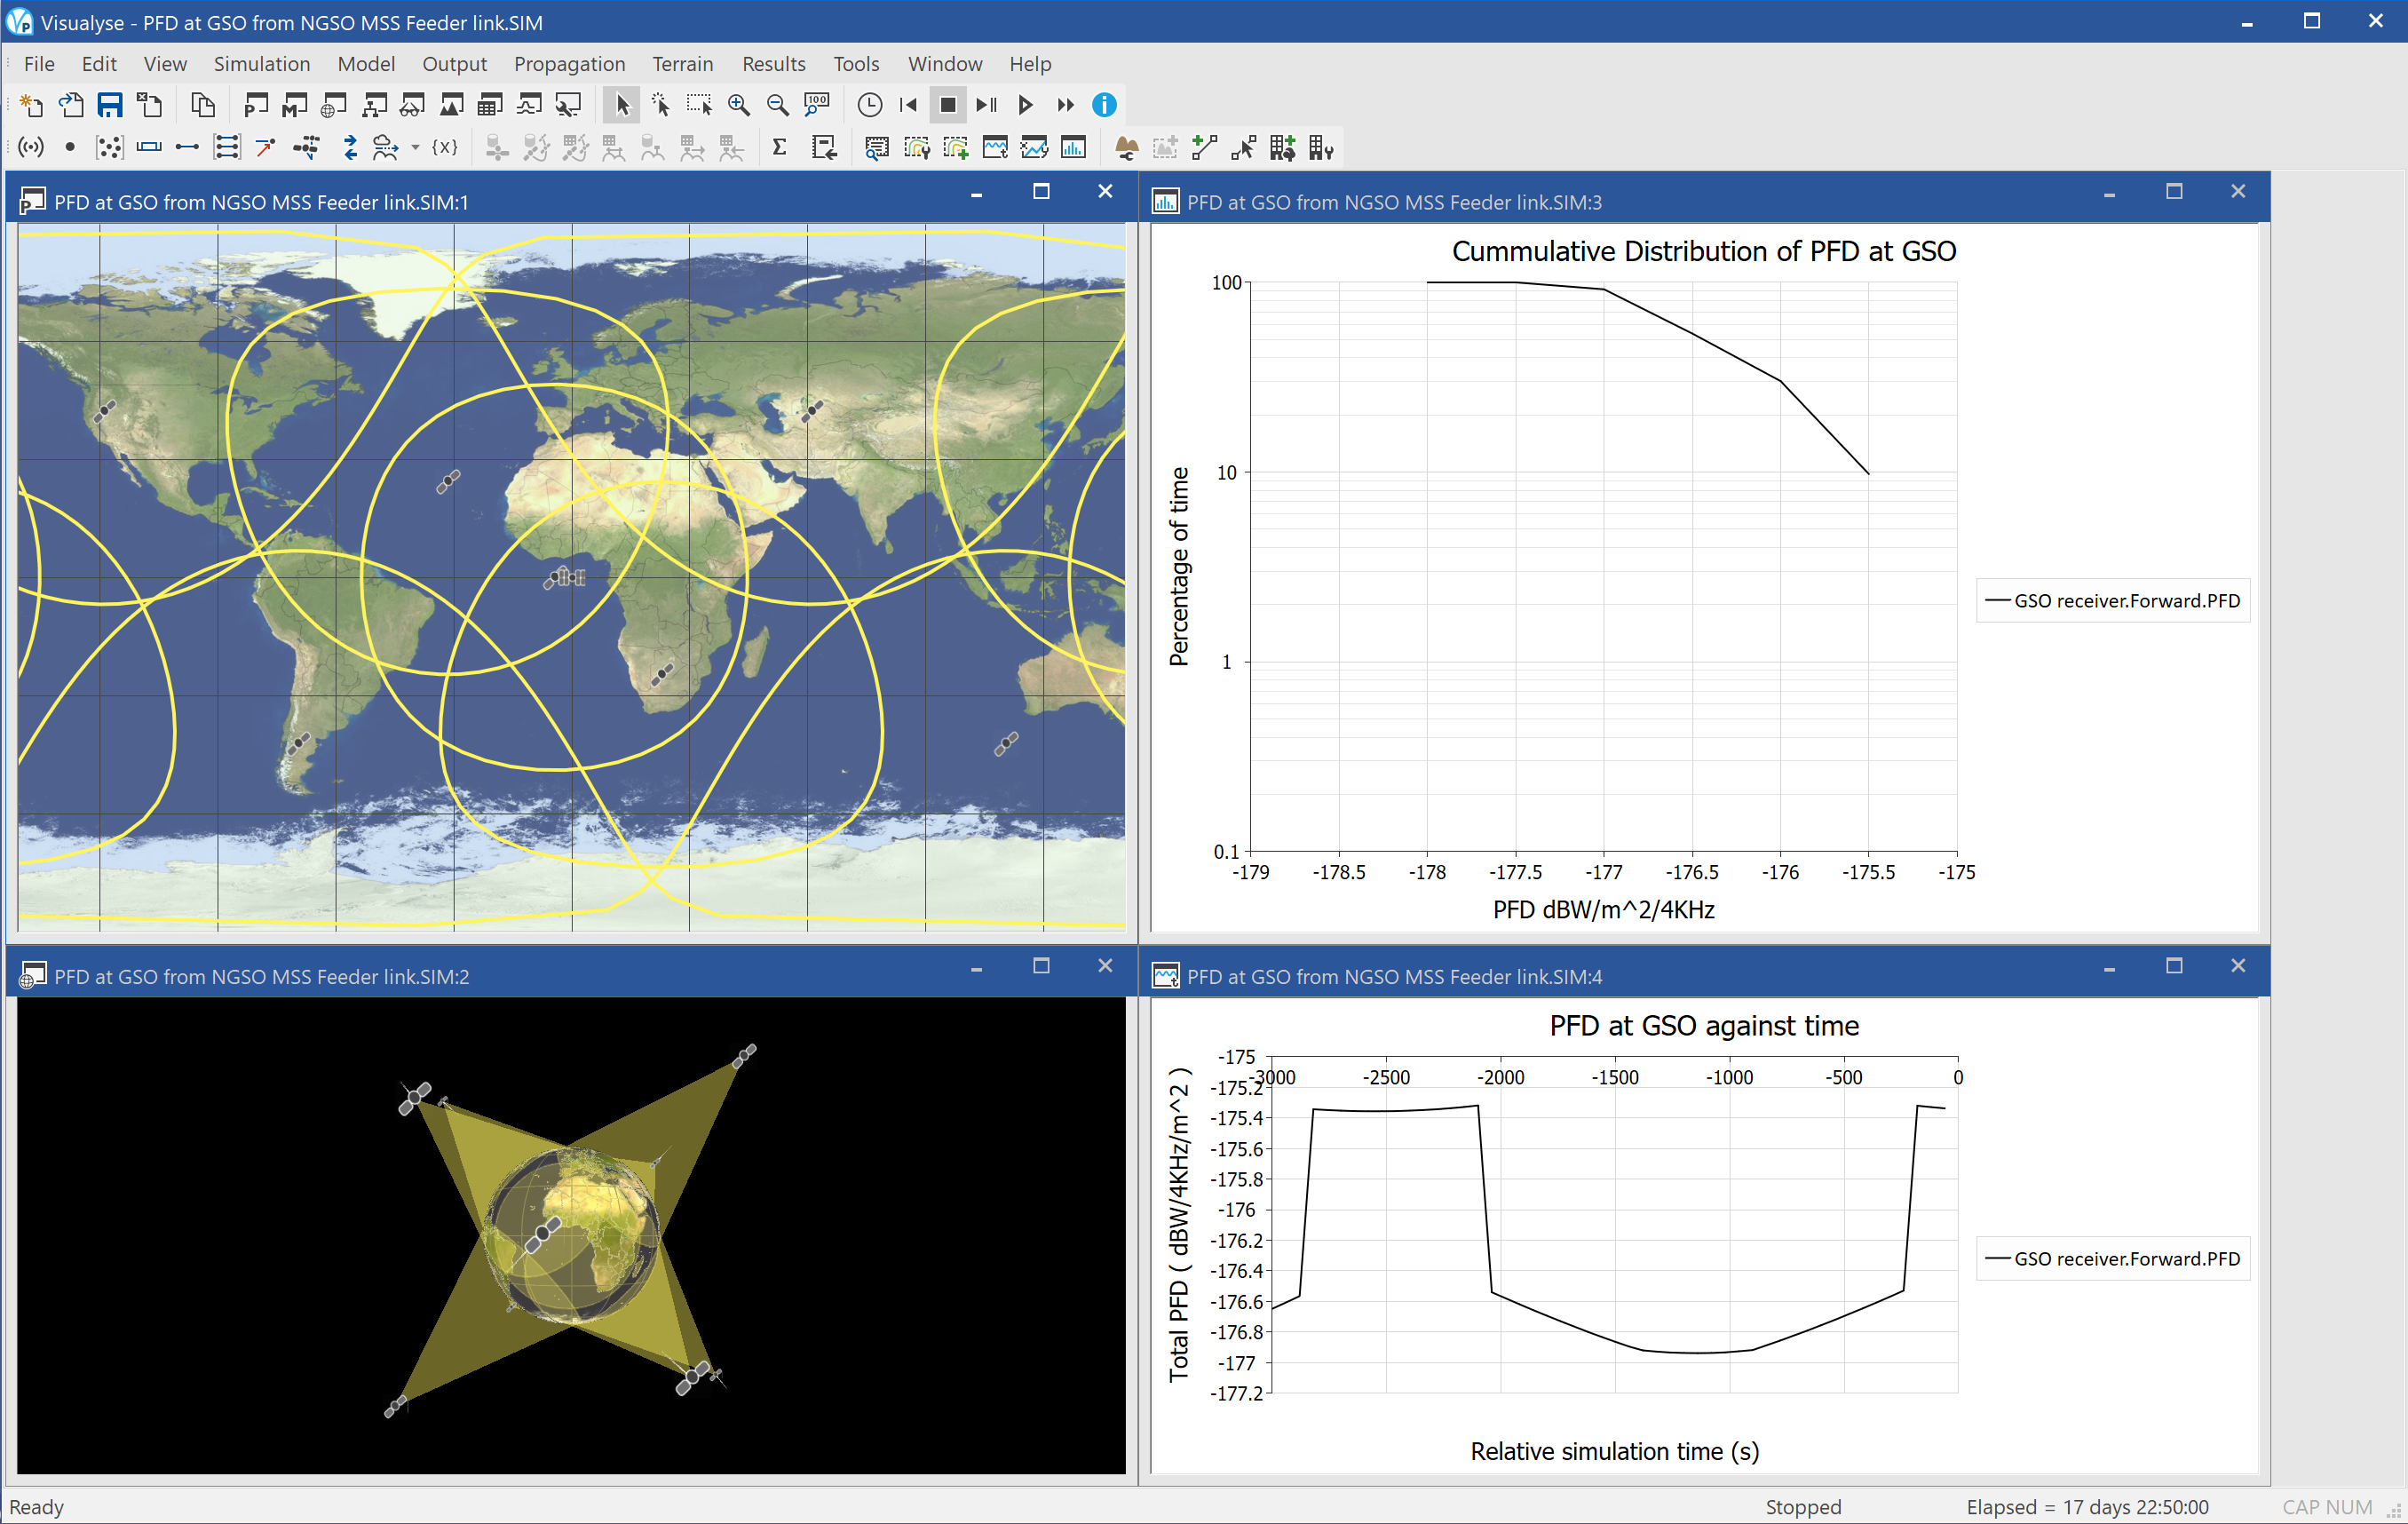
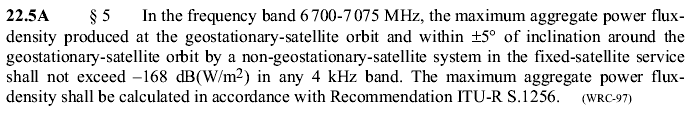
This example shows a simulation that checks whether a non-GSO network will meet the PFD levels in Article 22.5A of the Radio Regulations. These limit the PFD received at the geostationary orbit from downlinks from non-GSO MSS feeder links.
The relevant part of the Radio Regulations of 2004 is:
The simulation has been configured with four windows open:
- Plate Carrée map view (top left) showing the locations of the non-GSO satellites and their field of view, and the GSO satellite (at longitude = 0°)
- 3D view (bottom left) showing the non-GSO satellites and Earth from the perspective of the GSO satellite, with beams and satellite tracks
- Quick graph (bottom right) showing how the PFD at the GSO satellite from the non-GSO satellite downlink varies with time
- Statistics graph (top right) showing the cumulative distribution function of PFD at the GSO satellite from the non-GSO network: the key number is the maximum PFD calculated in the simulation to date which can be seen to be below the threshold of -169 dB(W/m^2) in any 4 kHz band
Teledesic & Celestri with constellation avoidance
| Action: | Run simulation |
| Modules used: | None |
| Terrain regions: | None |
| Frequency band: | Ka |
| Station types: | Non-GSO Satellite |
| Propagation models: | Free space, Rec.P.676 |
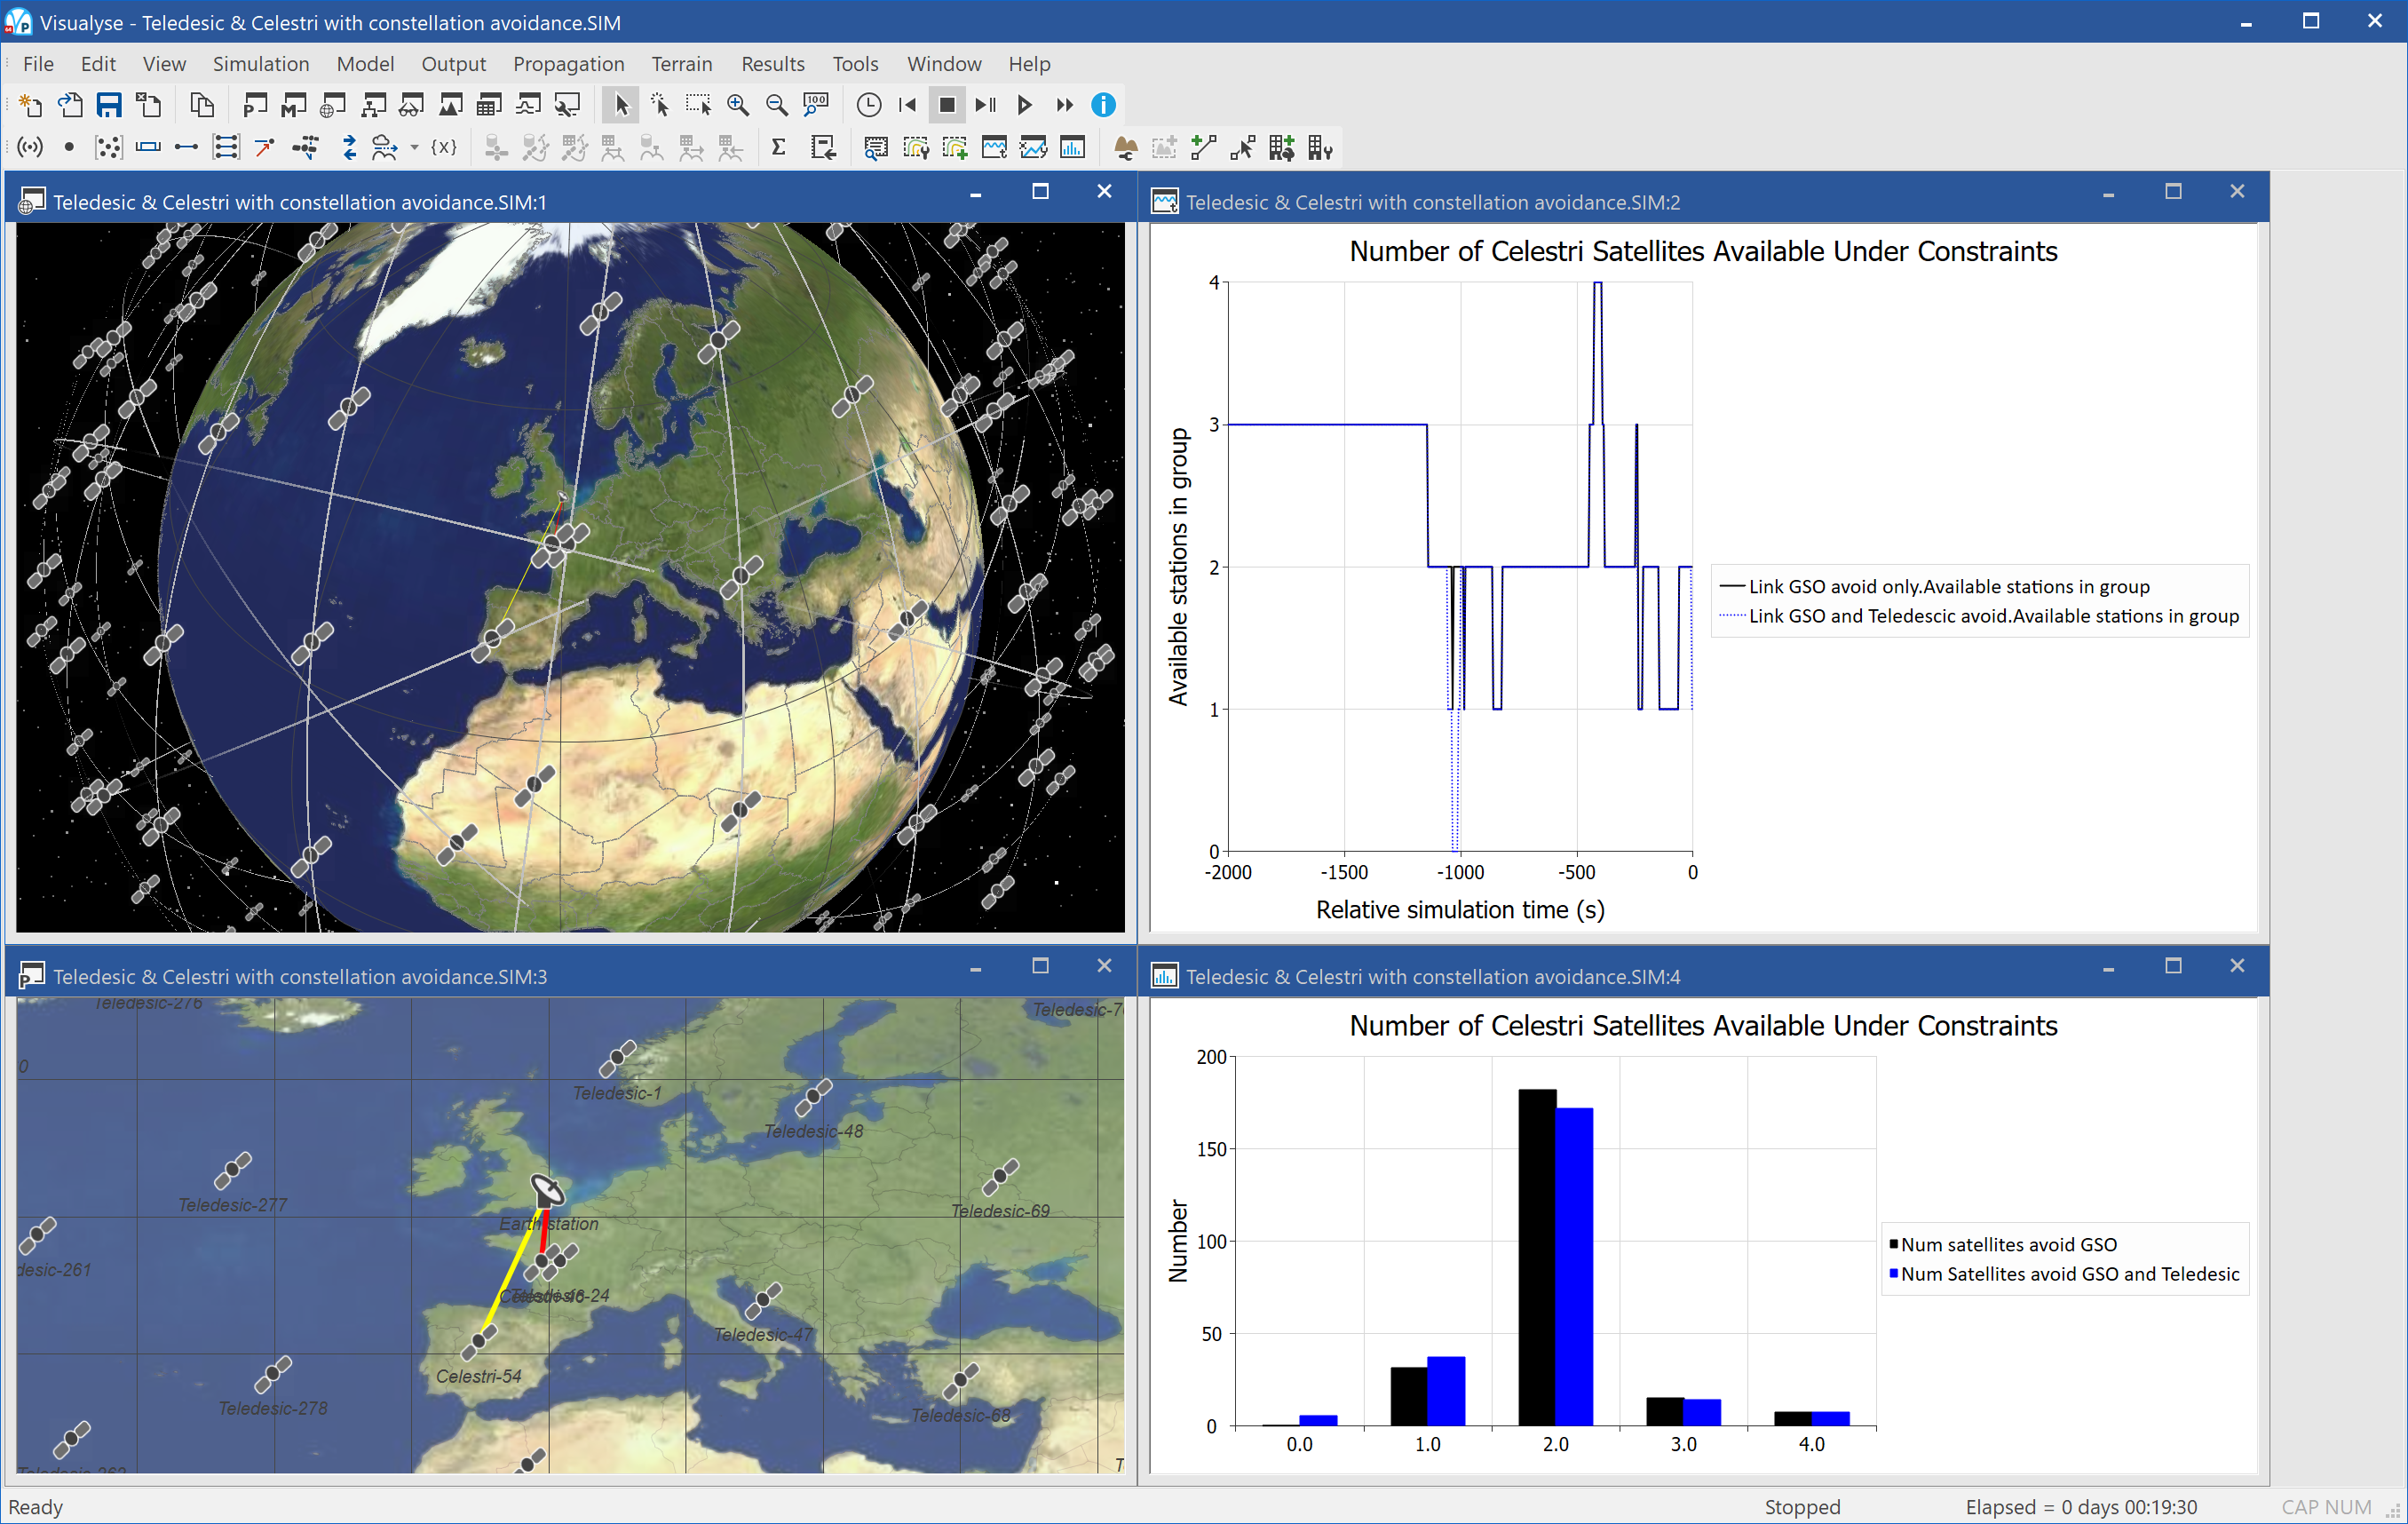
This example shows sharing between two non-GSO constellations, using tracking strategies to meet regulatory requirements and to coordinate between themselves.
Two non-GSO FSS networks are modelled in this simulation, namely the 288 satellite Teledesic configuration and Celestri. It is assumed that the Celestri network, which filed after Teledesic, must protect the other from interference. In addition, the Celestri network is assumed to need to protect the GSO arc (either due to EPFD constraints in Article 22 or actual filed networks).
One of the primary methods for a satellite network to protect another is to use pointing restrictions, which in Visualyse Professional are modelled in tracking strategies. In this example, there are two links with pointing constraints as follows:
- Link 1: point at the highest elevation satellite from those that are at least 16° above the horizon and at least 5° away from any point on the GSO arc
- Link 2: point at the highest elevation satellite from those that are at least 16° above the horizon and at least 5° away from any point on the GSO arc and at least 5° away from any of the Teledesic satellites
Link 2 therefore has more vigorous constraints: the question this simulation is addressing is the implications on this on the constellation to provide a service. By analysing the statistics of number of satellites that meet the criteria, it can be determine the service that can be provided while protecting another constellation from interference.
The simulation has the two links in different colour: most of the time they result in the earth station selecting the same satellite, but at times at which there would be an “in-line” event they diverge, with link 2 selecting a satellite that can be used without causing interference.
At some very rare times no satellite meets the criteria needed for link 2.
In the screen shot above there are four windows open:
- 3D view (top left), showing the satellites of both constellations, their tracks, the earth station, and the two links, coloured red and yellow
- Plate Carrée view (bottom left), showing the satellites of both constellations, the earth station, and the two links, coloured red and yellow
- Quick graph (top right) plotting how the number of satellites in the Celestri constellation that meets the criteria for Links 1 and 2 varies in time. Usually this is between 1 and 4, but sometimes the number of satellites that meets Link 2’s criteria is below that of Link 1, and sometimes it drops to zero
- Statistics graph (bottom right) plotting the histogram of number of satellites that meets the criteria of Links 1 and 2: it can be seen that Link 1 always has more satellites that meets its criteria and sometimes Link 2 is unable to connect.
Teledesic 840 satellite constellation
| Action: | Run simulation |
| Modules used: | None |
| Terrain regions: | None |
| Frequency band: | Ka |
| Station types: | Non-GSO Satellite |
| Propagation models: | n/a |
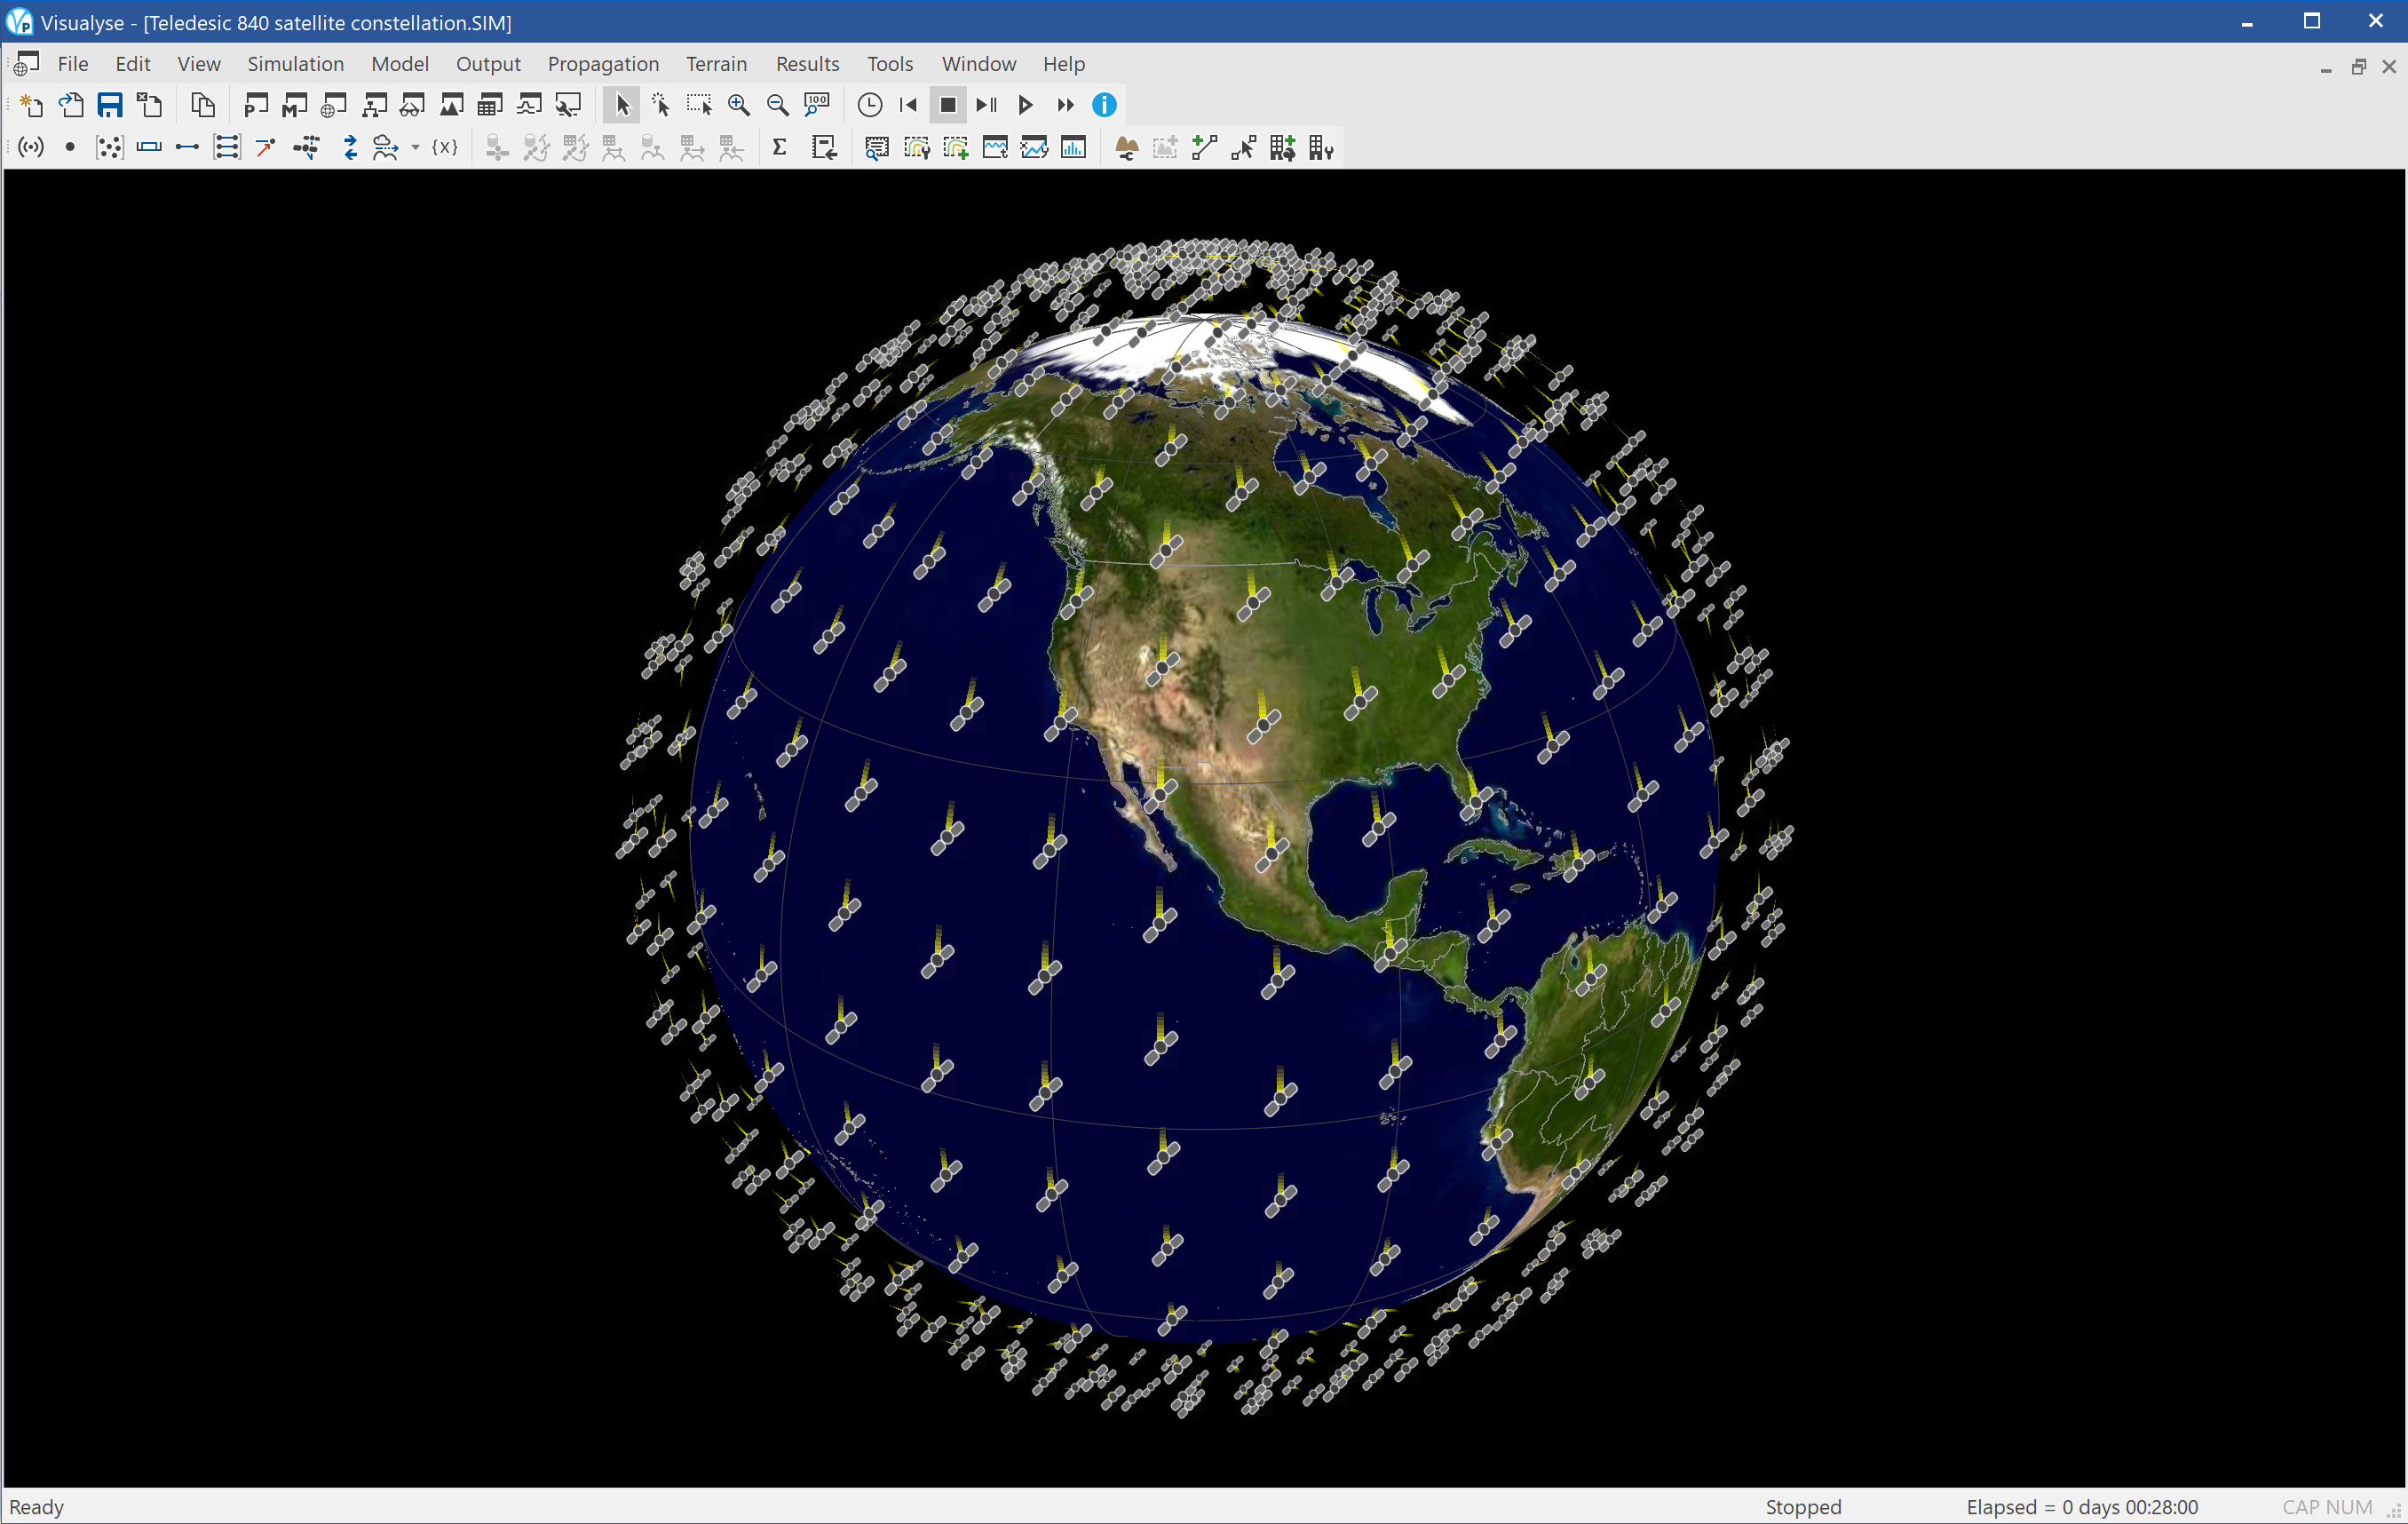
This example shows the original 840 satellite Teledesic constellation. This concept was developed in the 1990s to provide high speed broadband access globally using large numbers of satellites each of which would act as node and route traffic within the network.
Teledesic was successful in gaining access to 2 x 400 MHz at WRC 95 and a further 2 x 100 MHz at WRC 97. However the challenges of implementation and most crucially funding such a system proved too great, even after reducing the size of the constellation down to 288 satellites, and the network never entered operation.
The simulation only includes a single view showing the constellation in the 3D view together with space tracks. The congestion of the network around the poles can be seen – and the difficulty in avoiding collision and generation of space debris!