Network Coverage
This section contains the following examples:
Broadcasting Coverage
| Action: | None |
| Modules used: | Terrain, IDWM |
| Terrain regions: | Greater London |
| Frequency band: | S |
| Station types: | Broadcasting |
| Propagation models: | ITU-R Rec.P.1546 |
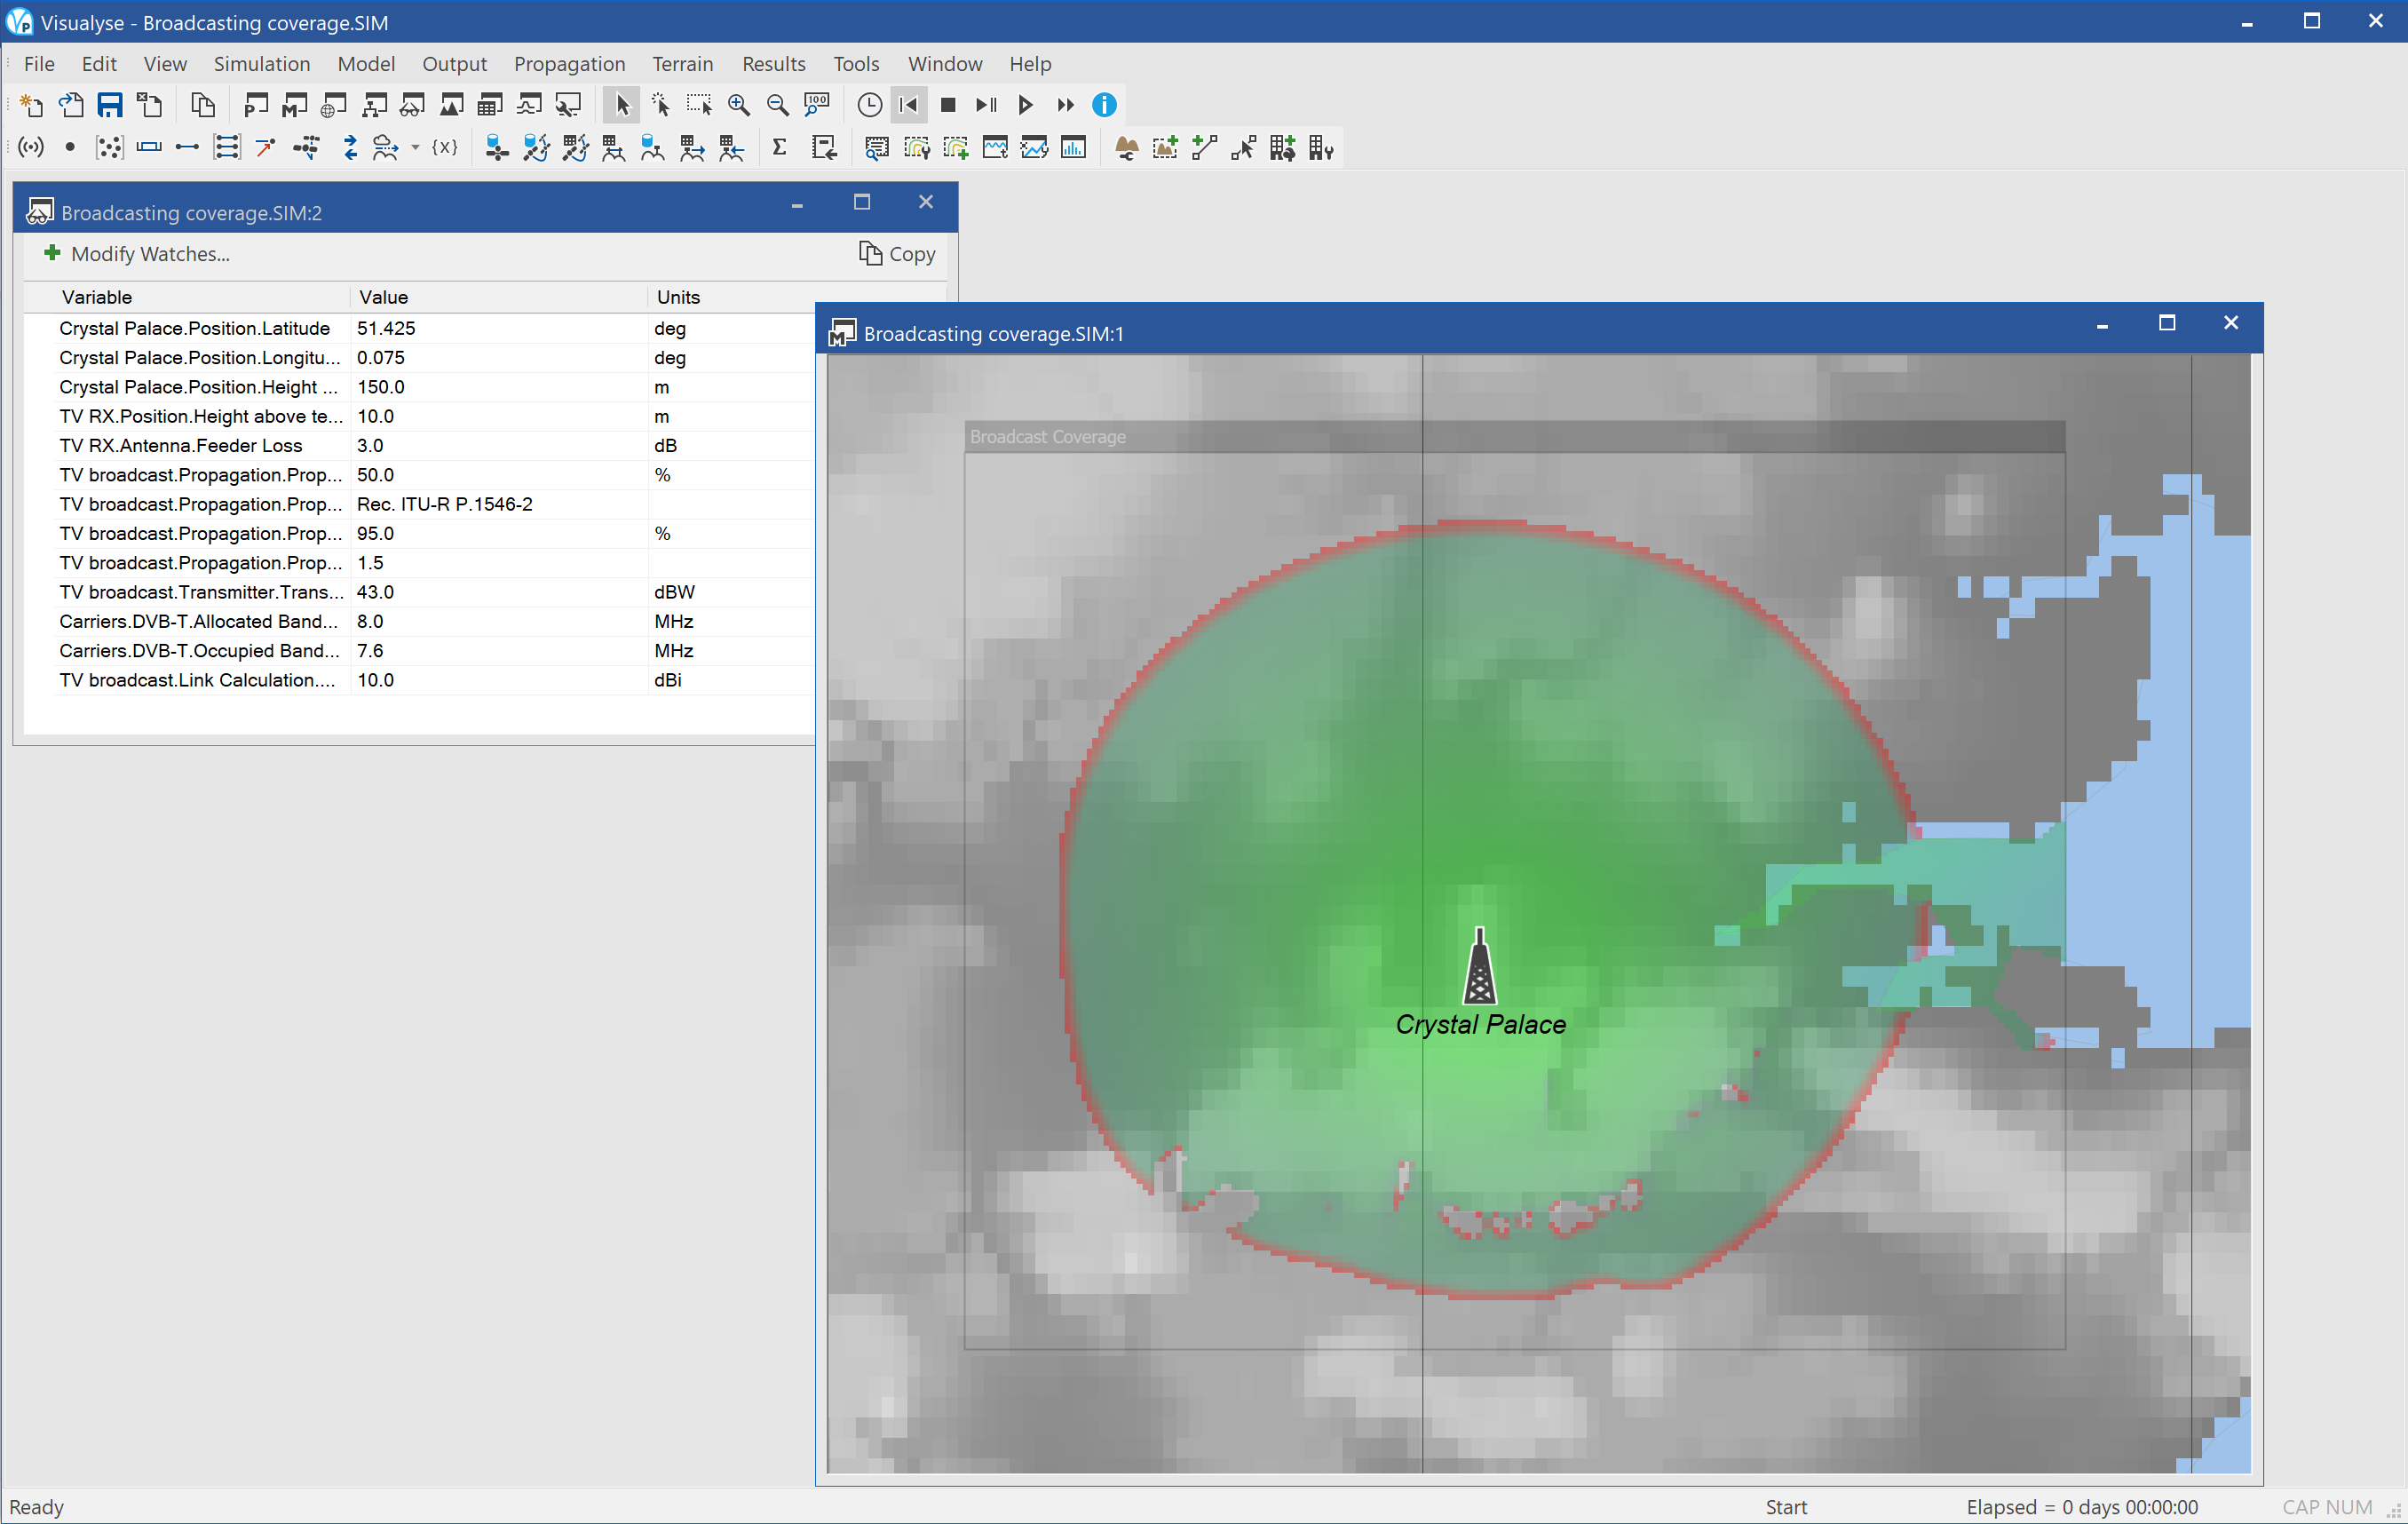
This example shows the coverage of a DTT broadcasting station in the London area. A transmitter of 43 dBW is providing TV services to fixed receivers, with coverage predicted using ITU-R Rec.P.1546.
The screen shot shows two views open:
- Mercator view (right) showing the terrain database used, the location of the transmitter, and the predicted coverage area
- Watch window (top left) showing the key parameters of the prediction, namely:
| Crystal Palace.Position.Latitude | 51.425 | deg |
| Crystal Palace.Position.Longitude | 0.075 | deg |
| Crystal Palace.Position.Height above terrain | 150 | m |
| TV RX.Position.Height above terrain | 10 | m |
| TV RX.Antenna.Feeder Loss | 3 | dB |
| ITU Rec P1546.Wanted Time Percentage | 50 | % |
| ITU Rec P1546.Revision Number | P.1546-2 | |
| ITU Rec P1546.Percentage Of Locations | 95 | % |
| ITU Rec P1546.K | 1.5 | |
| TV broadcast.Transmitter.Transmit Power | 43 | dBW |
| Carriers.DVB-T.Allocated Bandwidth | 8 | MHz |
| Carriers.DVB-T.Occupied Bandwidth | 7.6 | MHz |
| TV broadcast.Link Calculation.Receive Peak Gain | 10 | dBi |
Mobile Coverage
| Action: | None |
| Modules used: | Terrain |
| Terrain regions: | Surrey |
| Frequency band: | S |
| Station types: | Fixed, Mobile |
| Propagation models: | ITU-R Rec.P.452 |
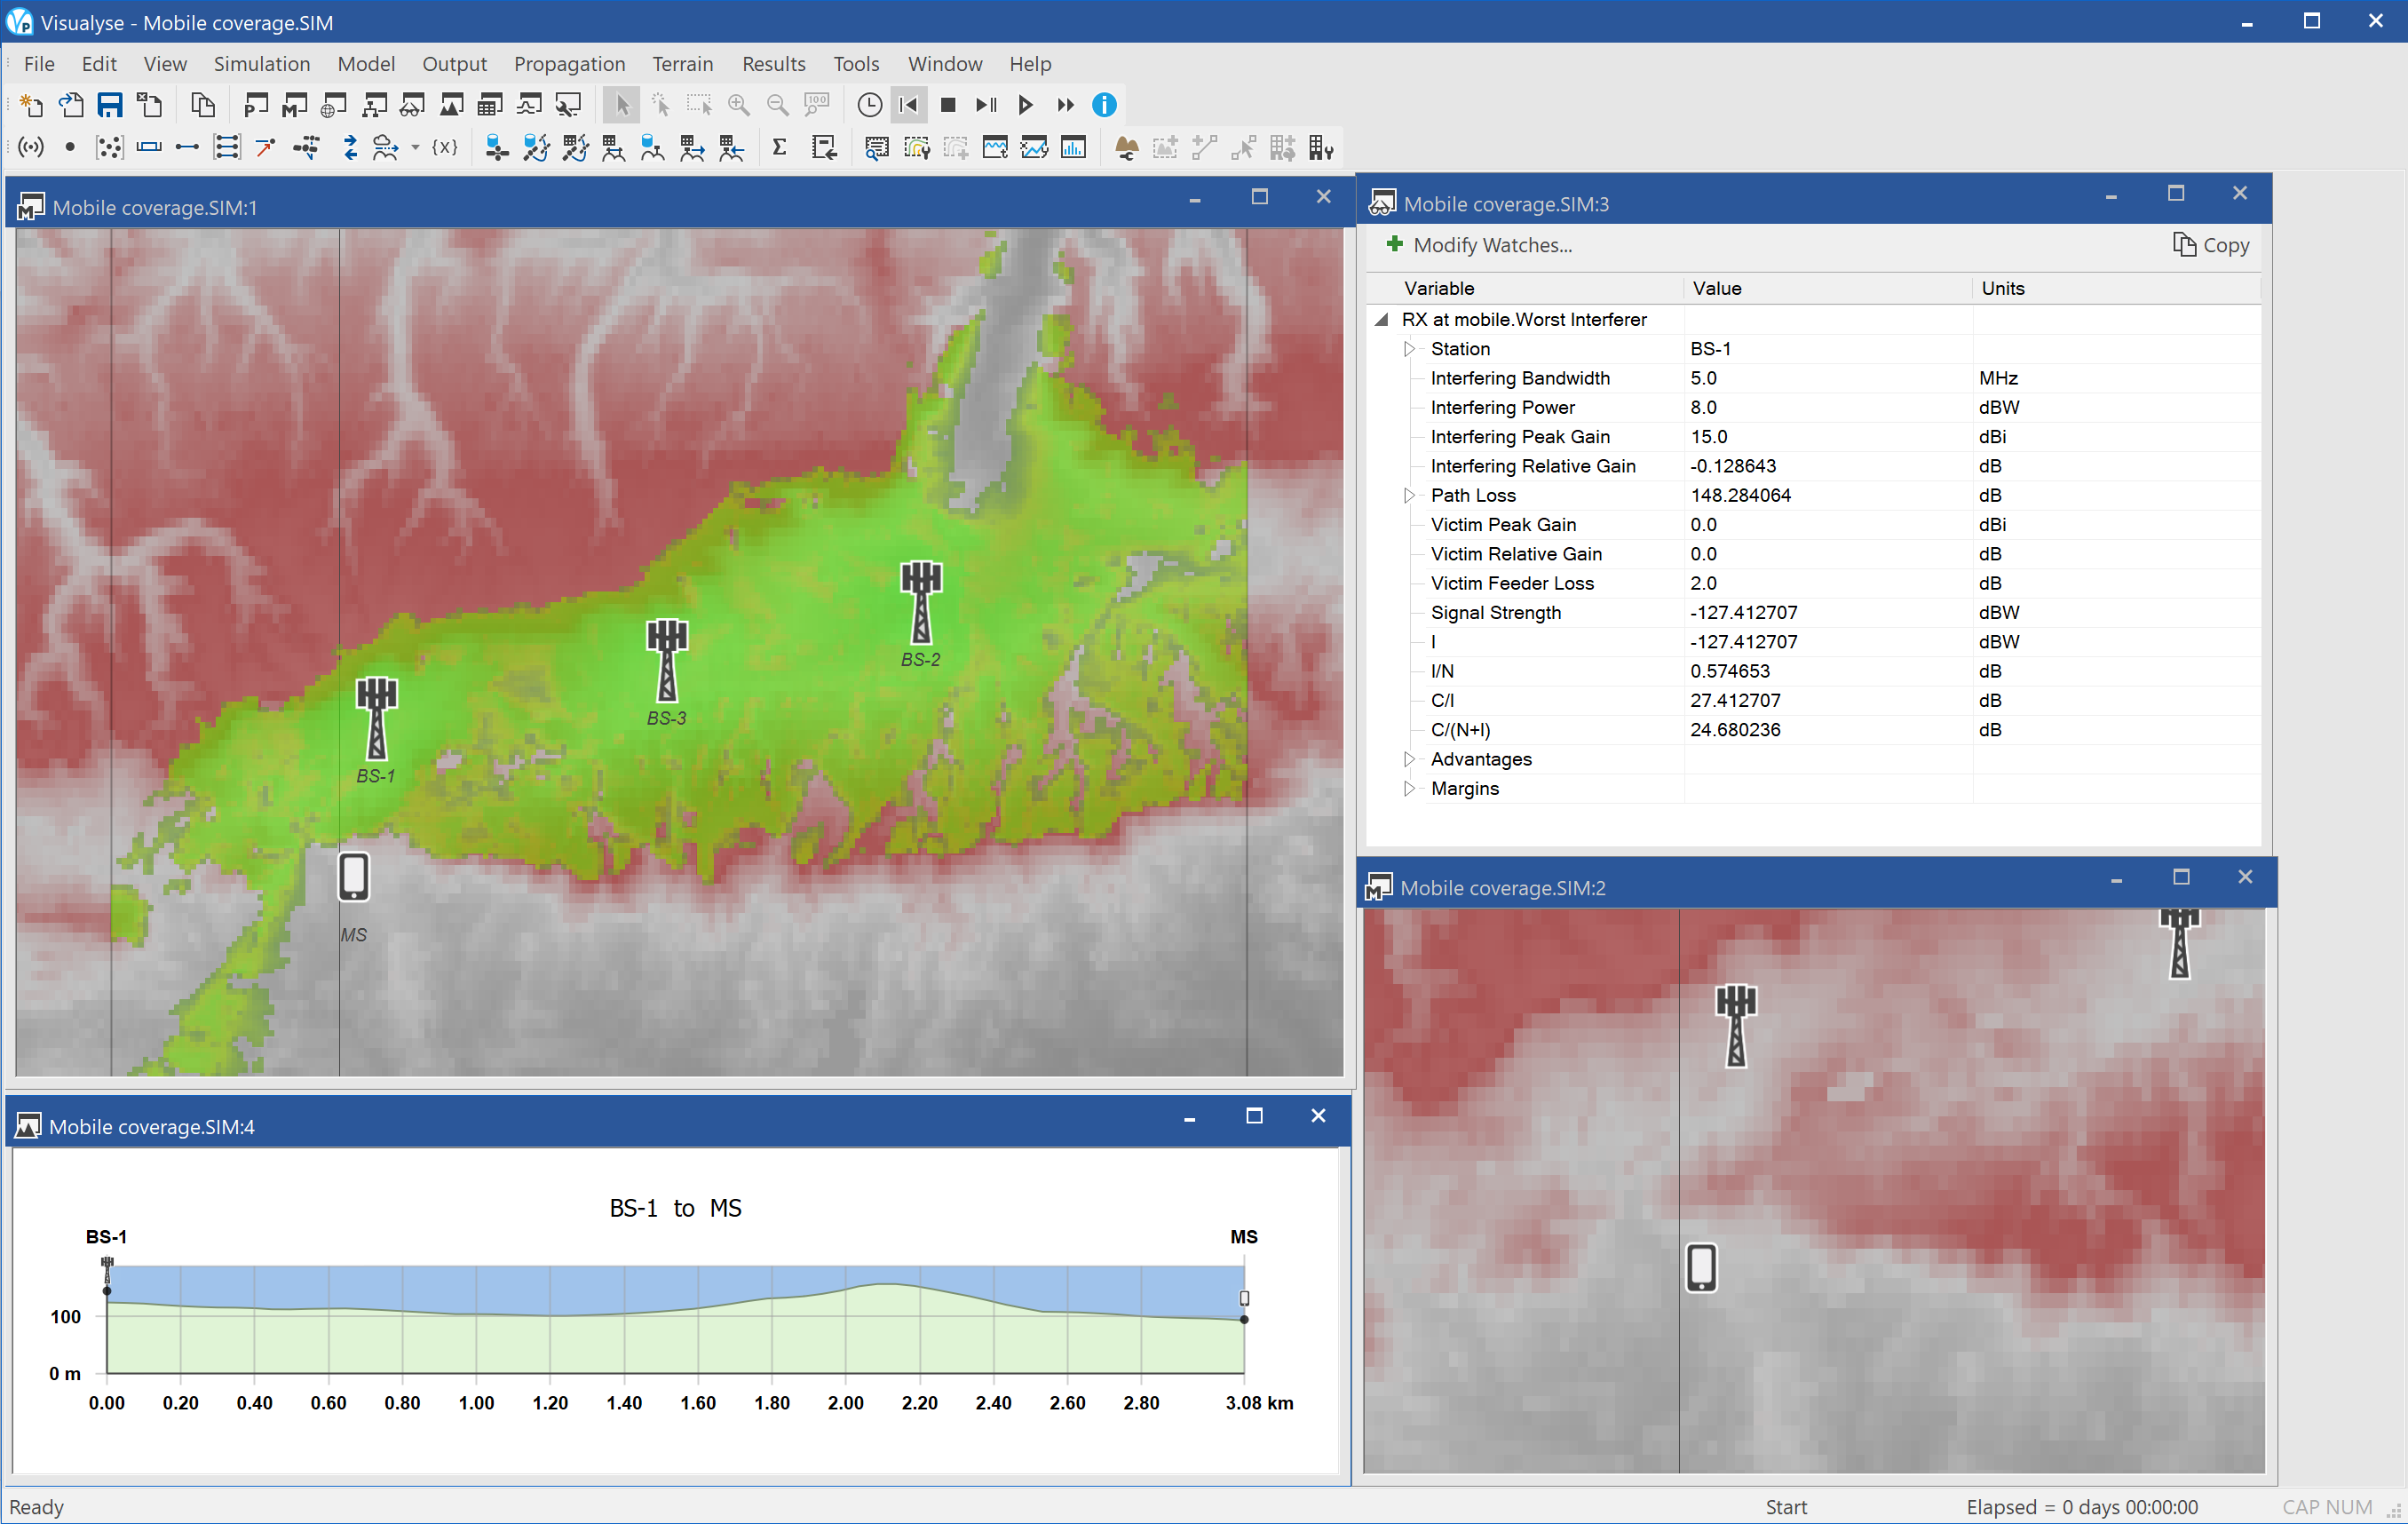
This example shows Visualyse Professional predicting the coverage a 3G network taking into account the effects of terrain and clutter.
A number of base stations have been deployed along the M25 motorway south of London to provide voice and data services to vehicles i.e. using macro cells. These are transmitting at 2.1 GHz and the coverage uses ITU-R Rec.P.452 to predict signal levels and to take into account terrain. A land-use database is also used to derive clutter loss predictions at each pixel.
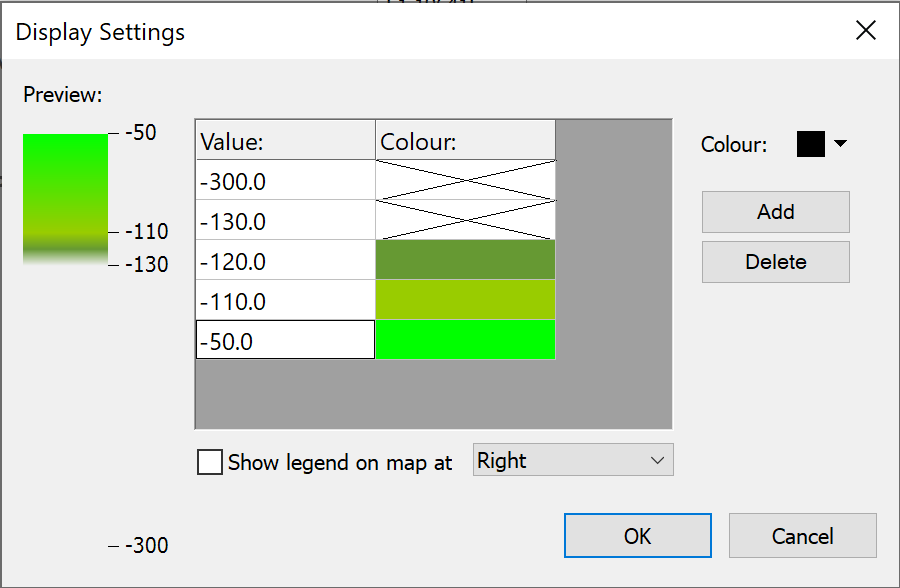
The Area Analysis feature of Visualyse Professional has been used to show where there is usable signal strength according to the following scale:
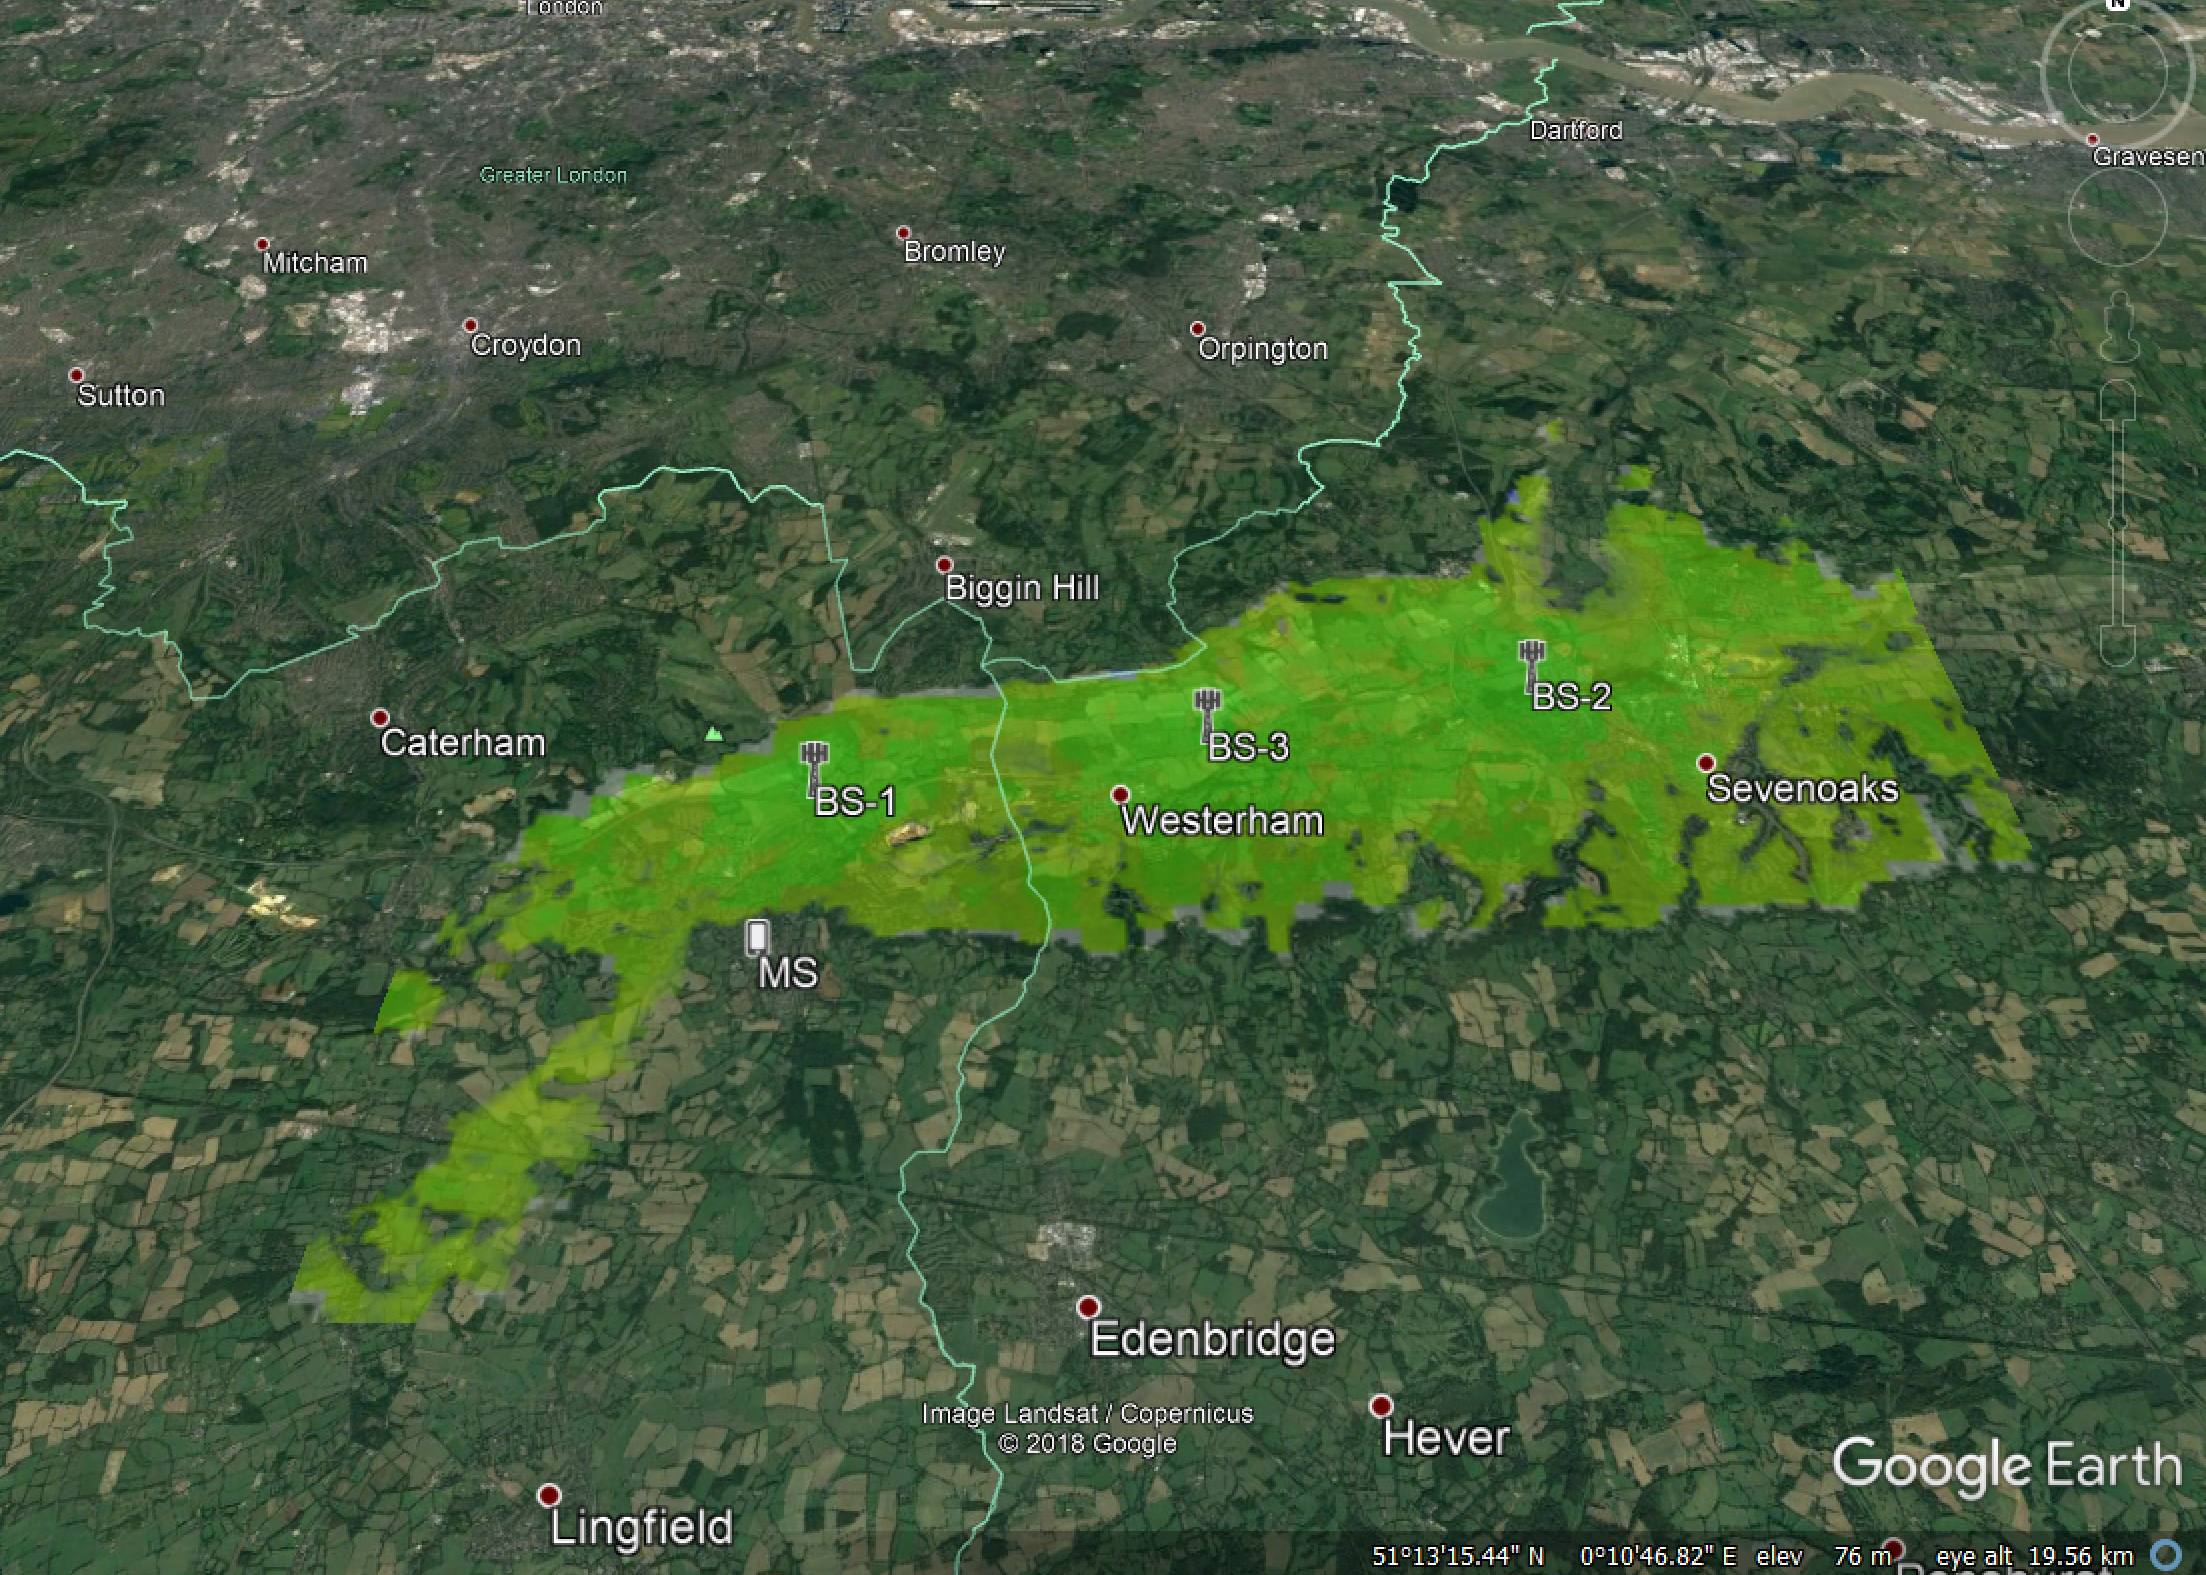
It can be seen that coverage is generally better along the route of the motorway where the terrain is less hilly and there are little buildings. The coverage is reduced where there are hills or within the town of Sevenoaks where there is greater clutter loss.
The screen shot above has four windows open:
- Mercator view (top left) showing the locations in green where there is coverage above the threshold level, the station locations, and a tinge of red to show terrain data
- Path profile view (bottom left) showing the terrain path between one of the base stations and the test location of the mobile
- Watch window (top right) showing the link budget from the base station to the test location of the mobile as used in the path profile
- Mercator view (bottom right) showing in more detail the map around the town of Sevenoaks with an overlay of colour representing land use where yellow = suburban, pink = buildings etc.
PMR Coverage
| Action: | None |
| Modules used: | Terrain |
| Terrain regions: | Crawley |
| Frequency band: | VHF |
| Station types: | Fixed, Mobile |
| Propagation models: | ITU-R Rec.P.1546 |
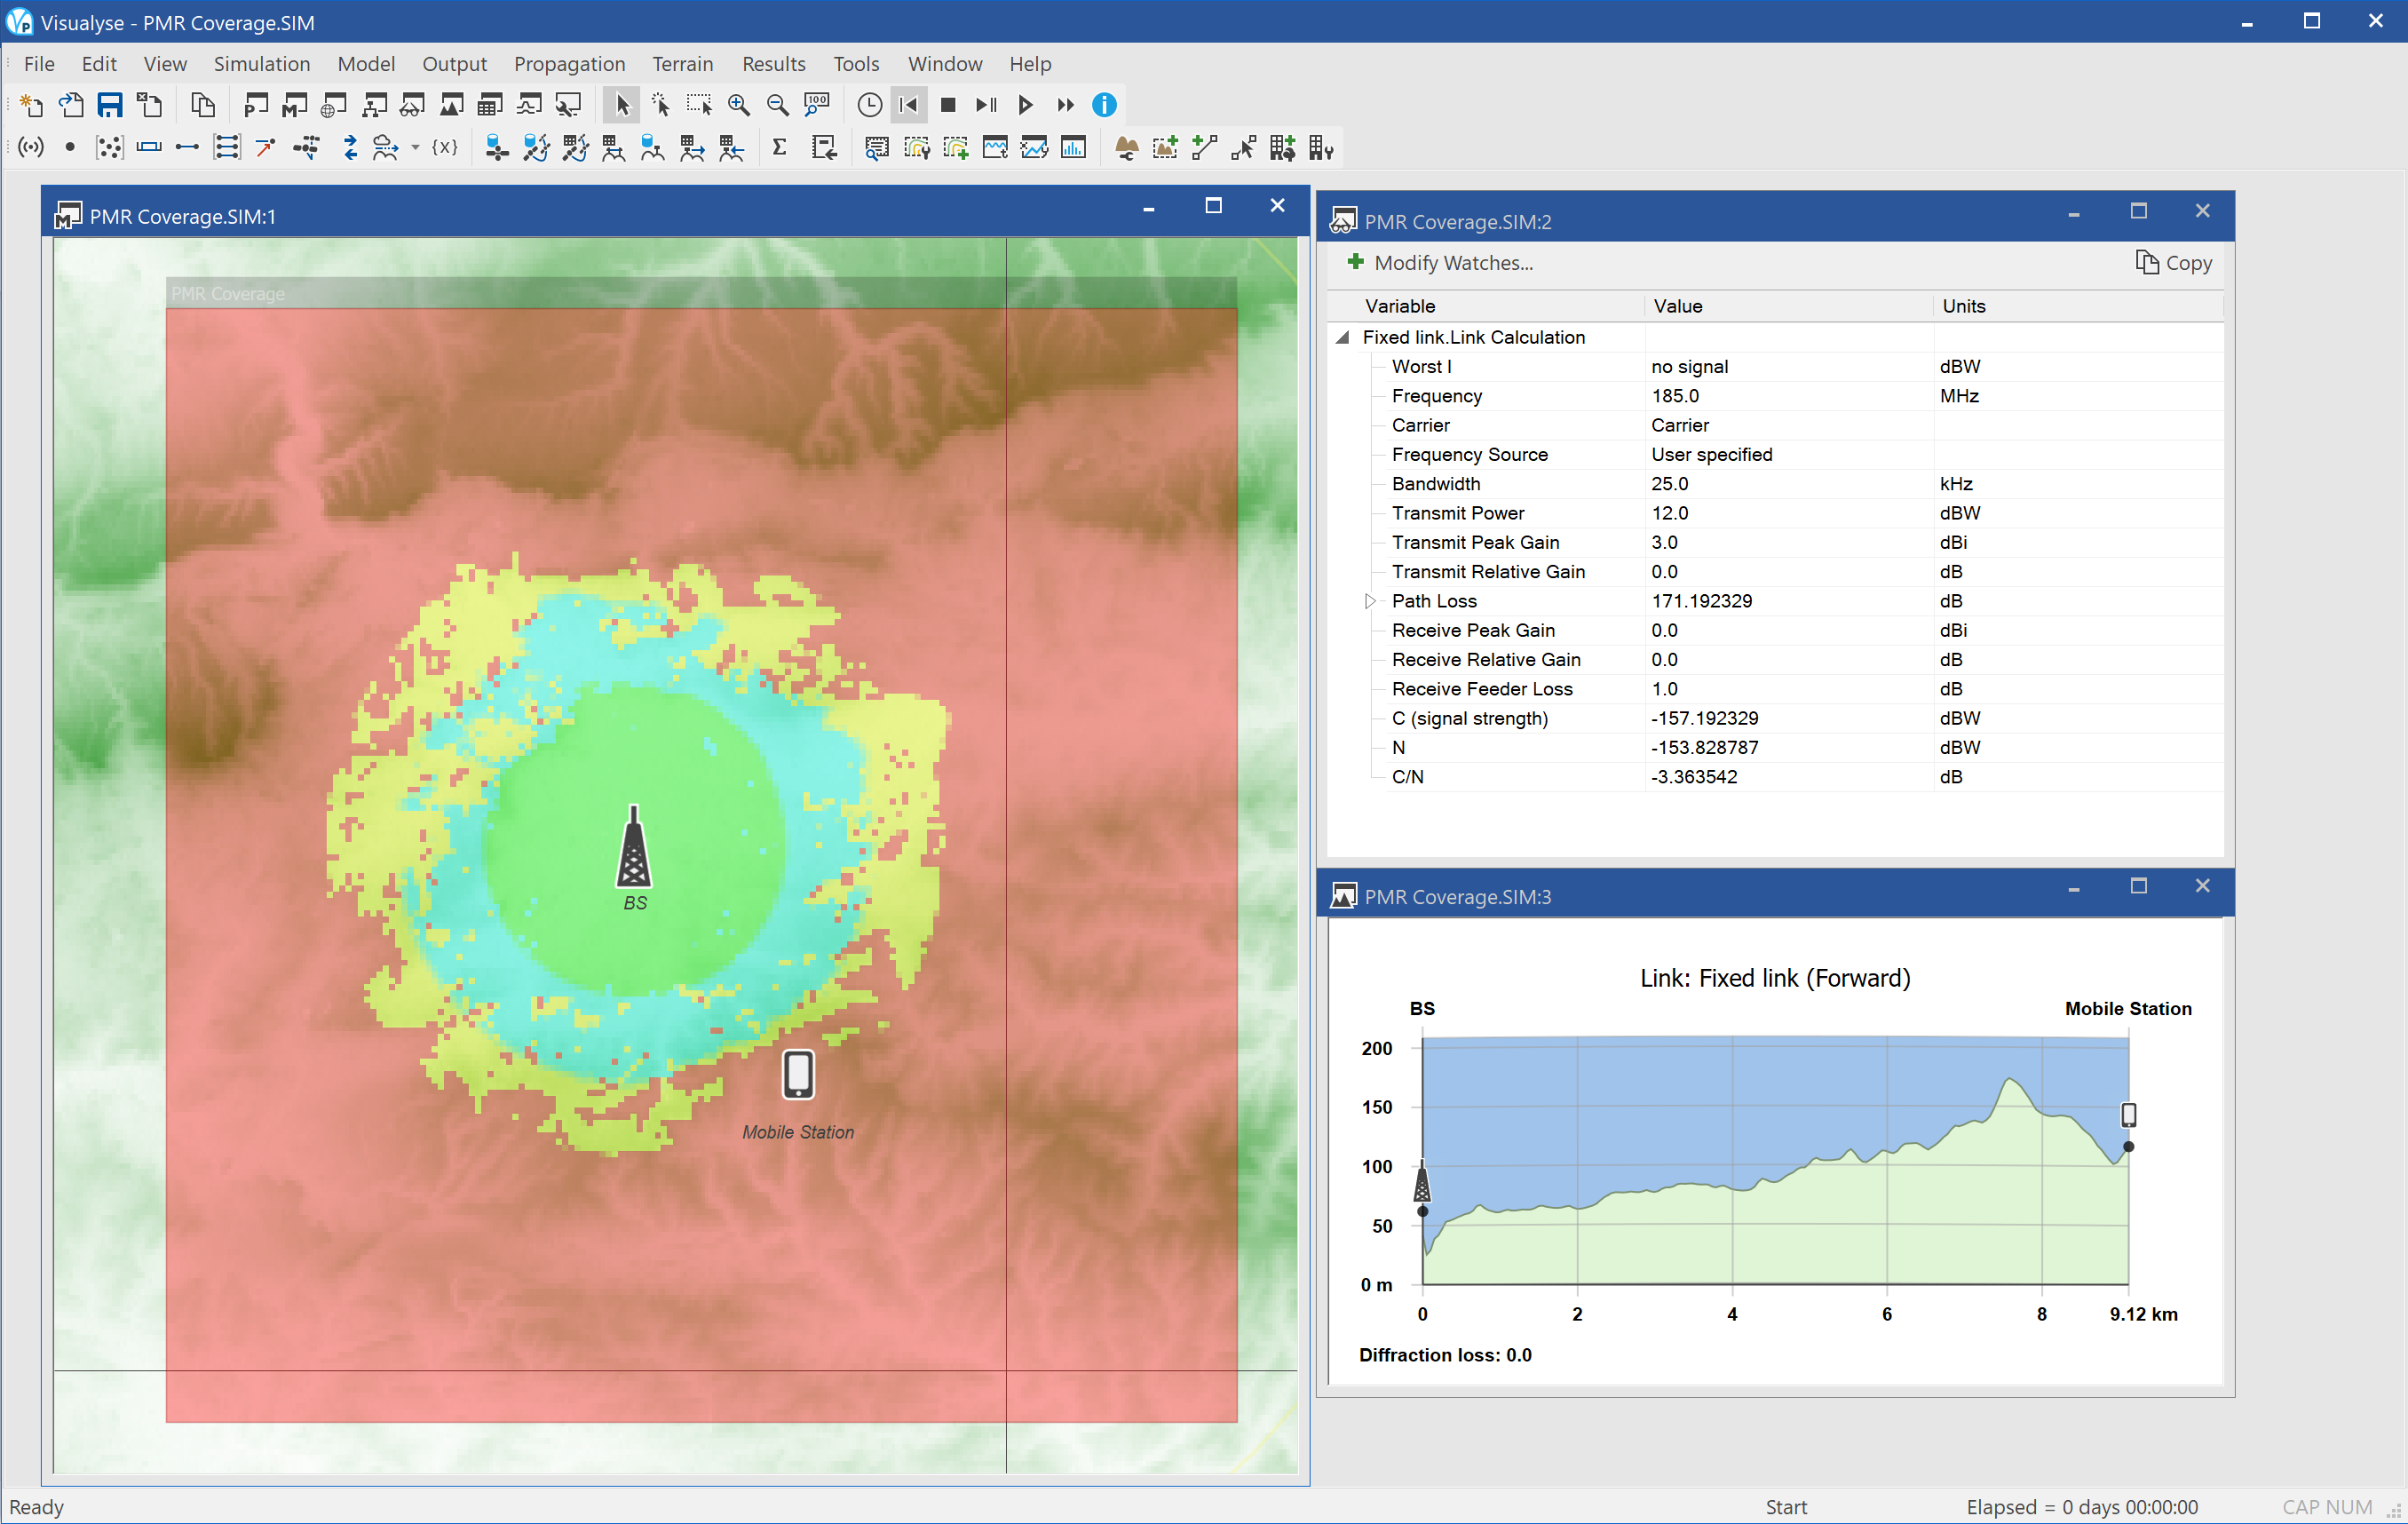
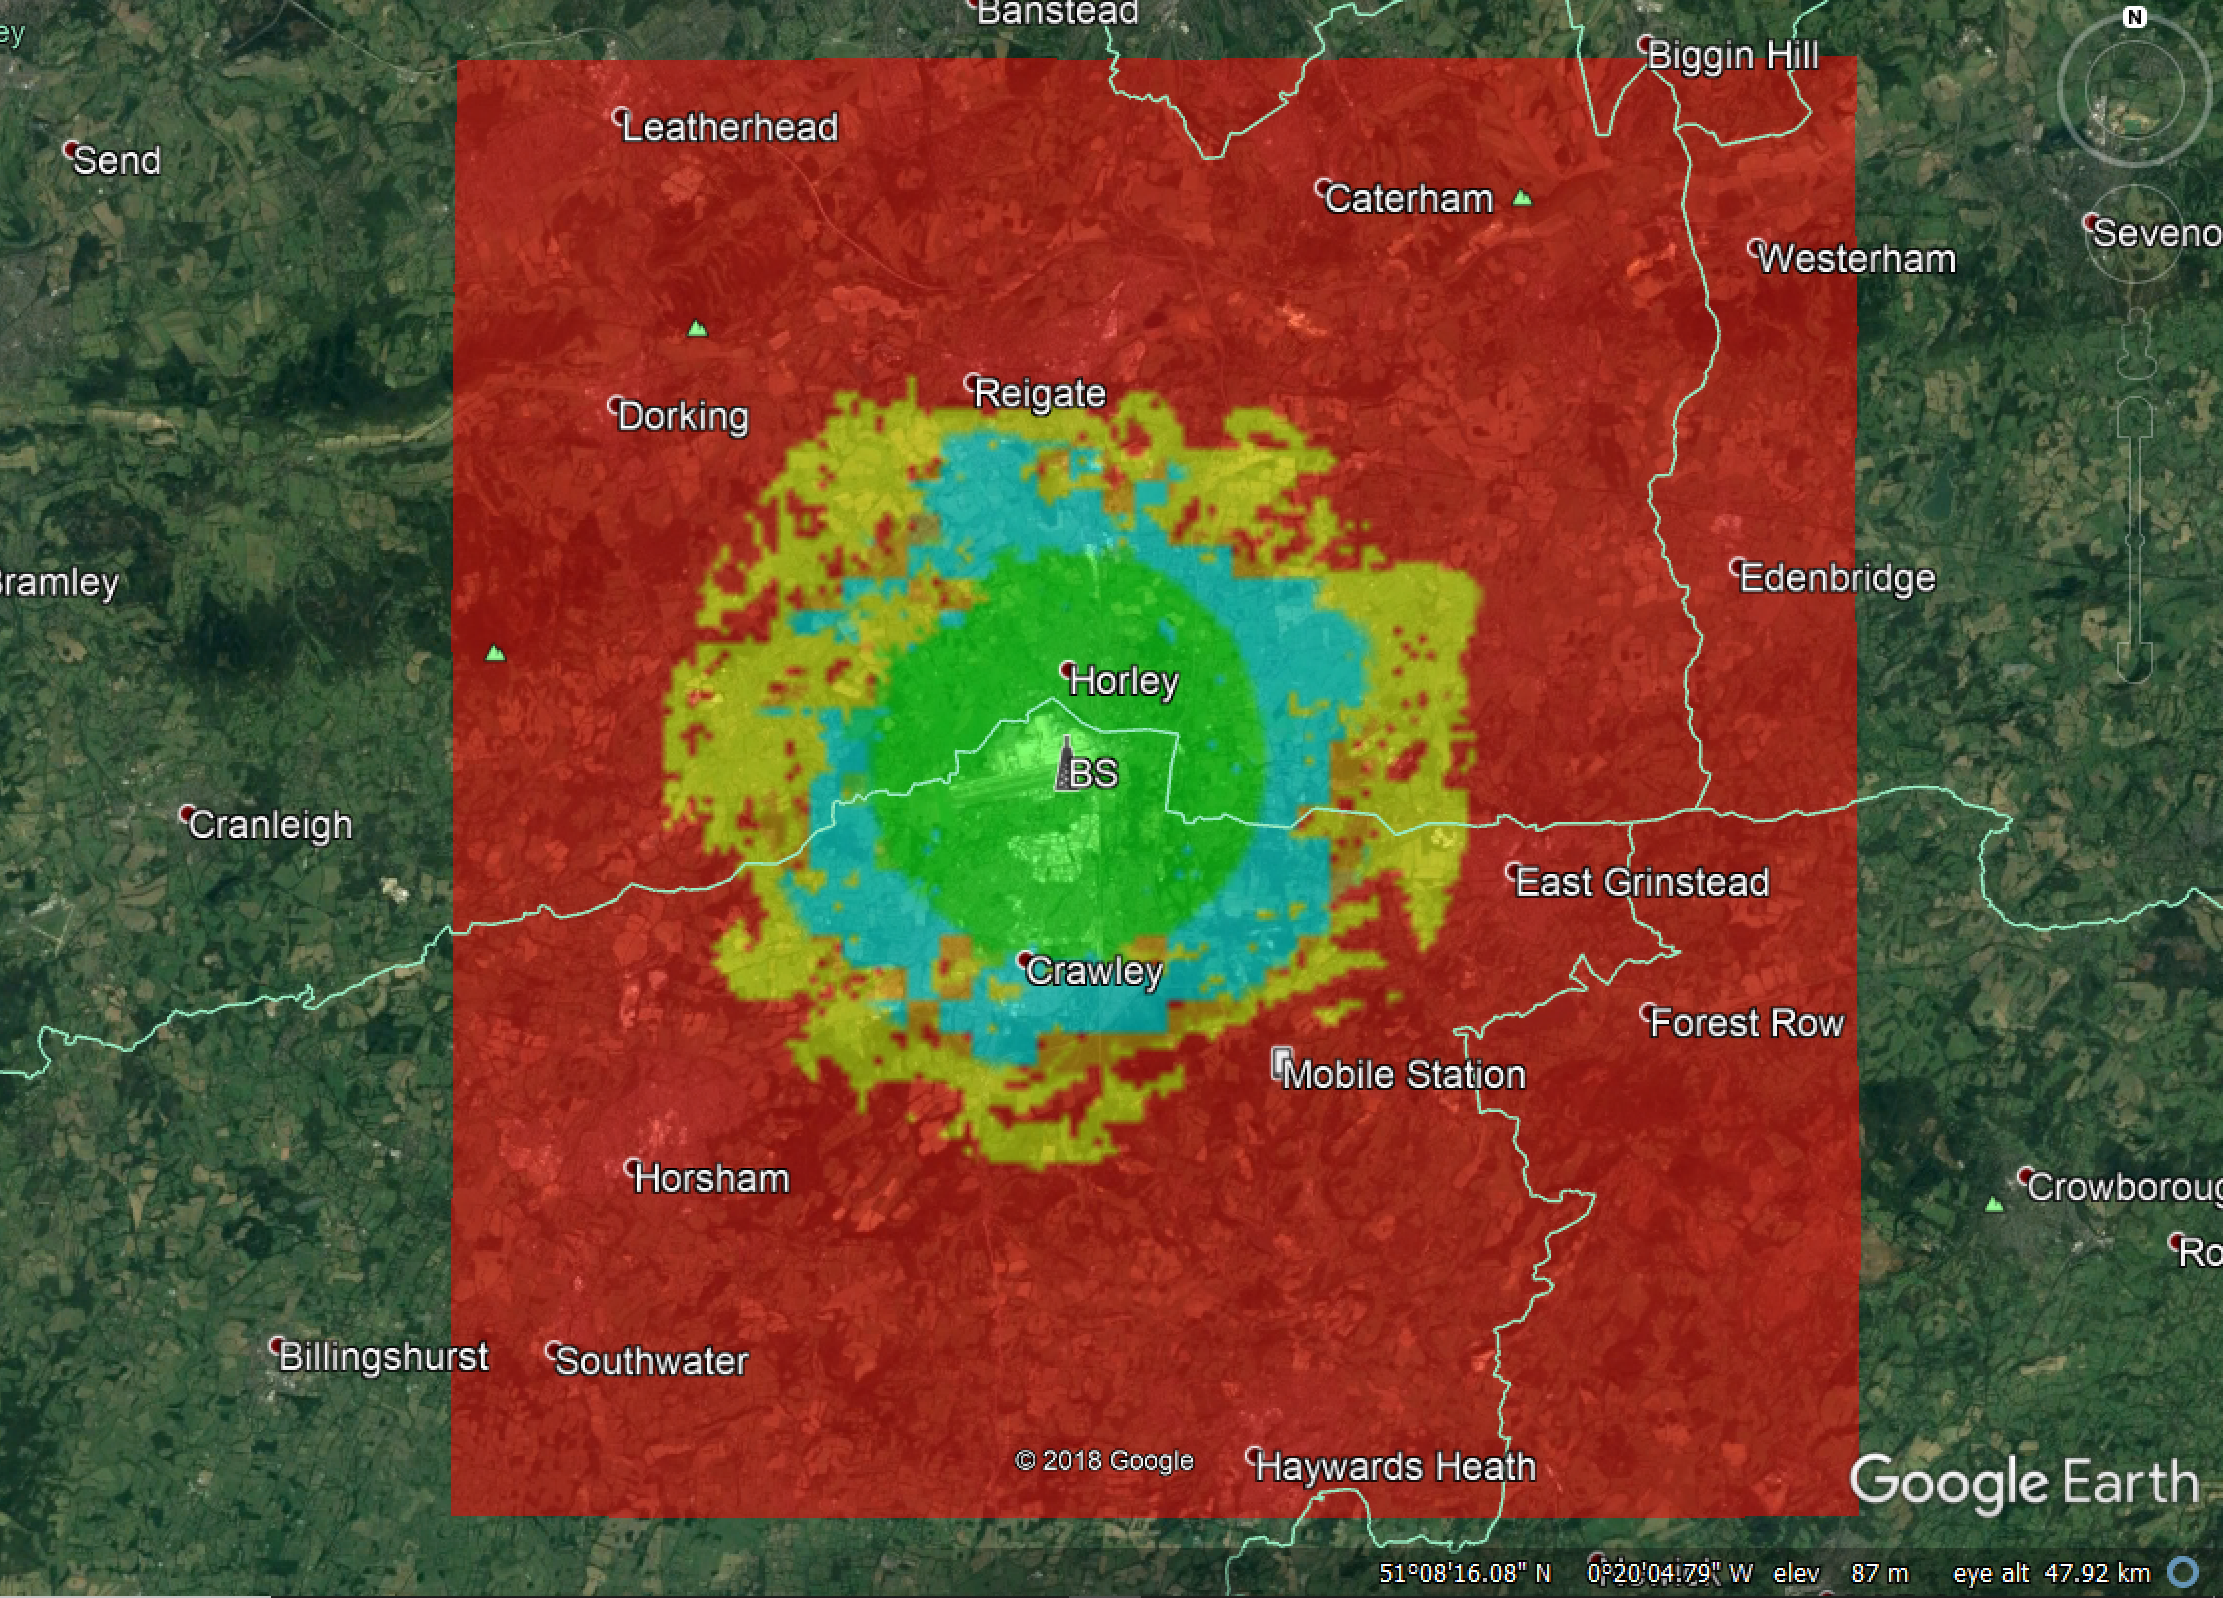
This example shows the calculation of the coverage of a Private Mobile Radio (PMR) network based around the UK airport of Gatwick. A base station is transmitting at a power of 12 dBW i.e. about 15.8 Watts within a 25 kHz voice channel at a frequency of 185 MHz.
Visualyse Professional is being used to identify where the C/N is above various thresholds, namely:
Green: C/N > 20 dB
Blue: 20 dB > C/N > 10 dB
Yellow: 10 dB > C/N > 5 dB
Red: 5 dB > C/N
The prediction is based upon use of ITU-R Rec.P.1546 using a terrain and land-use database.
In the screen shot above there are four windows open:
- Mercator map view (left) showing the locations of the base station and a test point for the mobile station, the prediction of the C/N at each pixel, and a map of the area.
- Watch window (top right) showing the link budget for the base station to mobile station path
- Path profile view (middle right) showing the path through the terrain between the base and mobile stations
- Mercator map view (bottom right) showing in more detail the map around the town of Dorking, with the land-use colour coded and overlaid on top
Note that due to copyright restrictions, the clutter and map overlay might not be available in all installations.
The prediction could also be exported to Google Earth, as in the figure below.
