Service Area Wizard
Service Area analysis, looking at detailed results over a wide area, can be performed by distributing test point Stations over an extended area and setting up Links to each Station. Useful information about service levels can then be obtained by analysing the Links to find ‘worst cases’ (see Link Groups for more details).
The Service Area Wizard has three pages. The first page is the Template Station page (shown below).
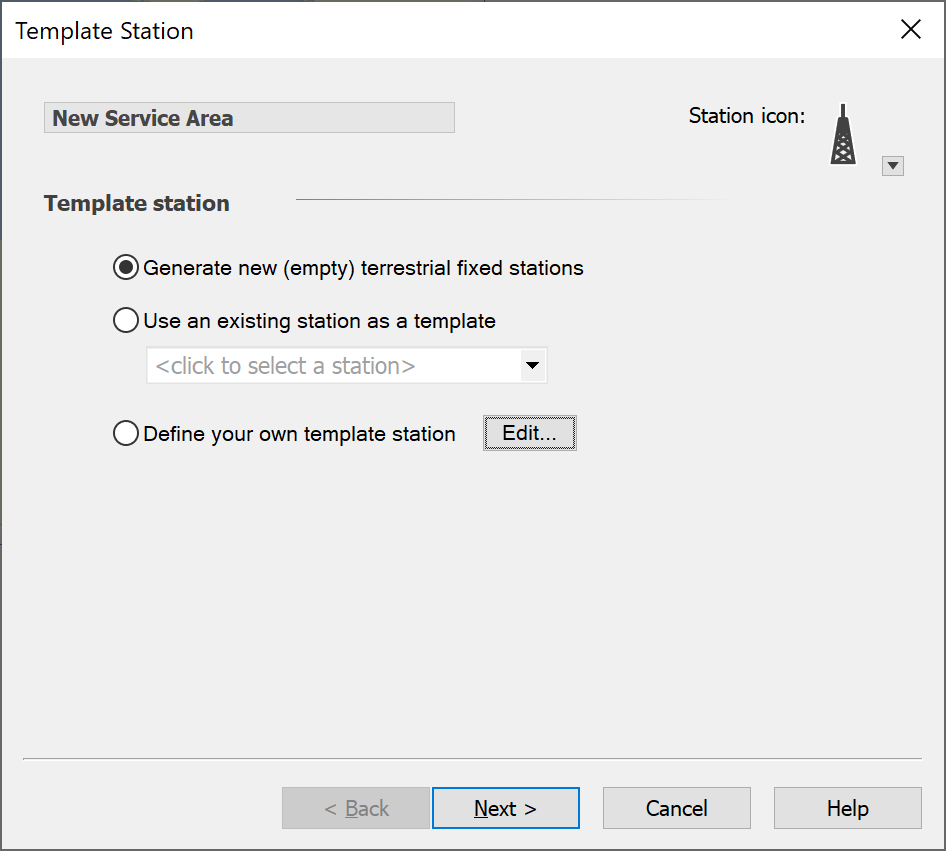
You can set the name of the Service Area Group in the top-left of the dialog. The station icon can also be changed.
The other options allow you to say which station will be replicated across the service area. The choices are:
- To generate new stations
- Use an existing Station as a template – you will then need to select the Station to use from the list box
- Define a new template Station: pressing the Edit button allows you to define the new station which will be used as the template
Having made the selection and defined your template Station, click Next to move on to the Service Area page. From here you can define the extent of your service area.
There are five ways you can define your service area:
- As a rectangular region
- By reference to a particular Beam footprint
- Using a Country border derived from the IDWM database
- Based on a series of discrete points defined in a text file
- Using a hexagonal deployment
Service Area Defined by Region
If you want to define it by a rectangular region, select the Region option. This is the default and is shown below.
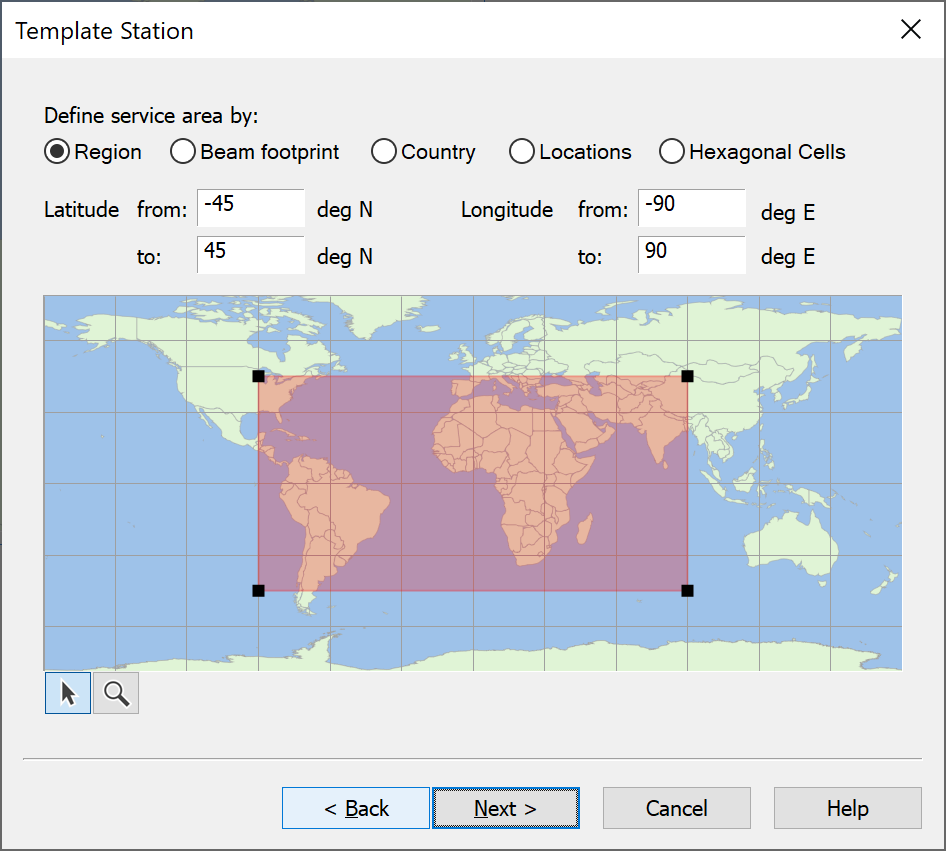
The extent of the area is shown, and you can edit the latitude and longitude of the corners directly at the top of the dialog. The area is also shown on the map as a shaded red border. You can resize and move this border to change the size of the service area.
You can zoom into the map by clicking the magnifying glass. This puts you into zoom mode. When you pass the mouse over the map the pointer will change to a magnifying glass - left-click to zoom in and right-click to zoom out. You can move around by dragging the map as you move around on the Plate Carrée or Mercator views.
When you have selected the geographic extent of your area you then need to decide whether to fill the area or populate its edges. If the former, then it is necessary to specify:
- How many stations will fill it.
- How will those stations be deployed.
You must choose between three methods for defining your grid:
- Stations: in that case you simply say how many columns of stations there will be (‘North’) and how many rows (‘East’). Visualyse will create a rectangular grid based on this input
- Grid: this also creates a rectangular grid, but this time based on the spacing of stations N-S and E-W.
- Hexagon: in this case the grid is in a hexagonal not rectangular pattern, again based upon spacing of stations N-S and E-W.
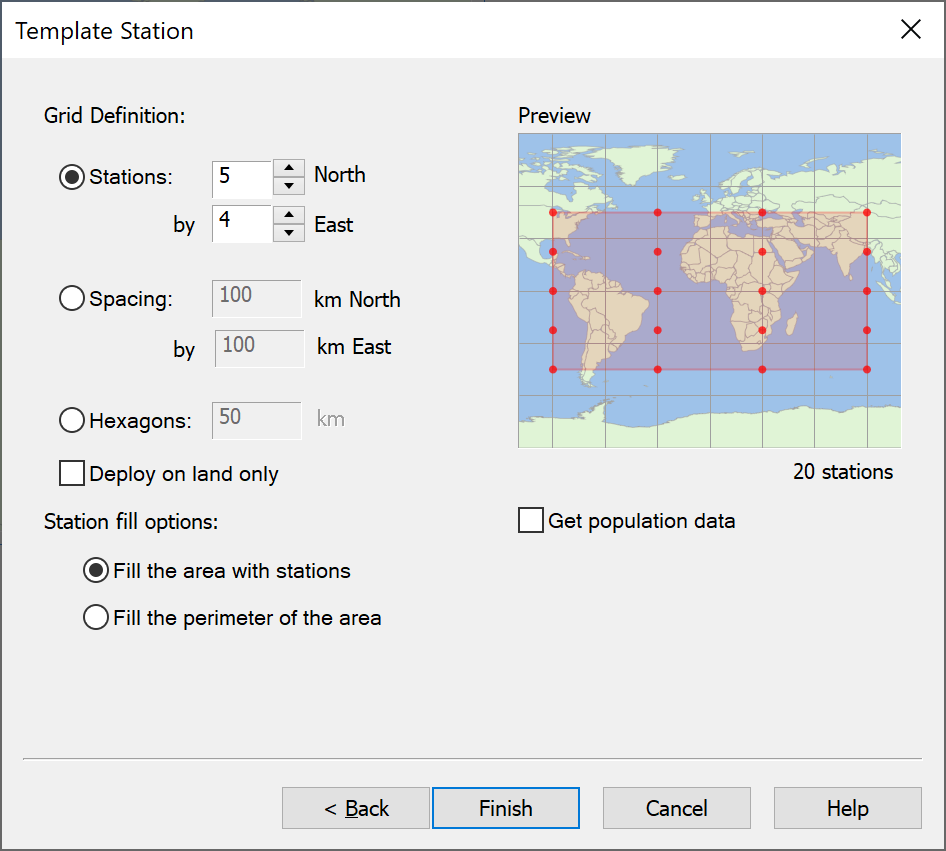
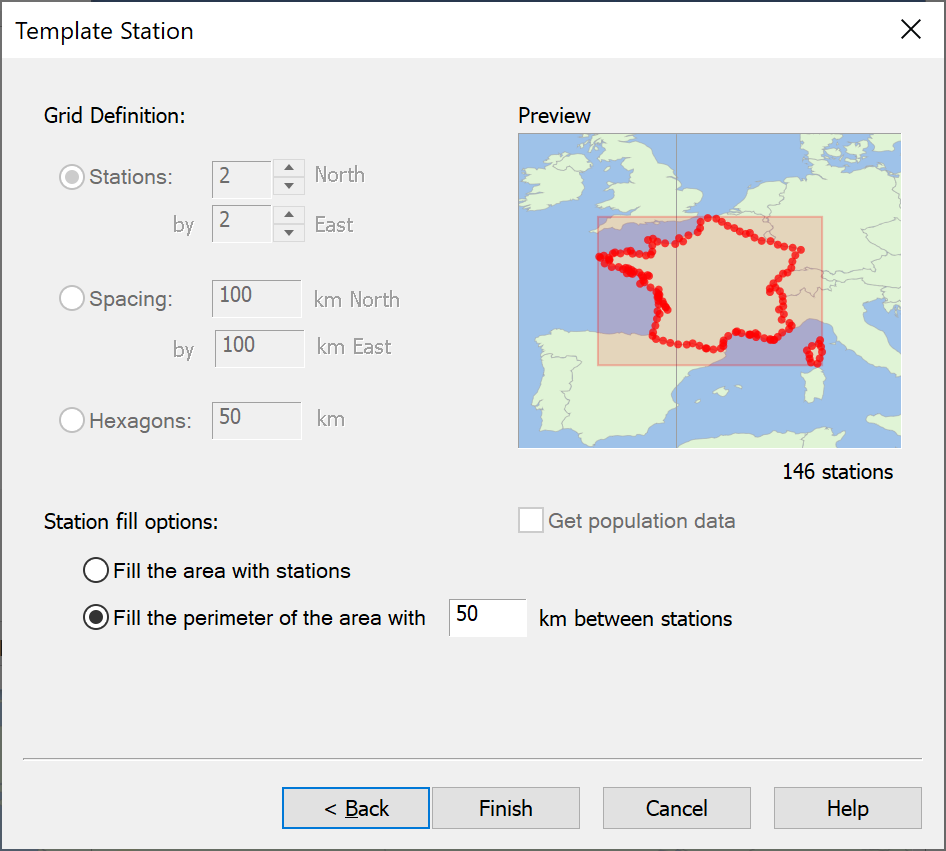
If rather than filling the area you want to fill the perimeter you must defined the spacing between Stations.
If “Get population data” is selected, then each of the Stations created will have their “Maximum load” field set from the population database. The population will be that calculated to be in a tile defined using the number of stations North/East or spacing in km North/East. Note that this option is not available when deploying stations in hexagons or with the fill the perimeter option. This requires the population data directory be set as in Population Data Settings
The preview window shows where stations will be located on a map. This is automatically updated whenever you change any of the parameters.
Service Area Defined by Beam
The second way of specifying an area is by a beam footprint. To do this, select the Beam Footprint option.
Select the satellite, antenna and beam you want to use, as shown in the figure below.
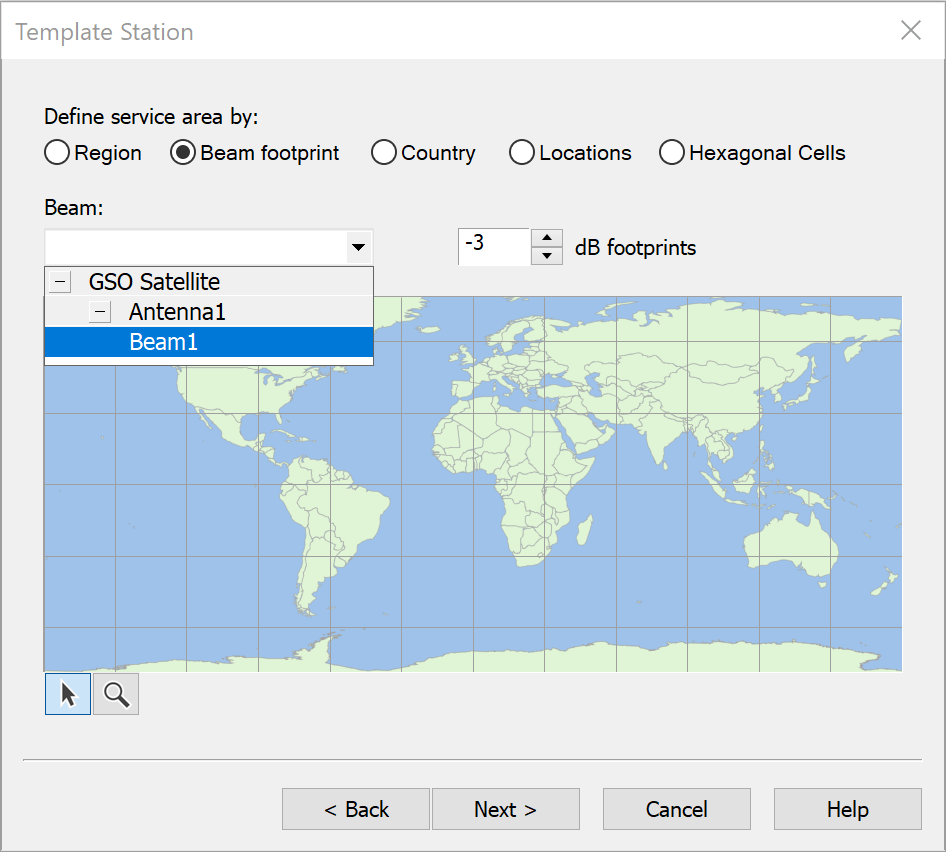
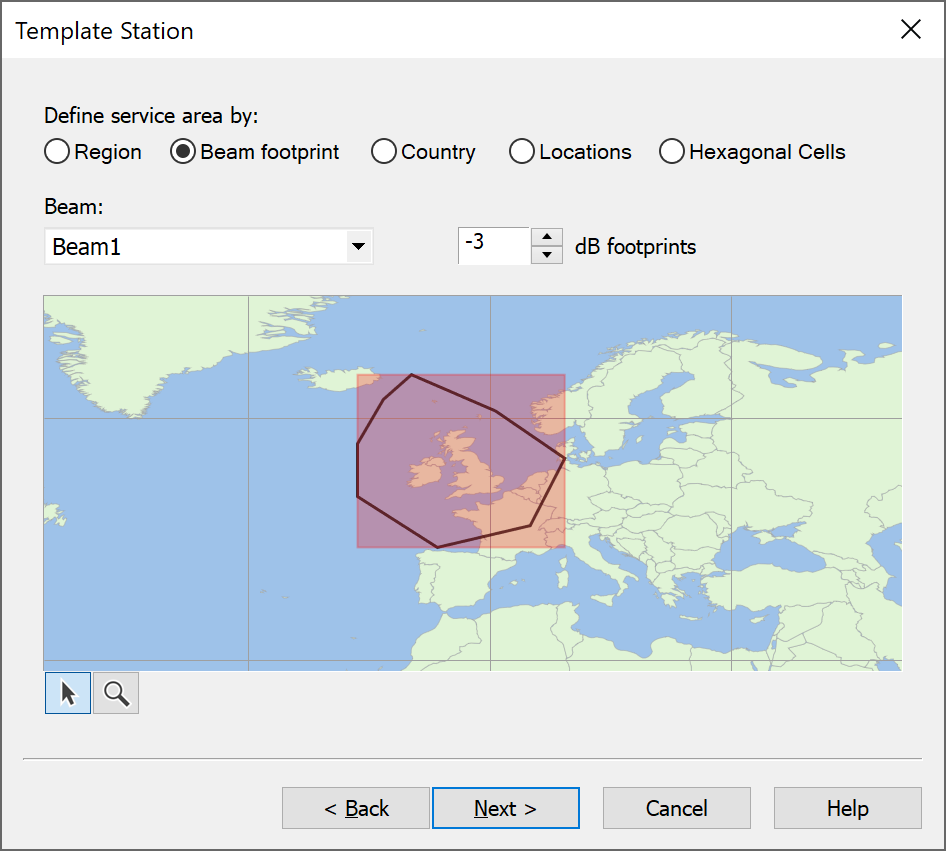
As with the region option, you can zoom into the map if you need to.
When you are happy with your service area, click Next. This will take you to the Station Deployment page. From here you decide how stations will be arranged in the service area.
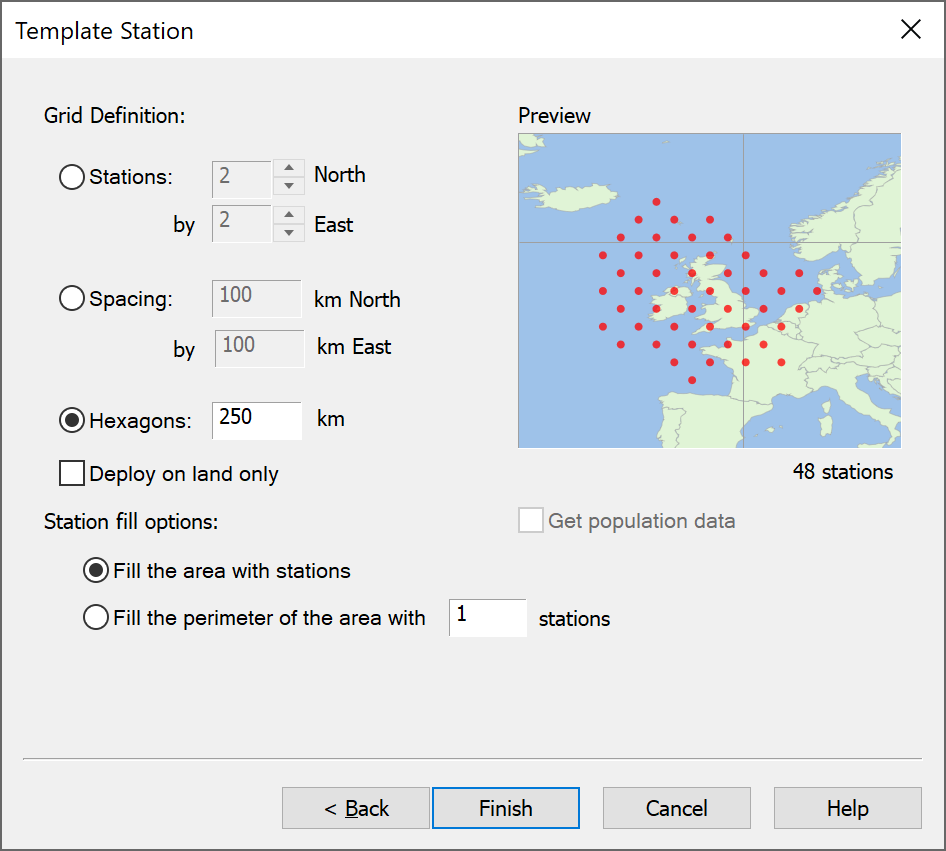
There fill options are the same as for the region option described above.
Service Area Defined by Country
The next way of specifying an area is by using a country’s border. To do this, select the “Country” option and then from the drop-down list select the one of interest, as in the figure below:
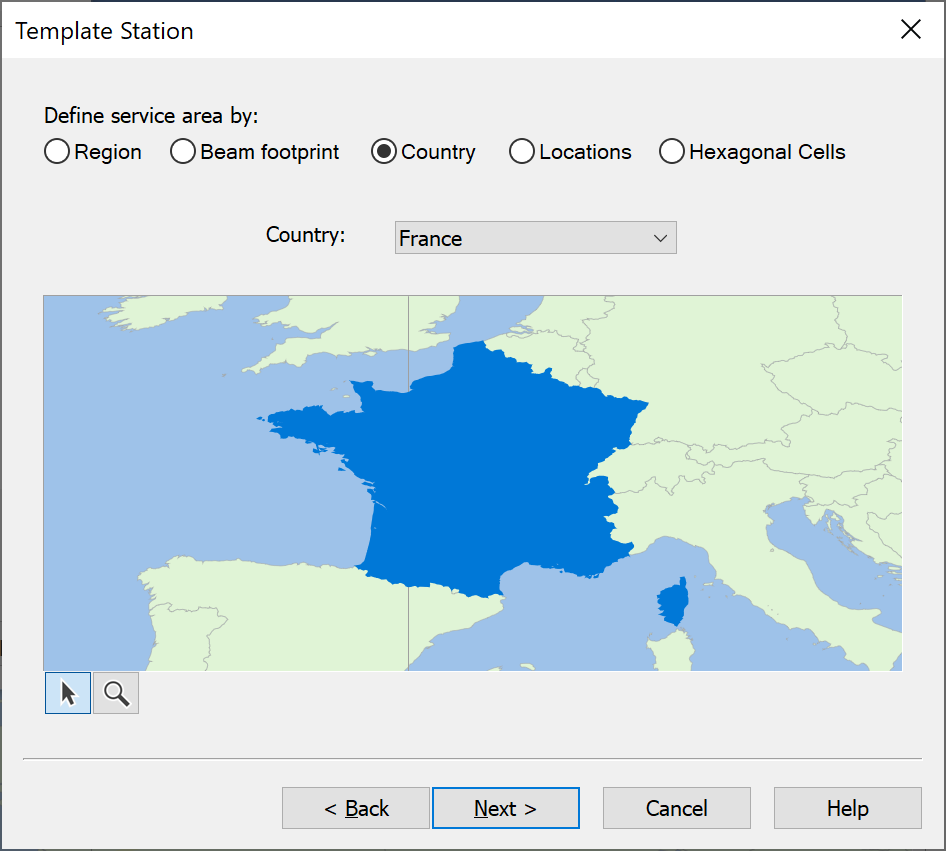
Having done the selected country will be highlighted in the preview which you can configure using the standard zoom and map move options.
If you click on next you will be able to use the standard Service Area Wizard controls to either populate either the country’s area or border with Stations.
An example of the fill border options is shown in the figure below.
Service Area Defined by Locations
The next way of specifying an area is by using a text file to specify the (latitude, longitudes) of each station. To do this, select the “Location” option and then the file that contains the data, as in the figure below.
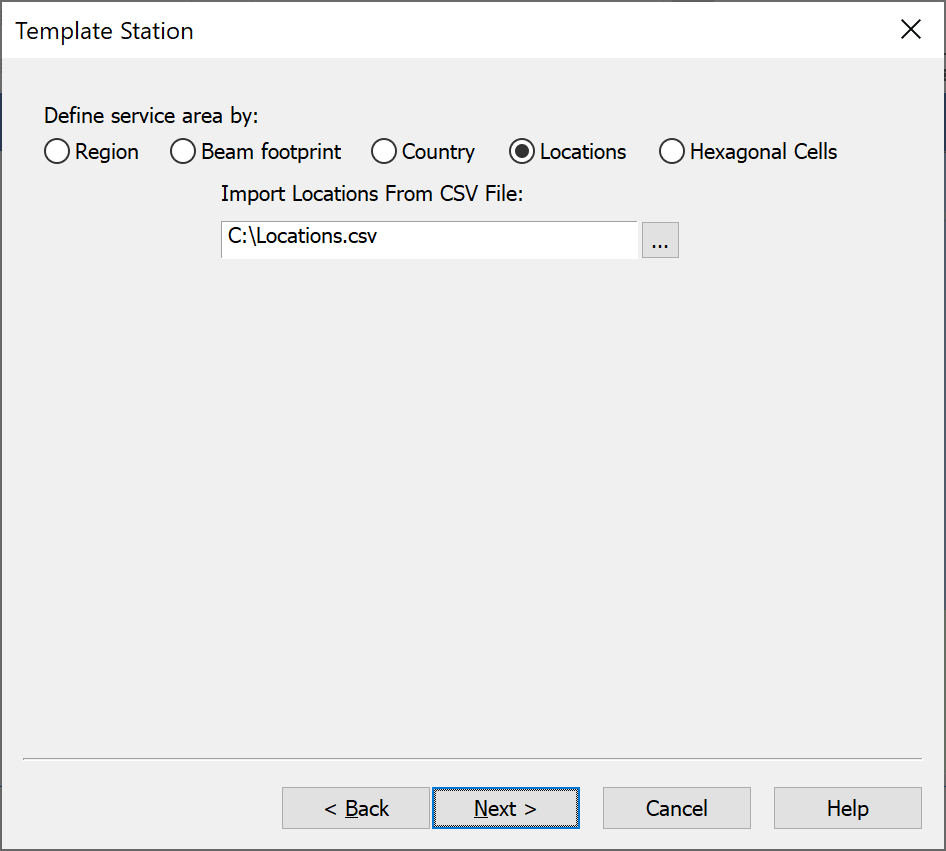
Having selected the appropriate file you can click next, and the wizard will display the latitude ad longitudes read in together with a preview on a map as in the figure below.

Service Area Defined by Hexagons
The final way to define the service area is through a deployment of stations in hexagonal pattern. To do this, select the “Hexagons” option and you will be prompted for the central latitude and longitude, e.g.
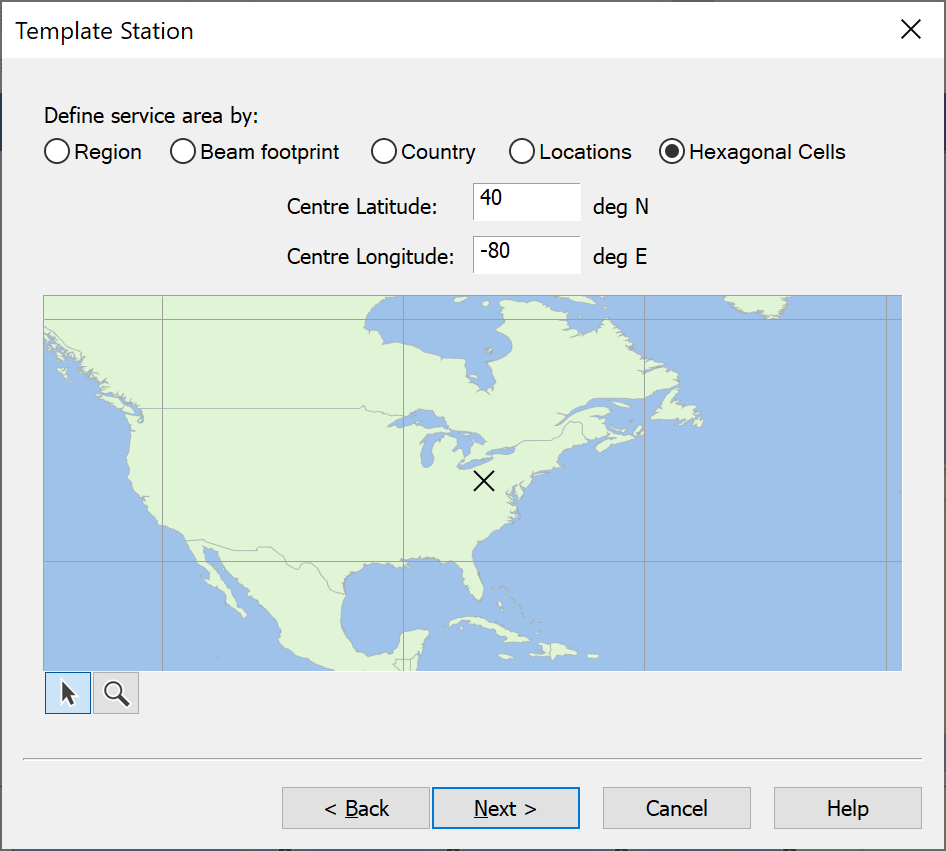
Again, the standard map zoom and pan controls can be used. If you click on “Next” you can then define the hexagonal pattern to use based upon rings or grid, as in the figures below.
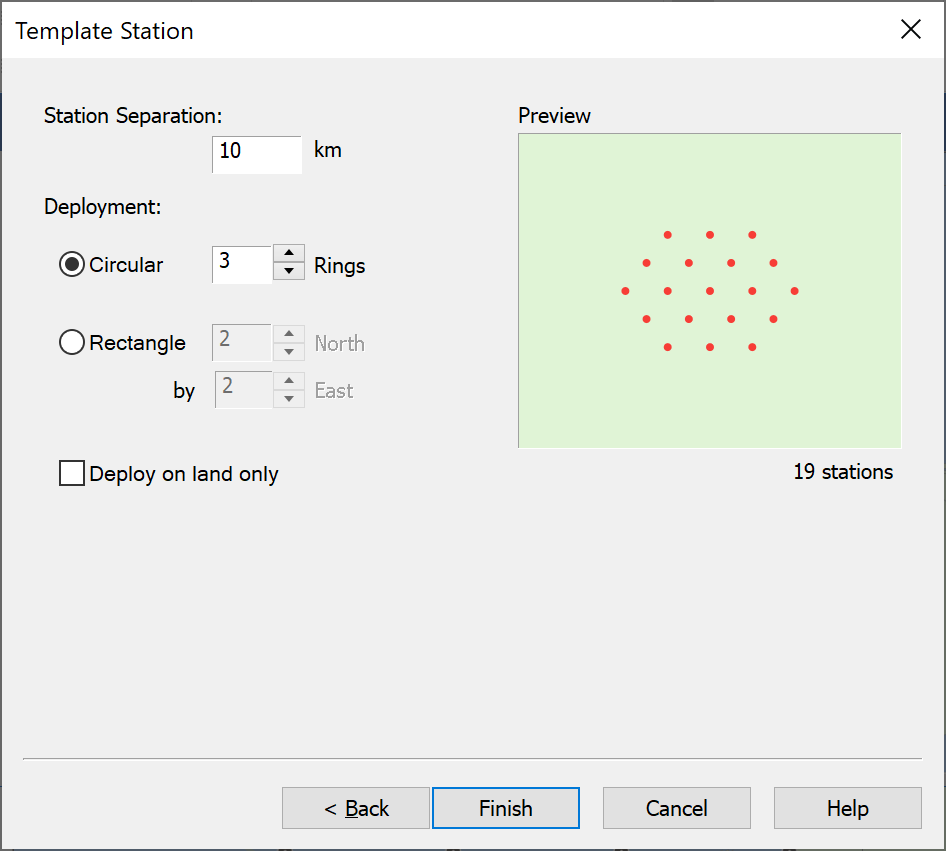
A key field to both is the separation distance between Stations.