Antennas, Stations, Carriers and Links
Now we come to the main modelling elements, through which you define your systems and scenarios.
The structure of the software underlying Visualyse is based on an object-oriented analysis of radiocommunications systems and interference analysis. The objects and the relationships between objects will seem familiar to most engineers.
However, there may be some differences between the Visualyse model and your model of the world of radiocommunications. It is important that the exact structure of the software is understood if you are to gain maximum benefit from the tool.
The following sections describe the Visualyse simulation elements at the top level. Each section provides examples of how these elements map on to objects in the real world and is intended to provide an overview of the structure of the software. This section does not provide a detailed description of the dialogs which is given in Creating and Editing Simulation Objects of this guide.
The fundamental modelling elements that you will need to include in any interference modelling scenario are:
Other elements are:
Antennas
Antenna performance has a significant impact on wanted signal levels and on interference levels. Antenna gain is directional and Visualyse allows you to model this directivity in 3-dimensions in a number of ways.
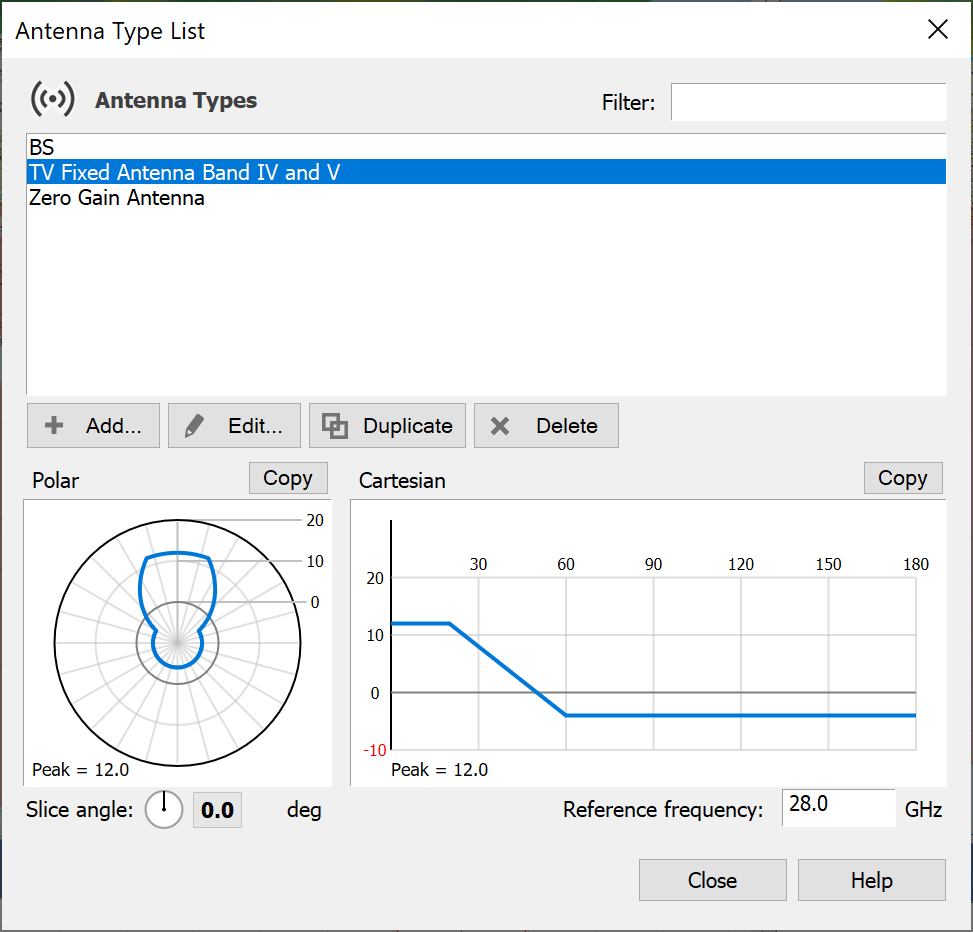
To begin defining a communications system we start by defining the performance of the Antennas that we will use in the modelling. You create and edit antennas either from the Model menu or by clicking the Antenna icon on the Toolbar. The Antenna List will appear.
The figure below shows an Antenna List when three Antennas have been created – by default the List will be empty.
There are several types of Antenna in Visualyse:
- Single beam antennas
- Multiple beam antennas (with many different beams)
- Multiple beam antennas (with many identical beams)
- Spot Beam Pattern Antennas – with spot beams arranged in symmetric patterns
- Satellite PFD mask beams – gain is calculated to provide a given PFD level at defined elevation (or Alpha) angles.
Within each type there are several ways to describe the beams used:
- Circular – defined by data or gain mask
- Elliptical – defined by data or gain mask
- Shaped – defined by data
- Contour – defined by iso-gain contours
Visualyse includes over 80 predefined masks that cover ITU Recommendations, Radio Regulations, ETSI Standards and many other popular masks. Full details are given in the Technical Annex. You can also define roll-off in a look up table.
If your antenna is shaped, you can define a table of gain in two dimensions (antenna pointing angles) or can use GIMS contours. Visualyse provides a simple facility to create and edit GIMS contours.
Stations
The role of Stations is to define the geometry and dynamics of the analysis – where are the transmitters and receivers and where will they be in the future.
Stations also contain Antenna objects and points the Antennas according to one of a selection of pointing methods.
When you create a new Station you are given the option to select from the following types:
- Earth
- Terrestrial Fixed
- Mobile
- Maritime
- Aeronautical
- Geostationary Satellite
- Non-geostationary satellite
Visualyse internally distinguishes Station Types by the information you need to provide in order to define their dynamics.
Carriers
Carriers are used to define the bandwidth and polarisation parameters to be used in the Links. The carrier dialog is also where you can define spectrum masks that can be used in calculating adjacent channel and out of band interference levels.
For basic calculations the carrier defines the bandwidth. Later, when you set up the interference calculation, you will tell Visualyse what to do when the bandwidths of wanted and interfering carrier are different – this bandwidth overlap option can have a significant effect on results.
It is also important to bear in mind that you will be entering power levels later and that you may already have entered the antenna gain for the link that this carrier will use – those three parameters together determine the Power Spectral Density.
If you want to consider out of band or adjacent channel then this is the place where you will define the out of band mask.
Links
Links define how the stations are connected together. There are four types of Link in Visualyse:
- Fixed Links
- Transmit Links
- Receive Links
- Dynamic Links
Examples of the different Link types available in Visualyse are given in the following figures.
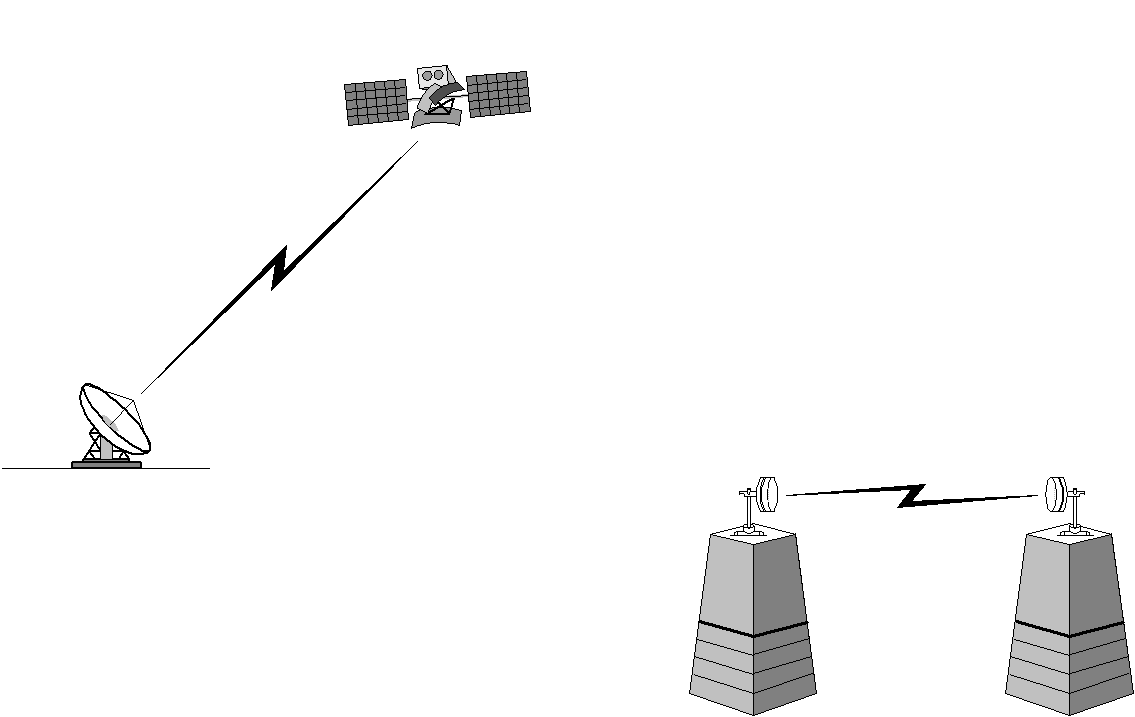
The figure above shows a satellite to ground station link and a terrestrial microwave link. Both these would be modelled as Fixed Links in Visualyse.
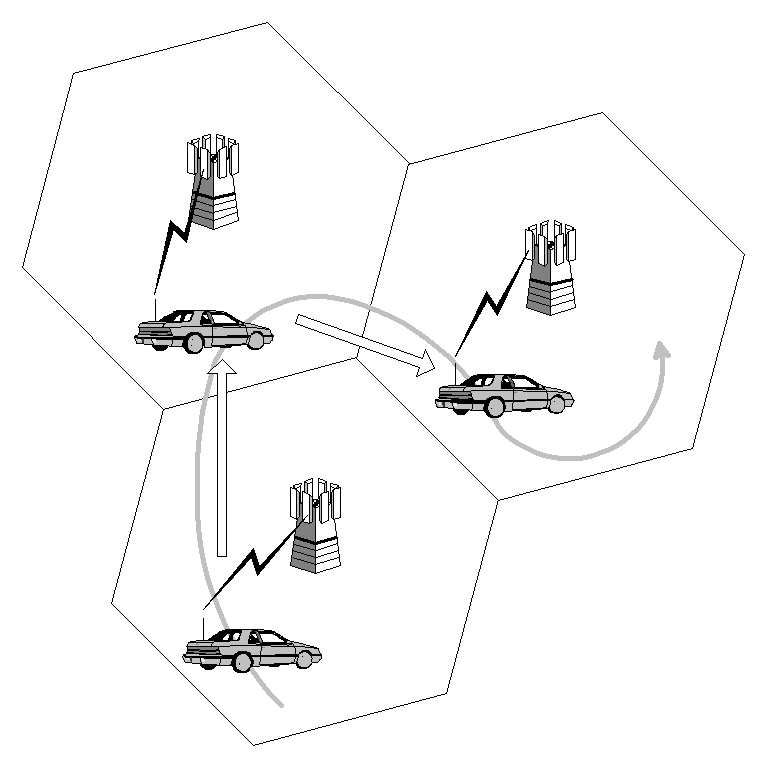
The figure above illustrates the movement of a vehicle through the cells of a mobile phone system. In this case the signal is handed over from base station to base station as the car moves. This would be modelled as a Dynamic Link in Visualyse.
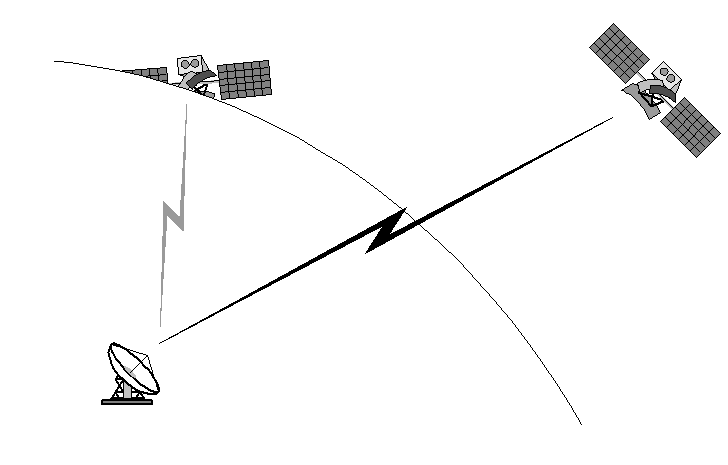
The figure above illustrates the handover from one satellite to another as the first satellite falls below the horizon. This would also be modelled as a Dynamic Link.
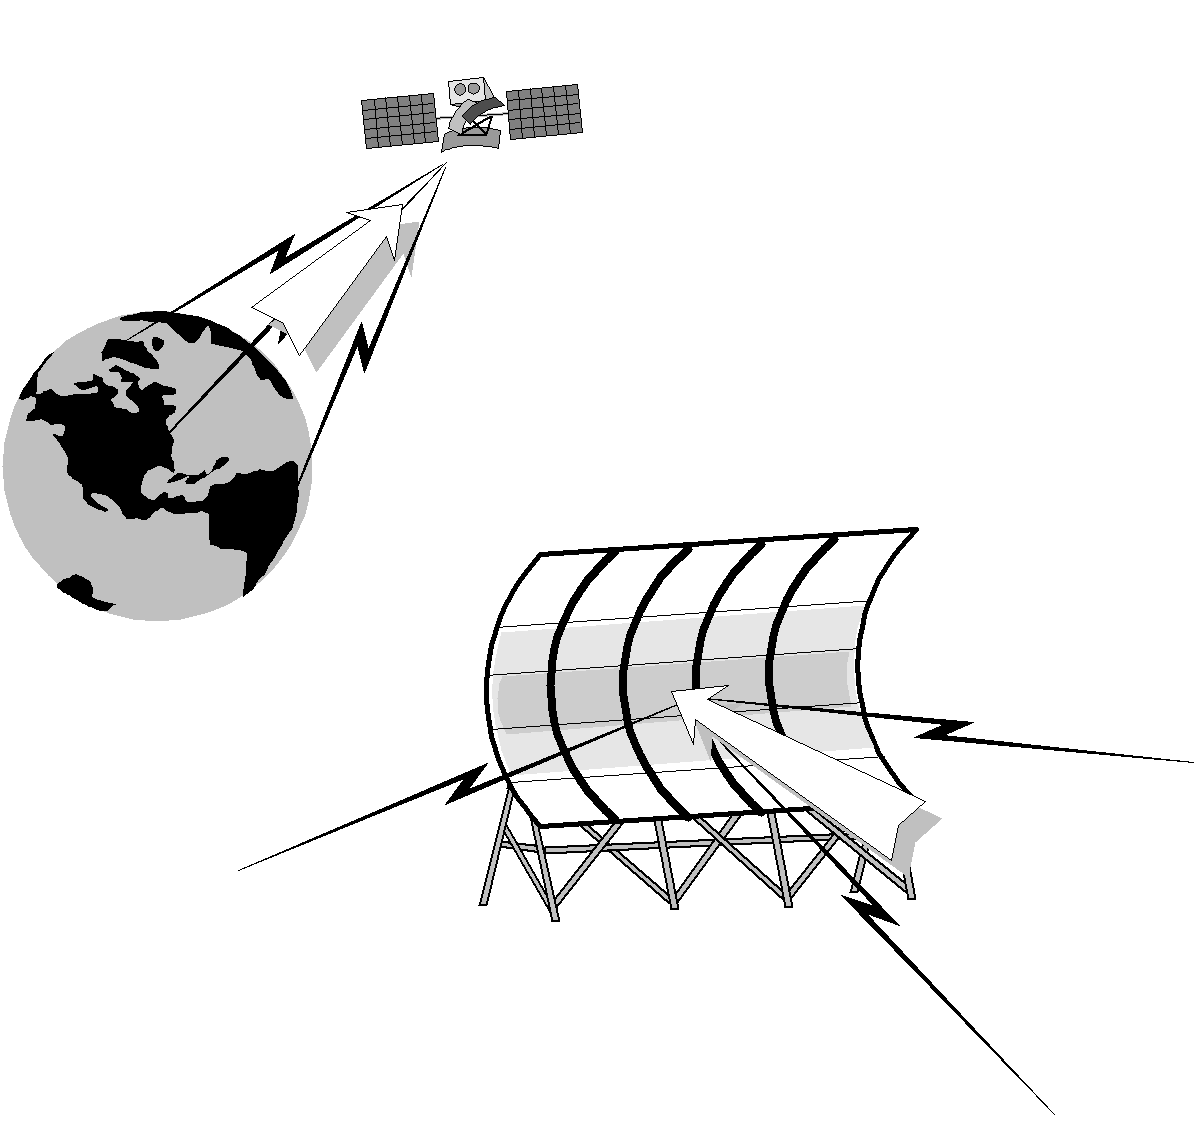
The figure above illustrates two examples that would be modelled as Receive Links in Visualyse.
The first represents an earth observation satellite. The second is a scanning radar dish. In both cases, there is no defined wanted transmitter, and the wanted signal level has a known value or is unused. These links could be used to gather information about interference levels, when the wanted signal level is either known or is not relevant.
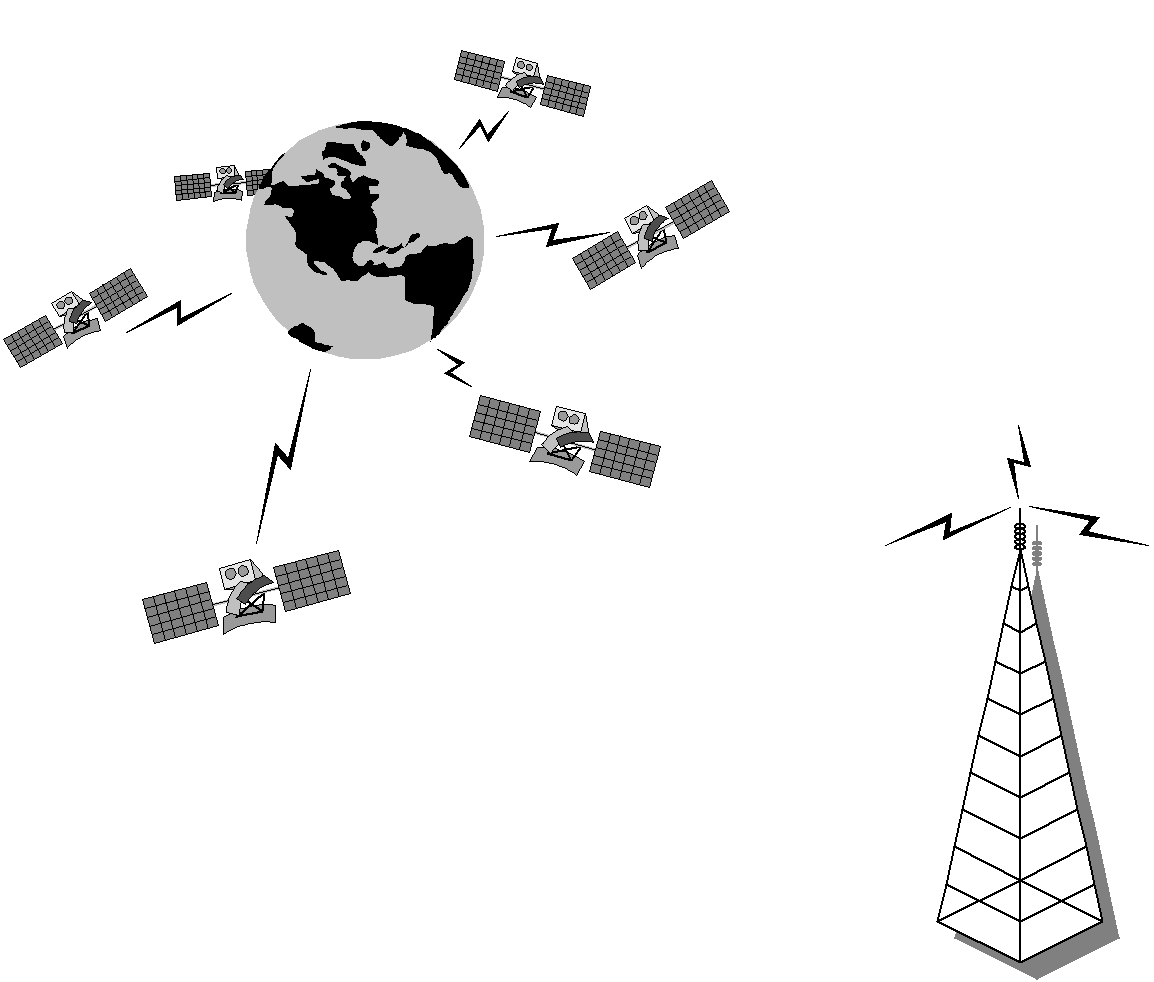
This figure shows two examples of transmit links. The first is a constellation of non-GSO satellites; the second is a terrestrial broadcast station. In cases where these are considered as interferers only, they would be modelled as Transmit Links in Visualyse.
Example Scenario
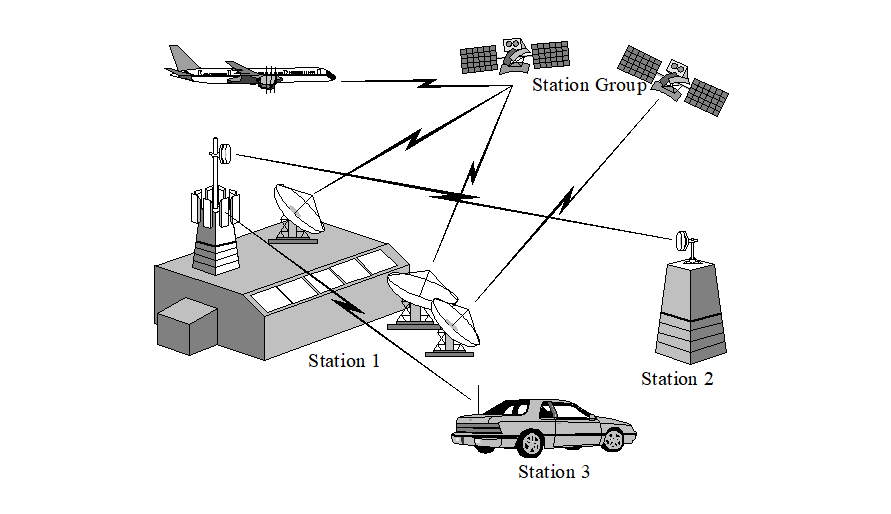
The final figure illustrates an example scenario in which a number of wanted Links of different types have been defined from Stations with multiple Antennas.
Interference Paths
An Interference path specifies an interference scenario. This comprises a wanted link or a group of wanted links and a set of interfering links. The purpose of an Interference Path is to calculate the interference from the interfering links into the wanted links.
Tracking Strategies
Tracking Strategies define the criteria for selecting a tracked station from a group of candidate stations. They are used in Dynamic Links to determine the link end station.
There are two types of Tracking Strategy: Predefined and User Defined.
If you cannot find the strategy you need on the predefined list, then you can define your own as a series of geometric constraints on end station selection.
Station and Link Groups
You may find that a Visualyse simulation can become very large very quickly. This is especially true if you are working with constellations of satellites or large groups of terrestrial links.
Visualyse provides a way to simplify the management of large simulations in the form of Link Groups and Station Groups.
Groups can act as simple containers for stations and links – so that all your victim links are in one group and all your interferers in another, for example – or can represent real world groupings such as satellite constellations or fixed service chains.
Visualyse includes ‘Wizards’ to help in the creation of some groups, making the production of complex scenarios much easier.
Full details are given in the Simulation Elements section of the User Guides.