Radiolocation
This section contains the following examples:
These examples give general methodologies for analysis of sharing between radar and other services which can be extended to other bands and services, such as:
- Compatibility between radar and broadcasting in UHF bands
- Compatibility between radar and radio astronomy around 15 GHz
Radar and Wind Farms Line of Sight
| Action: | Export to Google Earth |
| Modules used: | Terrain |
| Terrain regions: | South West England 30m |
| Frequency band: | Any |
| Station types: | Fixed, Mobile |
| Propagation models: | Free space, ITU-R Rec. P.526 |
This example file analyses sharing issues related to siting of wind farms near radars. There is concern that the rotating blades of the turbines would create reflections that would be hard to filter out and hence reduce the radar’s effectiveness.
The issues were addressed in the report “The Effect of Windmill Farms On Military Readiness” prepared for the Congressional Defense Committees. It identified a number of mitigation methods, but suggested that the only reliable one was to avoid radar line of sight:
“The mitigations that exist at present to completely preclude any adverse impacts on air defense radars are limited to those methods that avoid locating the wind turbines in radar line of sight of such radars. These mitigations may be achieved by distance, terrain masking, or terrain relief and requires case-by-case analysis.”
This simulation file shows how to generate in Visualyse Professional the exclusion zone around an existing radar site where wind farms should not located.
The method is based upon using a terrain database together with the ITU-R Rec.P.526 diffraction model. Where there is no diffraction the path is classified as with the radio line of sight and hence should be part of the exclusion zone. This uses Visualyse Professional’s Area Analysis tool.
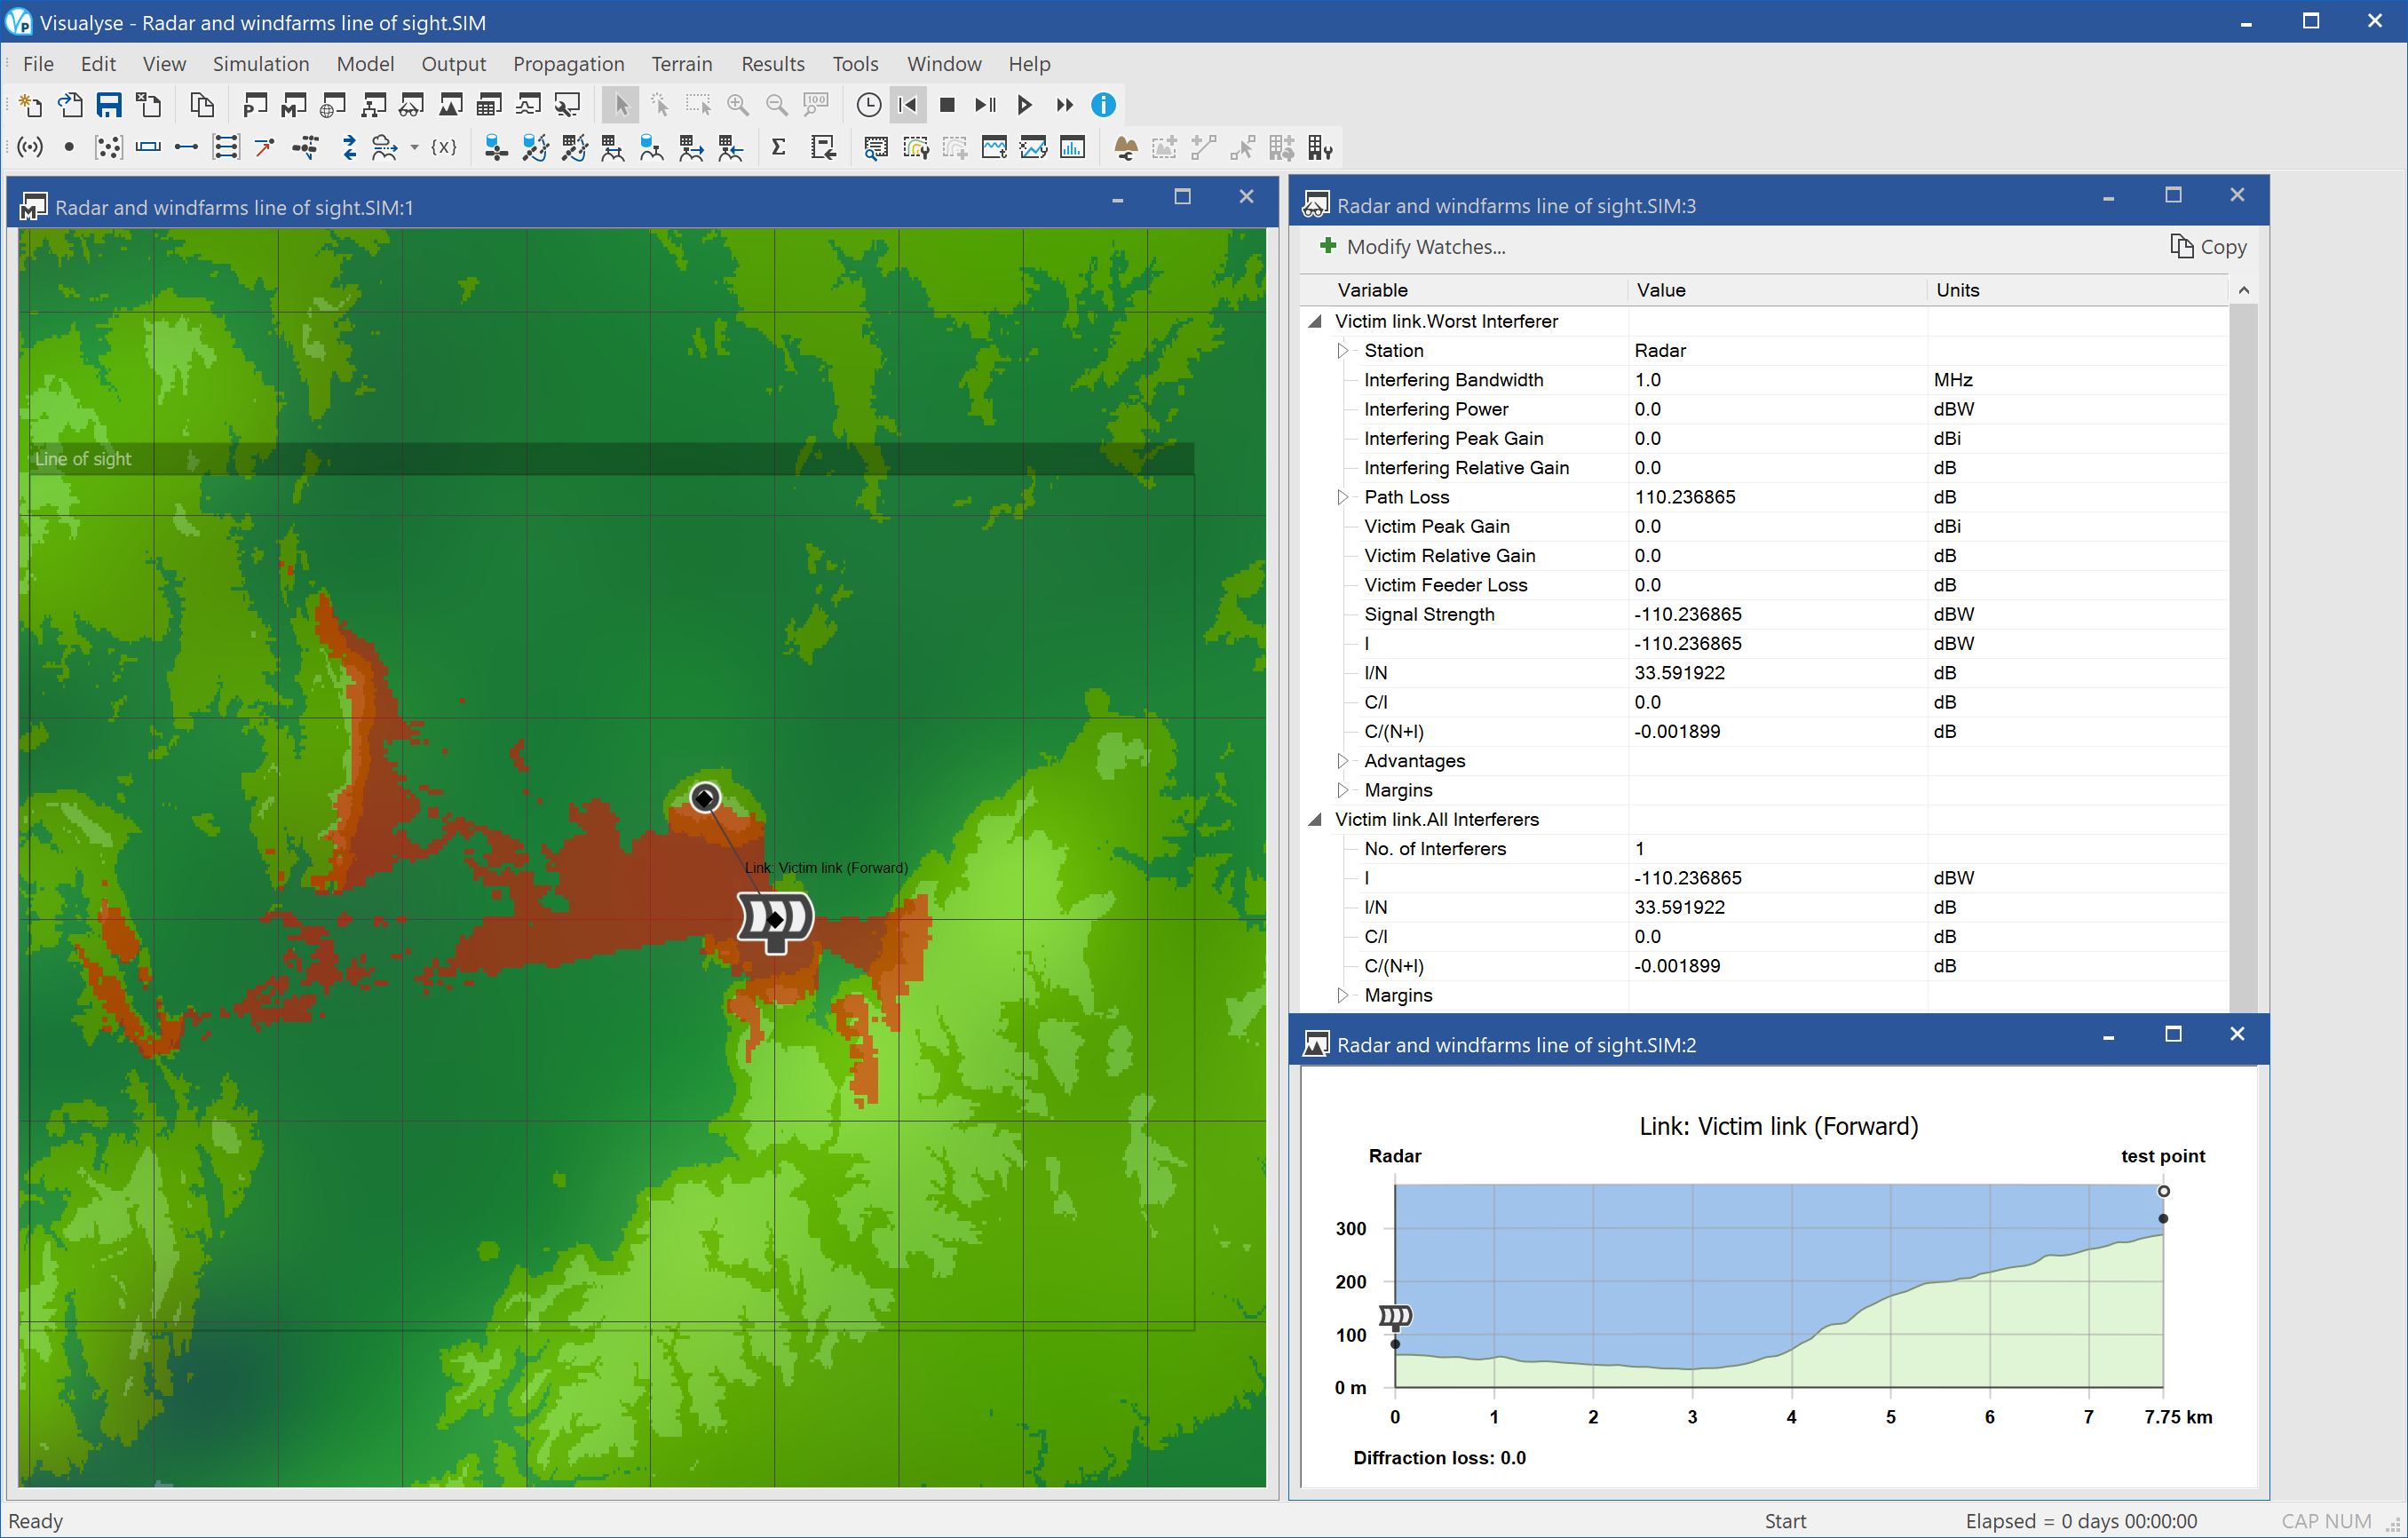
In the screen shot above three windows are open:
- Mercator view (left) showing the exclusion zone created by the Area Analysis, the location of the radar and a test point, and the terrain overlay
- Watch window (top right) showing two link budgets – the wanted signal that uses free space path loss and the interfering path that uses free space path loss with diffraction. As the only difference between the two is the diffraction element, the ratio of the wanted to interfering, is the diffraction term
- Path profile view (bottom right) showing the path through the terrain from the radar to the test point
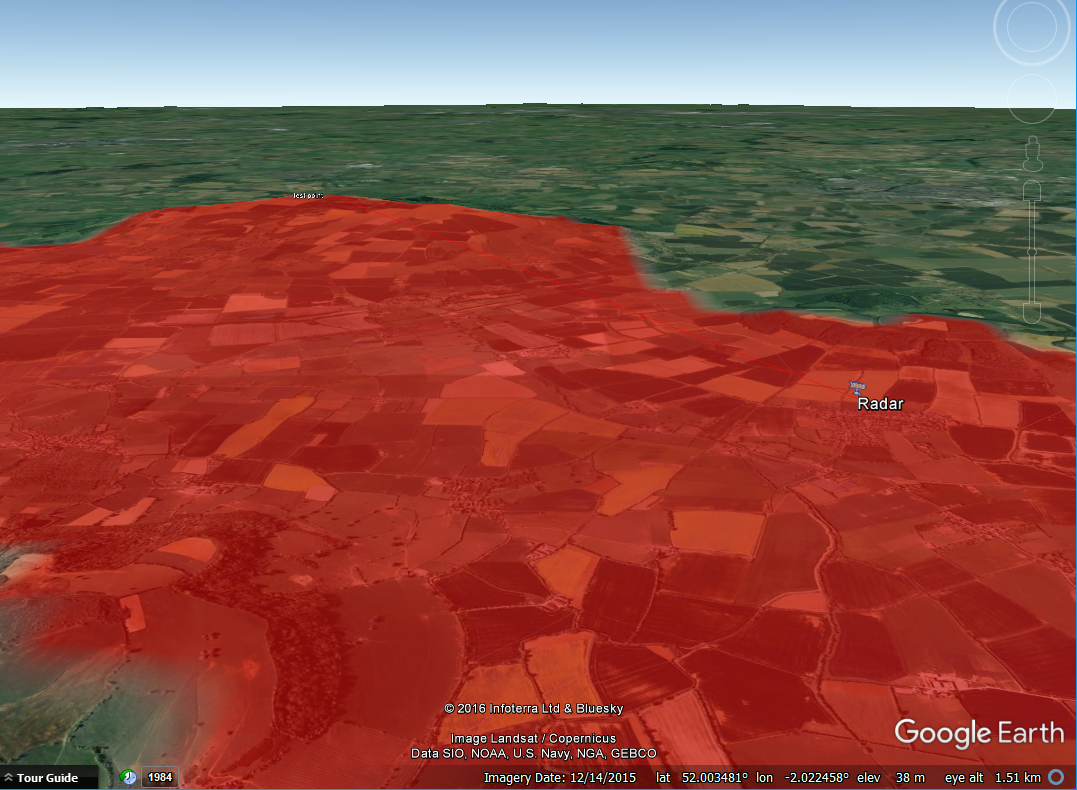
If you select the Export to Google Earth option and configure the tool appropriately you should see something like the figure below. The masking effects of the terrain can be clearly seen.
Radar into IMT BS
| Action: | Export to Google Earth |
| Modules used: | Terrain, IDWM |
| Terrain regions: | South East England |
| Frequency band: | S |
| Station types: | Fixed, Mobile, Other |
| Propagation models: | ITU-R Rec. P.452 |
This example analyses the potential to use bands used for maritime radars for terrestrial mobile services at around 2.9 GHz. This is just above the top of the band 2.5 – 2.69 GHz which is allocated to terrestrial mobile, particularly IMT-2000. It would be useful if 3G services could expand into higher frequencies, but there is the danger of interference from radars. However, if these radars are located on the coastline to provide maritime surveillance then there might be the potential to operate inland.
This example identifies the areas where there could be interference from the radar that could exceed an interference threshold of an I/N = -10 dB at a base station, i.e. considering the mobile uplink. A similar analysis could also be done with the downlink.
A particular characteristic of this scenario is the extreme variation in signal from the radar, due to:
- Pulsed nature of signal at the very small scale of time
- Sweeping of the antenna with rotations in the order of a second or seconds
- Propagation variation between radar site and receiver over periods of months or a year
One method to undertake analysis to identify those regions that would suffer interference due radar antenna main beam or far side-lobe interference, i.e. eliminate the 2nd of these two variations. The impact of the first of these is likely to depend upon details of the victim system, in particular is susceptibility to pulsed interference, hence can be considered separately.
Hence for the purposes of this simulation two exclusion zones are identified: those where the I/N threshold is exceeded by main beam interference and those where it is exceeded even for far side lobes. In both cases we are considering the level that not be exceeded for more than 1% of the time due to propagation variation. The exclusion zones were generated using the Area Analysis tool.
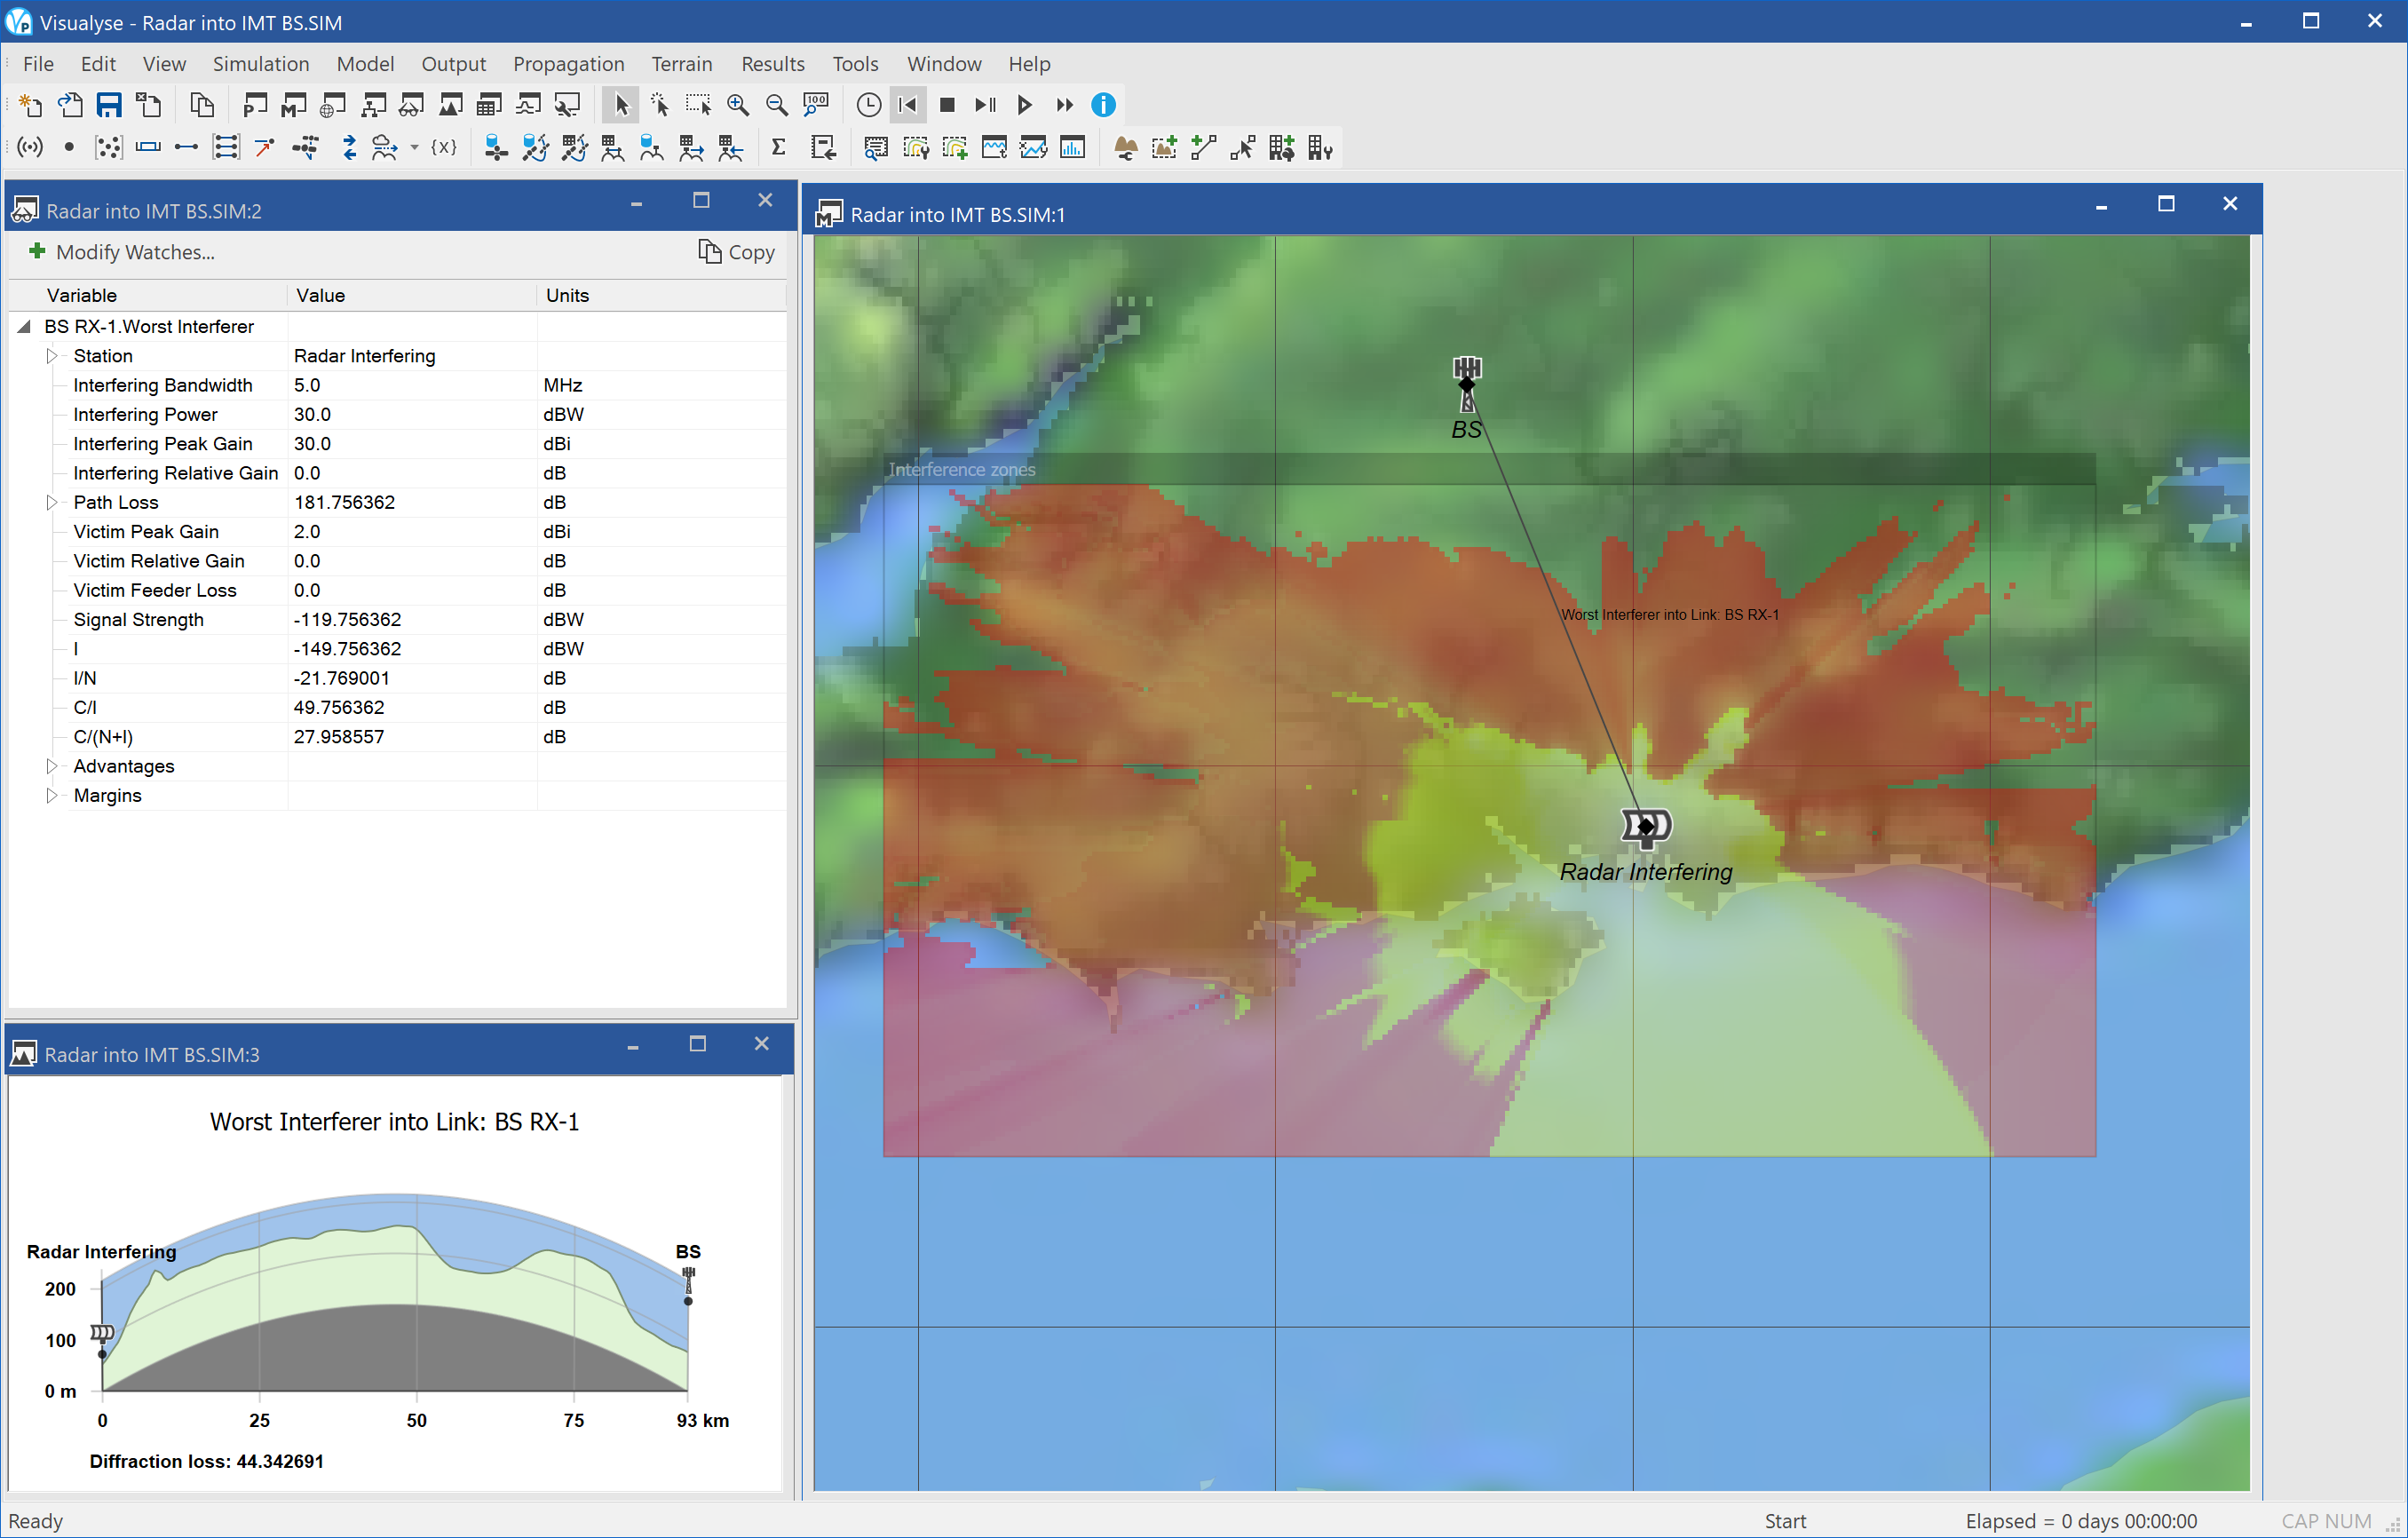
The screen shot above shows three views open:
- Watch window (top left) showing the link budget from the radar to the location of the test IMT-2000 base station
- Path profile (bottom left) showing the path through the terrain from the radar to the location of the test IMT-2000 base station
- Mercator view (right) showing the location of the radar, the two exclusion zones in yellow and red and an overlay of the terrain data.
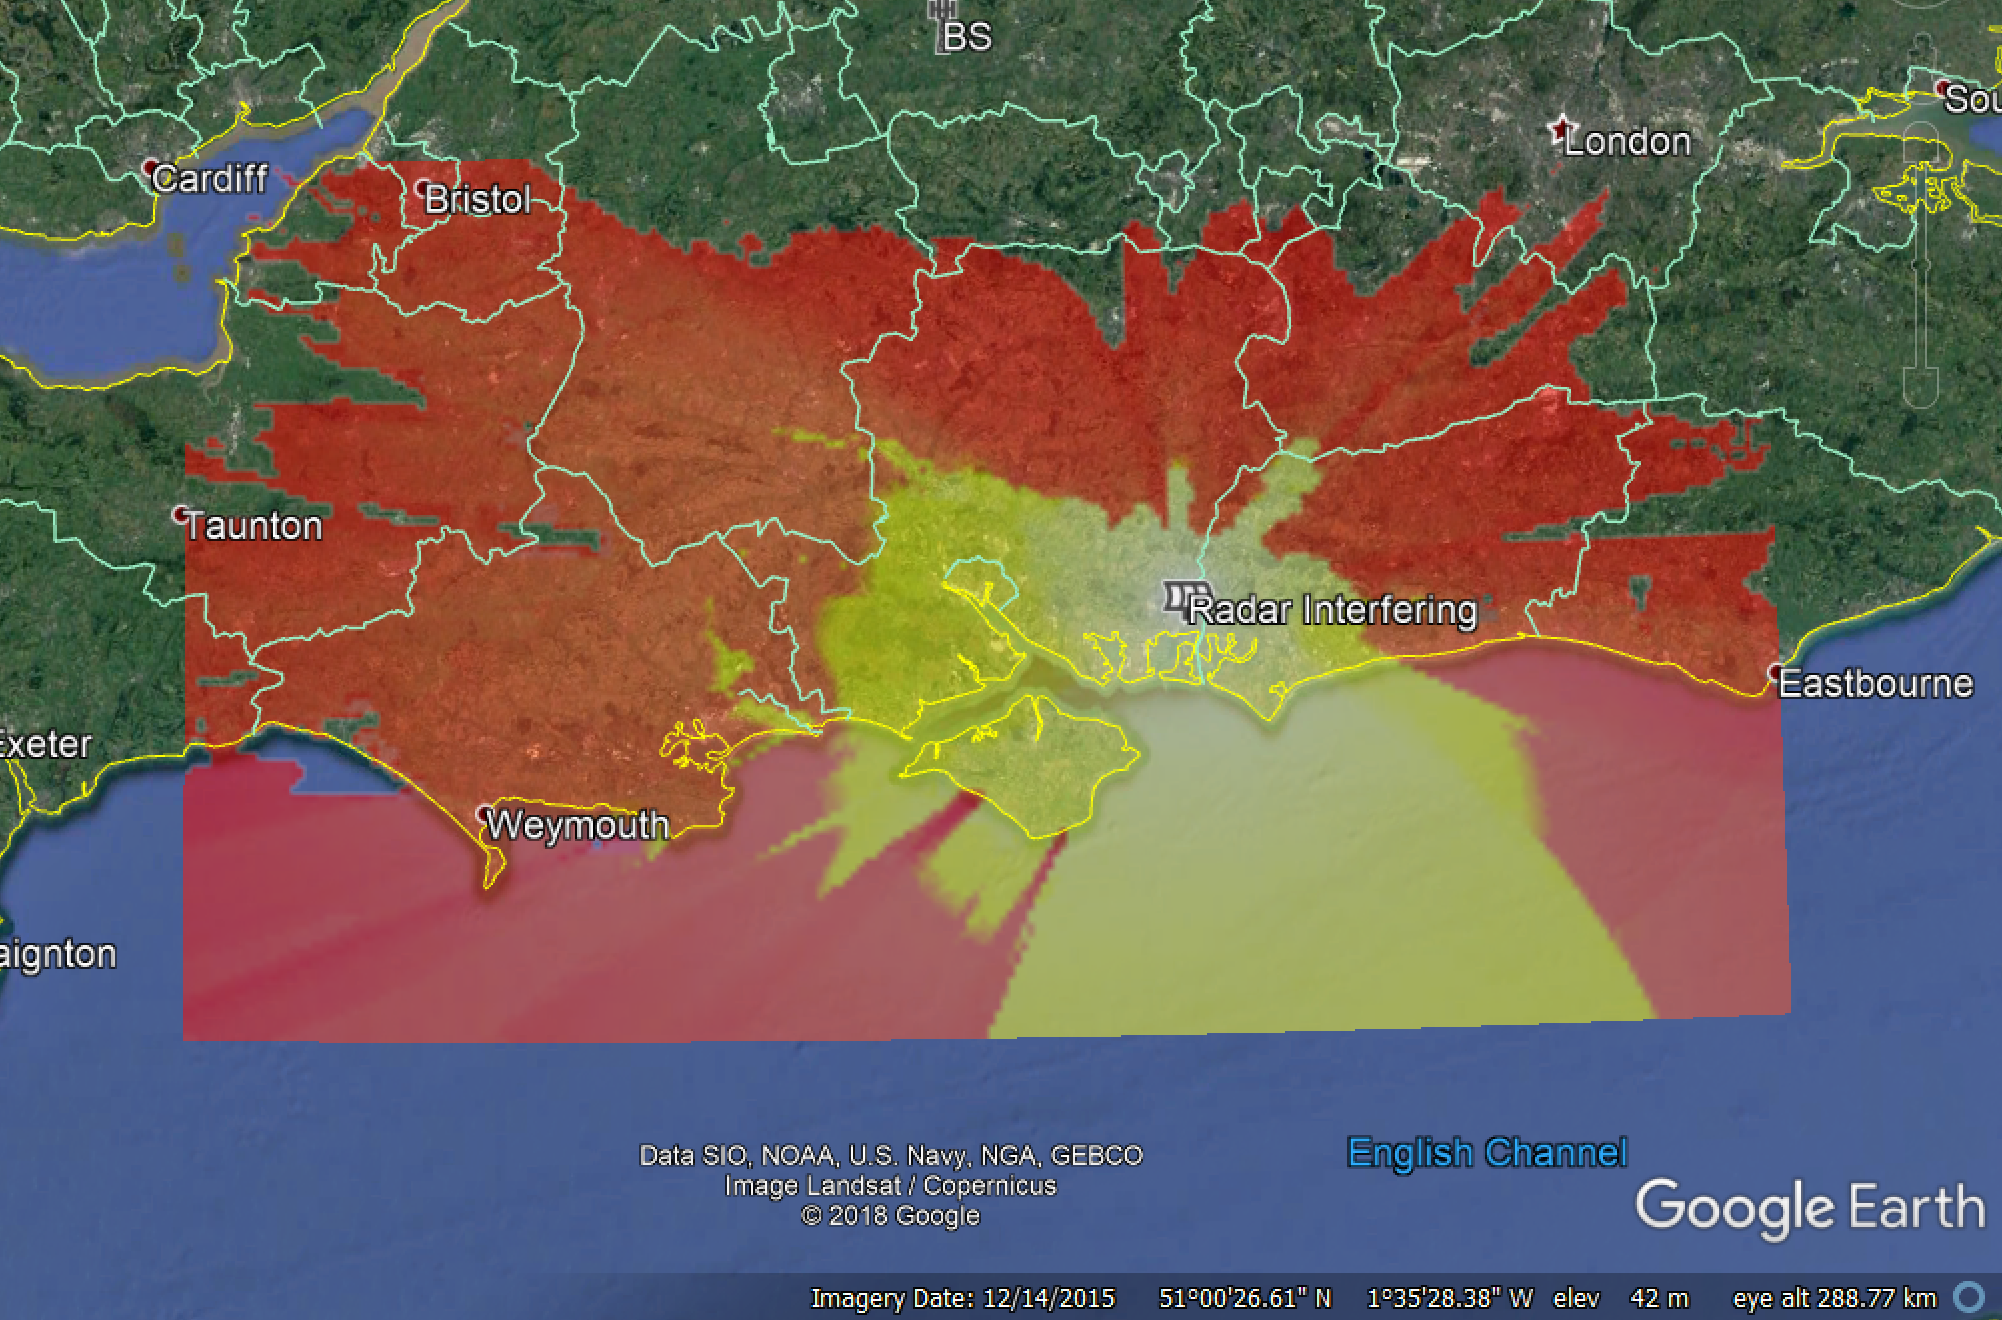
When the Area Analysis is exported to Google Earth the output should look similar to this:
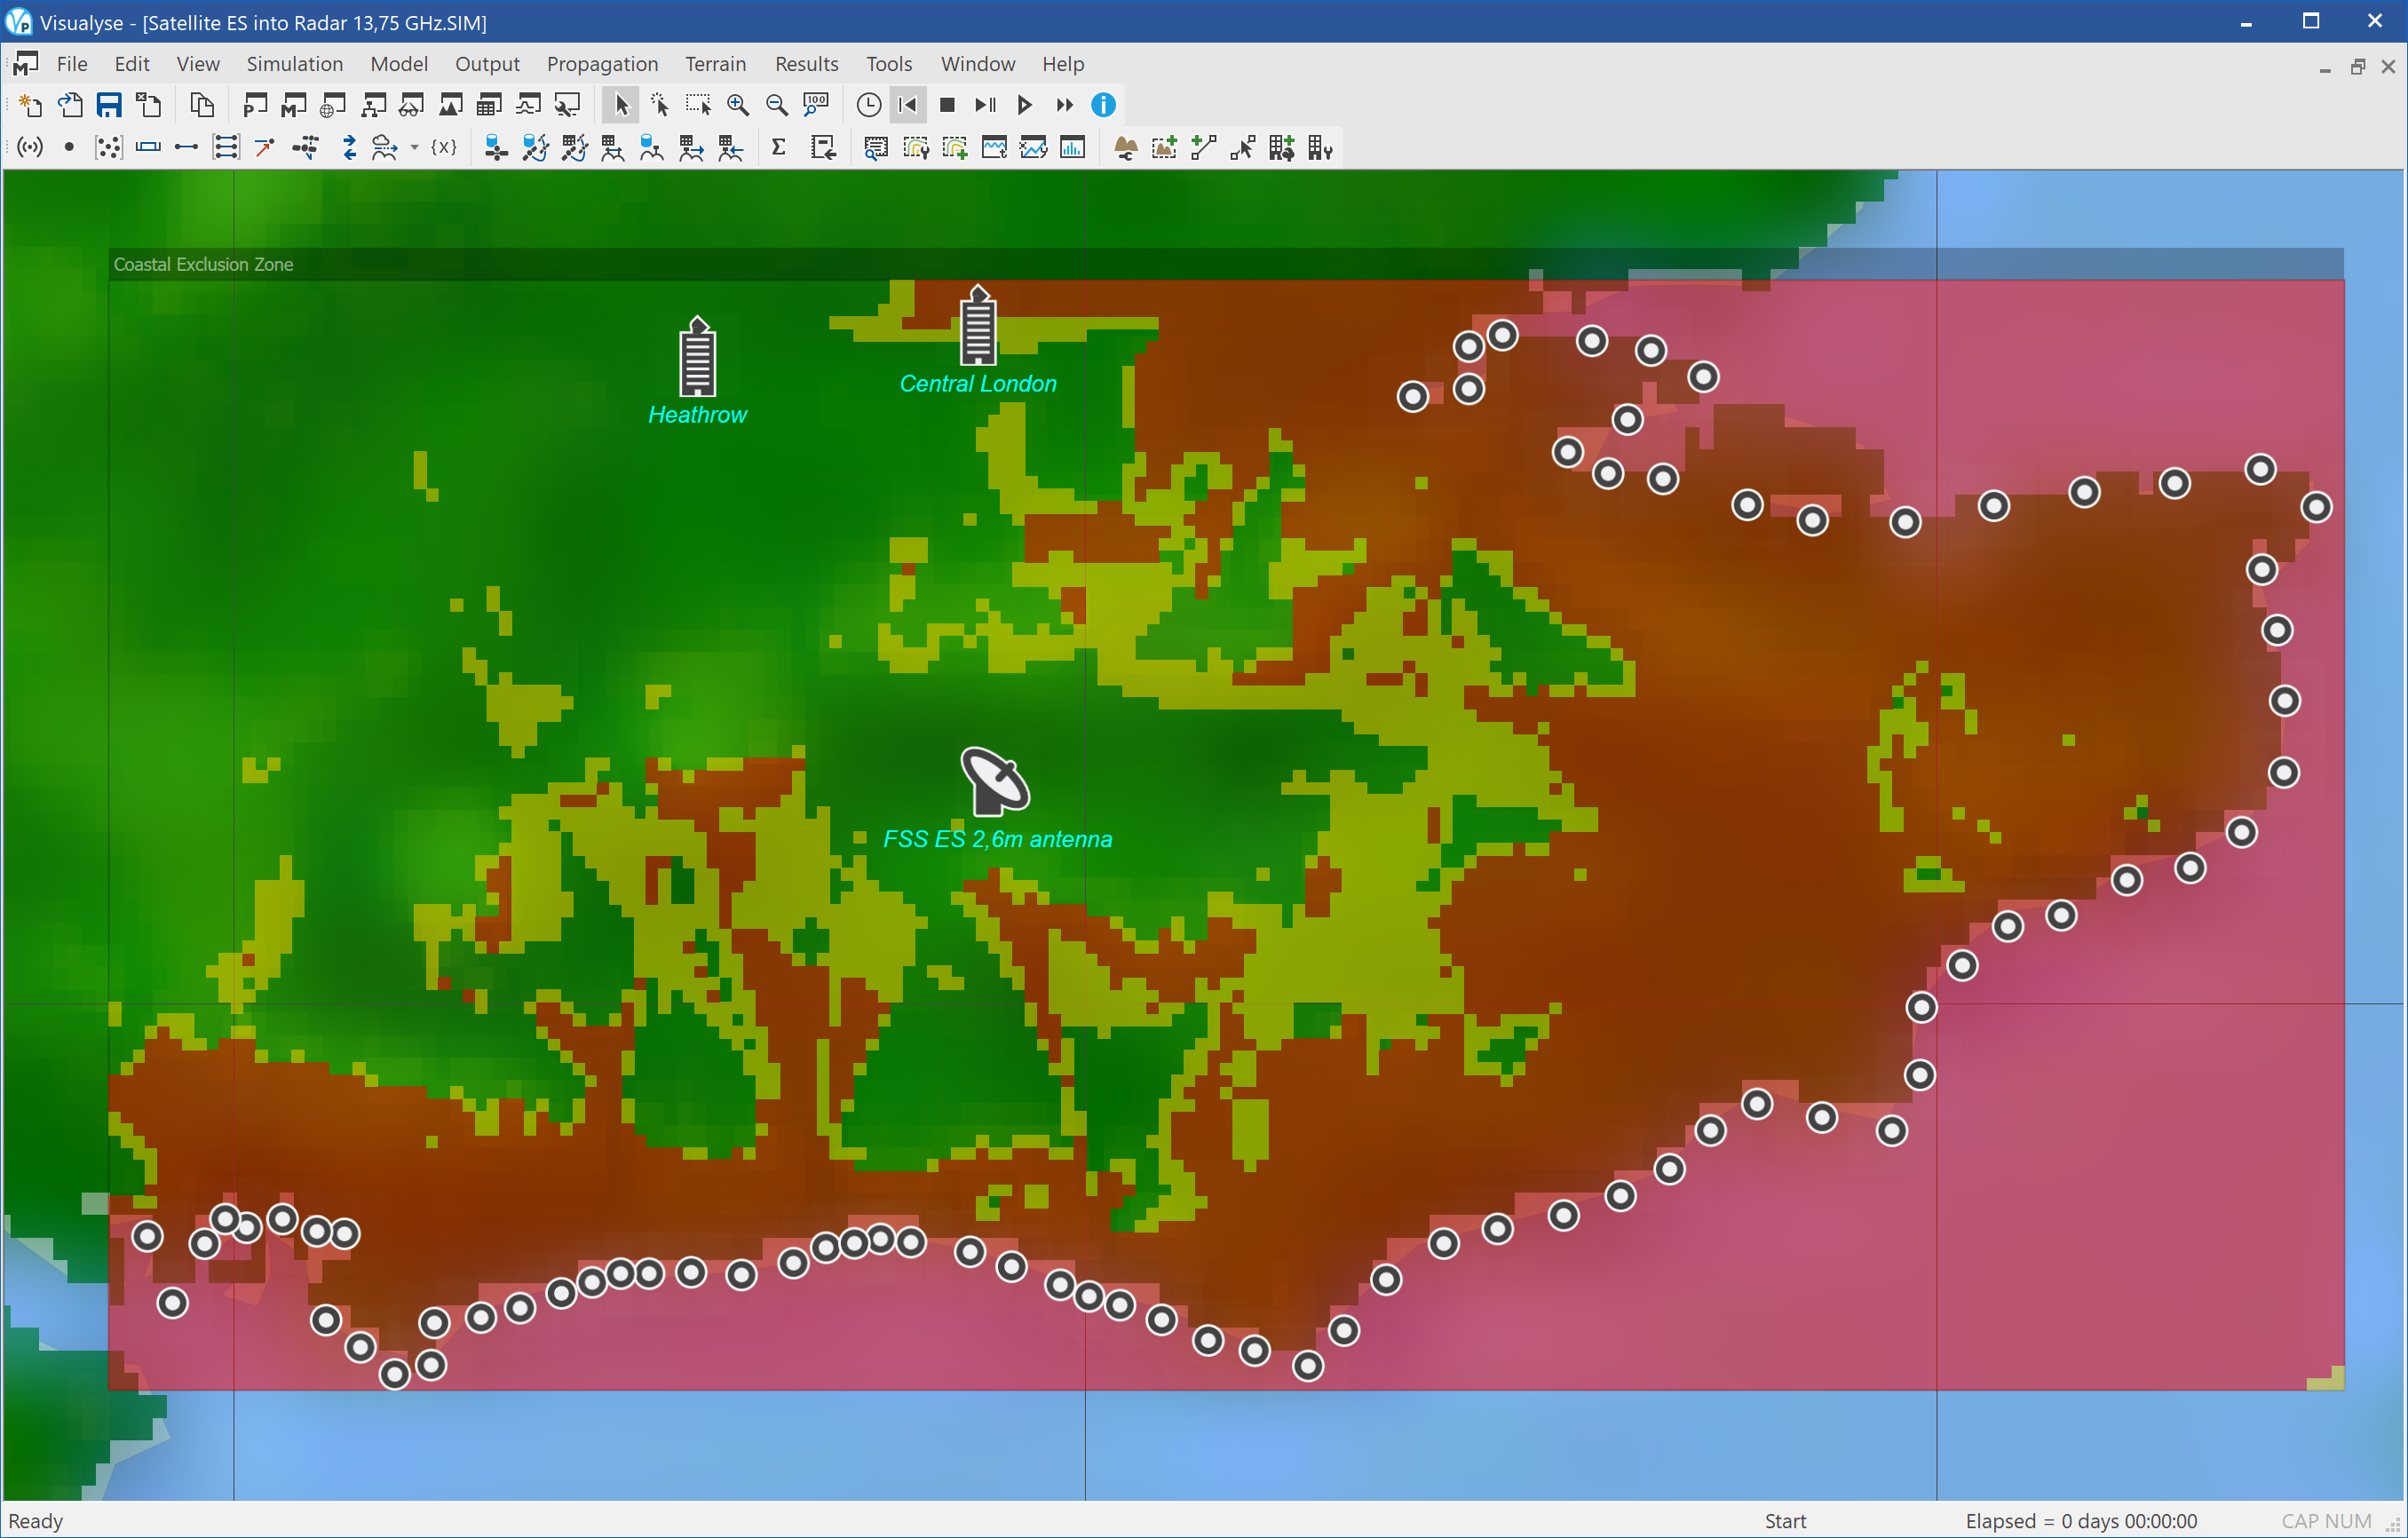
Satellite ES into Radar 13.75 GHz
| Action: | None |
| Modules used: | Terrain, IDWM |
| Terrain regions: | South East England |
| Frequency band: | Ku |
| Station types: | Satellite Earth Station, Other |
| Propagation models: | ITU-R Rec. P.452 |
At WRC 2003 PFD limits of –115 dBW / m^2 / 10 MHz for no more than 1% of time were agreed in Article 5.502 of the Radio Regulations. Recently Study Group 4 has agreed S.1712 which contains “Methodologies for determining whether an FSS earth station at a given location could transmit in the band 13.75-14 GHz without exceeding the pfd limits in No. 5.502 of the Radio Regulations, and guidelines to mitigate excesses”.
This example shows how Visualyse Professional can be used to undertake analysis using the methodologies this Recommendation describes, in particular Method 2 in Annex 2, creation of a contour showing the locations where operation is acceptable as it would not exceed the PFD limits;
Visualyse Professional can also be used for analysis under Method 3 in Annex 3 to determine whether a specific location can be used or whether it would exceed the PFD limits. More information is given in a Technical Note available on request, which goes into this sharing scenario in a little more depth.
The aim of this simulation is to identify those locations where it would be feasible to locate a satellite Earth station and not trigger the PFD limits along a national border or, as in this case, a coastline. This was done by:
- Creating a reference satellite Earth station including antenna gain pattern using ITU-R Rec.S.465
- Creating a set of test points around the coastline and get them to transmit with the same EIRP as the satellite Earth station (this task can be assisted by Visualyse Professional’s service area wizard that can create test points along a country’s border).
- Moving the reference satellite Earth station across the area of interest
- At each pixel within the area of interest, calculating the interference from the test points at the Earth station and taking the worst (i.e. highest value). This corresponds to the highest power at the coastline from a transmitting Earth station at that location
- Colouring in that pixel according to the highest signal at the test point from the coastline (i.e. the highest power at the coastline from the test point)
The figure above shows the resulting Area Analysis. The colour scheme chosen was:
Yellow: interference exceeds the threshold but by less than 20 dB. Hence operation at these points might be feasible if site shielding is used
Red: interference exceeds the threshold by at least 20 dB. Hence operation at these points is unlikely to be approved.
Note the simulation used a 1 km grid and low resolution terrain database: the prediction could be improved using higher resolution terrain data and maybe also a land use database to predict clutter loss.
Export to Google Earth can be used to identify those locations where operation would be permitted, as in the example below.
