Link Group Statistics
When we have a group of Links it is possible to look at statistics in three ways:
- Current time step statistics derived from the values of parameters across all links at a single time step
- By aggregating all parameter values across all Links at many time steps
- By selecting one Link at each time step (according to some criterion), build up statistics over many time steps.
We refer to these options as Statistics Now, Statistics All and Calculation Statistics.
Calculation Statistics
Under Calculation Statistics there are several options for the selection criterion. These are:
- Thermal addition
- Maximum Power Combining
- Take Best/Worst Link.
Thermal Addition
Select this option if you have a Link Group that represents a series of hops in an analogue communications chain. Note that the ordering of the Links in the Link Group will represent the order of Links in the chain.
Under this option, the single value used in compiling statistics is the value on the final Link in the group, but noise is assumed to accumulate along the chain. So the noise in Link 3 has a contribution from the noise and interference on Link 2, for example.
The C/X value used is given by:
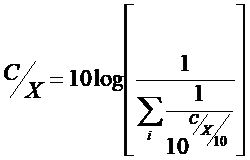
Maximum Power Combining
Select this option if your Links represent diversity paths between the same two points. In this case, the multiple carriers are combined in such a way that they remain in phase, and add in a maximal sense.
The single value at each time step is calculated in Visualyse in the following way (values in absolute, not dB).
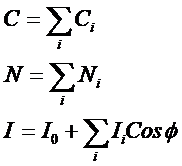
Where Φ is a random angle between 0 and 2π
Worst / Best
Here the contribution to the statistics is taken from worst or best link (according to some defined criterion) at each time step. This could give you the answer to the question ‘For what percentage of time is at least one link suffering interference?’
Choose the third option ‘Take the value of ….’. On this dialog as in others, the bold highlighted text implies a user selection is to be made. Here you can select worst link or best link.
By default, the calculated I statistics will be formed from those Links with the best (i.e. lowest) I and C statistics from the Link with the best C. However you can select the best Link based on any C/X criterion and calculate all statistics and further you can decide to keep with the this Link until the C/X falls below a threshold value.
Let’s look at an example to see why these features are present.
Consider a Gateway Station tracking a constellation of non-GSO satellites. You want to know the interference statistics into the downlink to that Gateway. At any one time, the Gateway may be tracking, say four satellites. The Satellite used for the communications Link will initially be the one with the best BER (or C/(N+I)), but this will be used until the BER rises above a certain value (or equivalently C/N+I falls).
To simulate this, set up four links in a System Link Group and choose best Link by C/(N+I) and stay with a Link until C/(N+I) falls below the threshold.
Example of the Three Types of Statistic
The following example illustrates how the different statistics are derived from all the possible values.
The table below shows the C/I for 3 Links over 4 time steps
| Link | t=0 | t=10 | t=20 | T= 30 |
|---|---|---|---|---|
| 1 | 25 | 21 | 15 | 17 |
| 2 | 27 | 18 | 8 | 14 |
| 3 | 22 | 23 | 22 | 24 |
Statistics Now would consider at each time step the distribution of C/I. So at t=20 this would be the three values C/I = {15, 8, 22}.
Statistics All would be the 12 values C/I = {25, 21, 15, 17, 27, 18, 8, 14, 22, 23, 22, 24}.
If Calculation statistics was using the worst case, then the worst value at each time step would be used, and the distribution would be the four values C/I = {22, 18, 8, 14}