Visualyse Statistics Collection
The following parameters are gathered:
- Worst data value and simulation time of worst data value
- Average data value (this is a mean value)
- Standard deviation of range of data values
- Number of events
- Longest event length and time of longest event
- Average event length
- Probability distribution of data values
The probability distribution is created using an array of bins using the bin size specified. Visualyse puts values in the bin by rounding down: hence if the bin size is 1 dB and the C/N = 18.3 dB this will be placed in the 18 – 19 dB bin which is labelled as 18 dB.
Where appropriate, Visualyse will calculate statistics in dBs or in absolute value. In some cases, the parameter values may be mathematically undefined if they are collected and calculated in dB. Visualyse will return values for these statistics based on default dB values – for example if there is no signal level (0 watts) Visualyse defaults to a value of -3000 dBW.
Link Interference Statistics Collection
Interference statistics collection is specified at simulation level. You choose what interference statistics you want to collect and whether these statistics should apply to just wanted Links and Link groups or all the Links and Link groups.
To allow for special cases, can override the document level settings in any Link or Link Group object.
To specify the statistics you wish to collect, select Statistics Collection from the Output menu. This will display the Statistics Collection Options dialog.
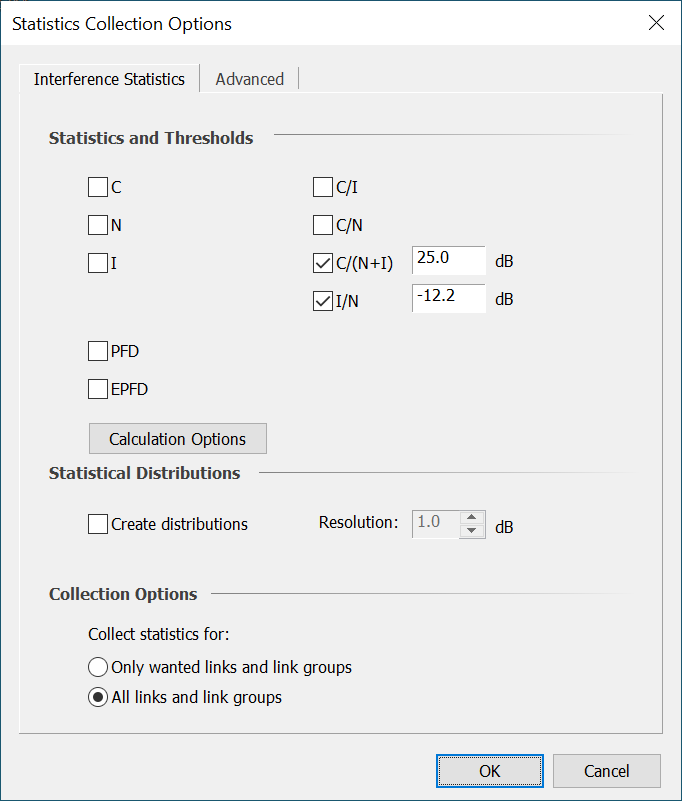
The dialog has two tabs. The first of these is the Link Statistics tab. This allows you to choose which Link and Link Group interference parameters you want to look at.
To choose an interference parameter simply check the appropriate box. A threshold can then be specified for this parameter. The threshold is used by Visualyse to define an interference event when calculating percent time interference is seen or the number and length of interference events.
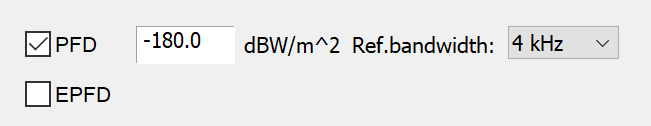
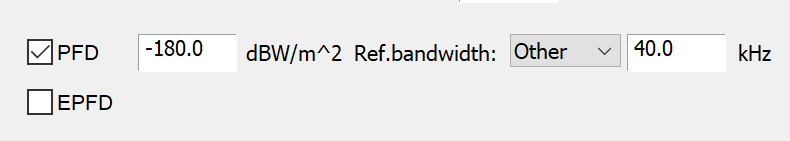
For PFD and EPFD there are additional options for specifying the reference bandwidth. Note that PFD and EPFD cannot be selected at the same time. If you switch one on, the other will automatically switch off.
A separate option allows you to say whether you want to generate histograms (probability distribution functions). If this option is chosen, a histogram is created for each of the selected interference parameters. The size of the bins (the resolution) of these histograms can also be specified.
Finally, you can choose whether the statistics are collected for all Links and Link Groups or just for wanted Links and Link Groups.
Statistic Calculation Options
The “Calculation Options” button allows you to define whether the statistics for each of the standard link metrics are calculated in dB or absolute. For example, when calculating the “mean I/N” is it the mean of the I/N in dB or the I/N in absolute?
The Statistics rounding option relates to creation of histograms and cumulative distribution functions (CDF). Given a value of say -155.5 dB, should this be referenced to the -155 dB bin or the -156 dB bin? The choice could relate on whether the value is better high (i.e. a wanted signal) or better low (as in an interfering signal). This option allows the bin rounding direction to be chosen.
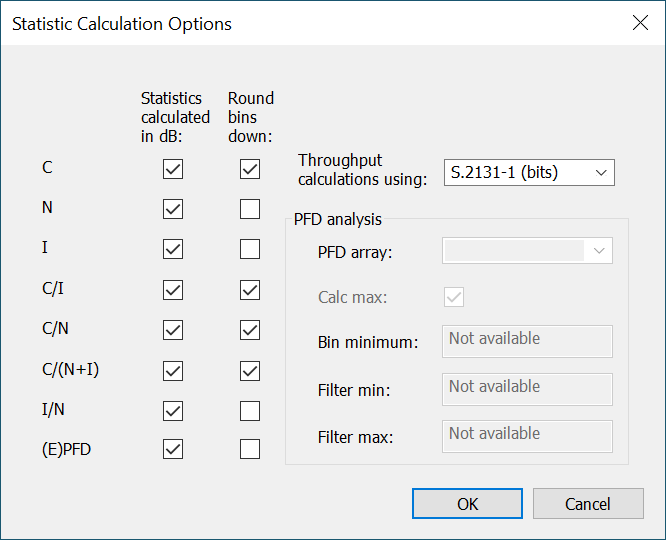
The Throughput options are described in full in the technical note: Spectrum Efficiency and Throughput Calculations
The PFD analysis options are described in full in the technical note: PFD Analysis Features
User Defined Statistics
There is a second tab labelled the Advanced tab.
From this tab you can choose any parameter in the simulation and collect statistics on that.
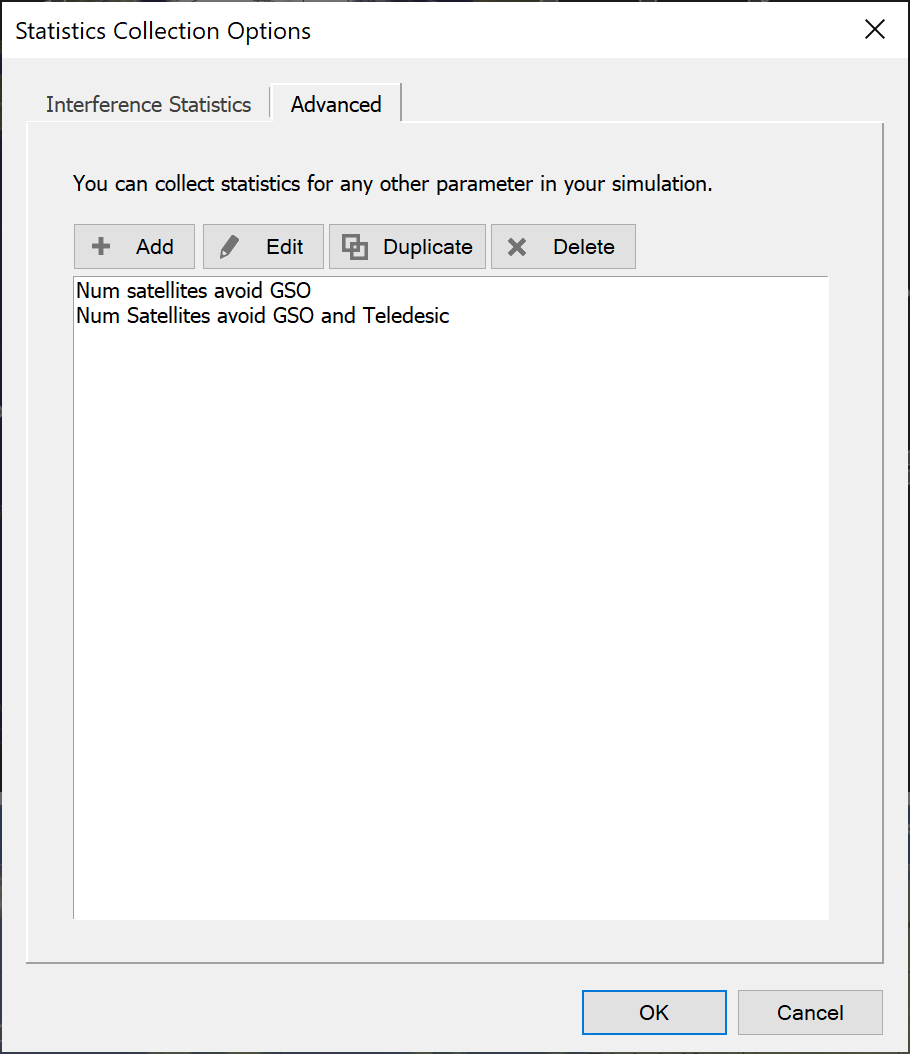
Click the Add button to add a new variable to the list. This will bring up the Statistics dialog.
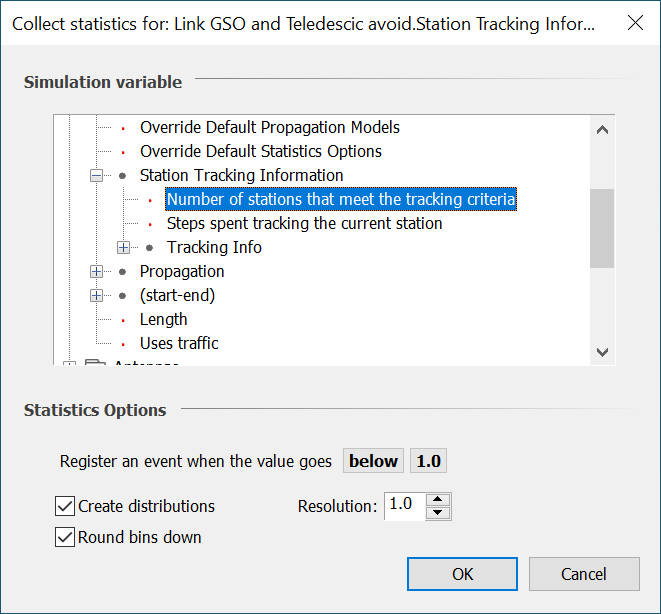
The Variable is selected from the Object Tree, a Criterion Level is set and the resolution of a probability distribution (if being collected) is defined.
The Criterion value can be either a maximum or minimum above or below which Visualyse will record an event.