The View Results Dialog
The Results dialog provides a way to look at what Visualyse has calculated numerically (see Graphing for details on examining results graphically).
The Results dialog allows you to look at snapshot link budgets at a specific time and also at statistical results collected over the course of a dynamic simulation.
Results seen in the dialog can be copied and pasted, exported or plotted immediately at the press of a button.
Results are presented in terms of Links, Link Groups and Other User Defined Statistics. By default, the results list shows all the results available in the simulation.
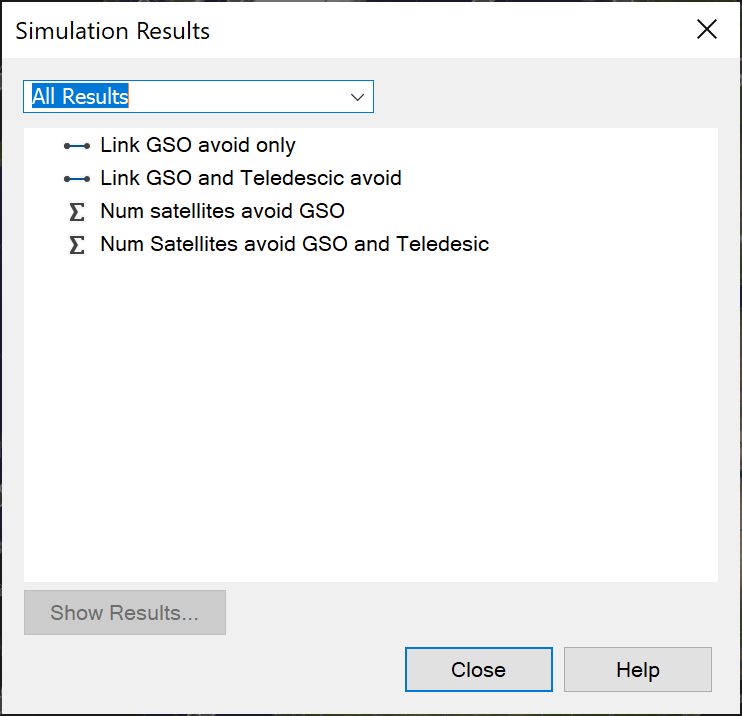
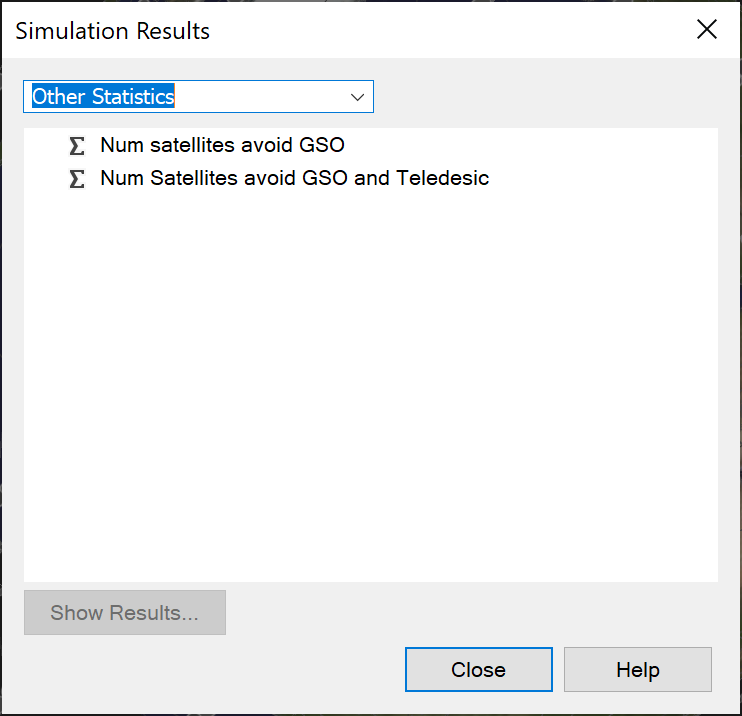
The list can be filtered to show just Link Results, Link Group Results or User Defined Statistics results – simply select the option you require in the top left of the dialog (as shown below).
To view a result, select the object of interest and click the View Results button (or double click on the object in the list).
The example below shows what the results may look like for a single link.
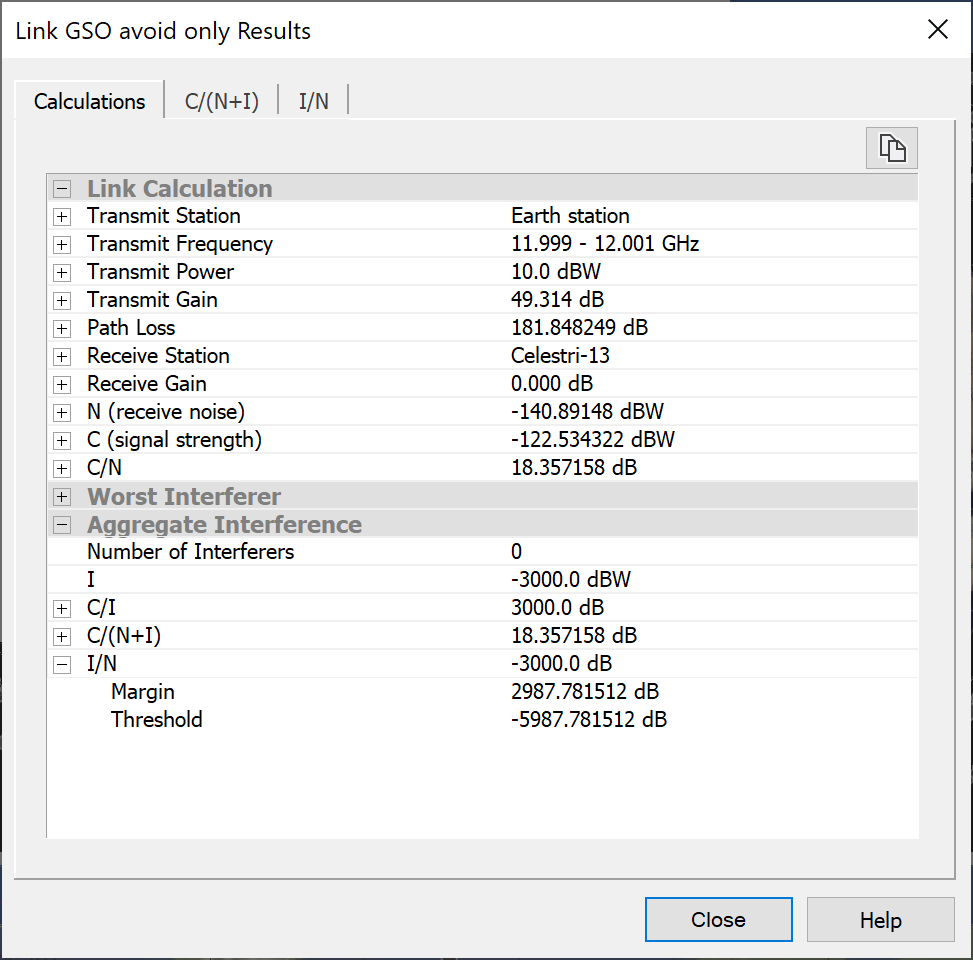
The results show the current Calculations on the first page. Details of the Link Budget and any interference are shown. For the Link Budget, details of the route (transmit/receive station antenna and beam), frequency, EIRP, losses and gains are listed.
The arrow to the left of any entry in the Calculations page indicates substructure and clicking the arrow will expand the item.
The data displayed can be filtered using the filter boxes at the top of the dialog.
The dialog will also include a tab for each type of statistic being collected. The tab will show current statistical information on the parameter named at the top of the tab.
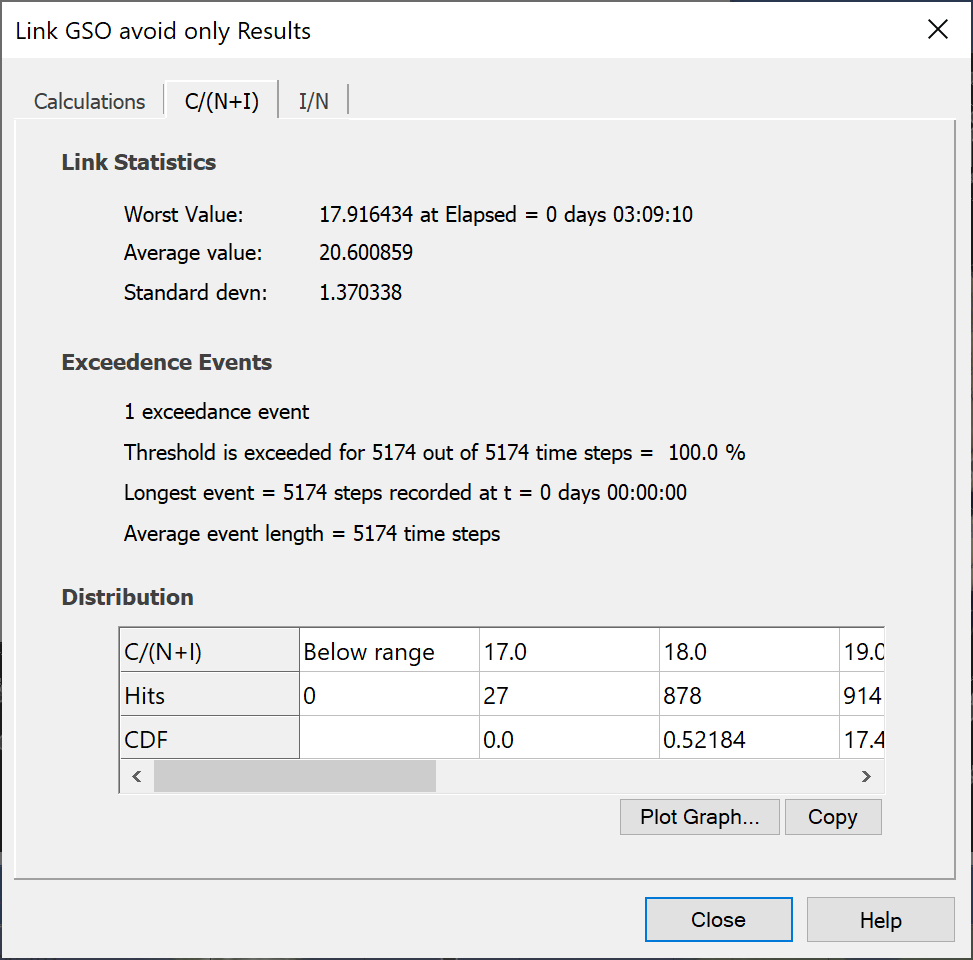
Statistical values given are:
- The worst value
- The average value
- The standard deviation
If some of the values show interference in excess of the defined criterion, the dialog will also show:
- The number of exceedance events
- The % time that the threshold was exceeded
- The longest single event
- The average event length
The probability distribution of the statistics is shown in a grid at the bottom of the dialog. You can copy this grid for further processing and you can plot a cumulative distribution (on an Analysis Graph) by just pressing the plot button at the bottom right.