Graphing
There are three types of graph available in Visualyse:
- Data vs. Time Graph - time stepped interactive plot of a variable against time
- Data vs. Data Graph - the display of any two variables on an XY scatter plot.
- Distribution Graph - the display of probability distributions, and cumulative distributions for interference and user defined statistics.
Graphs are created from the Results menu or from the toolbar icons:
All graphs can be configured via the Chart Settings dialog, invoked by a right mouse click on the graph area, or from the 'Properties' option of the View menu item
Data vs. Time
A Data vs. Time graph allows up to six variables in the simulation to be watched as they evolve with time. The Data vs. Time graph dialog can be invoked by selecting the Data vs. Time graph item from the Analysis Menu, or by a mouse click on the Data vs. Time graph icon, ![]() , on the main toolbar.
, on the main toolbar.
The Data vs. Time graph definition dialog is shown below.
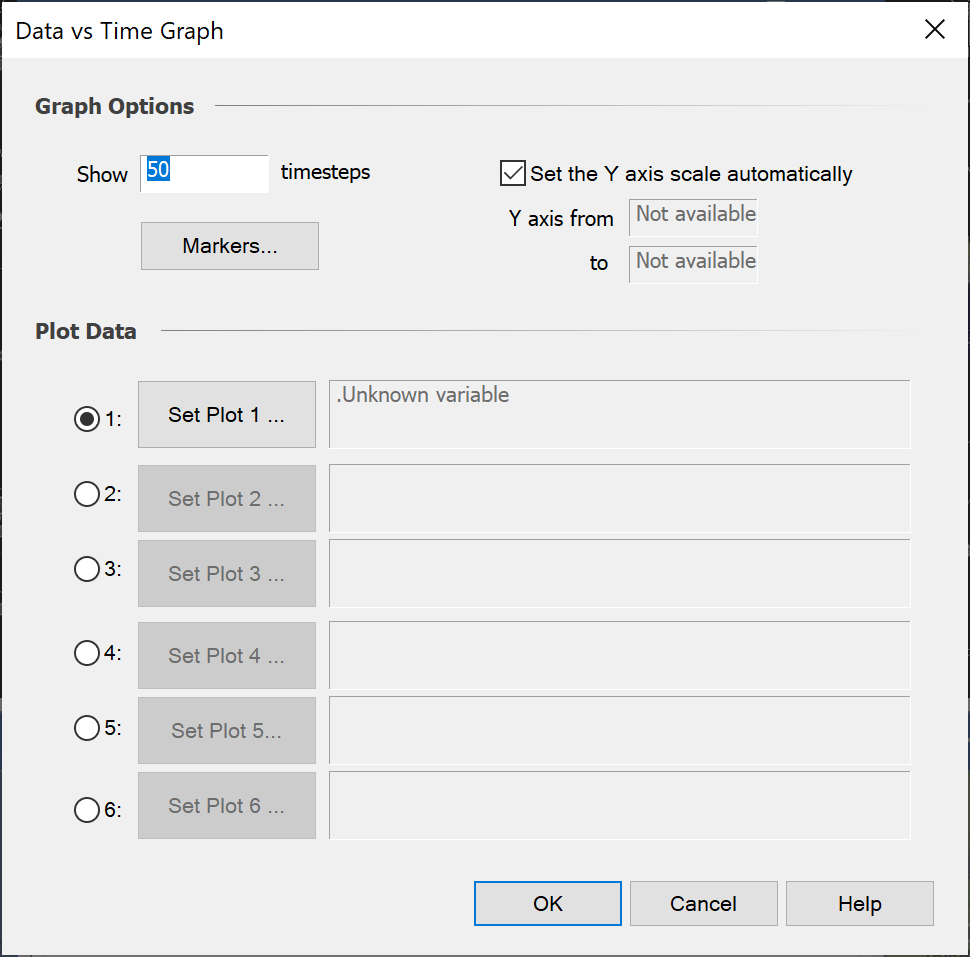
The number of time steps to be displayed can be changed in the top left of the dialog. The default is 50; the upper limit imposed by Visualyse is 1000.
An option to automatically scale the Y-axis can be selected at the top right of the dialog. This will continually adjust the Y axis range, based on the range of data values in the plotted data set.
If the automatic axis scaling option is not chosen, the minimum and maximum expected values must be specified. These default to values that depend on the type of variable to be plotted and on the current value of that variable. For example, in the case of C/I 60 dB is considered to be a reasonable range. If Data vs. Time graph is invoked when the value is 25 dB, the default maximum and minimum expected values will be 55 dB and -5 dB.
The best option here is for the user to define maximum and minimum expected values based on experience or an understanding of the problem.
Markers
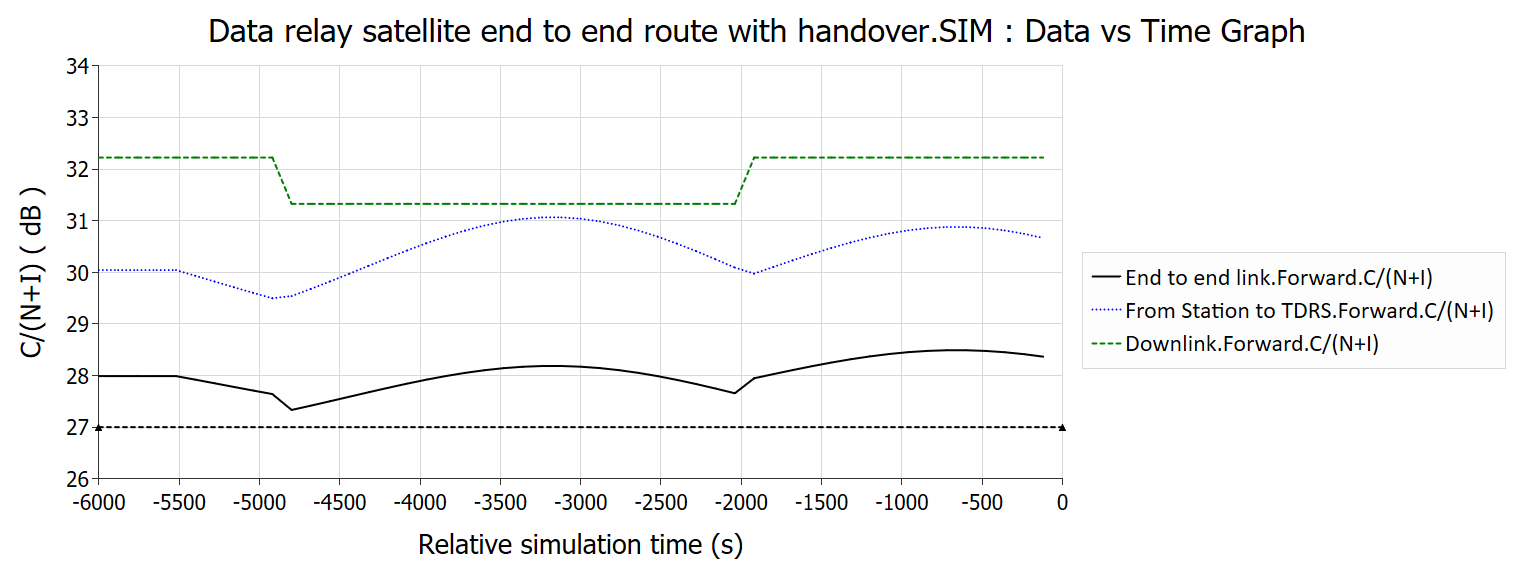
The 'Markers...' button allows markers or lines to be added to graphs at defined fixed points. On a Data vs. Time graph this can be used to add a line at a reference, threshold value, as shown in the example below.
Up to six variables can be simultaneously plotted. Select the number of plots required then set the variable for each plot via the ‘Set Plot n’ button.
Select Data vs Time Variable
To select the variable to be plotted, click the ‘Set Plot’ button. You can then choose to plot Link parameters, or any other variable selected from the simulation object tree.
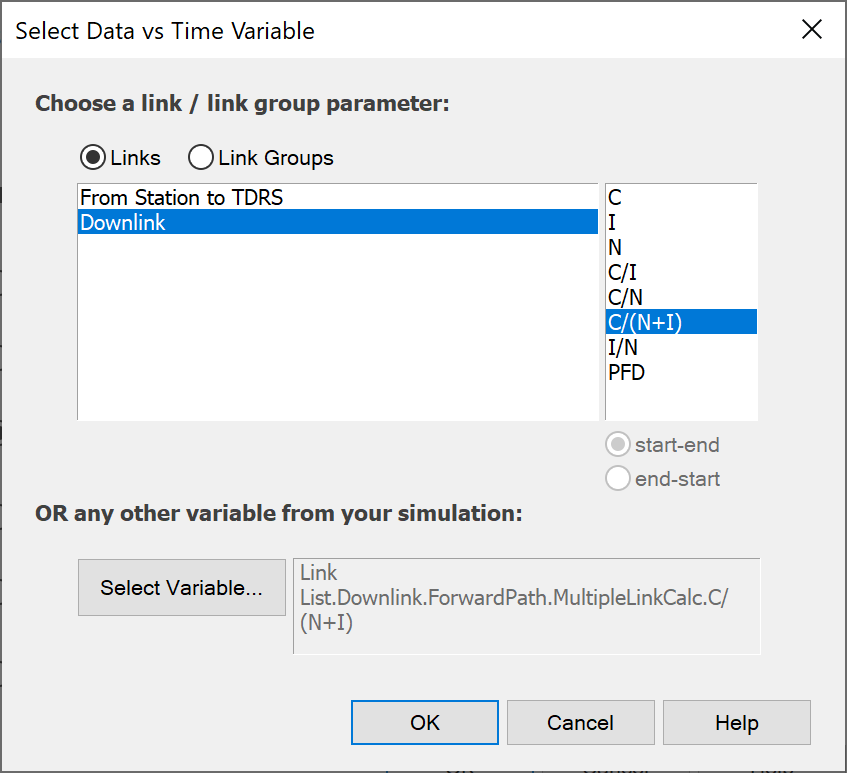
Interference parameters (C, I, N, C/I etc.) can be chosen for each defined Link (or Link Group), by highlighting the Link (or Link Group) name in the list on the left, and double clicking the variable on the right.
Select Variable
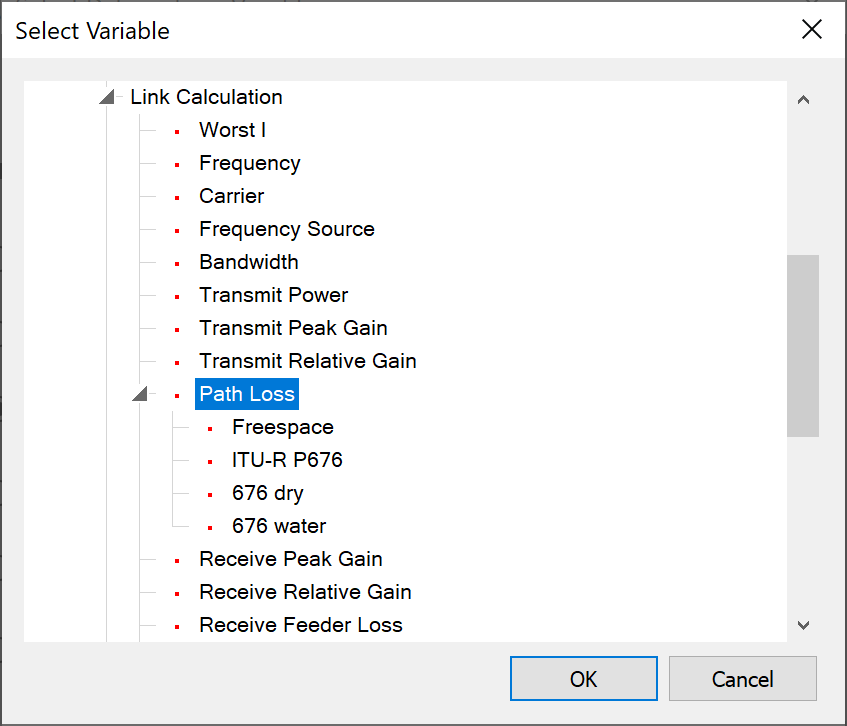
Other parameters can be chosen by clicking the ‘Select Variable’ button using the standard variable selection dialog.
See Configuring Graphs for details of how to set the display properties of the Data vs. Time graph.
Data vs. Data Graph
The Data vs. Data graph can be used to display up to three pairs of variables on a scatter plot. An example would be to plot an antenna azimuth and elevation on the same graph for a tracking antenna. Handover of the Link to another station would appear as a discontinuity on the plot.
The Data vs. Data graph dialog is invoked by selecting Data vs. Data graph from the Analysis menu, or clicking the Data vs. Data graph icon, ![]() , on the toolbar.
, on the toolbar.
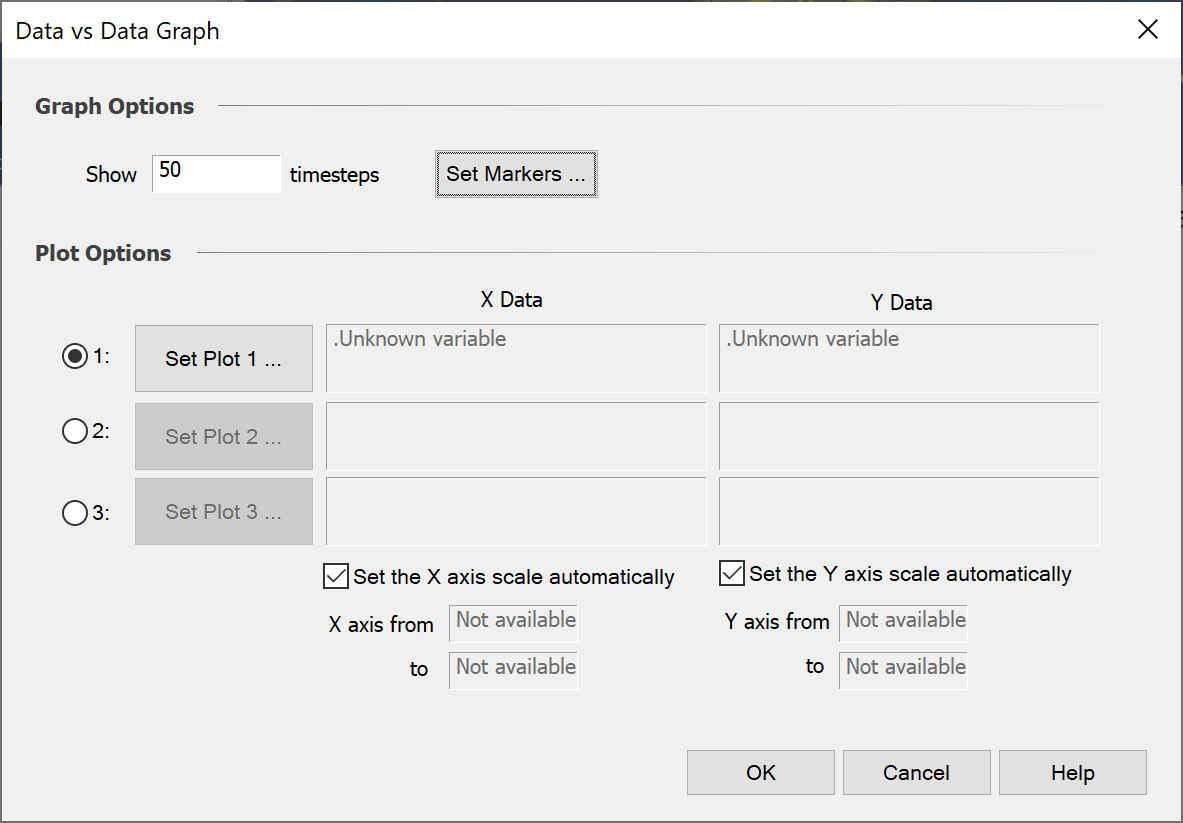
The ‘Number of time steps’ to plot and the ranges to use for each axis are inputs. The axes ranges can be automatically selected based on the range of values in the data set at each time step. If the Auto Scale option is not chosen the maximum and minimum required values need to be specified
Select Data vs Data Variables
Parameters of each plot are selected via the ‘Set Plot’ button. This brings up the Select Variable box (below)
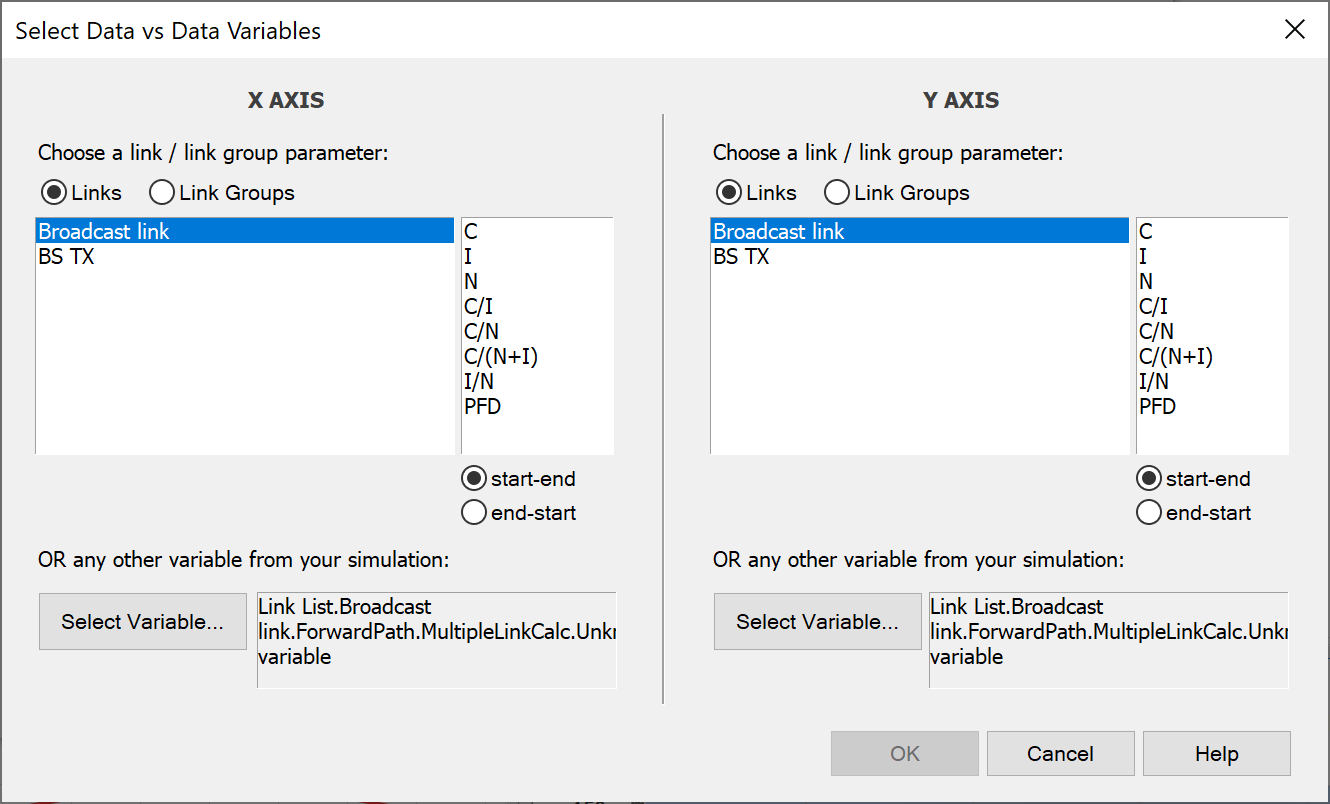
Interference parameters (C, I, N, C/I etc.) can be chosen for each defined link (or link group), by highlighting the link (or link group) name in the list on the left, and double clicking the variable on the right. Other parameters can be chosen via the ‘Select Variable’ button, which brings up the object tree.
Distribution Chart
The Distribution chart option is used to plot probability distributions and cumulative distribution functions for up to six interference parameters or user defined statistics for which histogram bin data is being calculated.
The Distribution option is invoked by selecting Distribution from the Analysis menu or by clicking the Distribution icon ![]() on the toolbar.
on the toolbar.
The dialog allows any defined statistical variable to be selected.
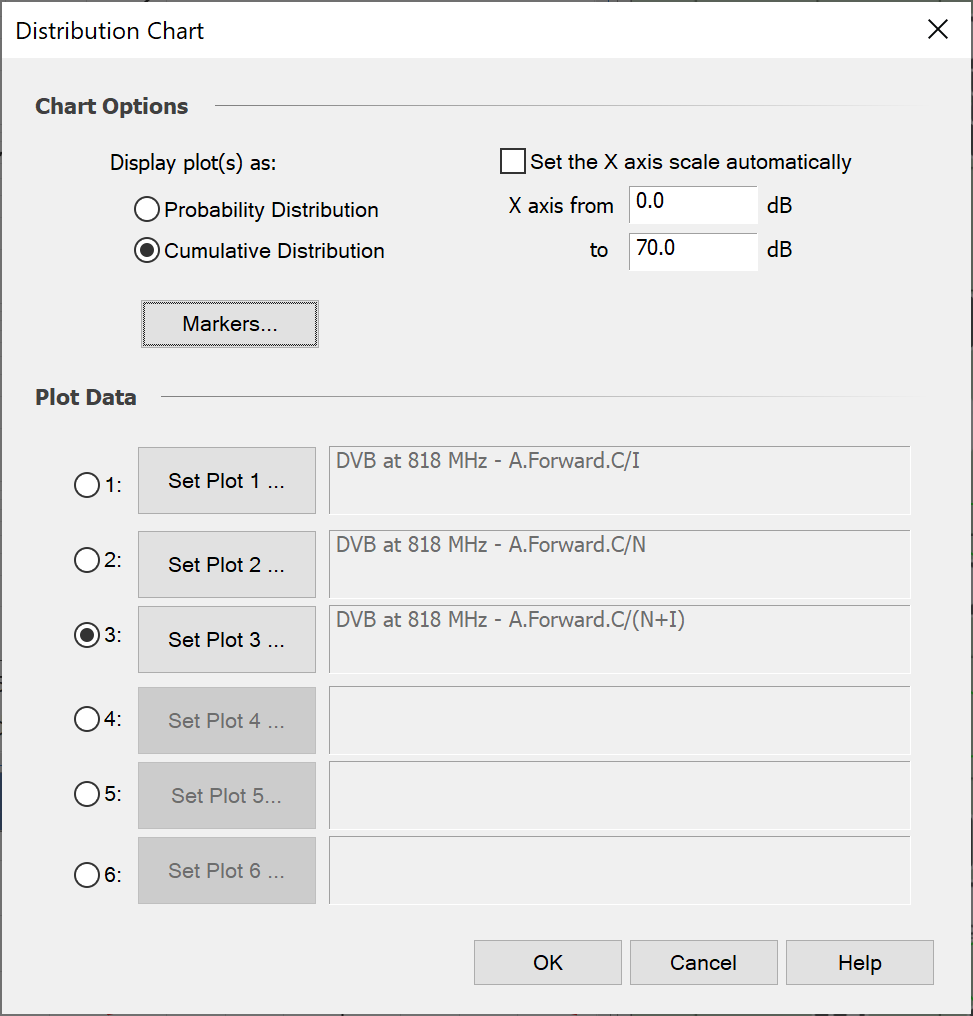
Select either ‘Probability Distribution Function’ or Cumulative Distribution Function’ in the top left of the dialog, depending on the graph type you want. The default CDF shows the cumulative distribution as a line graph.
Further plots can be selected at this stage. Up to six variables can be simultaneously plotted. Select the number of plots required, then set the variable for each plot via the ‘Set Plot n’ button.
Markers can also be added using the Set Markers button.
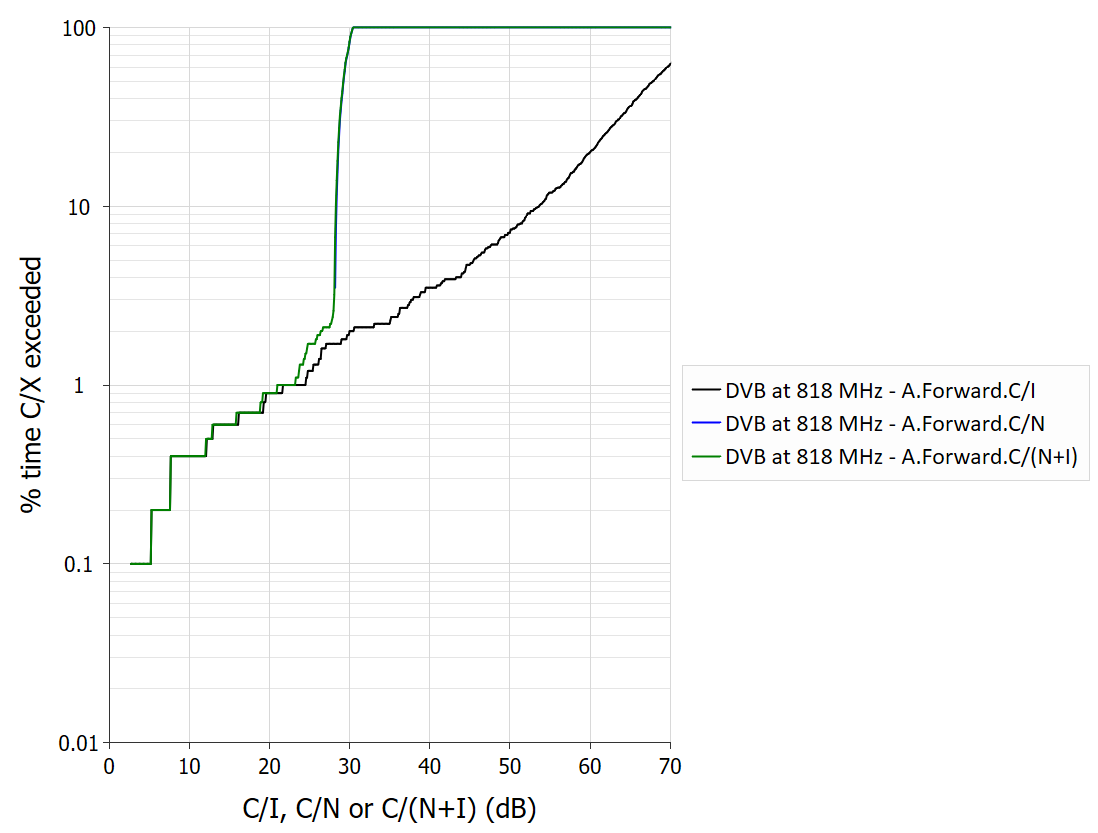
The example below shows three curves of C/I, C/N and C/N+I.
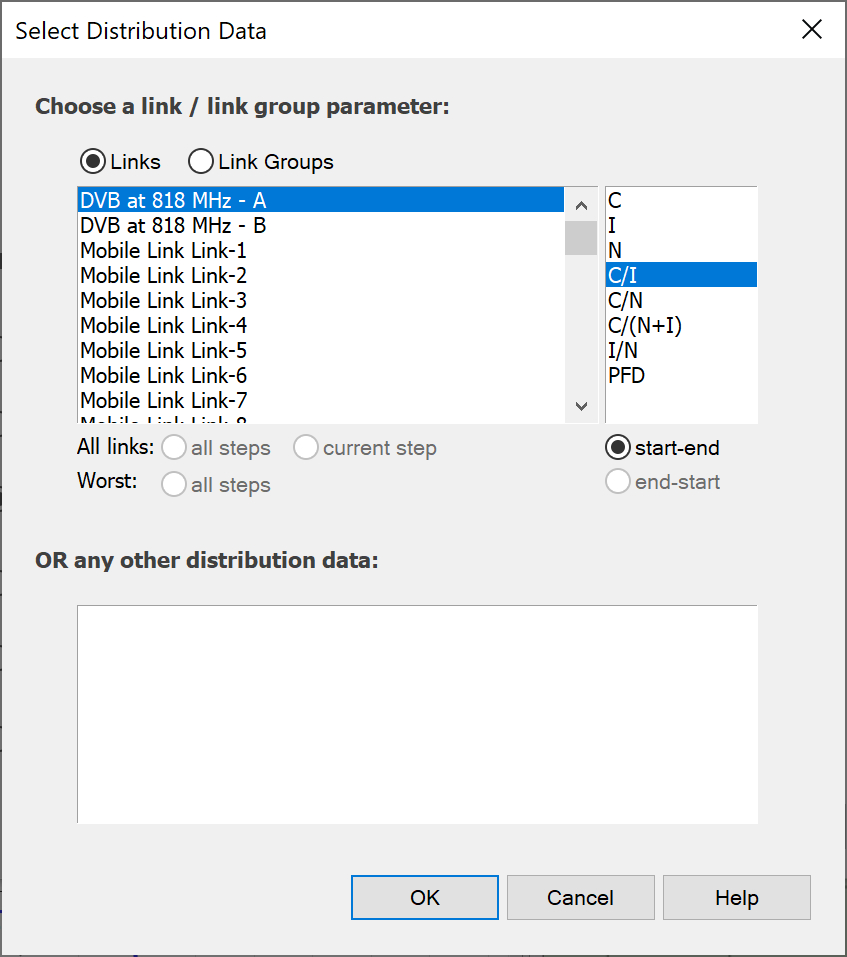
Select Distribution Data
The Select Distribution Data dialog is shown below. Interference parameters (C, I, N, C/I etc.) can be chosen for each defined Link (or Link Group), by highlighting the Link (or Link Group) name in the list on the left, and double clicking the variable on the right. Other variables are chosen from the list of user defined statistics on the right.
Configuring Graphs
If after creating a graph you want to change the data set used, then you can change it by selecting menu option Edit | Plot data.
All graphs can be configured via the Chart Settings dialog, invoked by a right mouse click on the graph area, or from the 'Properties' option of the View menu item. This tabbed dialog is used to configure and customise graph styles, titles, data markers etc.
The options available on each tab are briefly explained.
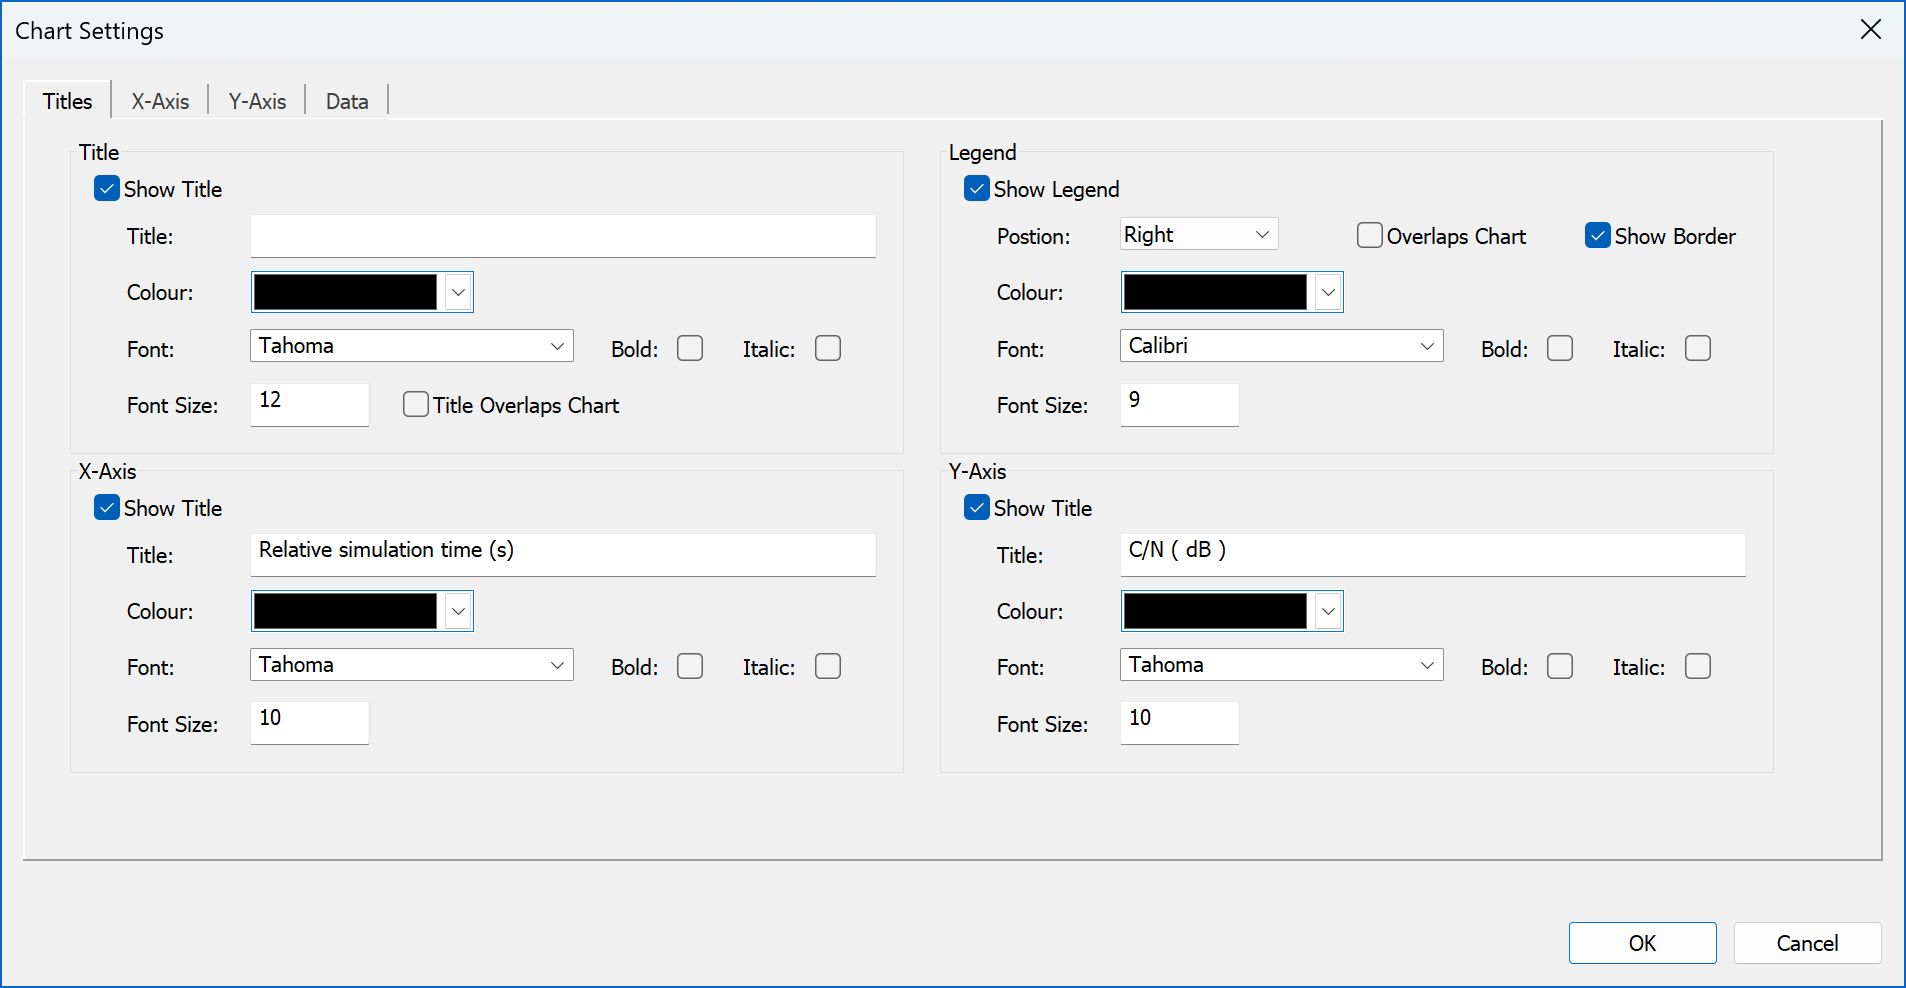
Titles
The colour and font styles can be set for the graph title, and X-Axis and Y-Axis labels.
The legend can also be configured on/off and have its position defined.
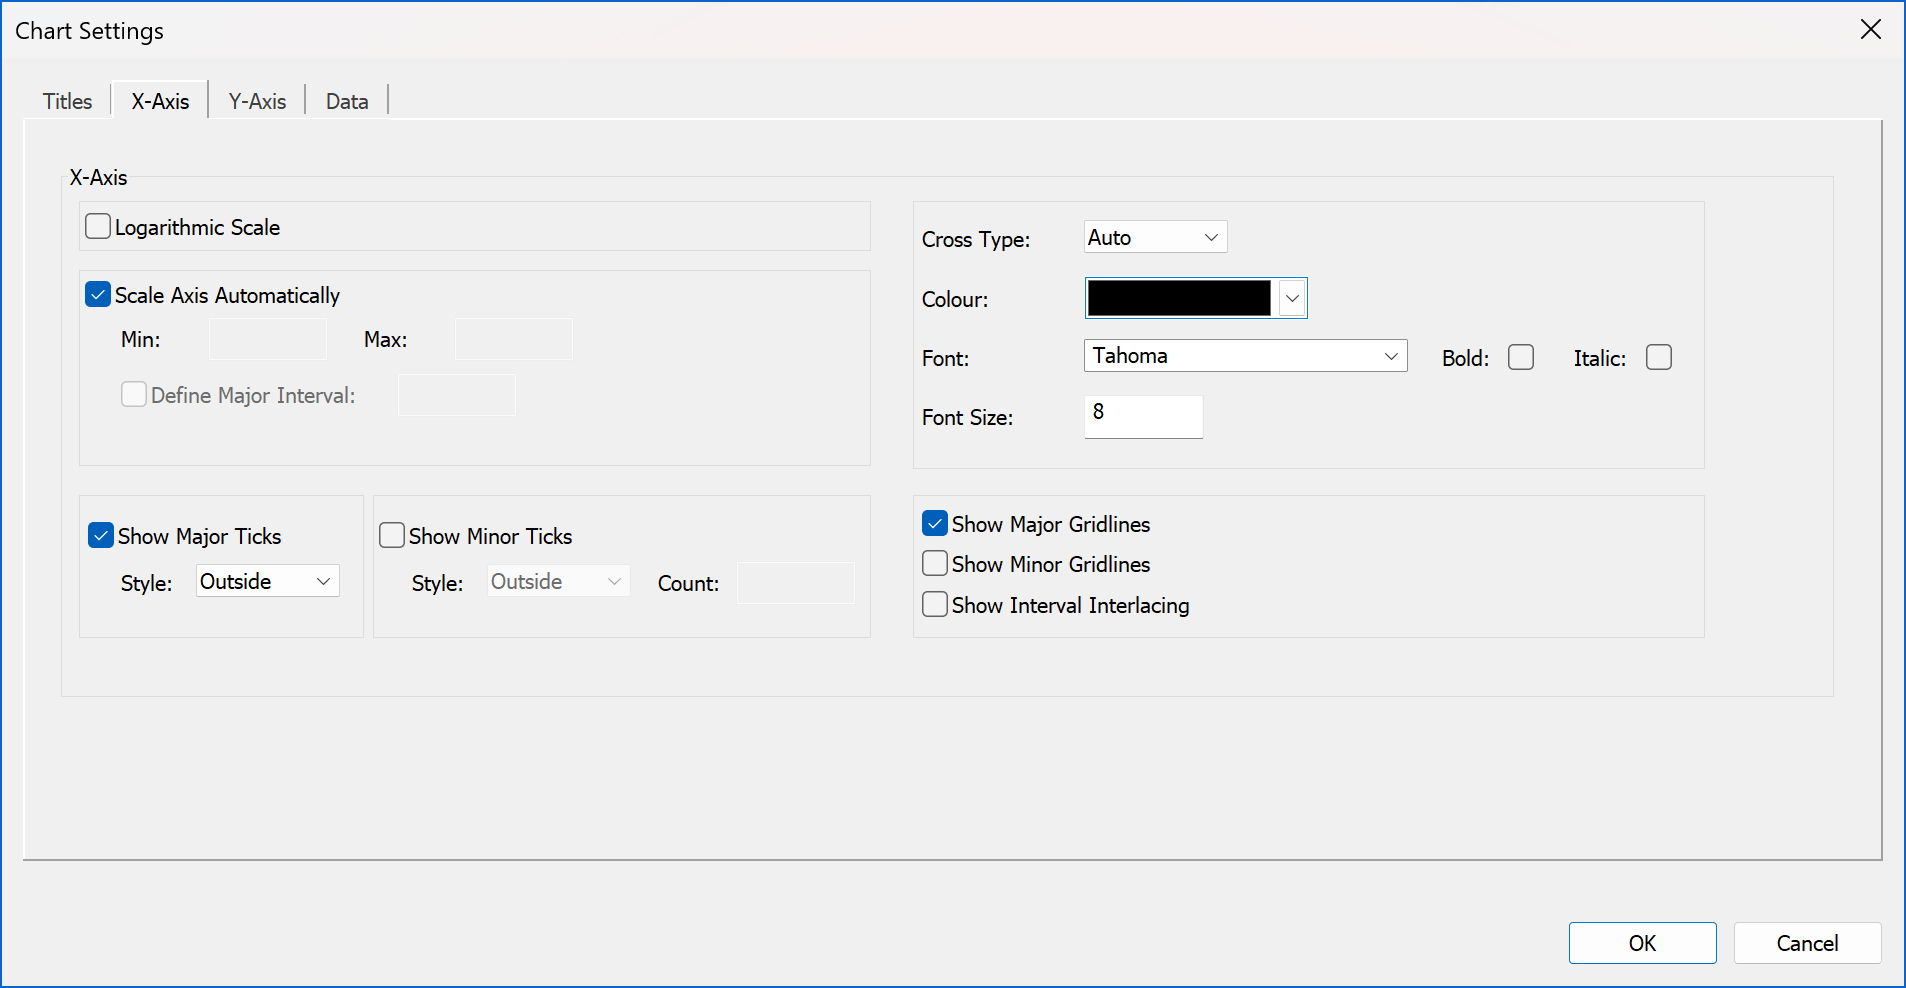
X-Axis
X-Axis properties, colours, styles and tick marks are defined here.
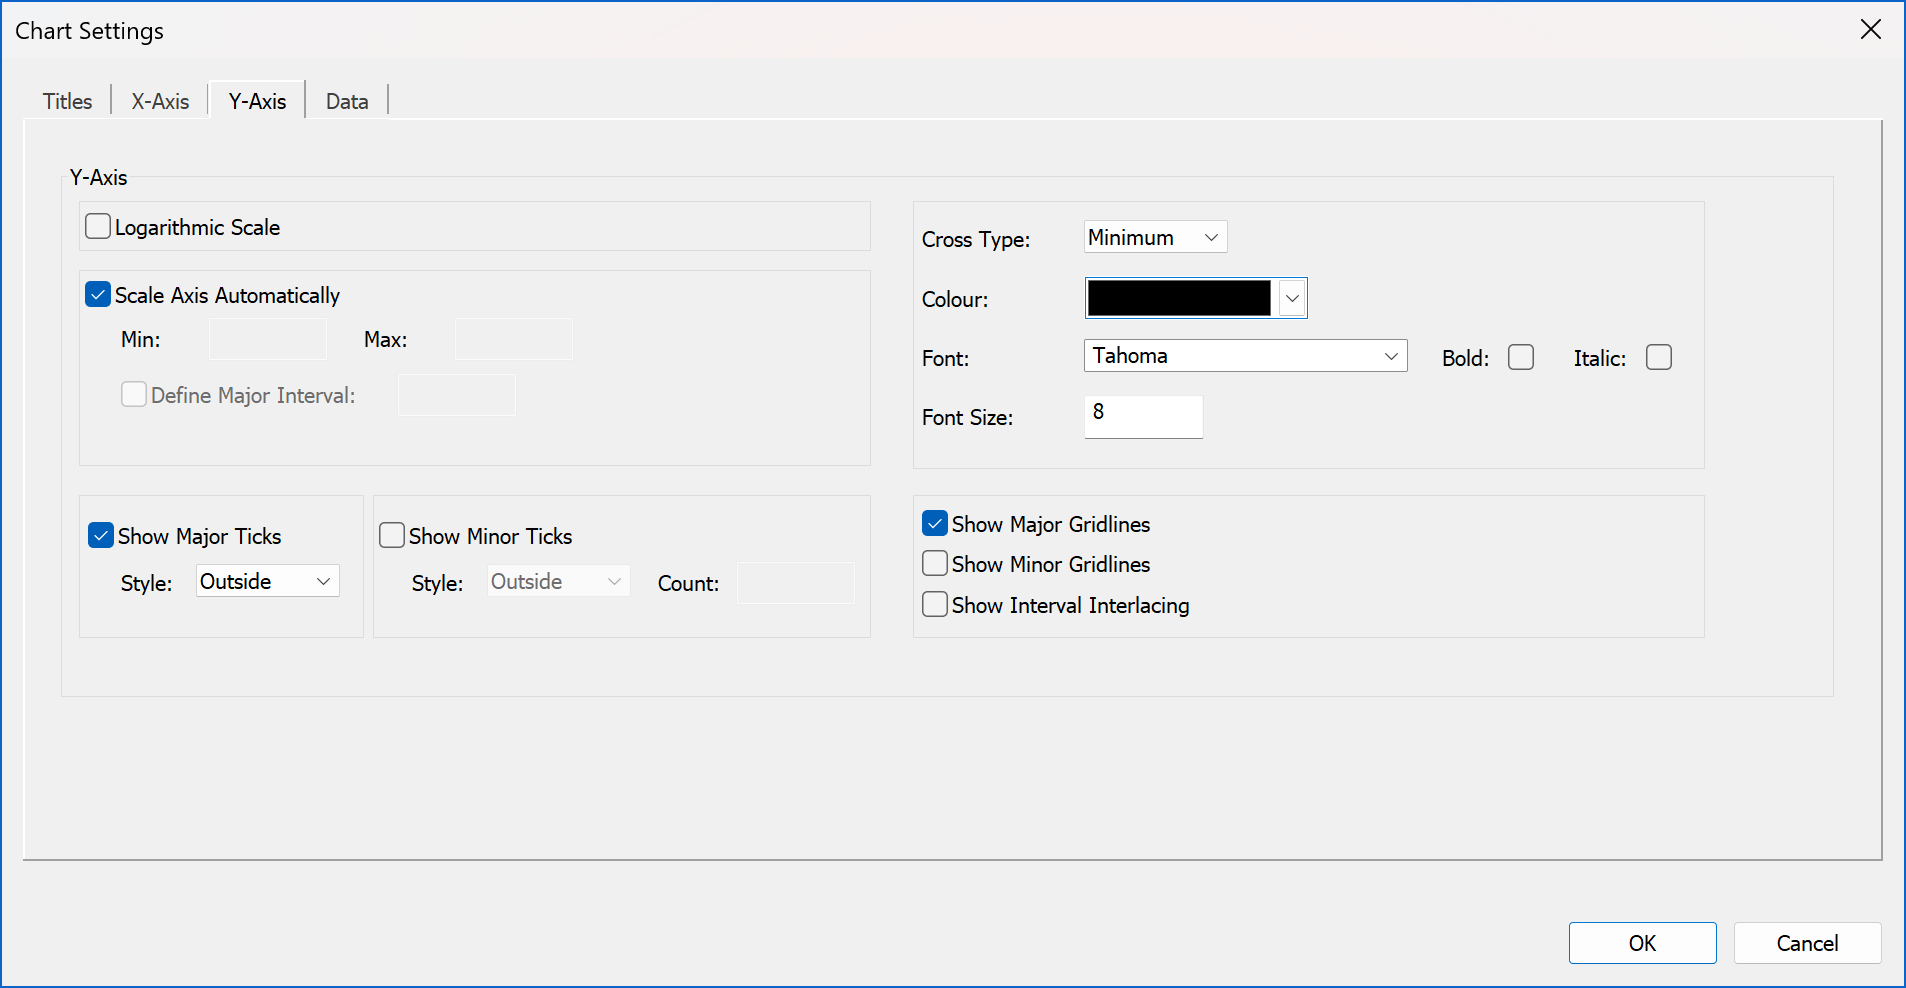
Y-Axis
Y-Axis properties, colours, styles and tick marks are defined here.
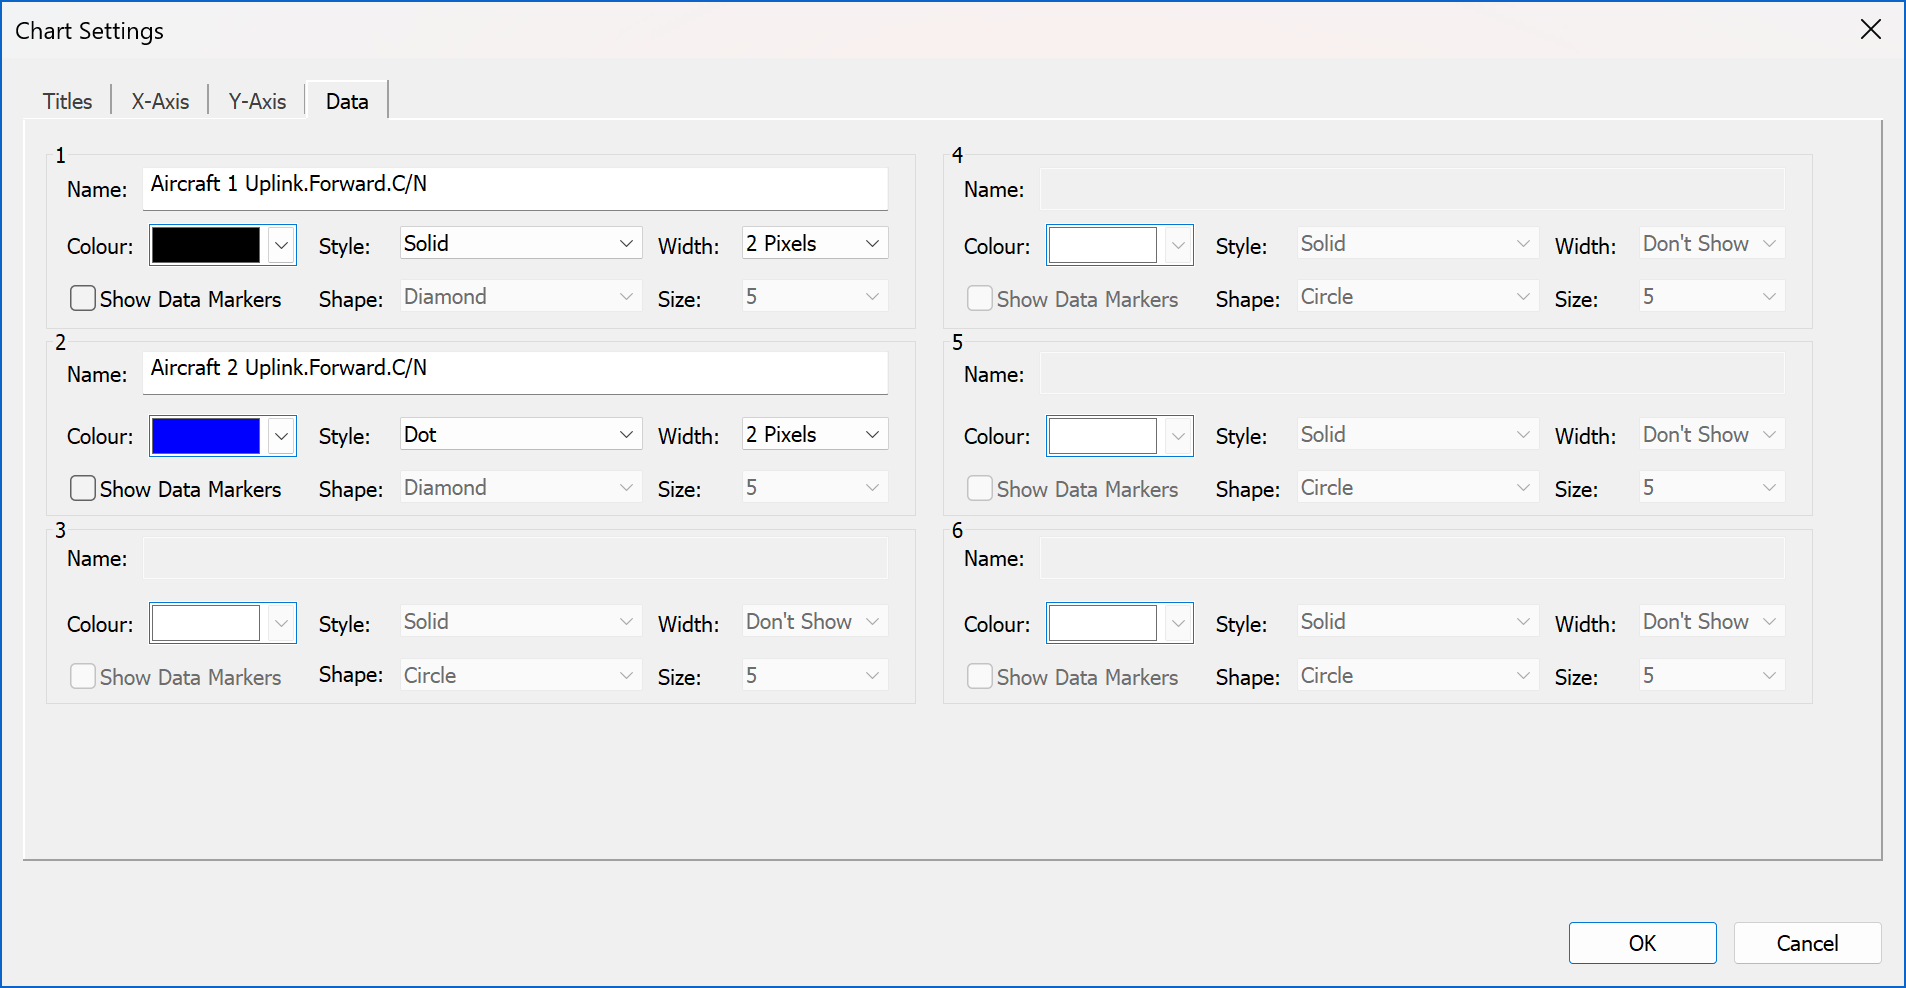
Data
This page allows the data being plotted to be changed.
Copying Graphs and Data
Like most views you can copy the graph to paste into other applications like Microsoft Word and Excel. Note it might be necessary to use those application’s Paste | Special option to select the format that is most suitable.
In addition, it is possible to export the raw data using the menu option “File | Export plot data”.