GSO to GSO Satellite
This section contains the following examples:
GSO downlink with rain loss
| Action: | Run simulation |
| Modules used: | None |
| Terrain regions: | None |
| Frequency band: | Ku |
| Station types: | GSO Satellite, Earth Stations |
| Propagation models: | Free space, ITU-R Rec.P.618, ITU-R Rec.P.676 |
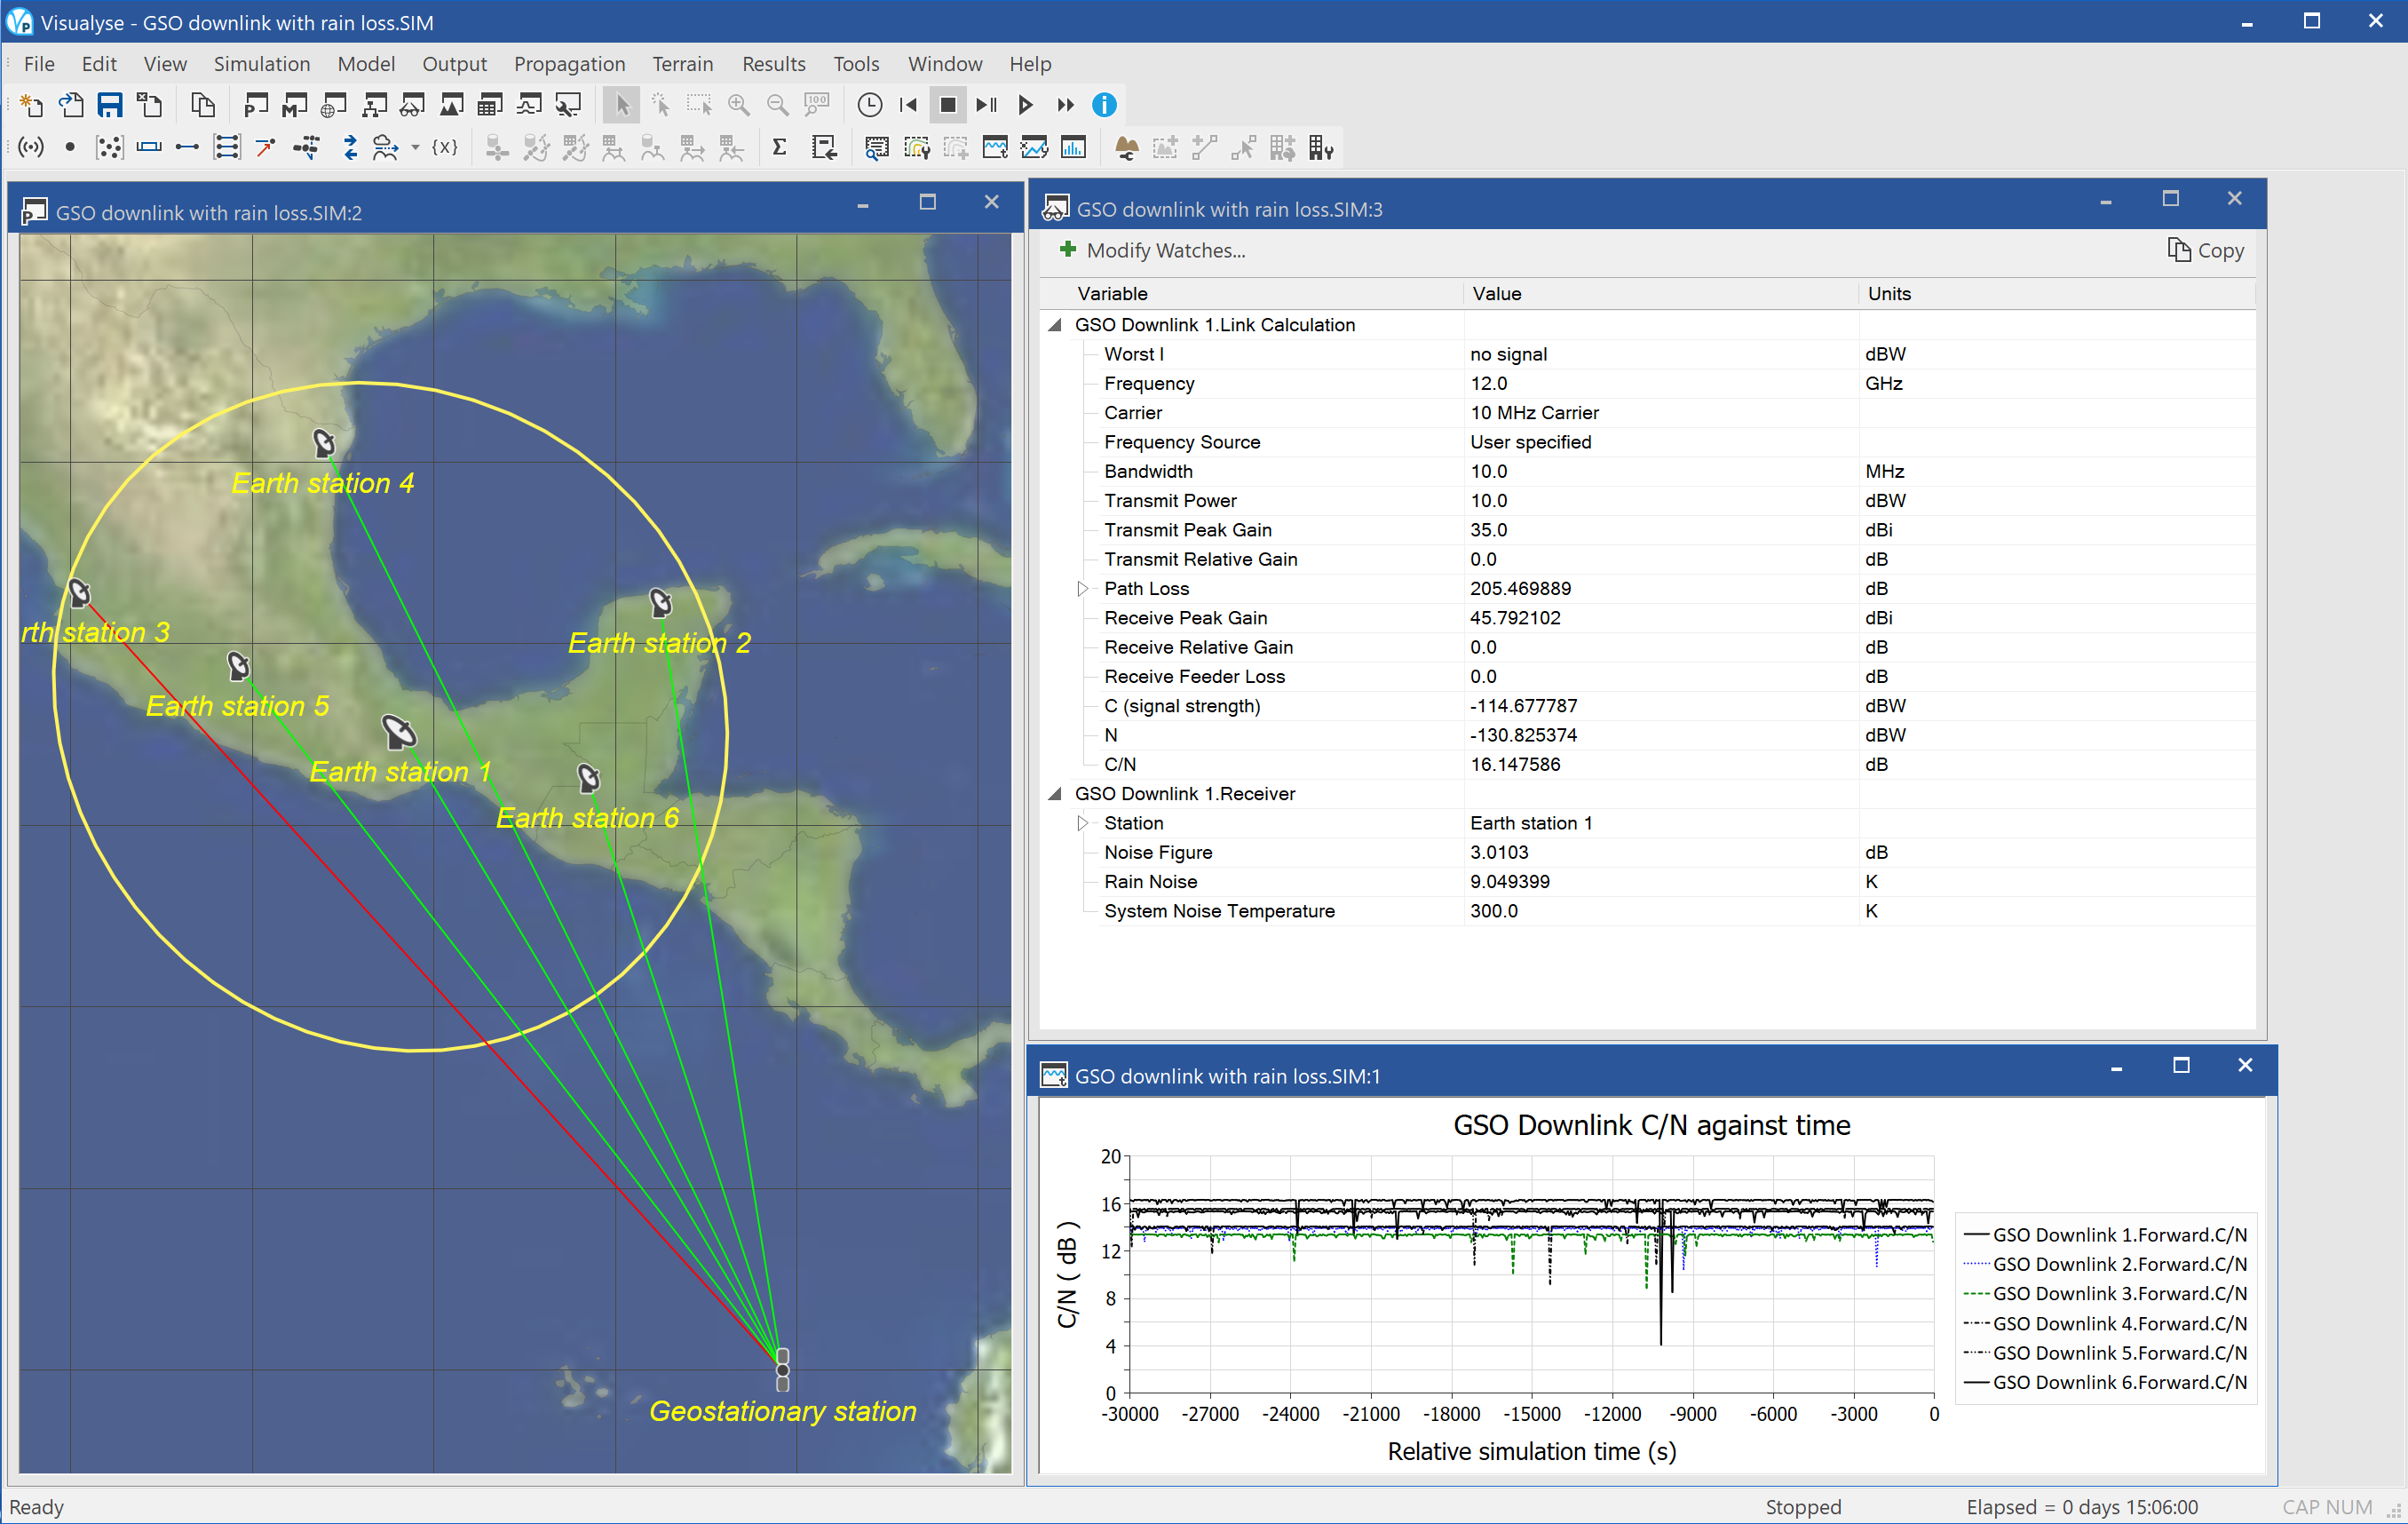
This example that shows a GSO satellite with a single transmit spot beam. In its coverage are 6 receive earth stations, and links have been set up to model atmospheric effects such as gaseous absorption and rain fade. This uses the ITU-R's relevant propagation models, Rec. 676 and Rec. 618.
There are three windows:
- Map in Plate Carrée projection (left) showing the satellite, earth stations, beam footprint and links. The links go red when a rain fade degrades the received signal.
- Watch window (top right) showing details of one of the downlinks including components of the propagation loss due to absorption and fading.
- Quick graph (bottom right) showing how the C/N of each link is varying with time.
The watch window also shows the calculation of the receive noise temperature on one of the links and shows how it increases due to rain noise – the double whammy effect of rain in lowering the wanted signal while increasing the noise.
This simulation could be extended to allow detailed analysis of GSO links or GSO-GSO interference subject to rain fading.
GSO to GSO MSS availability
| Action: | After reading text below, select user defined polarisation advantage on the Interference Paths dialog – Advanced tab |
| Modules used: | none |
| Terrain regions: | None |
| Frequency band: | L |
| Station types: | GSO Satellite, Maritime |
| Propagation models: | Free space, ITU-R Rec.P.676 |
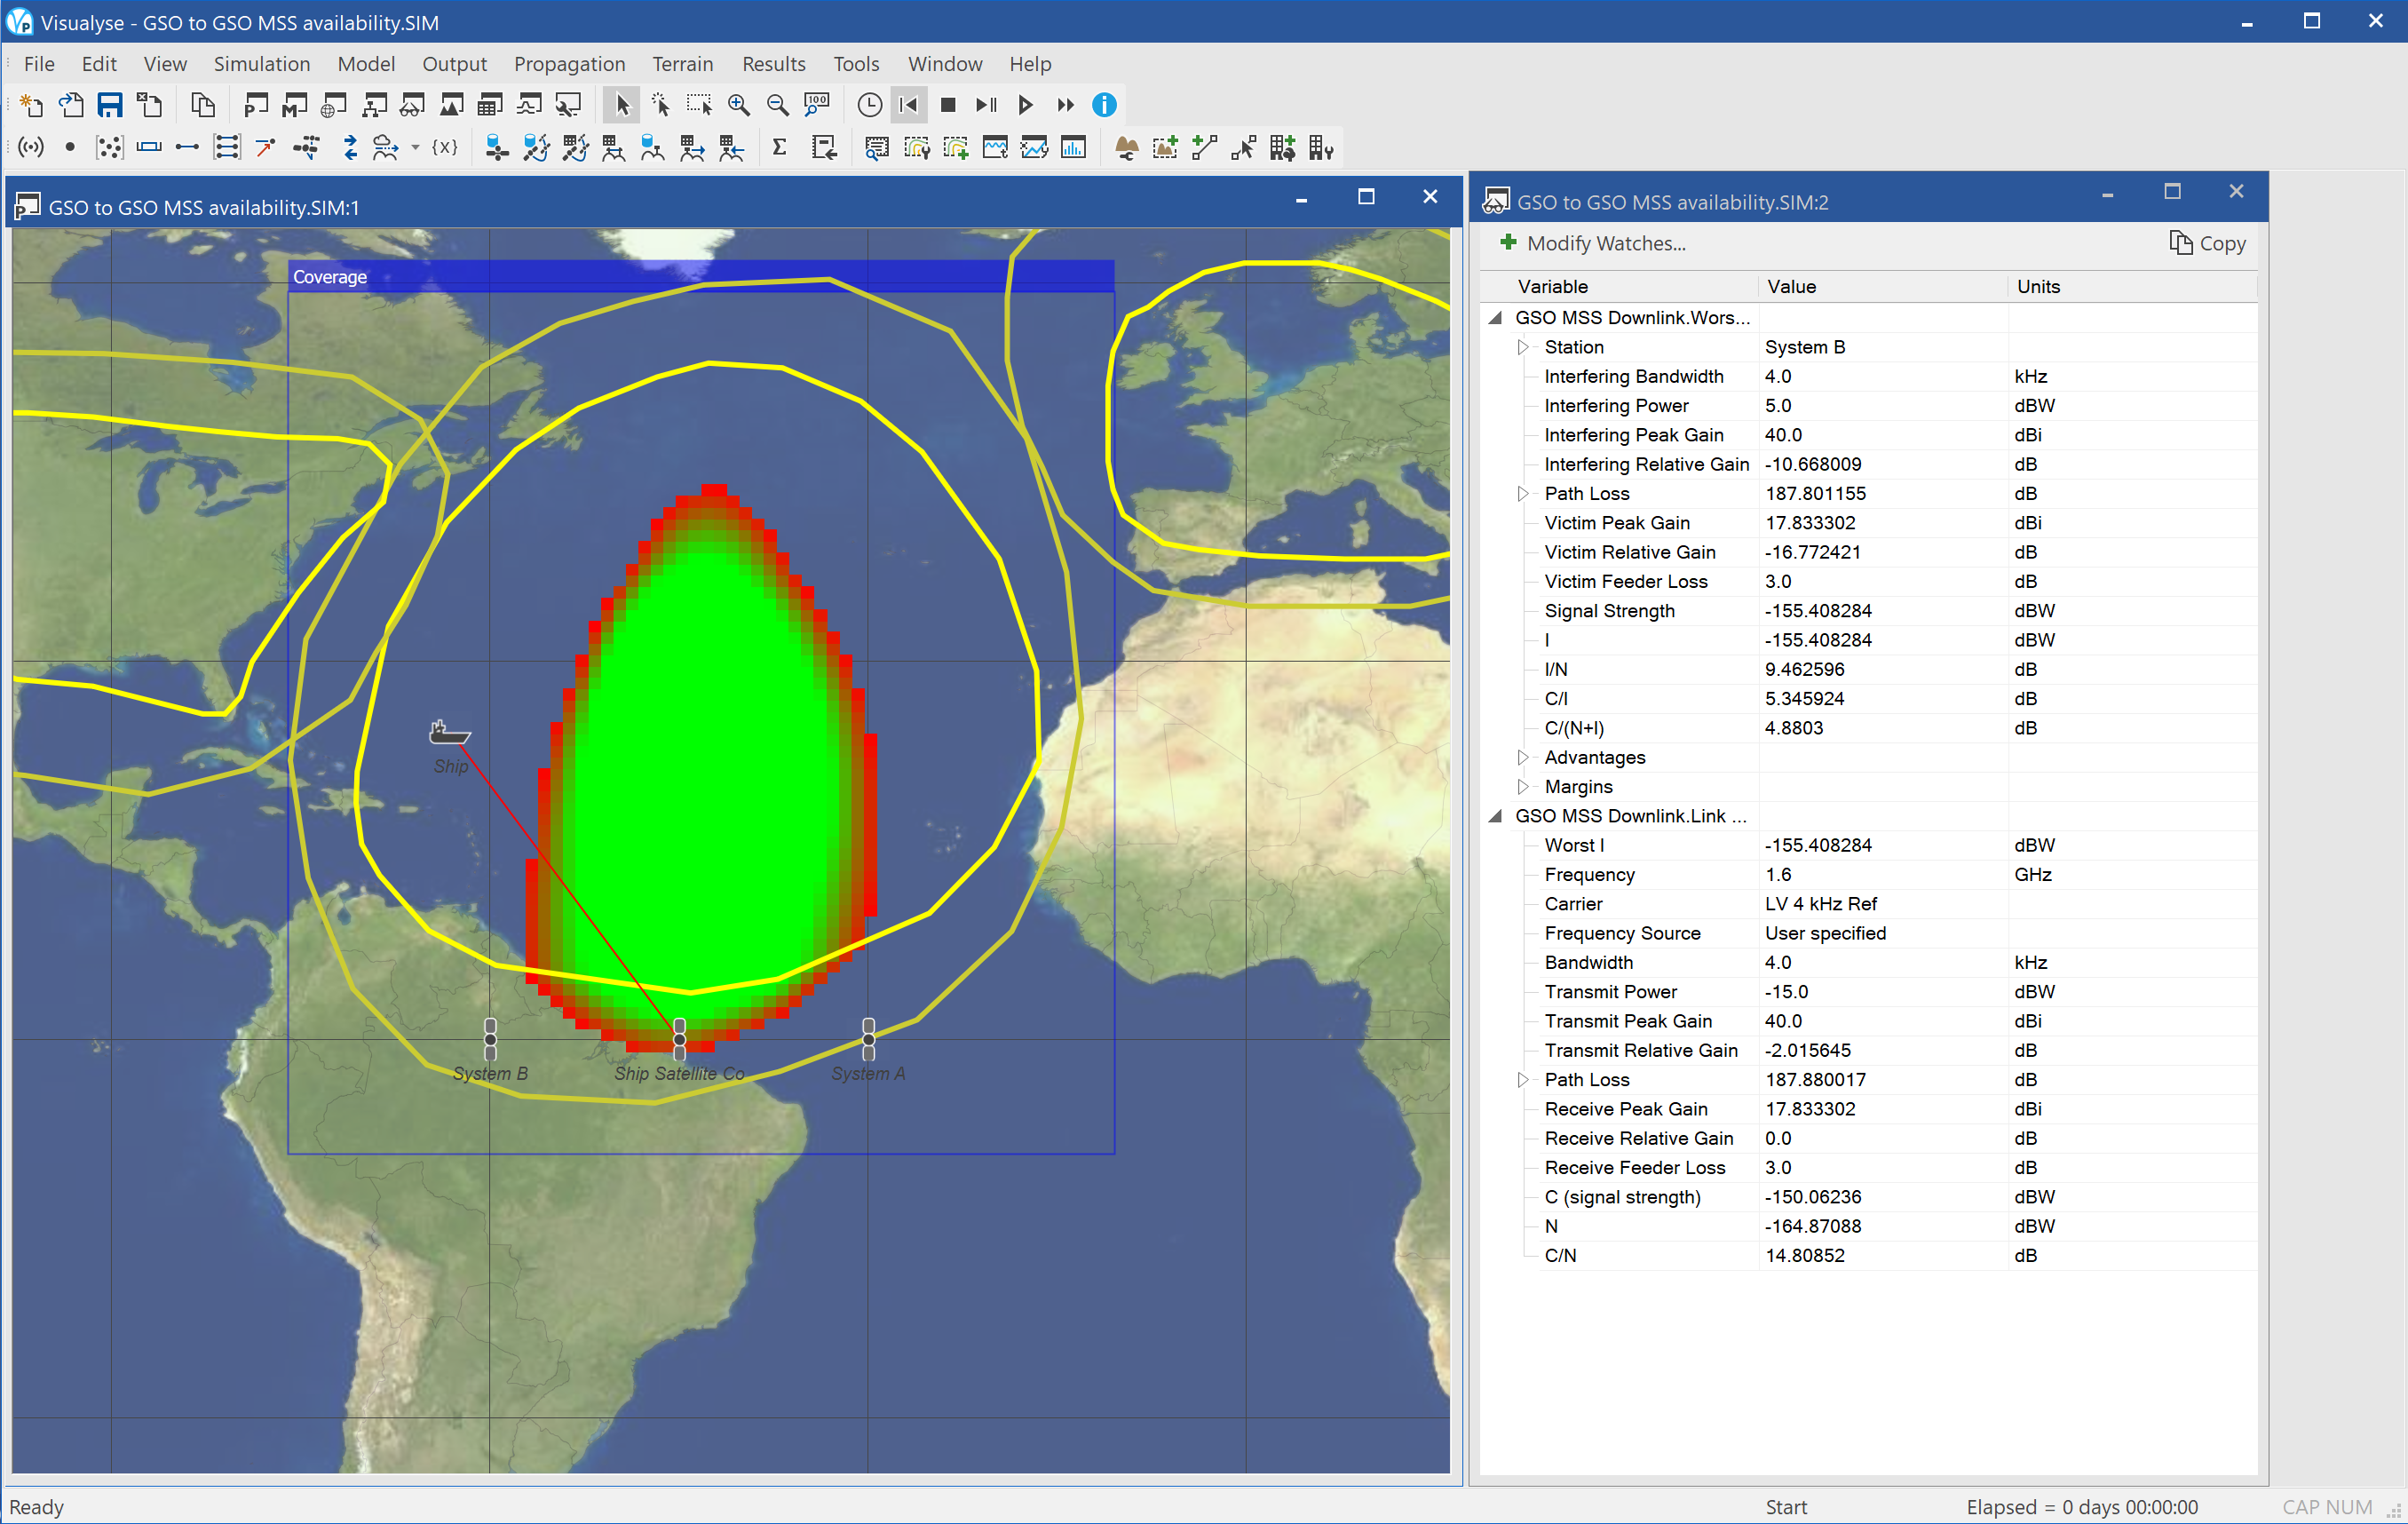
This example shows an example of how Visualyse Professional can support the coordination of GSO satellite networks. In this scenario there are two mobile satellite networks covering Europe and the US respectively. These are part of integrated mobile/terrestrial networks, and hence have little interest in maritime regions. A third operator wishes to take advantage of this but must coordinate with the other two networks.
The coordination agreement is likely to take the form of a transmit EIRP 20 dB below that of the regional networks and with at least 6 dB antenna discrimination from land. The question is whether these tight constraints leave sufficient area over which service can be provided to make operation profitable.
The simulation is configured with two windows open:
- Map in Plate Carrée projection (left) showing the satellites, gain patterns, ship used as reference, and Area Analysis of the C/N
- Watch window showing the wanted and interfering link budgets.
The green area in the Visualyse Professional Area Analysis shows where the C/(N+I) is above 10 dB and hence service should be possible. The red area is where a marginal reduced service would be available. It can be seen that it is limited in area.
One possibility to increase this area is to agree during coordination to use alternative polarisations – even though it is assumed this would only reduce unwanted signals by about 3 dB.
If you:
- Select “Interference Paths” from the icon / toolbar
- Double click on “From other satellites”
- Select “Advanced”
- Under “Polarisation Advantage” select “User Defined”
- Click “Ok” then “Close”
The Area Analysis should then update with a significantly large area coloured in green as in the figure below.
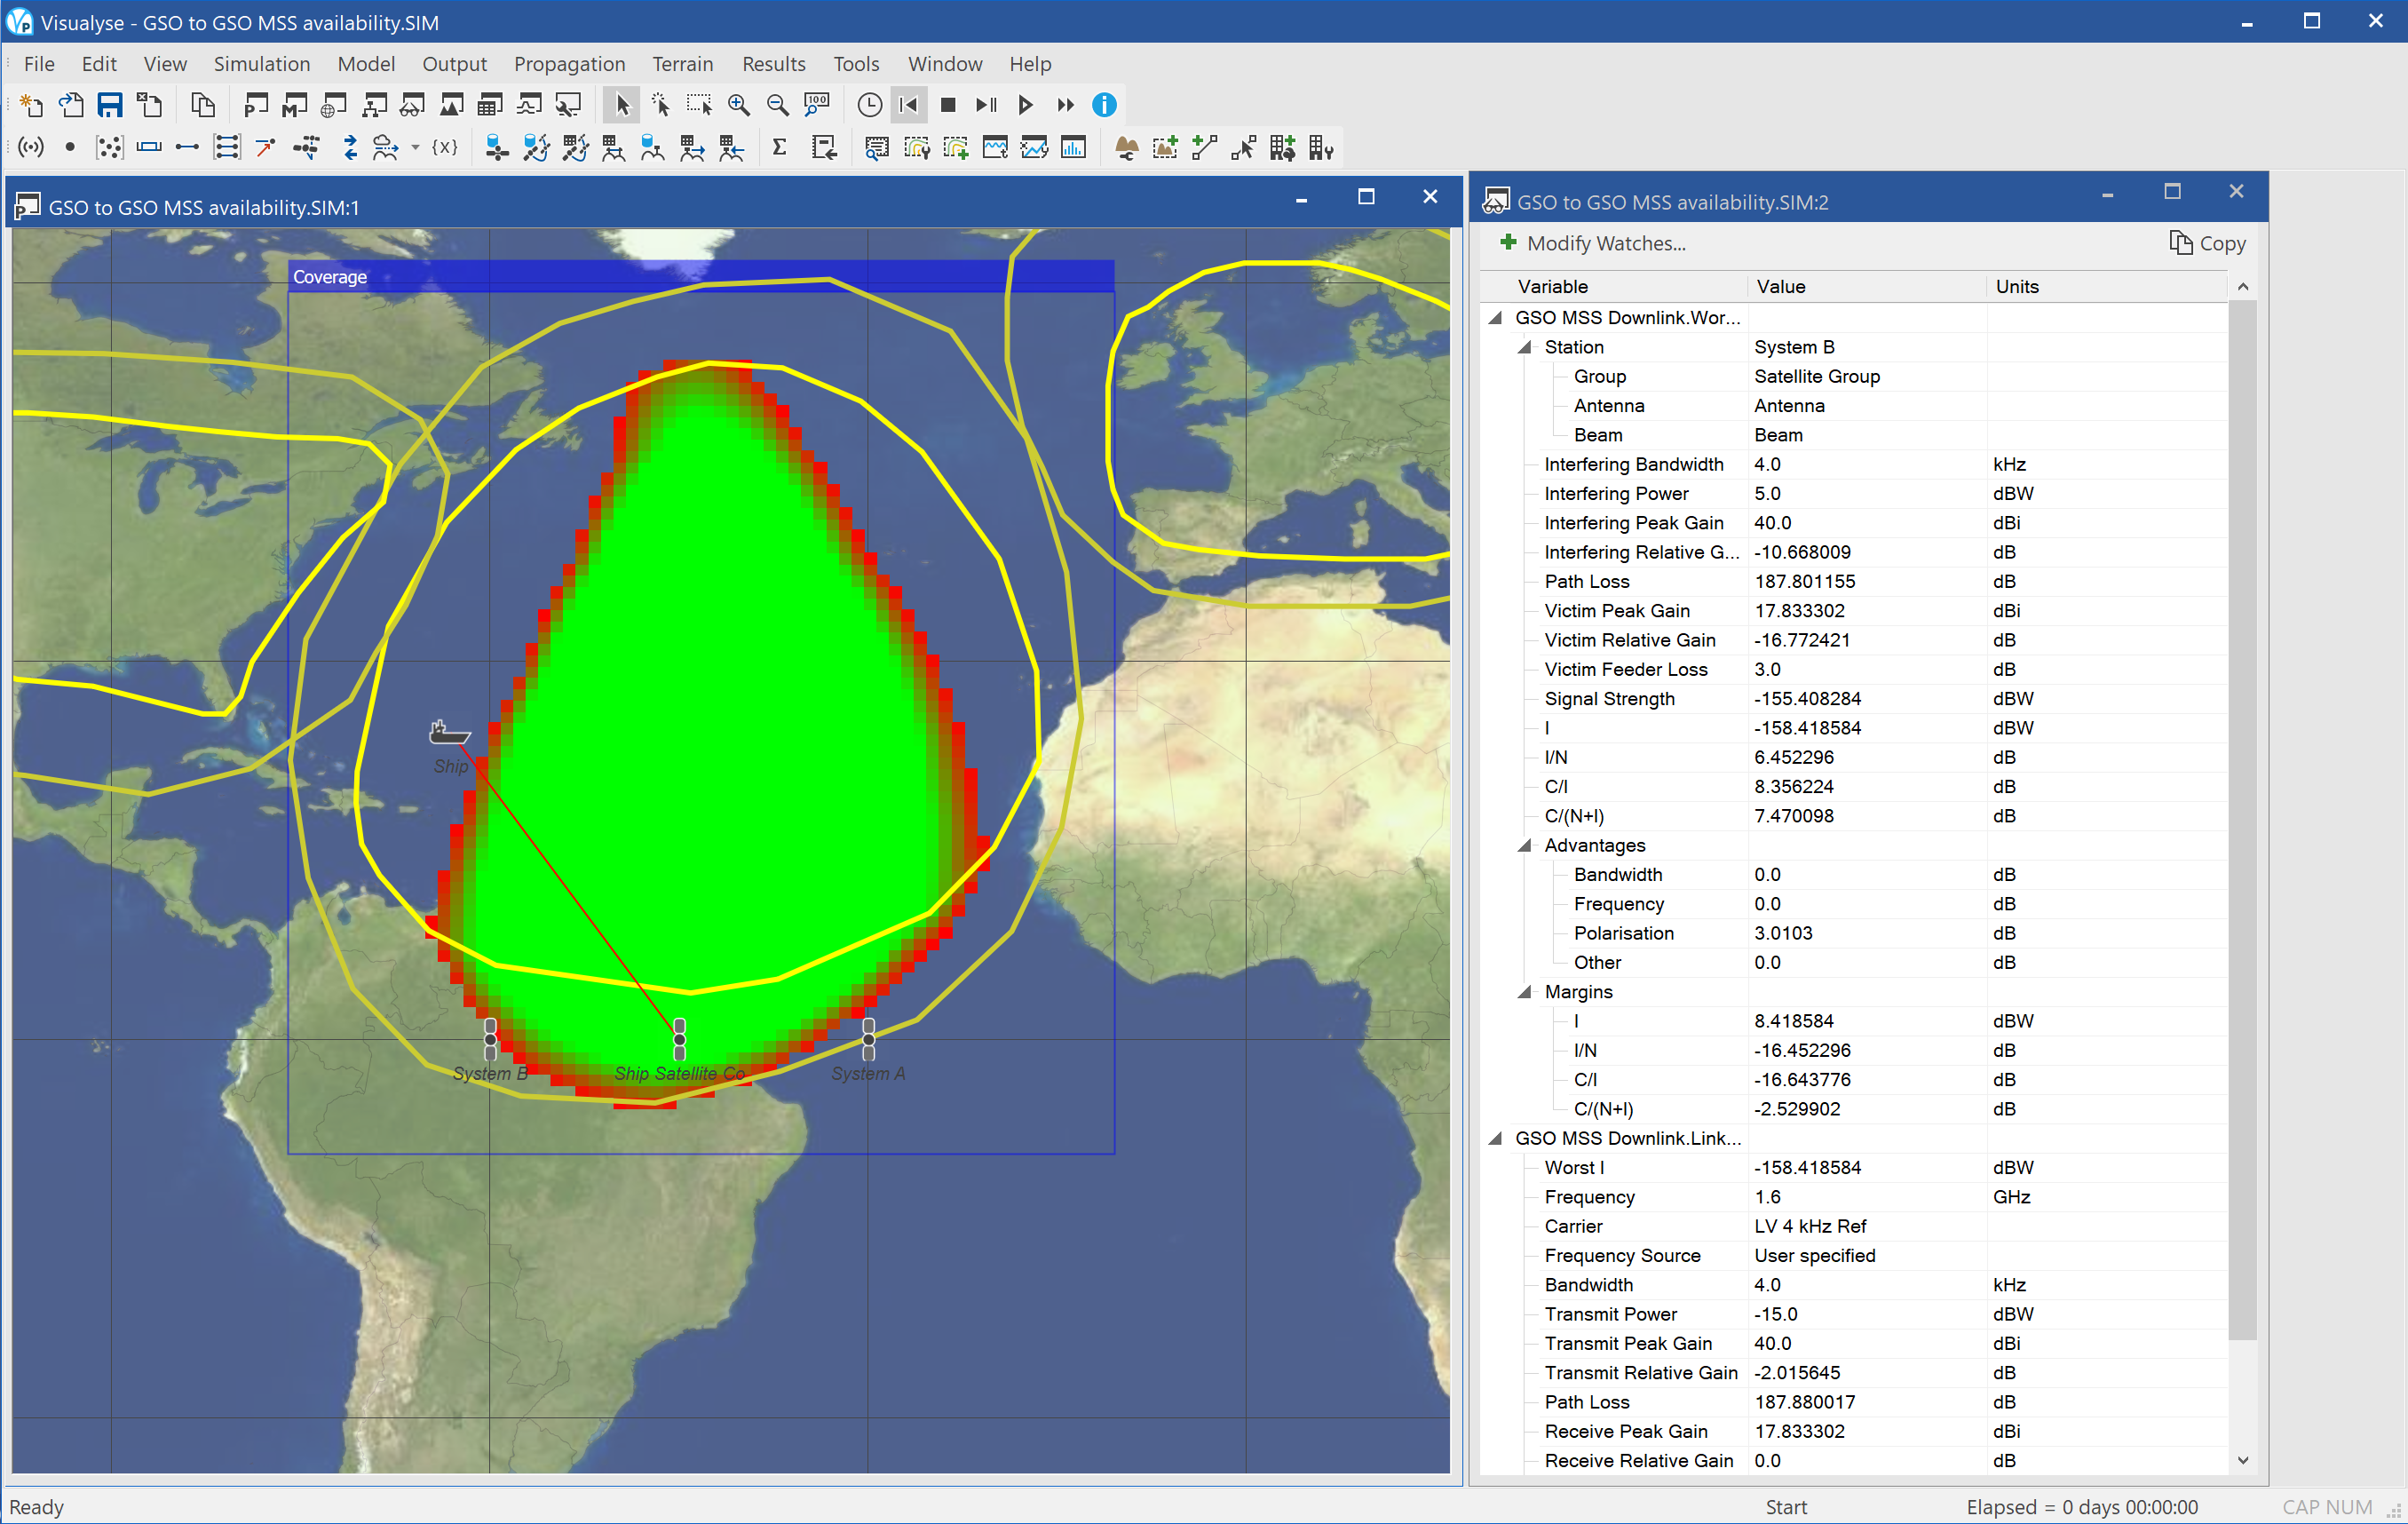
This could be sufficiently large an area to justify deployment if combined with services on other frequencies that can cover the ocean regions not covered by this network.
GSO transfer orbit TTC with interference from populated GSO arc
| Action: | Run simulation |
| Modules used: | None |
| Terrain regions: | None |
| Frequency band: | Ku |
| Station types: | GSO Satellite, Non-GSO Satellite, Earth Stations |
| Propagation models: | Free space, ITU-R Rec.P.676 |
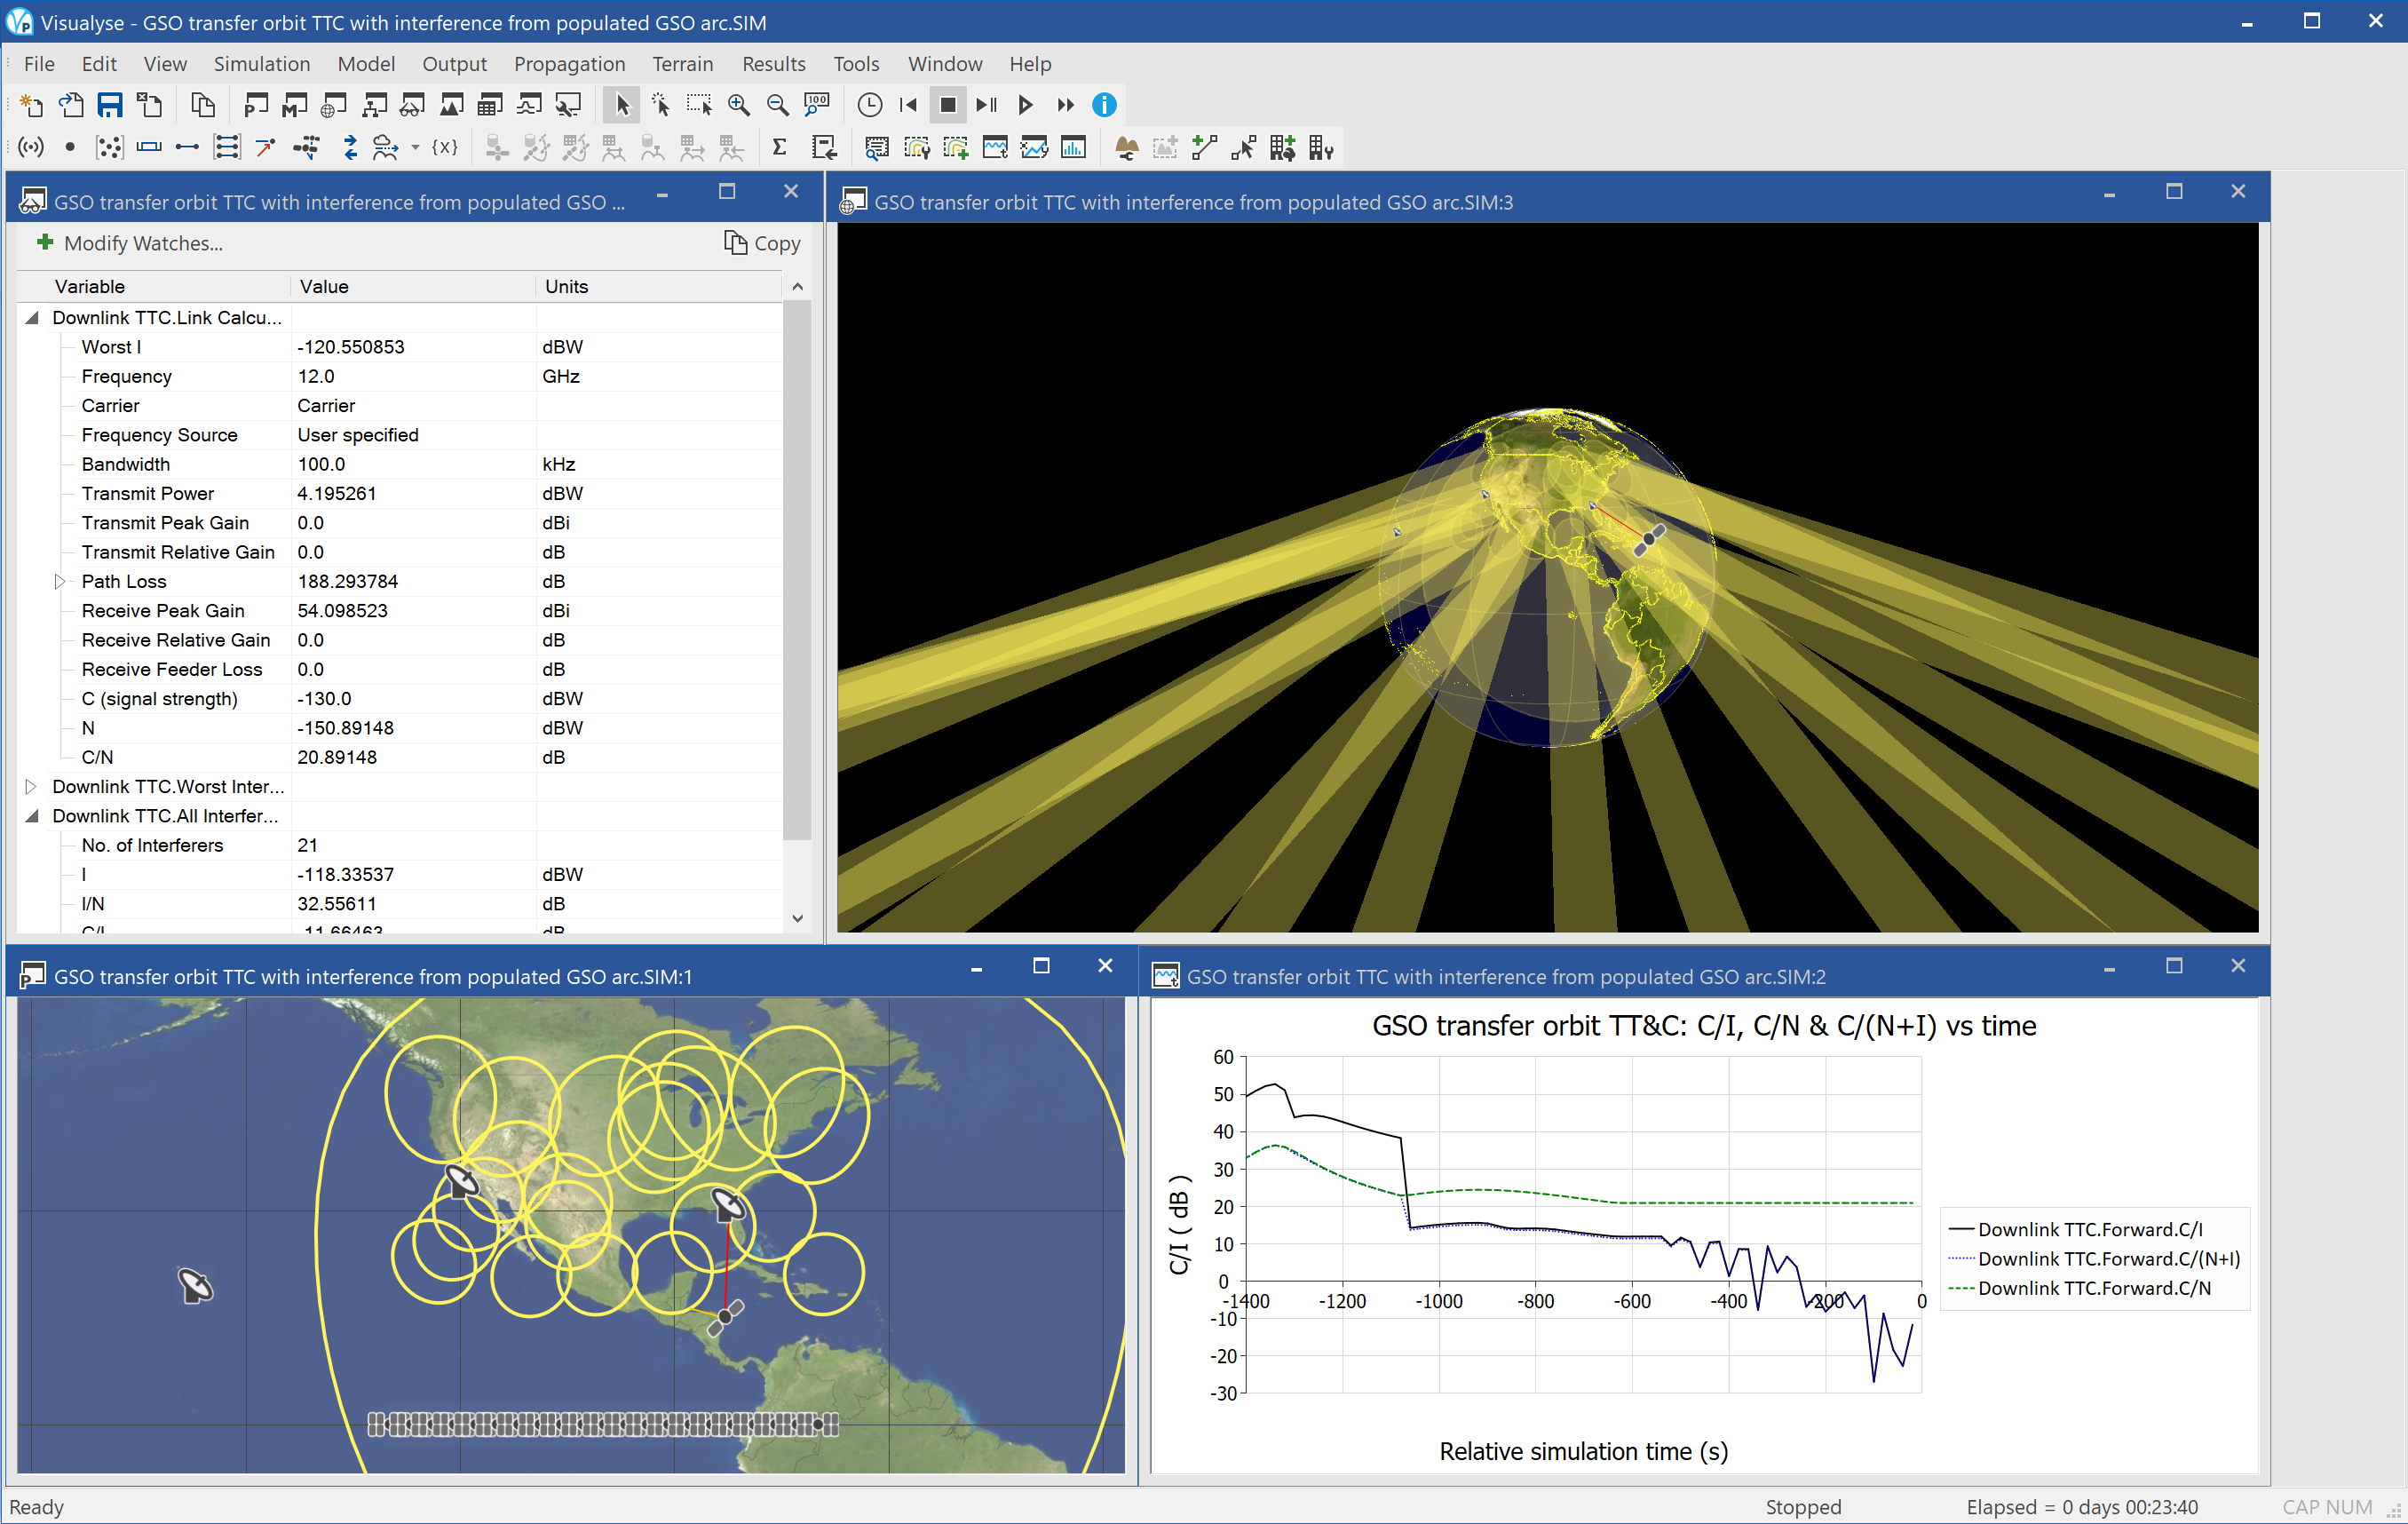
This example shows a satellite being transferred from low earth orbit into GSO. During this period, it is transmitting TT&C to ground control stations. As the orbit height increases it uses power control to maintain a constant received signal. To maintain constant communication, it hands over between ground control stations.
While in transit it crosses a location with a large number of GSO beams which are transmitting on the same frequency. This causes the downlink to suffer interference as the TT&C stations point towards the GSO satellites.
The following windows are open:
- 3D view (top right) showing the beams from the GSO satellites, the TT&C control stations and the satellite in transfer orbit. As the satellite move the hand overs between ground control stations can be seen. This link goes red when subject to interference from the GSO satellites.
- Plate Carrée map view (bottom left) showing the same beams, satellites and earth stations as for the 3D View, plus the GSO satellites.
- Quick graph (bottom right) showing how the C/I, C/N and C/(N+I) varies against time. When in the field of view of the GSO satellites the C/(N+I) can be seen to be dominated by the C/I.
- Watch window (top left) showing the link budget for the wanted downlink. This shows how the transmit power increases to compensate for the increased path loss as the satellite ascends. When the maximum power of 10 dBW has been reached the received signal starts to decrease gradually.
LUX 28,2 coverage
| Action: | None |
| Modules used: | None |
| Terrain regions: | None |
| Frequency band: | Ku |
| Station types: | GSO Satellite, Earth Stations |
| Propagation models: | Free space, ITU-R Rec.P.676 |
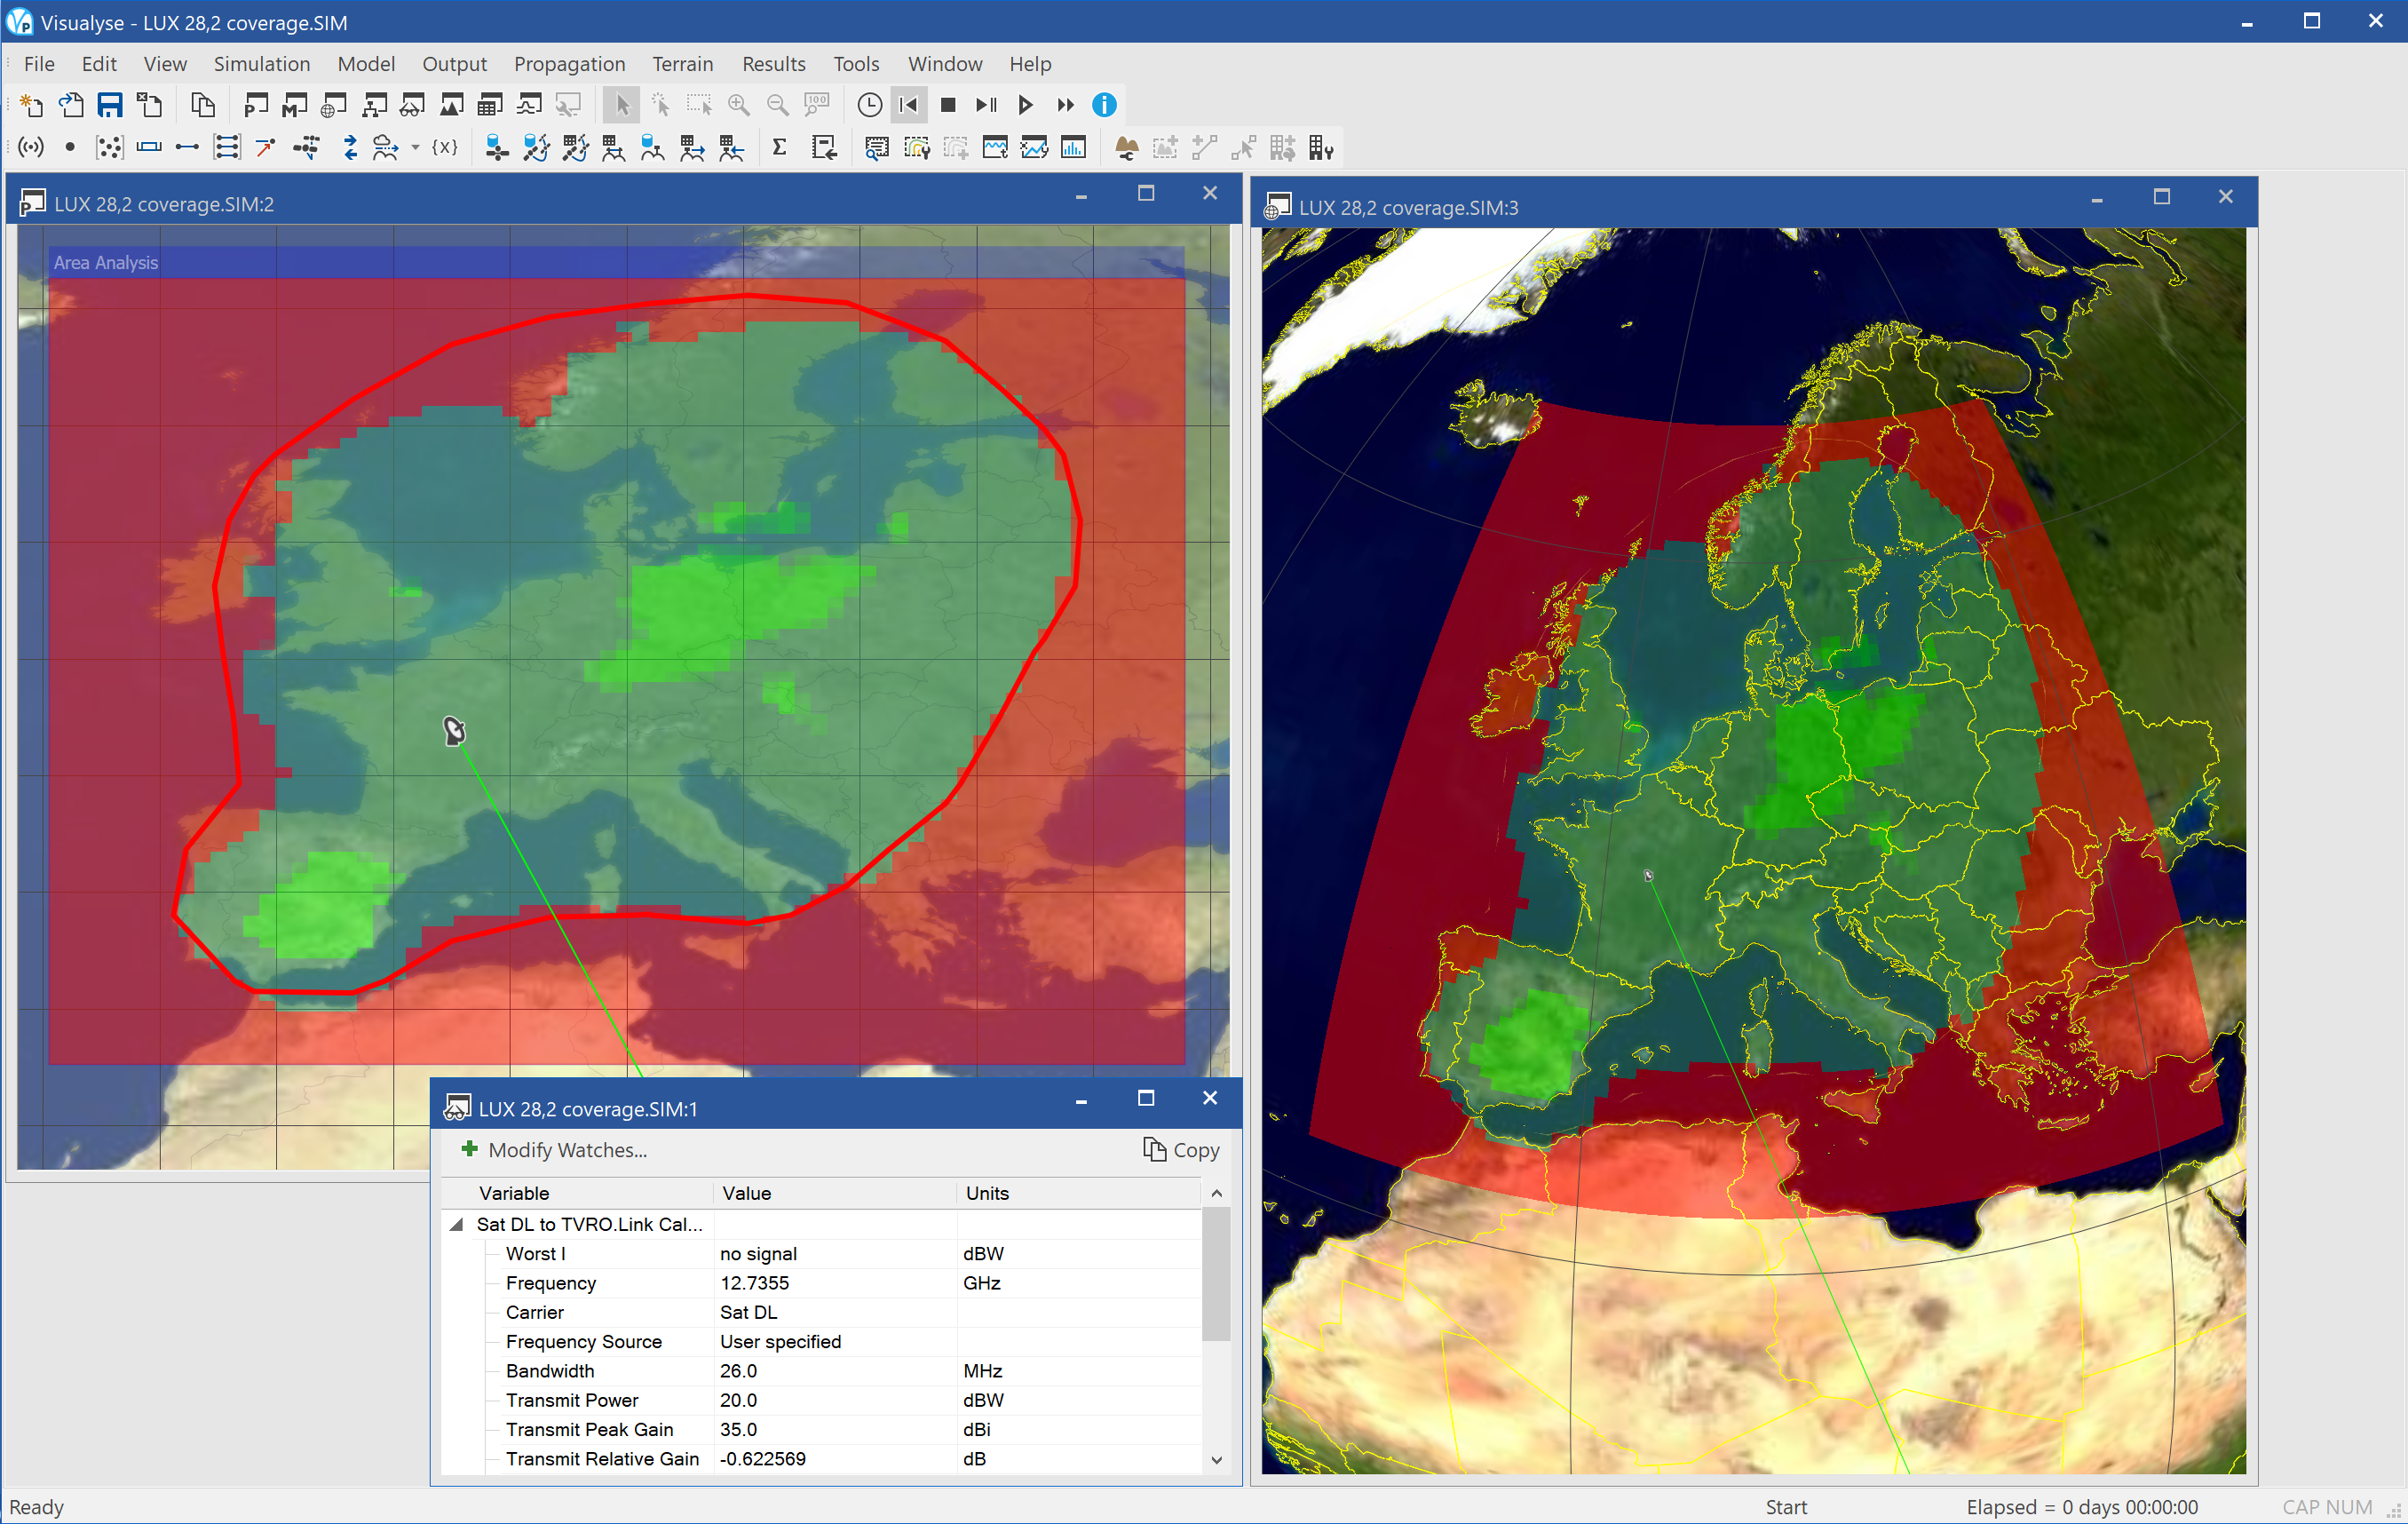
This example shows graphically the coverage of a GSO satellite network over Europe.
The satellite location and gain pattern are those for the LUX-28.2 satellite extracted from the ITU’s database via Visualyse Professional’s interface to SRS. The transmit power, bandwidth and frequency were also taken from SRS read using the SpaceCap tool.
The link was set up to a reference earth station representing a TVRO service. The link was configured using an earth-space propagation model that included ITU-R Rec.676 for gaseous absorption and ITU-R Rec.618 for rain, using a percentage of time of 0.1%. Hence the link budget is calculated for an availability of 99.9% of time.
The location of the test point was then varied using Visualyse Professional’s Area Analysis tool. Locations were then coloured depending upon whether the threshold of C/N > 10 dB for 99.9 % of time could be met as follows:
Bright green: could be met with a 60 cm dish
Dark green: could be met with an 80 cm dish
Red: would require receive antenna greater than 80 cm.
The simulation is configured with three views open:
- Plate Carrée map view (top left) showing the area analysis, satellite footprint, reference test station and link;
- 3D view (top right), also showing the area analysis, satellite footprint, reference test station and link;
- Watch window (bottom left) showing the link budget from the GSO satellite to the reference Earth Station
This simulation can be extended in a number of ways – for example including interference from adjacent satellites, the impact of station keeping or pointing errors etc.
Lux Arabsat Coordination
| Action: | None |
| Modules used: | None |
| Terrain regions: | None |
| Frequency band: | Ku |
| Station types: | GSO Satellite, Earth Stations |
| Propagation models: | Free space, ITU-R Rec.P.676 |
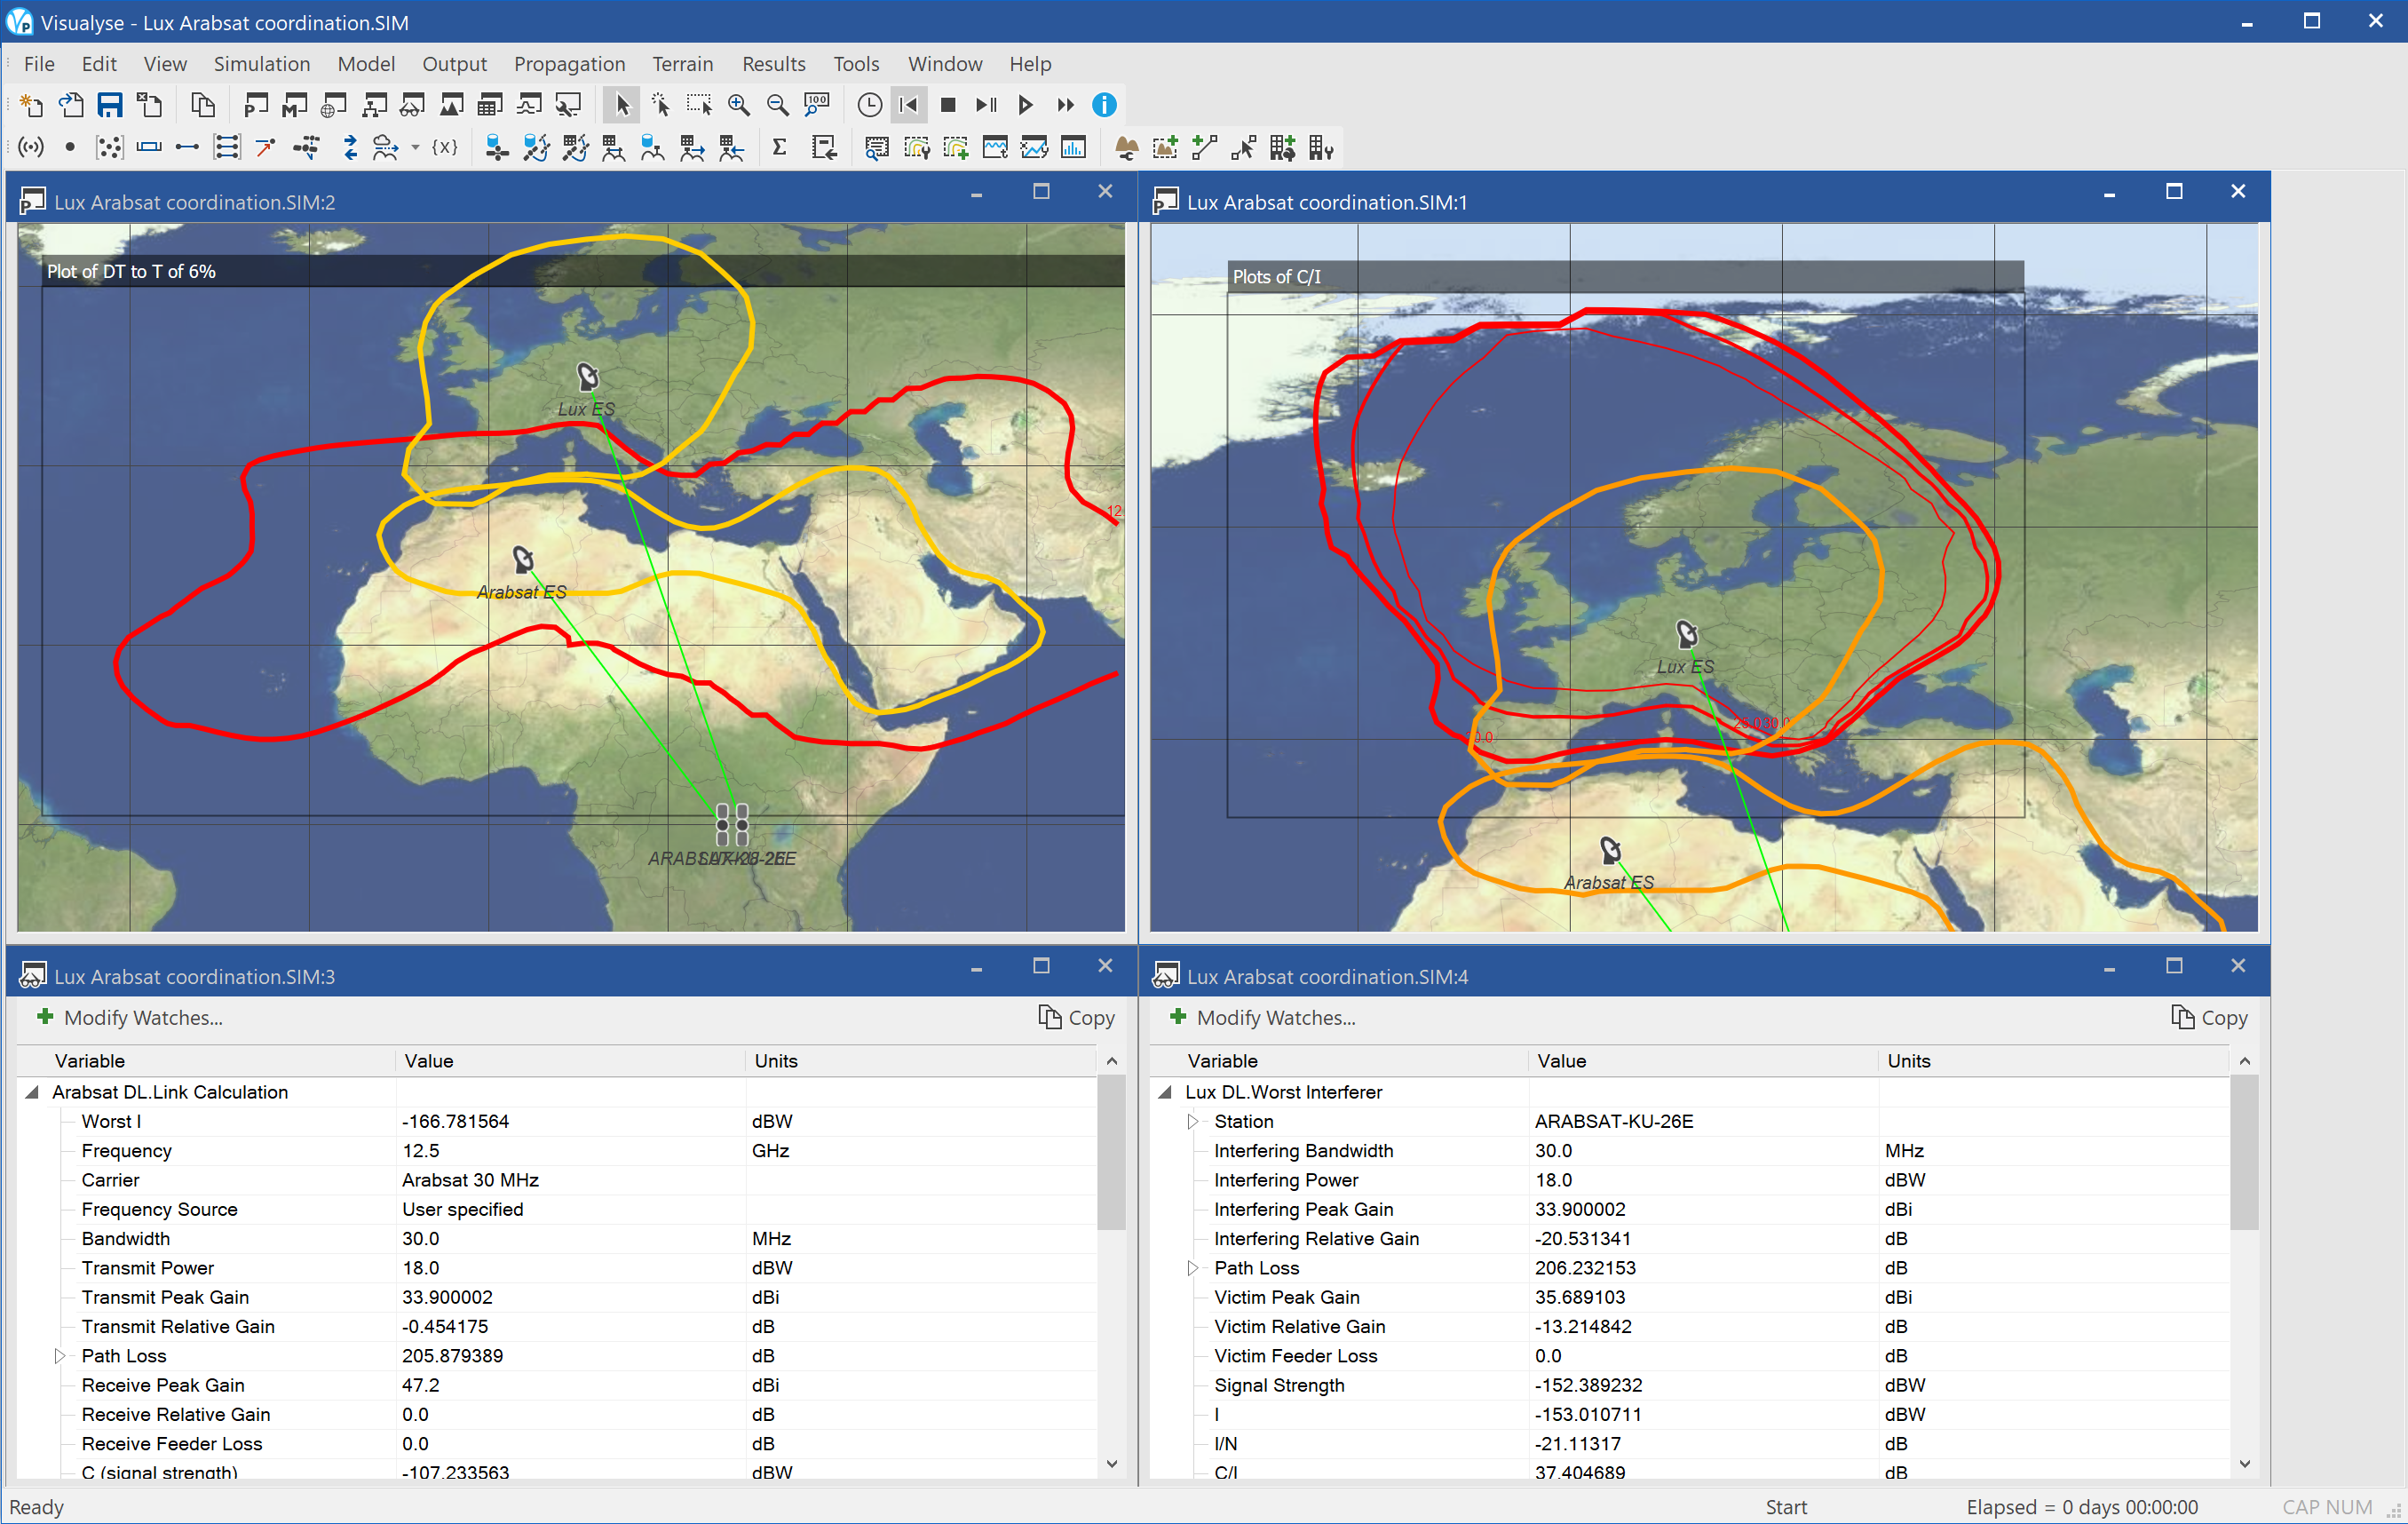
This example shows Visualyse Professional undertaking the sort of calculations required for detailed coordination between two GSO satellite networks.
Using Visualyse Professional’s interface to the ITU’s SRS database combined with parameters extracted using SpaceCap, the following two networks were configured:
| Network | Lux-28 2E | Arabsat-KU-26E |
| Longitude | 28.2E | 26E |
| Beam | T1 Transmit | KDF Transmit |
| Peak gain (dBi) | 35.0 | 33.9 |
| Transmit power (dBW) | 20.0 | 18.0 |
| Bandwidth (MHz) | 26.0 | 30.0 |
| Receive temperature (K) | 180 | 120 |
| Earth station dish size (m) | 0.6 | 0.8 |
Both networks were assumed to be operating at 12.5 GHz with a clear air propagation model of free space path loss plus attenuation due to atmospheric gases ITU-R Rec.P.676.
The DT/T and C/I’s were then calculated at the reference earth station across the relevant service areas.
The simulation is configured with four views open:
- Plate Carrée map view (top left) showing the satellite beam footprints and a contour where the DT/T > 6% (i.e. I/N > -12.2 dB) for interference from Arabsat into the Lux network
- Plate Carrée map view (top right) showing the satellite beam footprints and a contour where the C/I > 20, 25, 30 dB for interference from Arabsat into the Lux network
- Watch window (bottom left) showing the link budget for the wanted and interfering signals for Arabsat network
- Watch window (bottom right) showing the link budget for the wanted and interfering signals for Lux network
This simulation can be re-configured to show the converse interference path, i.e. from Lux-28.2E into Arabsat by changing the two Area Analysis as follows:
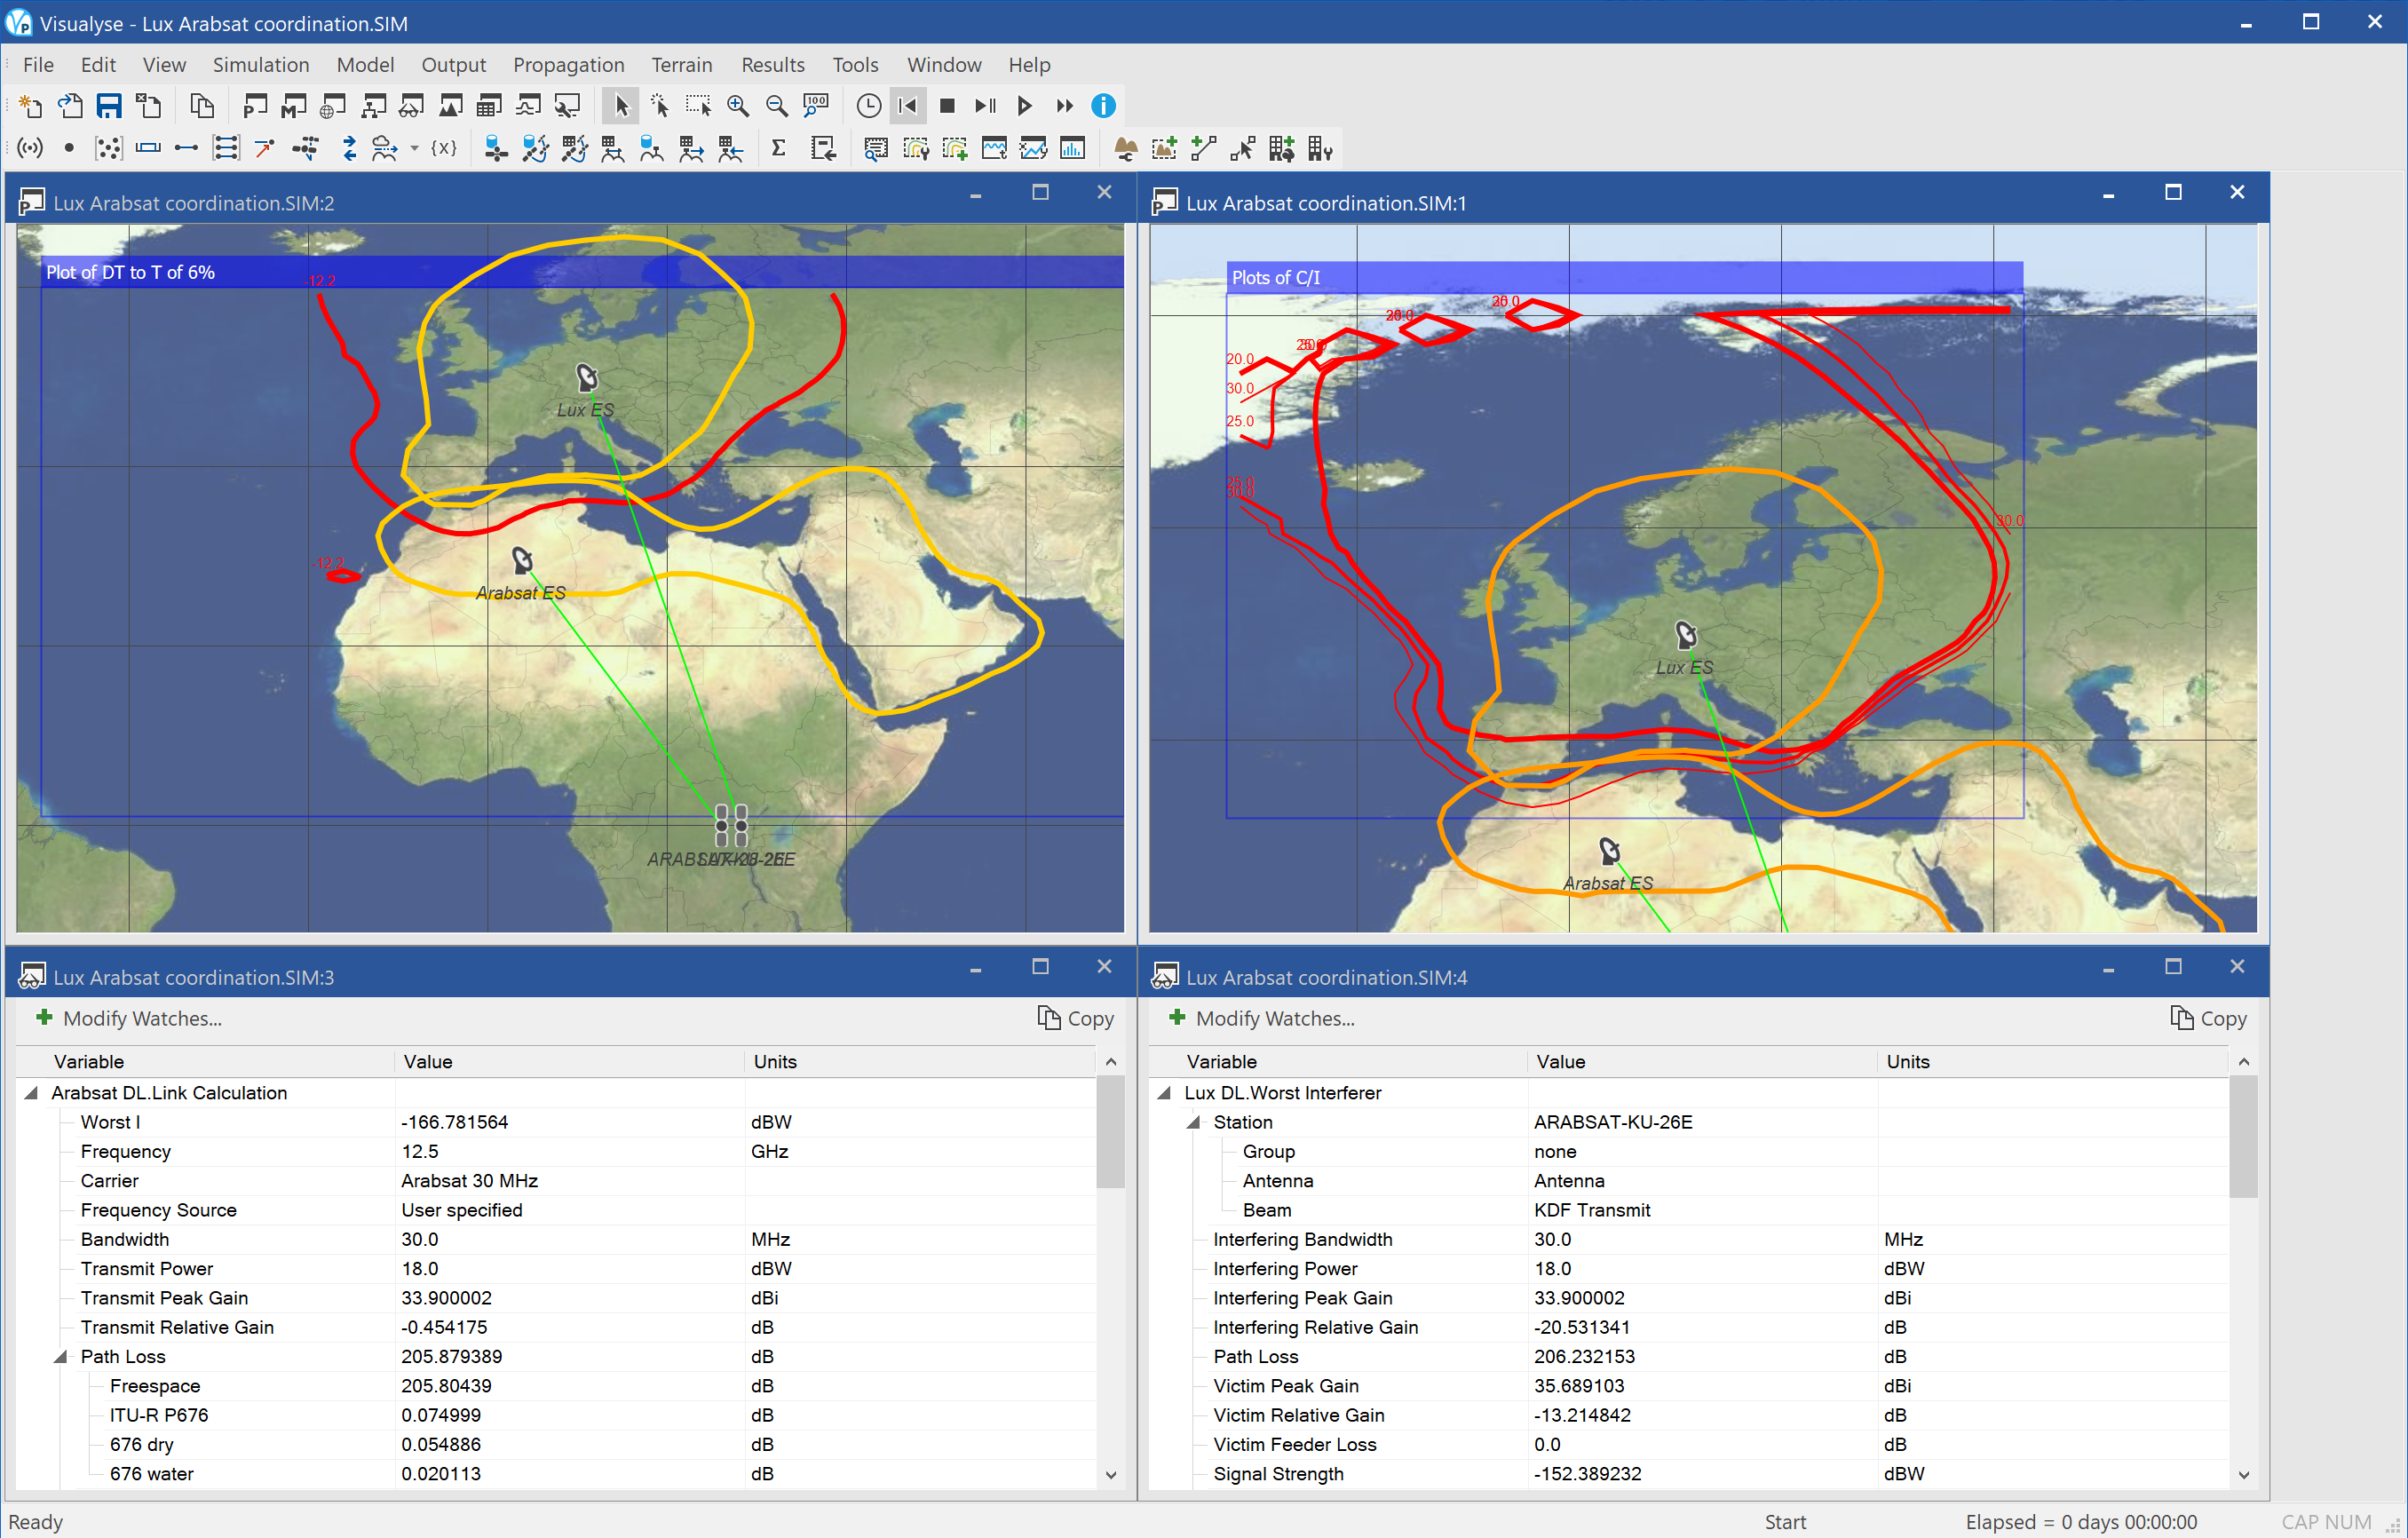
The scenario can be built on to include many other factors, including impact of interference mitigation, what-if analysis, end to end performance and coordination constraints.