Quick Overview of the Exercise
Agenda Item 1.4 was to:
“consider frequency-related matters for the future development of IMT-2000 and systems beyond IMT-2000 taking into account the results of ITU-R studies in accordance with Resolution 228 (Rev.WRC-03)”
Agenda Item 1.4 covers many potential sharing scenarios and frequency bands: this tutorial considers C band sharing with satellite Earth Stations in particular.
Visualyse Professional can be used to study the types of constraint that may need to be placed on IMT-2000 systems in order to mitigate interference in these scenarios.
In our exercise, we will model a WiMAX network operating in the vicinity of a satellite earth station. WiMAX parameters are assumed to be consistent with IMT-2000 standards given in ITU-R Rec.M.14571.
Area Analysis
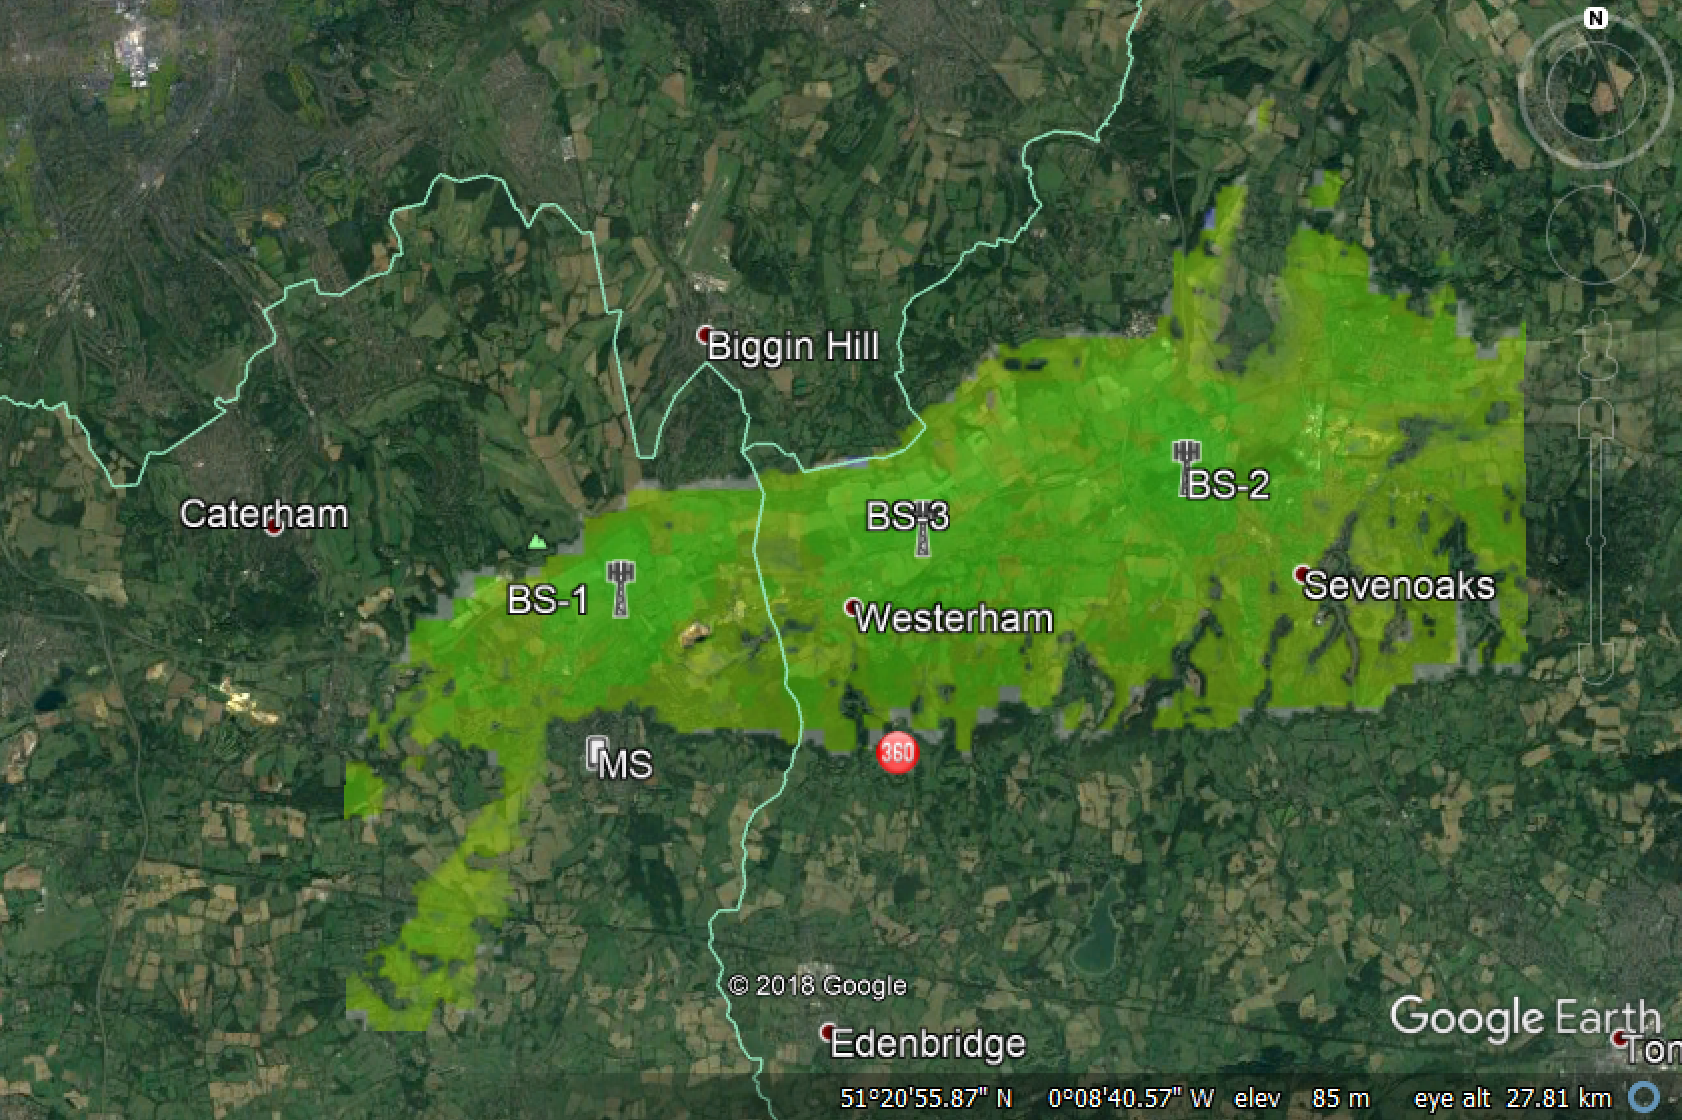
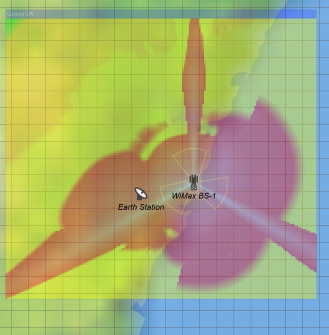
We will use Visualyse Professional’s powerful area analysis tool to create a colour coded plot showing locations where an earth station would experience excess interference from a specific WiMAX base station.
Note this could also be used the other way around – for example show locations around an earth station where a WiMAX base station could not be located.
Area analysis can be used to show these colour coded plots or contours of any link parameters (e.g. received signal, interference C/I, PFD etc.) as in the two figures below.
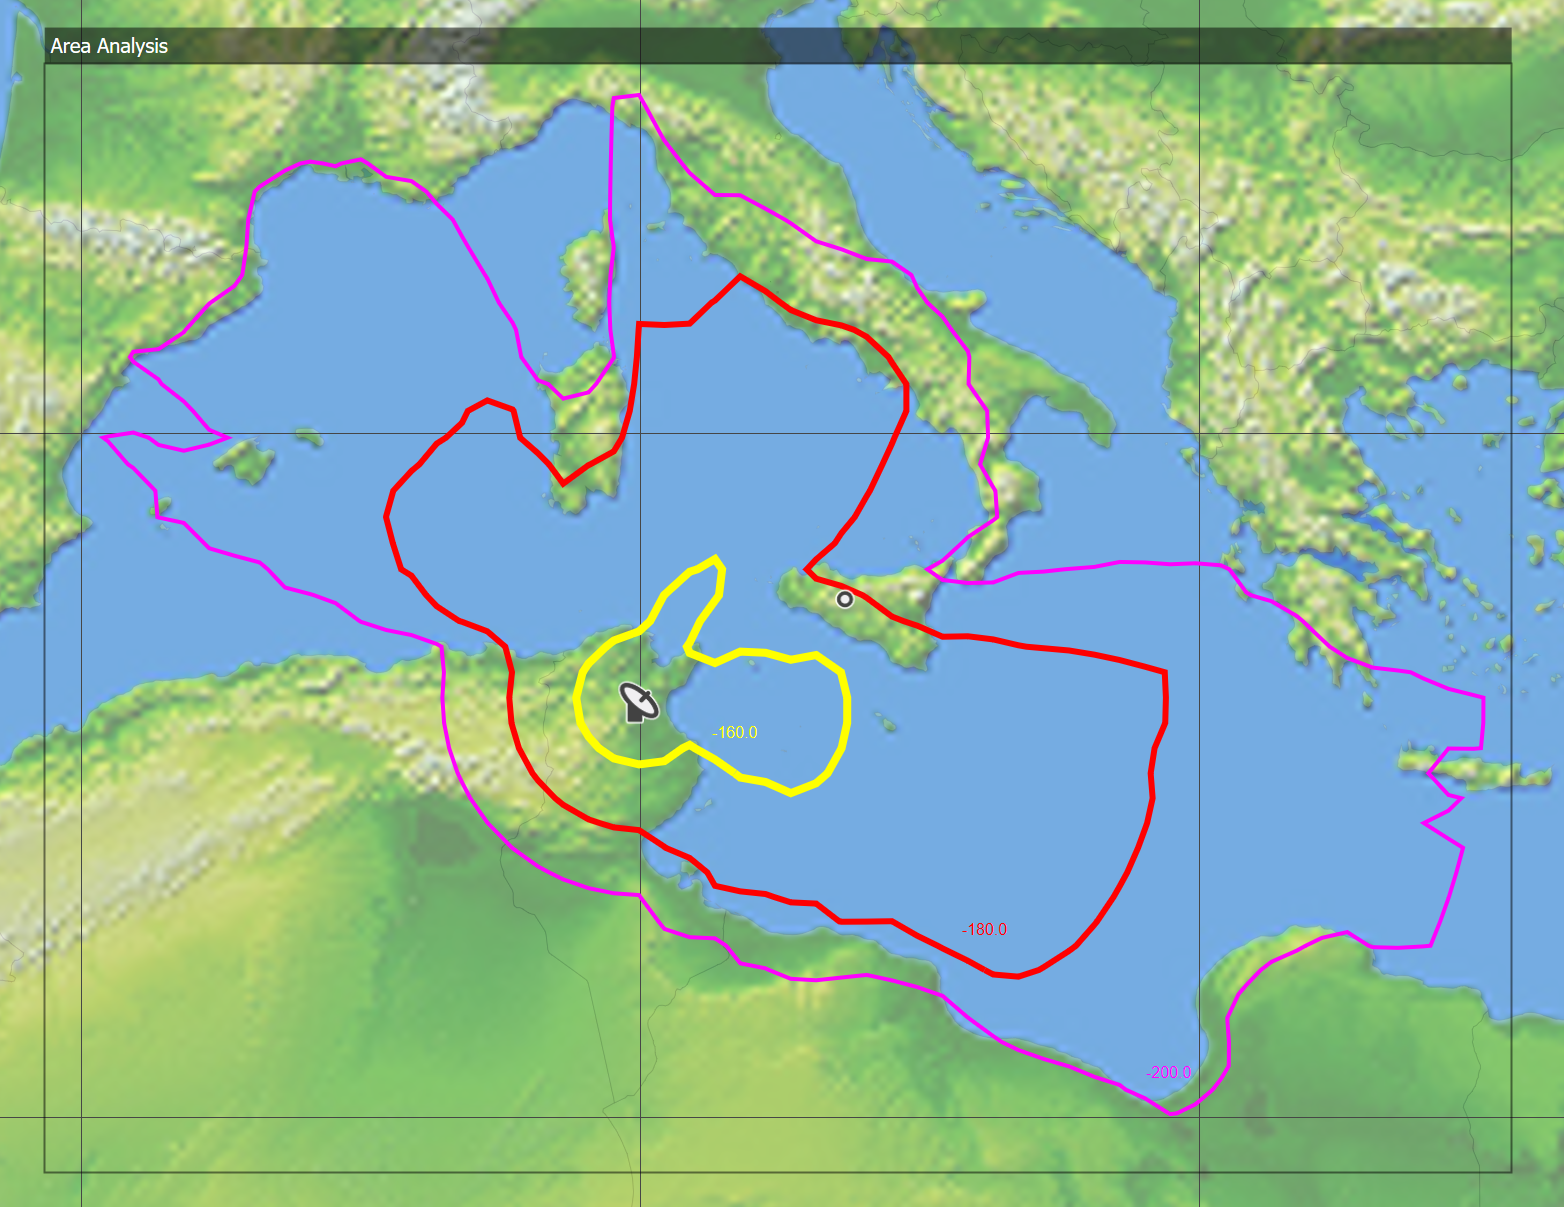
As a quick look-ahead, the figure below shows the exclusion zone that results from basic analysis under the assumption of path loss occurring for 50% time in Recommendation ITU-R 452-16.
Key Modelling Features
The key features of Visualyse Professional that will be used in this model are:
Antenna Gain Patterns – in our model we have used ITU-R Rec. S.465 for the earth stations. For the WiMAX system, we have used both ITU-R Rec. S.1245 and as an option a gain table. This latter option allows you to enter specific antenna performance that is not included in Visualyse Professional’s large list of roll-off masks.
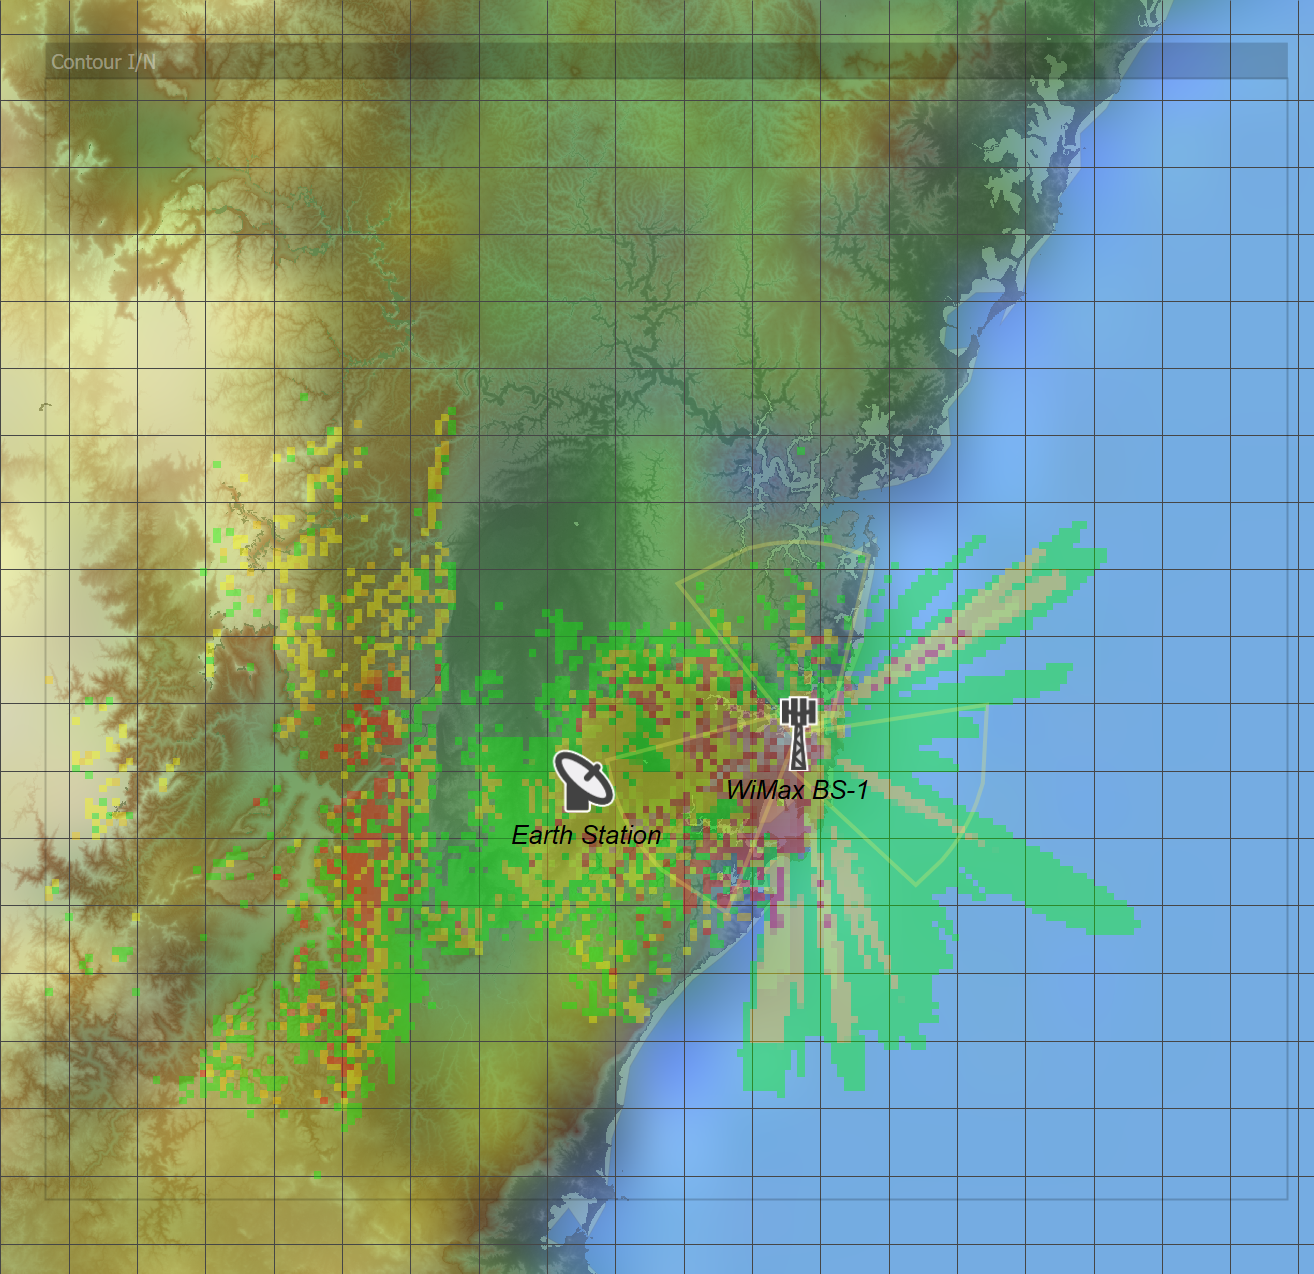
The WiMAX base station antenna is modelled with multiple sectors – this is reflected in the shape of the exclusion zone around the base station in the figure above.
Antenna Pointing – Visualyse Professional allows you to point antennas based on azimuth and elevation of the antenna mechanical boresight. In this simulation, these are defined directly and for the base station the downtilt is an important parameter. In other simulations, antennas may be pointed towards other stations or can be made to scan between defined angles.
Propagation Models – in this type of scenario the propagation model used and the model parameters are of vital importance. This is an area where the power of Visualyse Professional becomes apparent. The baseline scenario uses Recommendation ITU-R P.452 with no terrain, under assumptions of long term interference conditions (i.e. 50% of time). Below there is discussion of the impact of varying model scenarios.
You can also vary the rain rate, but by default this is determined per Recommendation 837 using the IDWM database.
Deploying the WiMAX Network – Visualyse Professional allows you to define deployments of many stations in several ways. In this case, we have imported the locations at defined latitudes and longitudes or use the hexagon deployment facility in the Service Area Wizard.
In other scenarios, you could move stations randomly over a defined area using the Define Variable module (allowing you to do statistical analysis using location as Monte-Carlo variable).
Propagation Model Variations and Nuances
Propagation loss is the key factor in determining the size of exclusion zone around a station. In Recommendation 452-16 anomalous propagation modes dominate for short time scales and this leads to relatively low path loss and large exclusion zones.
Normally, planning criteria for earth stations are required to address short term statistics for availability and this may require, under worst case assumptions, short term statistics for interference.
Hence our baseline uses 50 % of time. However, the earth station performance is defined in terms of C/I and the 0.1% statistics could be driven by fading on the satellite link.
Technically, we should perform a numerical correlation between C and I, which we can do in Visualyse Professional. However, to illustrate the effect, we have re-run the static analysis for 0.1%, 1% and 20% time in the propagation model.
As the percentage time varies from 0.1% to 1% and to 20% the exclusion zone size decreases accordingly.
 |  |  |
|---|---|---|
| 0.1 % | 1% | 20% |
Note these figures assumed the same I/N threshold: in practice, there are different ones for short term and long term. But it shows how important it is that the threshold and percentage of time used in the propagation model are correctly selected.
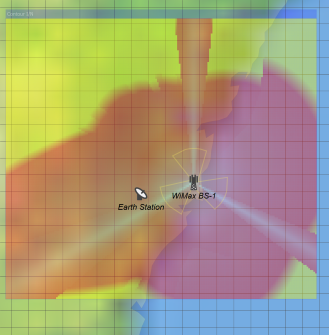
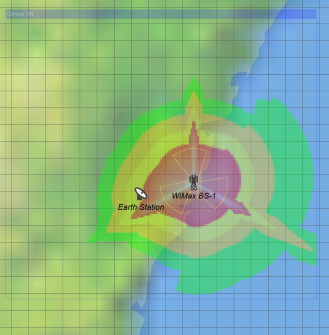
Terrain
Another important factor in the propagation is the effect of terrain. Visualyse Professional allows you to use any latitude / longitude / height terrain data with a minimum of fuss.
Introducing terrain can have a radical effect on the exclusion zone and whilst this may not be used in initial planning / coordination triggering, it can certainly be used in site specific coordination.
If you have the Terrain Module you can extend the final simulation by adding terrain and seeing the impact on the exclusion zone.
If you do not have the Terrain Module you can still see the effect by removing your dongle and loading up the relevant example file. If Visualyse Professional does not find a dongle it runs in demonstration mode which gives limited access to all the Modules.
-
This is particularly appropriate given that WiMAX has been accepted as a radio interface for IMT-2000 within the ITU framework ↩