Visualyse GSO User Guide
Documentation Control
| Date: | Software Version: |
|---|---|
| June 2026 | 3.0.8.2 |
Contact Information
You can contact us at:
Address Transfinite Systems Ltd, Suite 24 (5th Floor), AMP House, Dingwall Road, Croydon, CR0 2LX U.K
Phone +44 20 3904 3220
Fax +44 20 3904 3211
Email info@transfinite.com
Web www.transfinite.com
Transfinite Systems reserves the right to change features and screen layouts without notice.
©Transfinite Systems Ltd
Introduction
Visualyse GSO V3 is a collection of software tools that control and guide the process of coordination between geostationary satellite networks that share the same frequency bands. The coordination process is split into two parts:
-
Determine which systems you need to coordinate with
-
Undertake interference analysis to support the detailed coordination process
The number of networks that are submitted to the ITU bi-weekly complicates the first part. New networks are published once every two weeks in a database known as the International Frequency Information Circular (IFIC), which replaced the paper and microfiche formats of the Weekly Circular (WIC) and Special Sections with effect from 1 January 2000.
Visualyse GSO V3 works seamlessly with these databases, automatically flagging filed networks that may need to be coordinated. This removes a large amount of the work needed to screen the publications.
The coordination triggers used are based on worst case ΔT/T calculations and coordination arc definitions. Both or either measure can, in certain situations, trigger detailed coordination.
Further analysis is performed in terms of C/I ratios. C/Is are calculated and compared to a threshold value - the resulting margin is displayed and the C/I calculation can be inspected in detail.
Quick Overview
If you've only got 5 minutes to spare, then this is the section to read. Once you have installed the software then go ahead and run it up. The rest of this section provides a quick overview of the software and what it can do.
Coordination Check
The first step is to look at whether there might be a requirement for coordination between your networks and networks in an ITU IFIC. We call this a Coordination Check.
Analysis
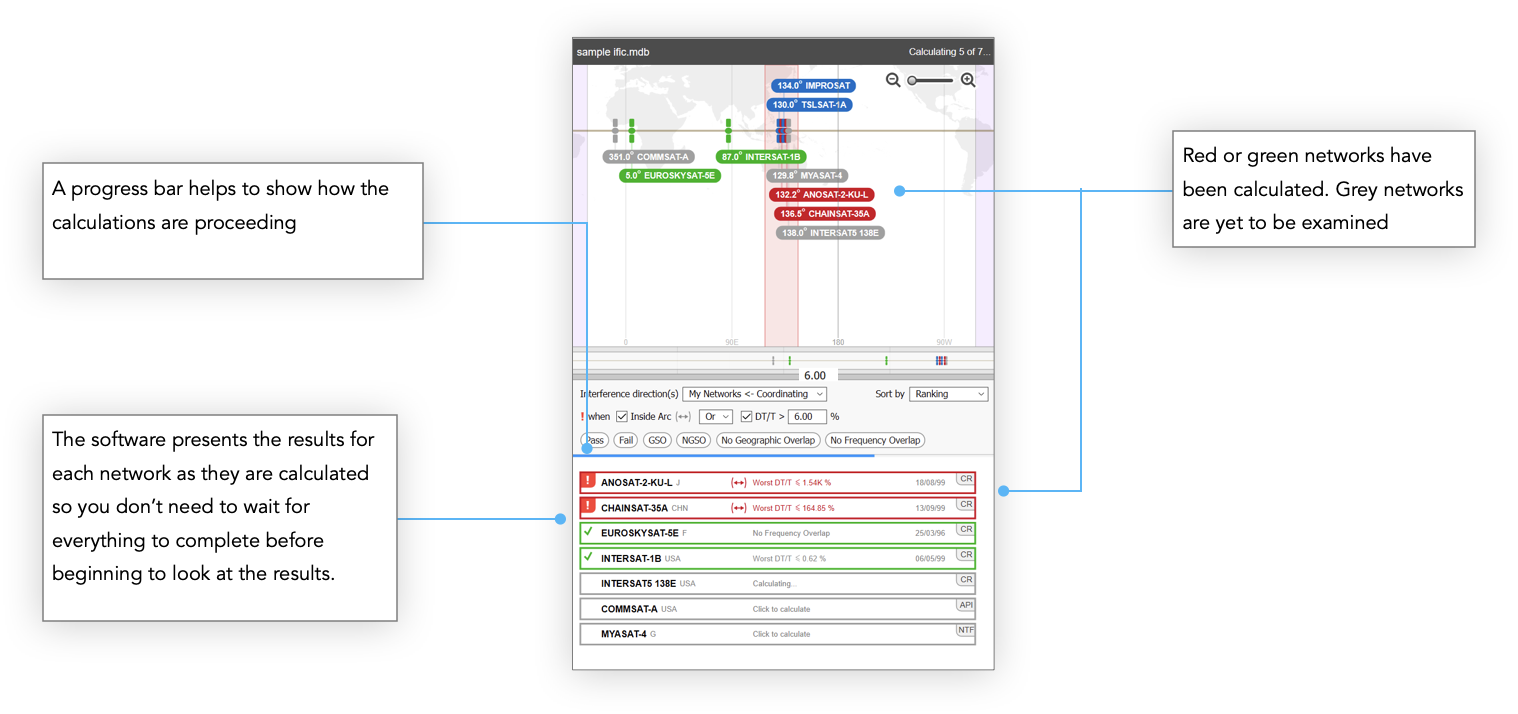
Visualyse GSO V3 will load the IFIC and begin analysing each of the networks. The networks are shown on the left-hand side of the application.
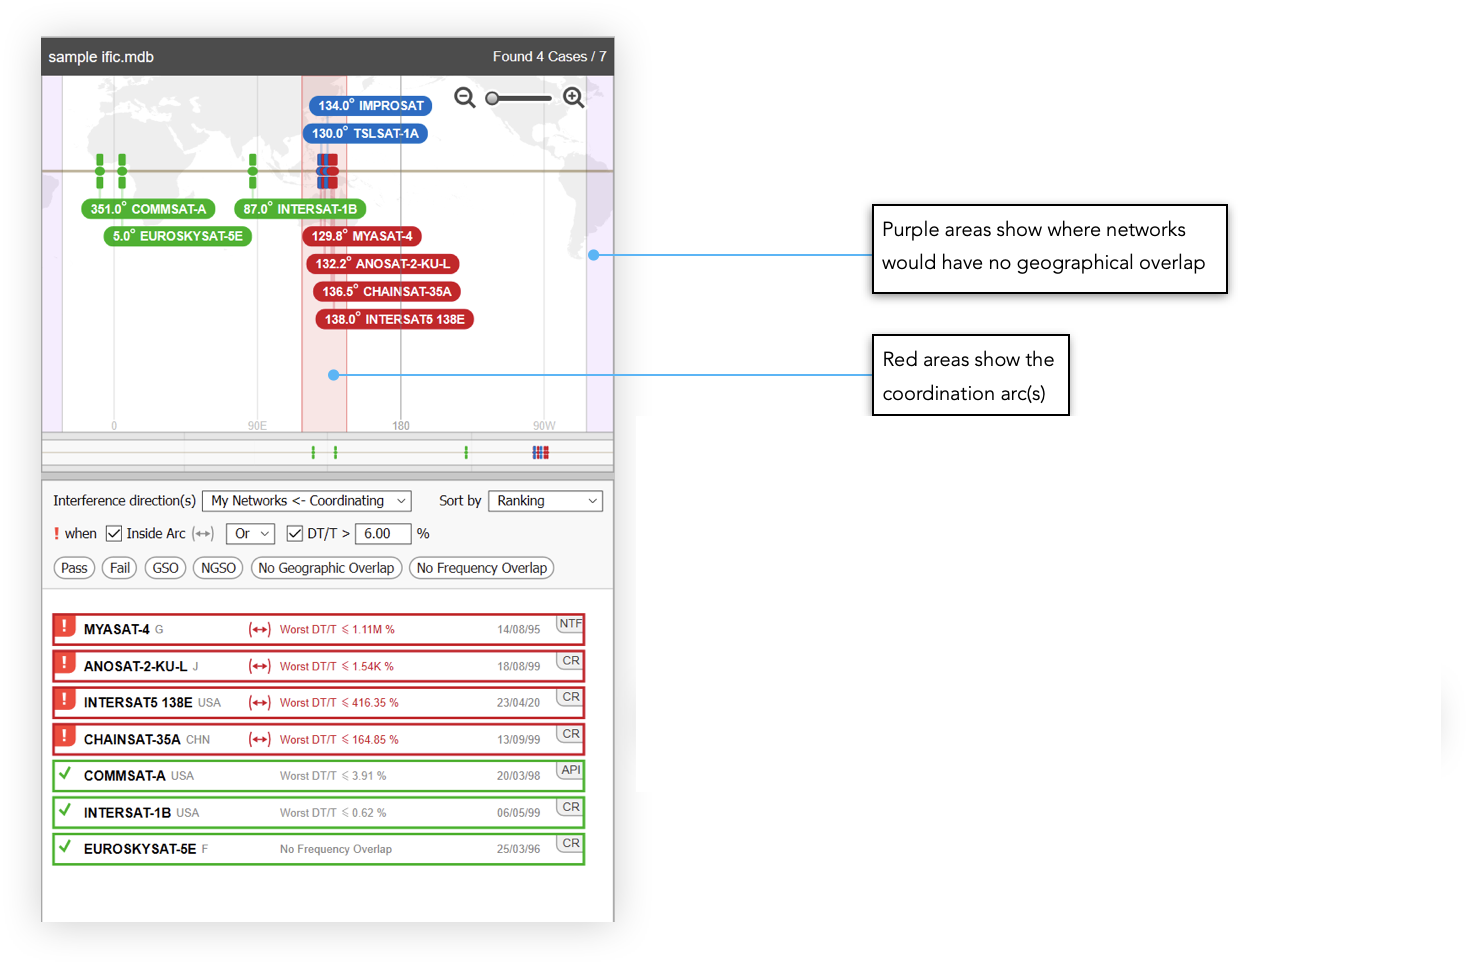
At the top is the Satellite Map. This shows the networks arranged along the GSO arc. Labels for your networks are shown above the arc line and labels for the other, coordinating networks, are shown below the line. Purple areas show where networks would have no geographical overlap with yours.
The full analysis may take a few minutes but as soon as the calculations for a particular network are complete (indicated by a change in colour from grey to red or green) you can click on it to see the results without waiting for all the other networks to finish.
Results
When you click on a network, the right-hand side of the application changes to show the results of the analysis.
Coordination Trigger
Visualyse GSO V3 makes it easy to determine whether coordination is required. Results can be examined in detail making verification a simple process
Data can be easily copied and pasted into other applications.
Detailed Coordination
Once you have excluded any beam pairs (based on beam contour overlap) the next step is to take the included ones across to Detailed Coordination.
Software Features
We'll now look at all the features of the software in more detail. In order to highlight the various options, tools, and views available we'll make use the sample data that is provided with the software. This data is based upon the scenario of a spectrum manager who is responsible for two Fixed Satellite Service (FSS) GSO satellite networks:
-
IMPROSAT, located at 134E
-
TSLSAT, located at 130E
In this document, and in the software, these will be referred to as My Networks.
Scenario
Both of these satellites are currently under coordination and have not been brought into use. Bi-weekly, the spectrum manager must check that other systems (notified to the BR and then distributed via IFIC) would not present issues:
-
either by being likely to cause unacceptable interference into the spectrum manager's networks
-
or by being likely to suffer unacceptable interference from the spectrum manager's networks
A key aspect in assessing what should be done in these situations is to know which network (the spectrum manager's or those in the IFIC) has regulatory priority. This is typically based upon which network was filed first. This is far from a clear cut decision because, while the original submission might have priority, modifications could have been made at a later stage. In this situation some beams (or IFIC Groups) will have priority while others don't. One powerful aspect of Visualyse GSO V3 that will be demonstrated is the ability to deal with Regulatory Priority and the automatic detection of cases where coordination may be needed.
In addition Visualyse GSO V3 could be used for other tasks involved in GSO satellite spectrum management, for example:
-
During design phase, to check the complexity of coordination and hence feasibility of a proposed new system, including searching the GSO arc for suitable locations
-
When submitting Advance Publication Information (API), to determine which administrations are likely to indicate they have an interest in protecting their system
-
When submitting Coordination Requests (CR), to determine which administrations for which coordination will be required
-
To check other systems during the API or CR phase, to ensure they will not cause an interference problem, and that any necessary regulatory steps are made to register interests where required
-
When Detailed Coordination is required, to perform the analysis based upon C/I calculations, including tools to show the impact of varying specific system parameters in the ability to share, and where each system has priority.
Demo Version Limitations
If you're using the demo version of the software then please be aware that this is subject to the following restrictions:
-
While you can edit or redefine you own network assets, these changes cannot be saved
-
You are limited to the use of the demonstration data provided for your networks. However, you can use any IFIC or the SRS database.
-
You will not be able to save or print.
-
You will not have access to certain additional features such as the Priority Map tool.
Apart from these limitations, the demo version shows as much as possible of the complete program. If you have any further questions please do not hesitate to contact us (info@transfinite.com).
Sample Data
Please note that the satellite antenna gains in the supplied demonstration networks and sample IFIC are un-realistic. This results in many DT/T levels being much lower than worst case analysis would indicate.
Getting Started
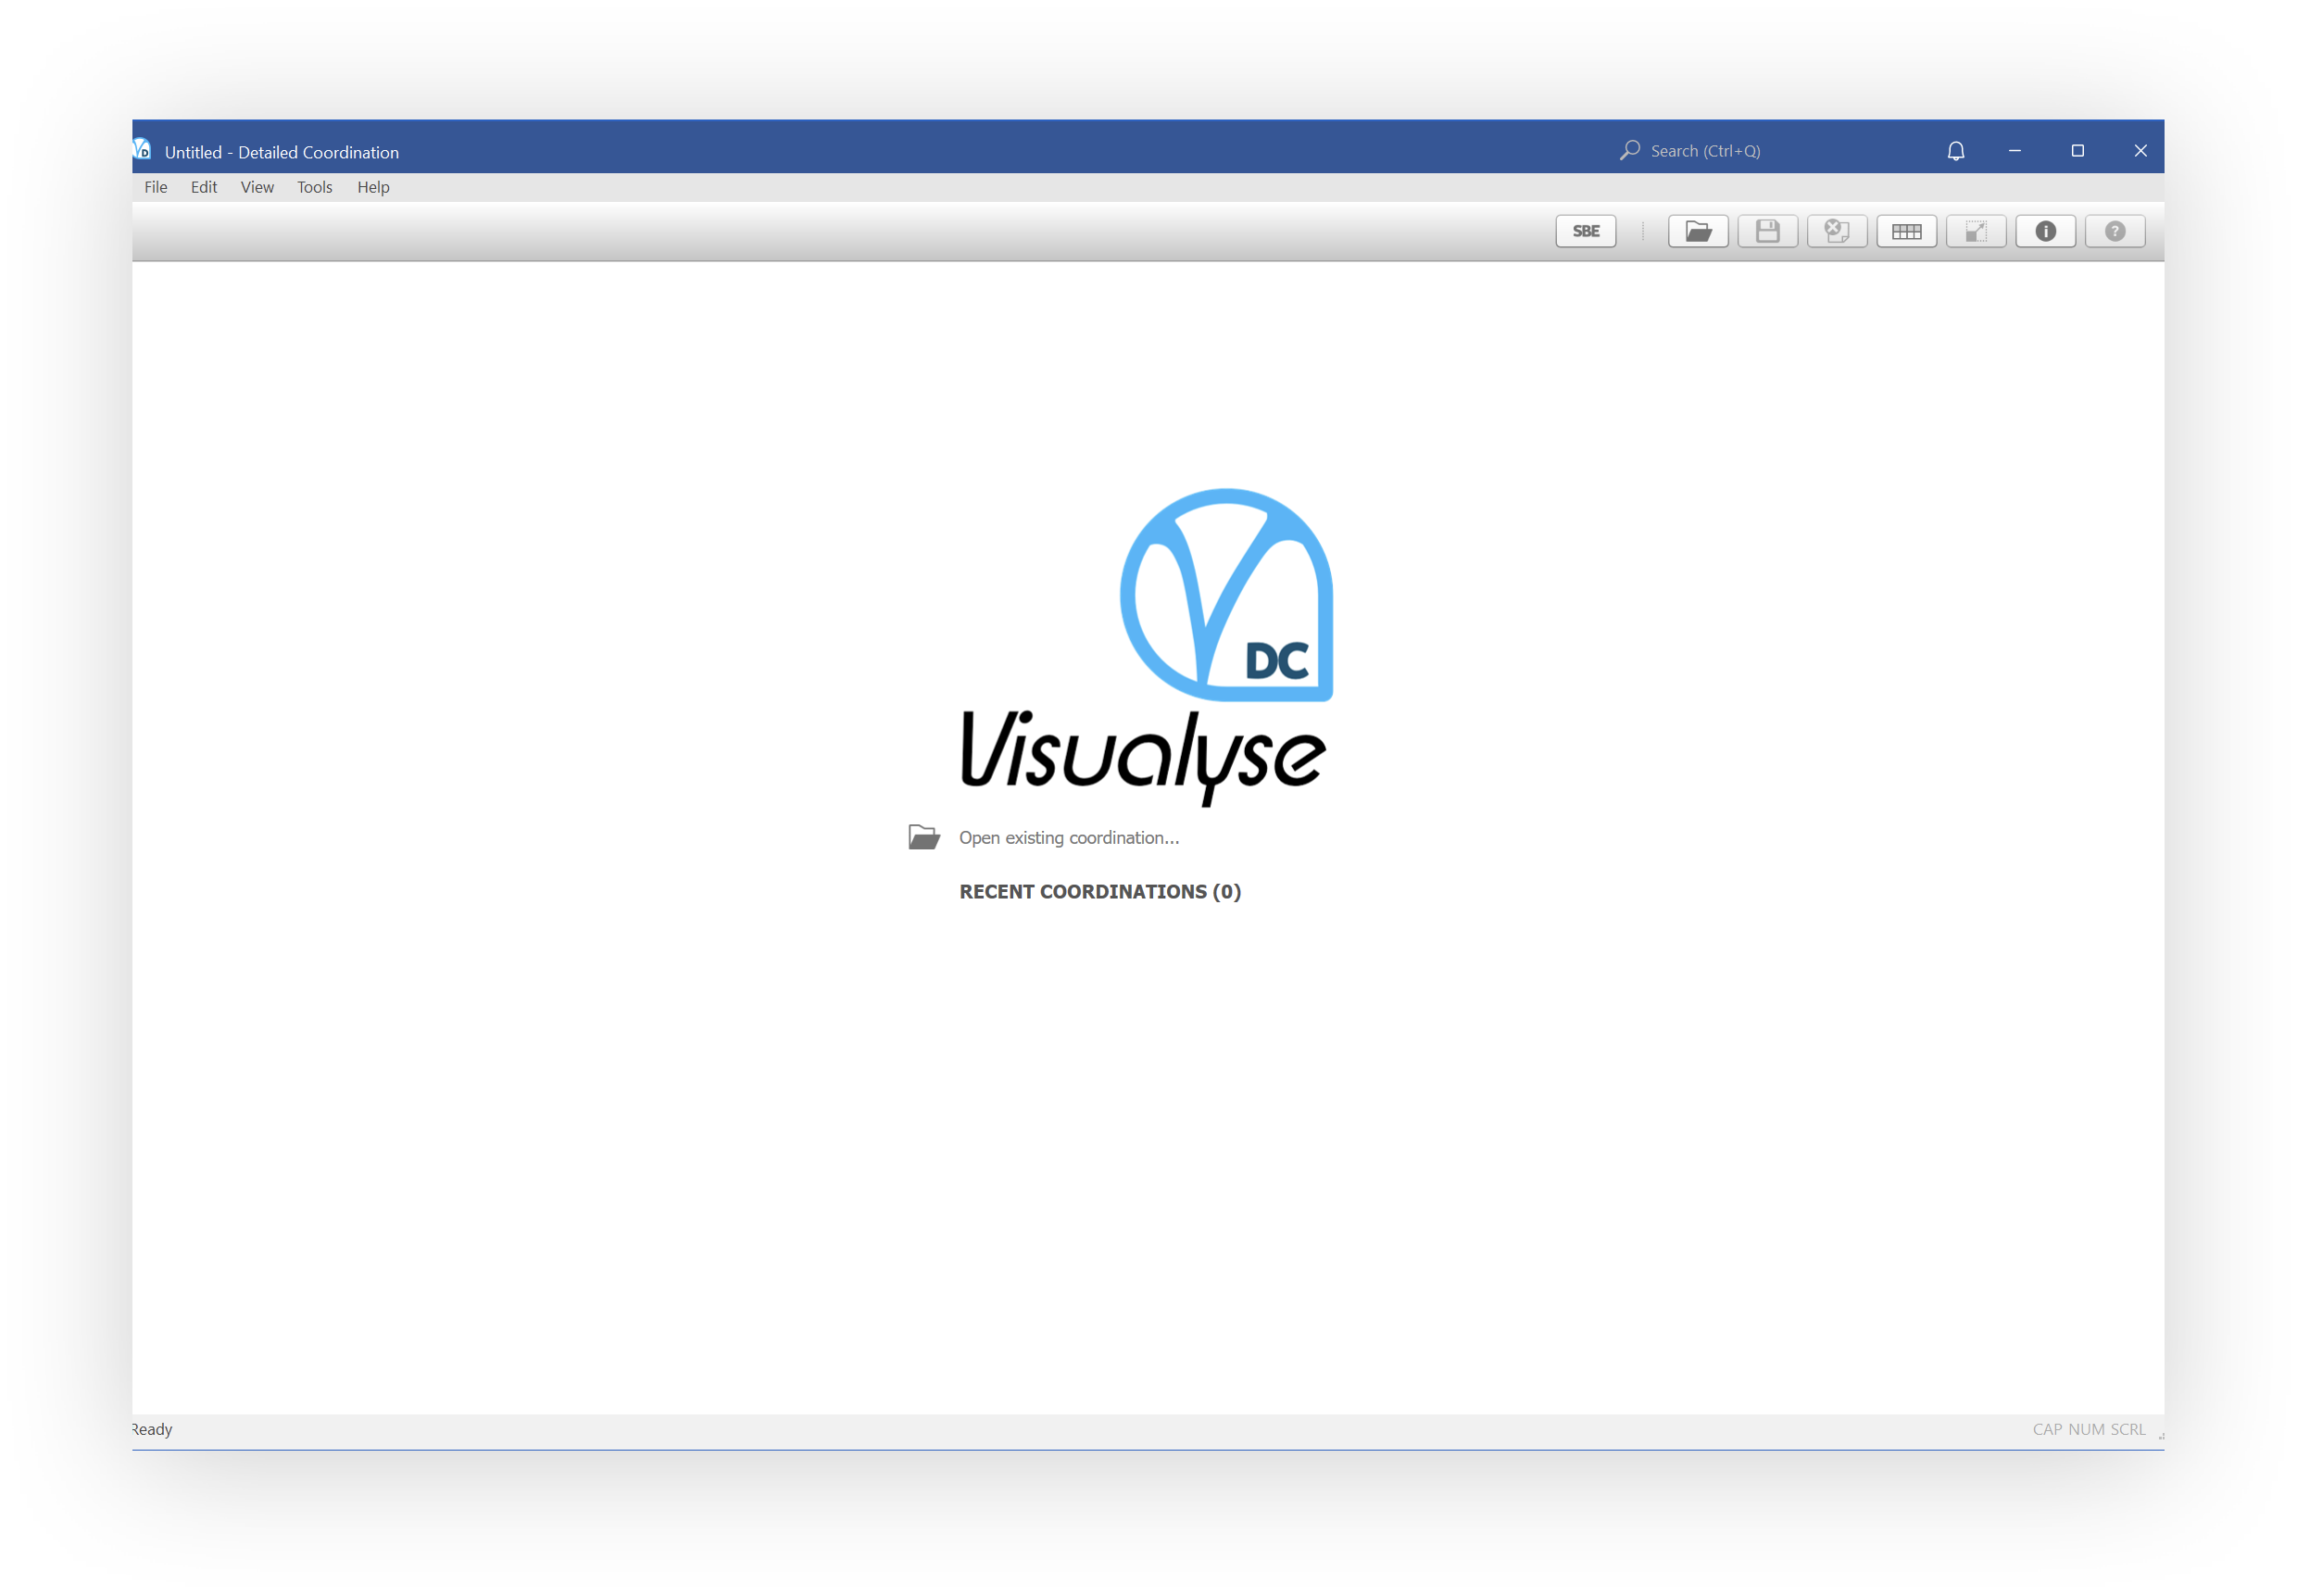
So let’s begin then.
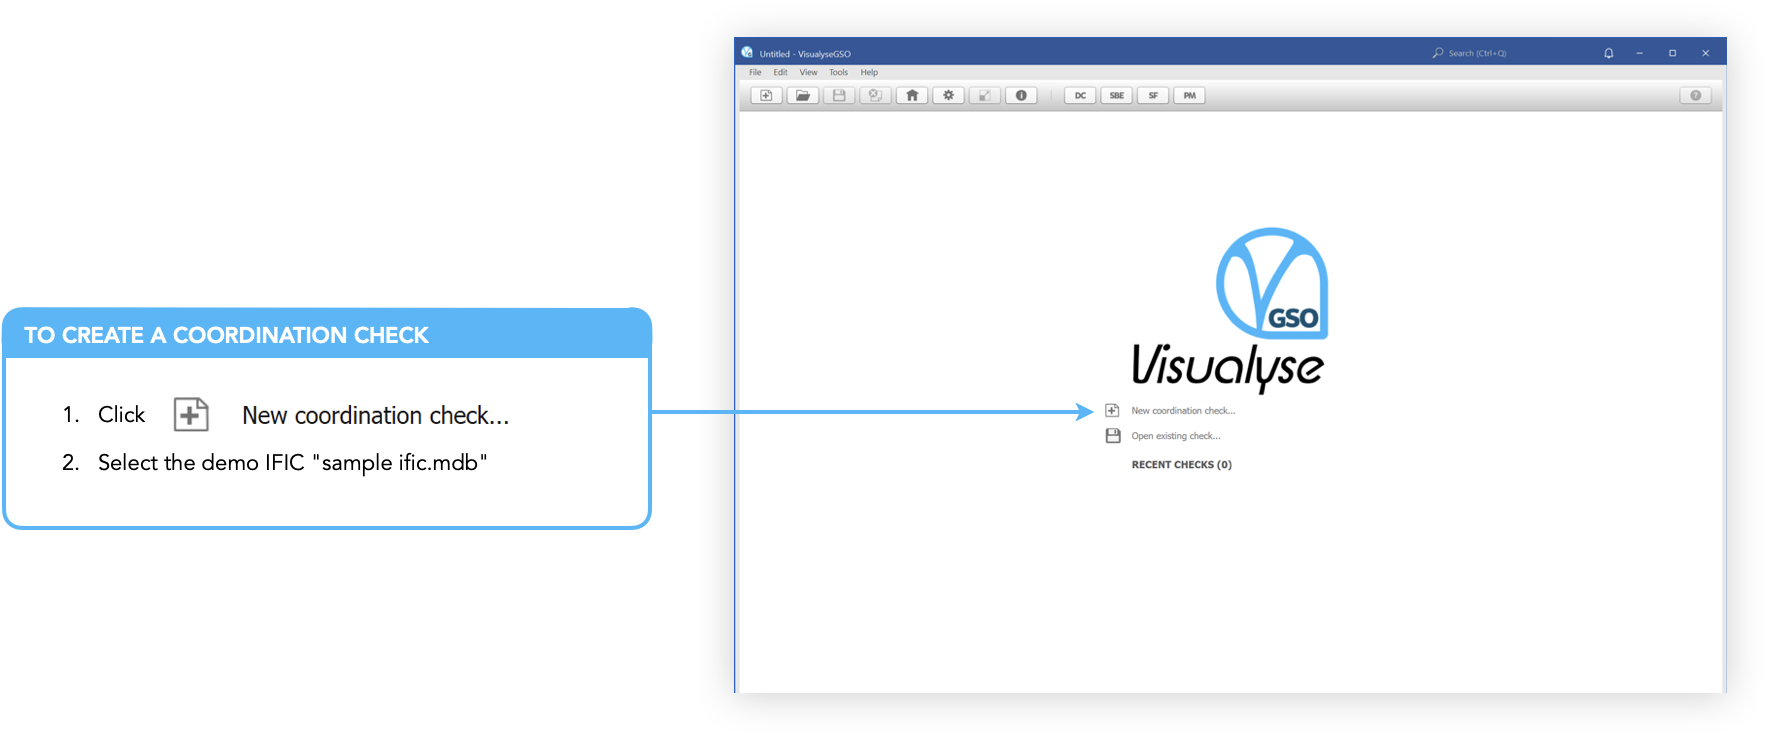
If you have a desktop shortcut, double click on it. Alternatively, click your PC's Start menu and select VisualyseGSO from the Visualyse GSO V3 program group. You are presented with two options: either create a new coordination check or open an existing one.
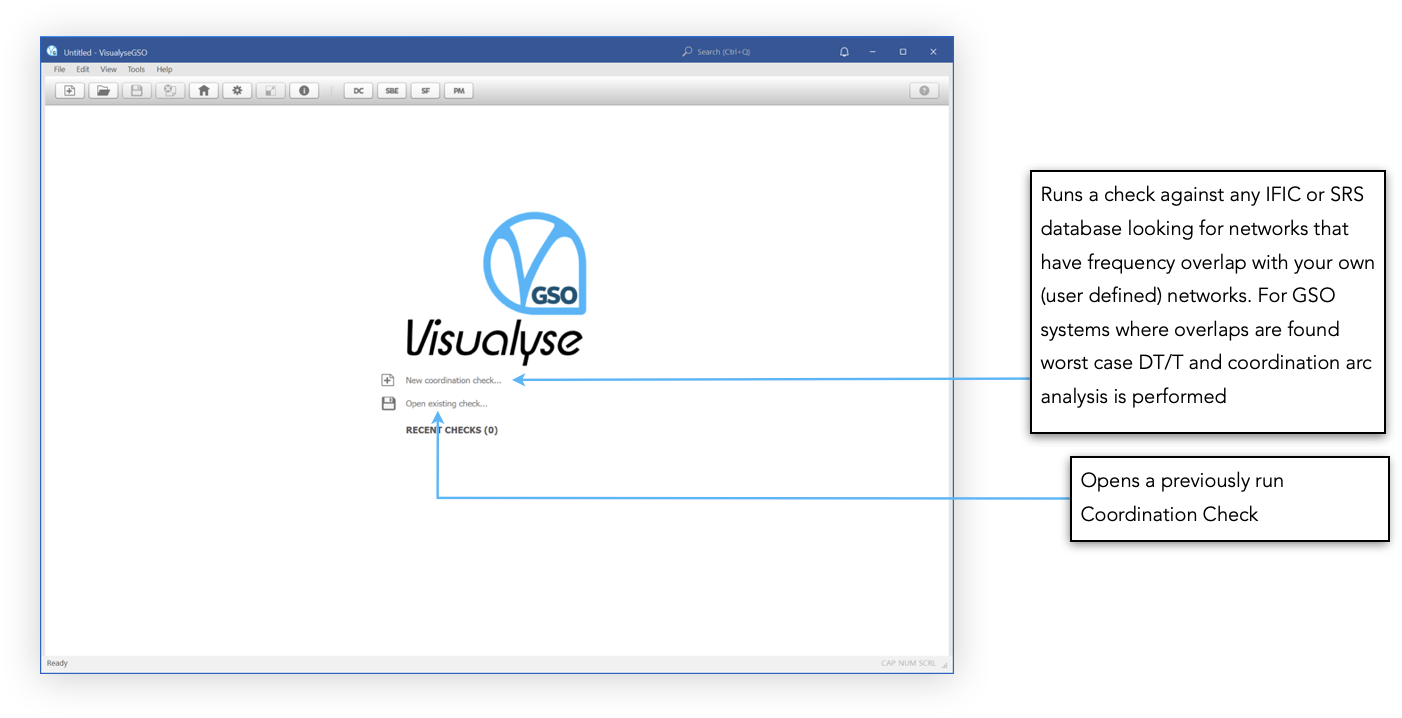
Across the top of the window is the toolbar. You can access various application features from here but in particular you can access the software settings.
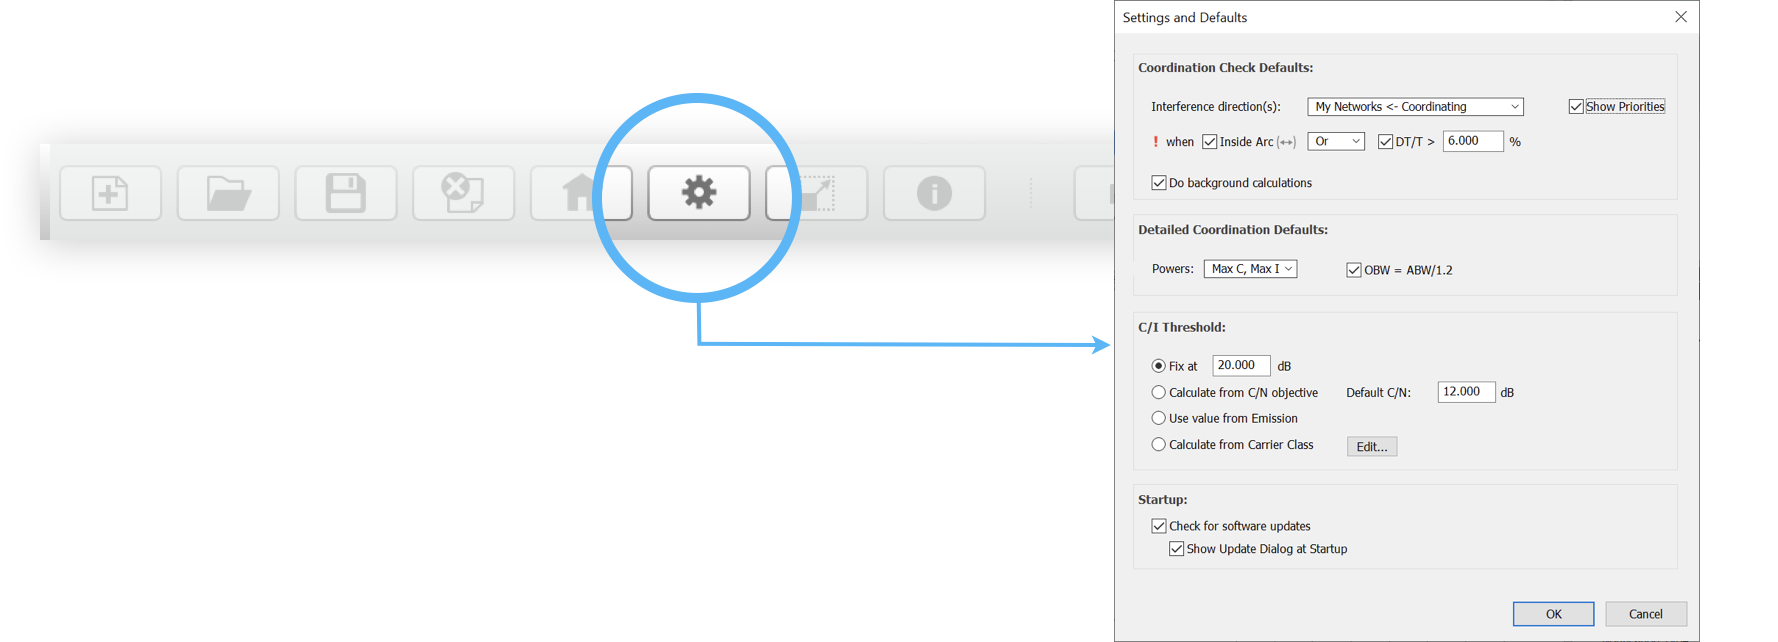
Click the Settings button. The key thing to spot is the default directions of interference.
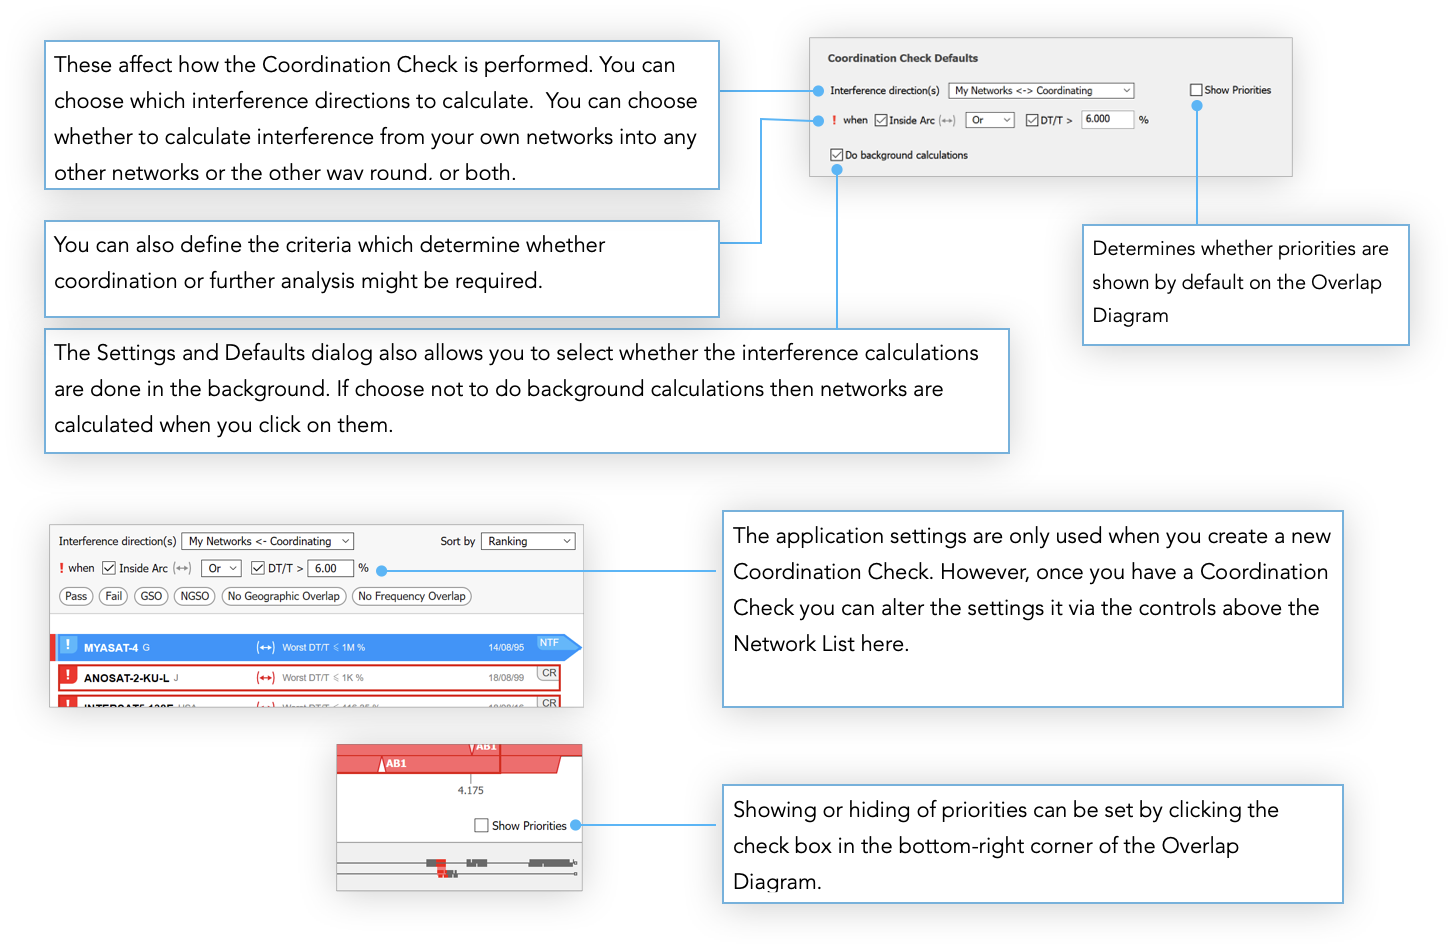
Visualyse GSO V3 can be used to calculate interference from either or both of:
-
Coordinating Networks into My Networks
-
My Networks into Coordinating Networks
In this example we will be analysing the former, namely interference into our networks.
My Networks can be configured by clicking on the My Networks button

We will look at this at a later stage.
The settings should not be changed at this point, though it is useful to identify what defaults could be changed.
Close this dialog to return to the start screen.
Coordination Check
The Coordination Check is one of the main features of Visualyse GSO V3. It is used to determine whether coordination is required, based upon one of two forms of coordination trigger:
- DT/T - using a threshold, typically 6%
- Coordination Arc - using a maximum orbital separation
Starting a Coordination Check
To start a coordination check click New Coordination Check on the start screen.

The New Coordination Check dialog will appear:
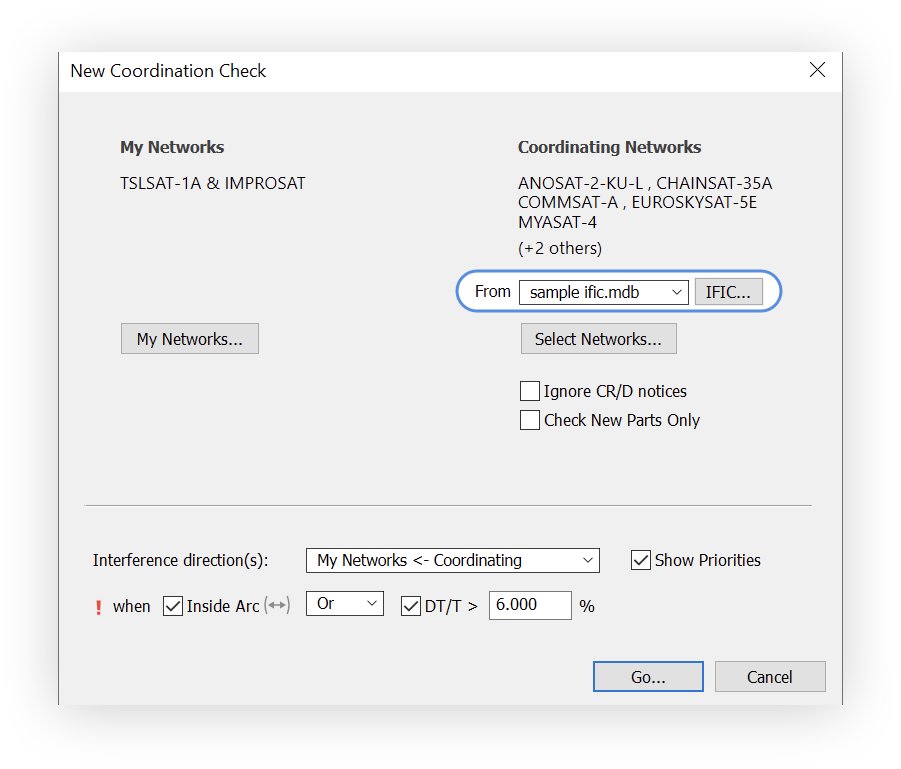
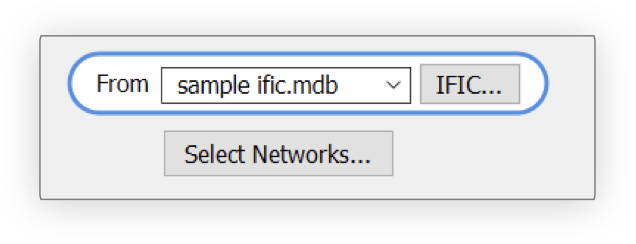
To undertake a coordination check you need a set of Coordinating Networks and in Visualyse GSO V3 there are two options for defining these
- IFIC - this will use all the networks in an IFIC
- Select Networks - here you can define subset of networks selected from any number of different IFICs or the SRS
By default the sample ific.mdb database is selected.
Click Go. Visualyse GSO V3 will now examine each network in this sample IFIC against both of the two networks defined in My Networks.
Note: All data in the sample IFIC and those in "My Networks" has been created for this demo and does not have any particular significance.
Calculation of DT/T
The DT/T is calculated from the data in the chosen IFIC or SRS using standard ITU-R approaches such as those identified in Appendix 8 of the Radio Regulations.
The software takes each network in turn and calculates the worst case DT/T to, or from each of your own networks. To do this, for the interfering network the emission with the highest e.i.r.p spectral power density is used and for the victim network the highest receive gain and lowest noise temperature are used. A worst-case geometry is assumed.
Frequency and geographical overlaps are also considered and if none are found for a particular network then the software will show this.
As soon as calculations are complete on a network it is possible to examine the results. When CHAINSAT 35A is complete, select it to show the coordination details.
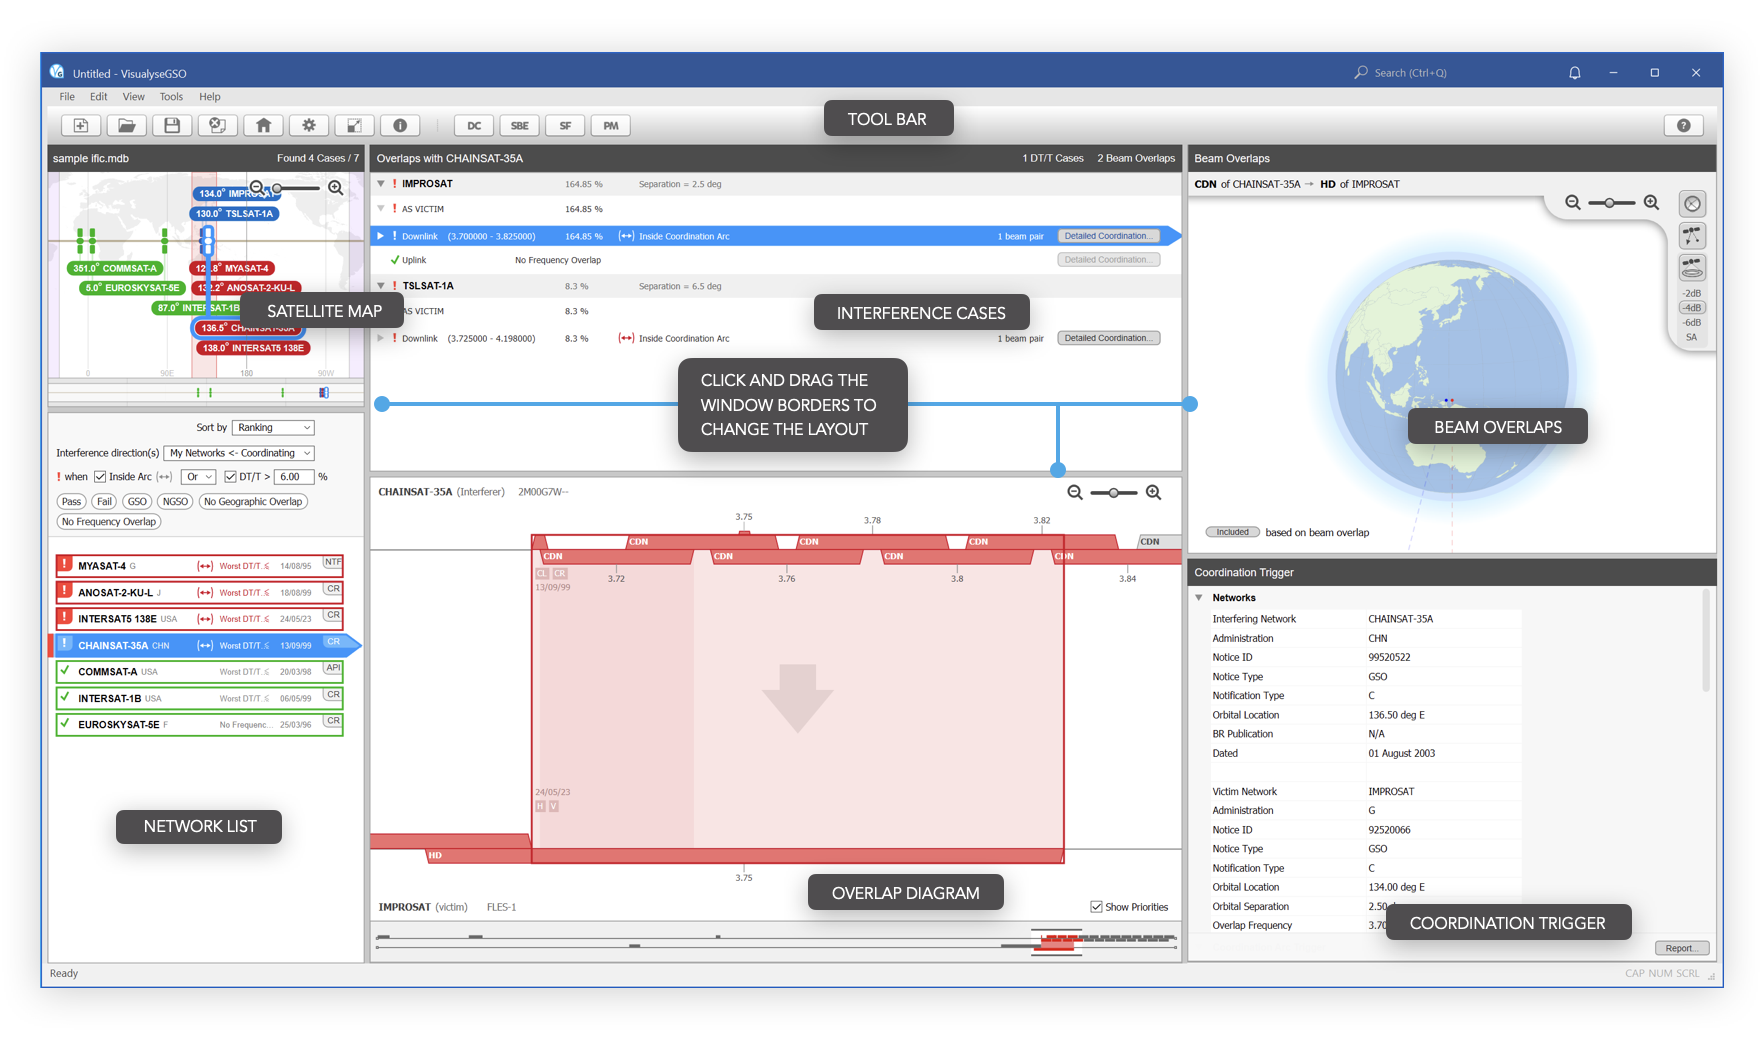
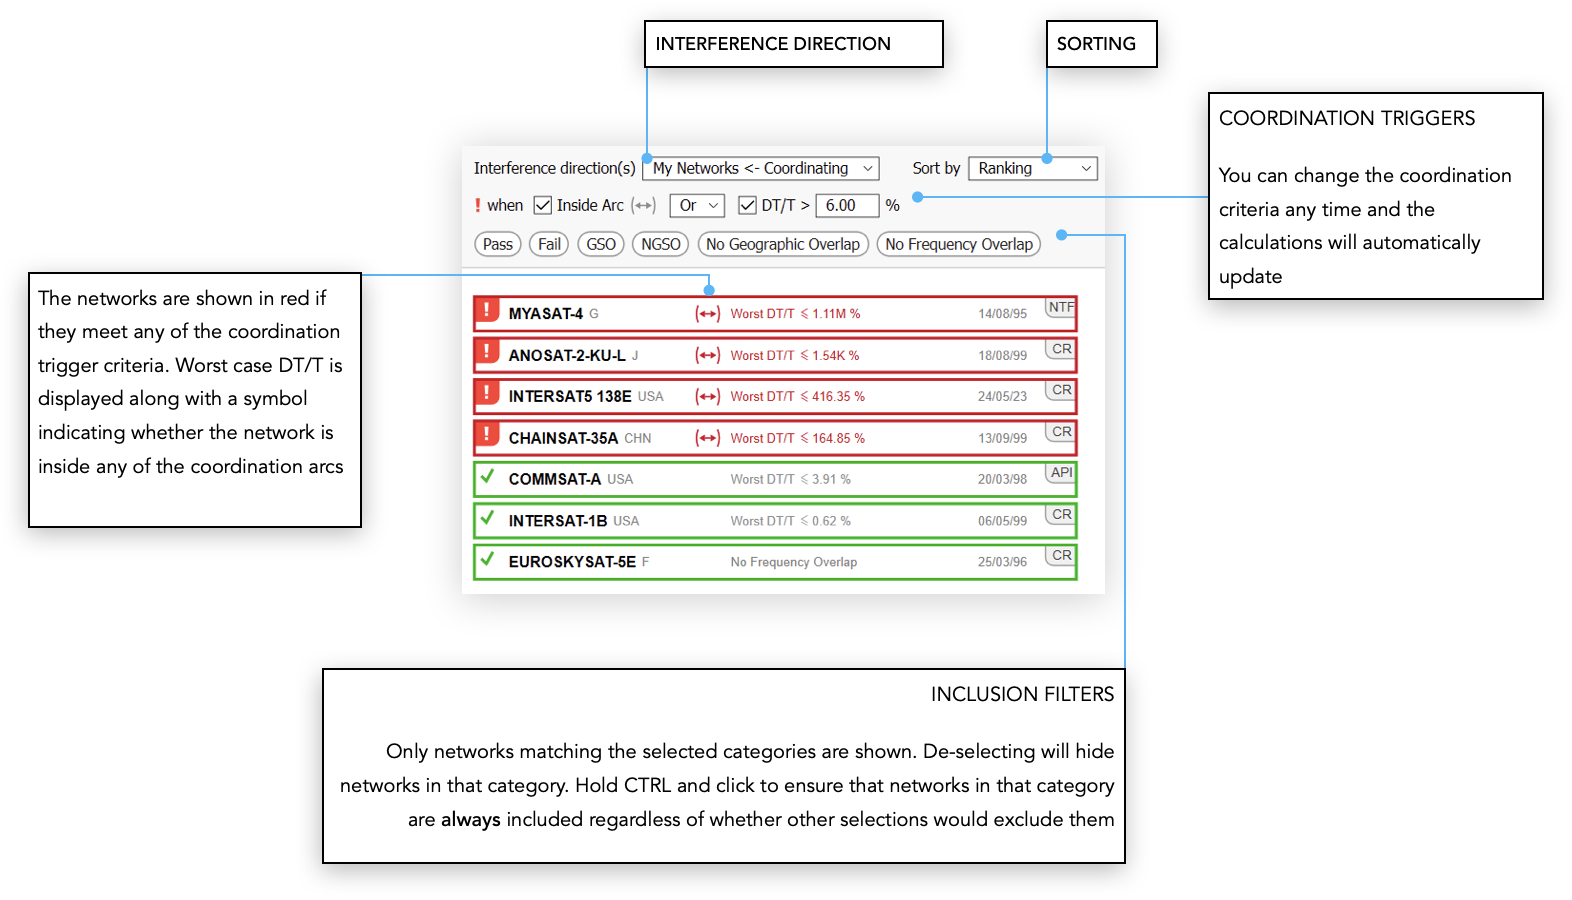
Network List
This shows the 7 networks in the IFIC including their administration, notification reason (API, CR etc.) and date.
Selecting a network updates the other windows with data related to that network.
Satellite Map
The Satellite Map provides a graphical representation of the satellite positions on the GSO arc.
It allows you to easily determine the relative orbital proximity of satellites and see whether they lie within any coordination arc(s).
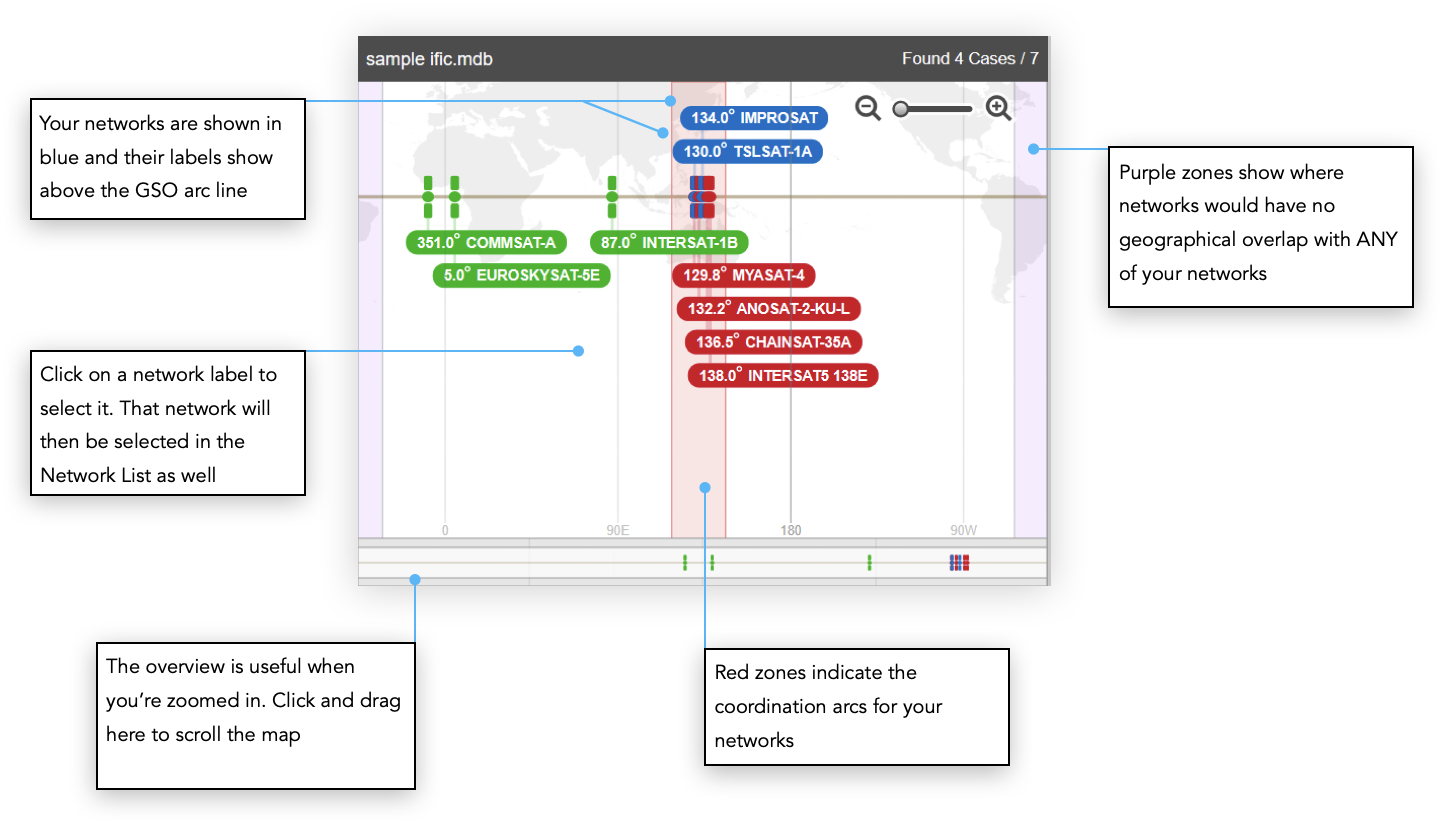
Focus Network
By default the purple ‘no geographical overlap’ area shows where coordinating networks would have no geographical overlap with any of your networks.
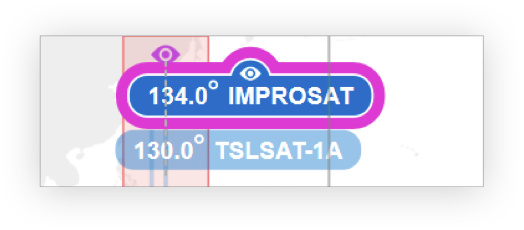
If you double-click on a coordinating network you can ‘focus’ on that network and instead show where there’s no geographical overlap with only that network.
A small eye icon will appear above the label and another in line with the network location.
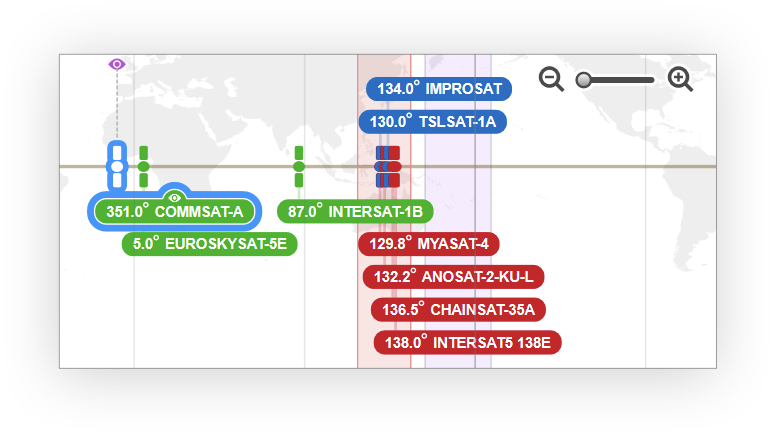
You can also double-click to focus on one of your own networks. The ‘no geographical overlap’ area will change to show the area that applies only to that network.
In addition the entire network list will update to show the coordination status based on looking at overlaps with the focused network only.
To reflect this the focused network will be highlighted with a purple border.
To exit Network Focus double-click on an empty area of the Satellite Map background.
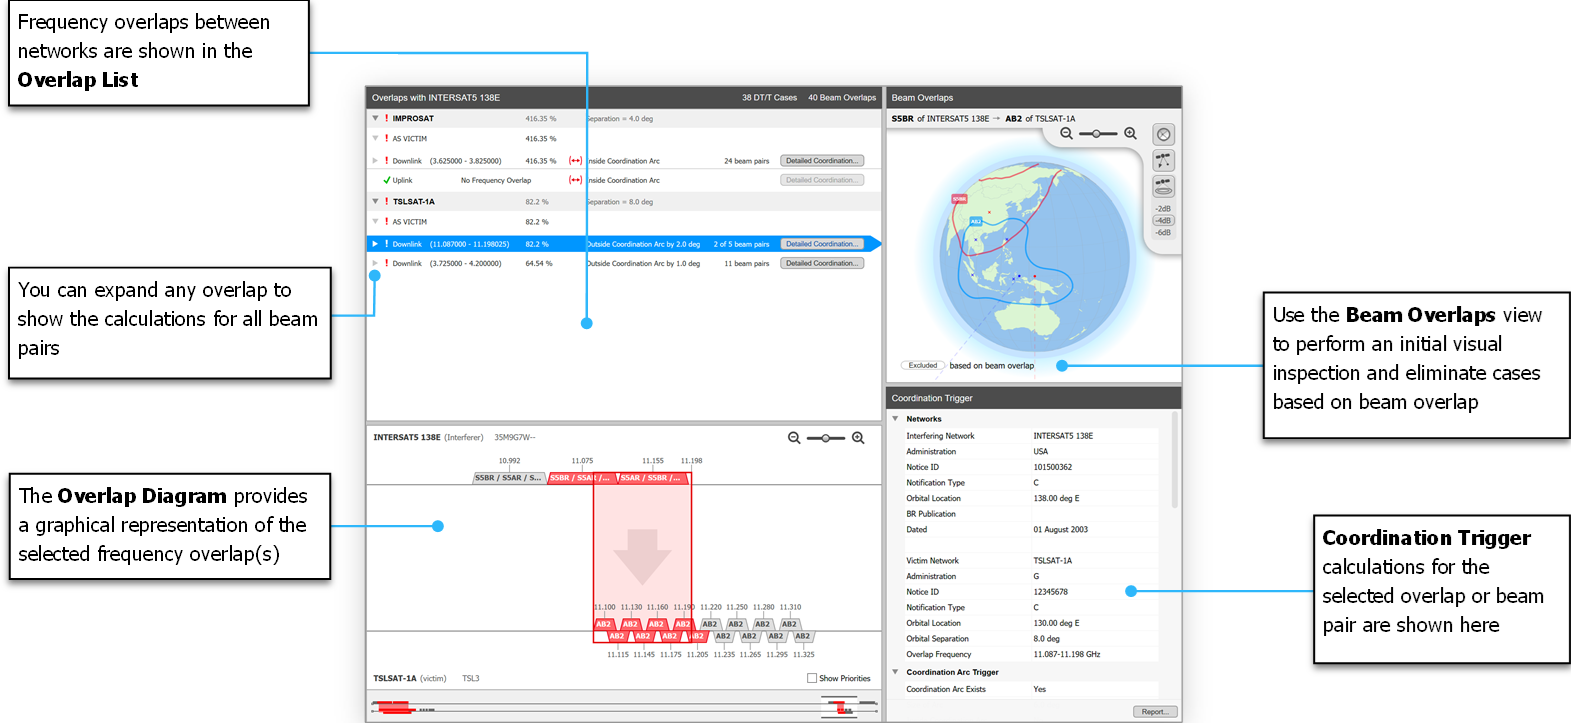
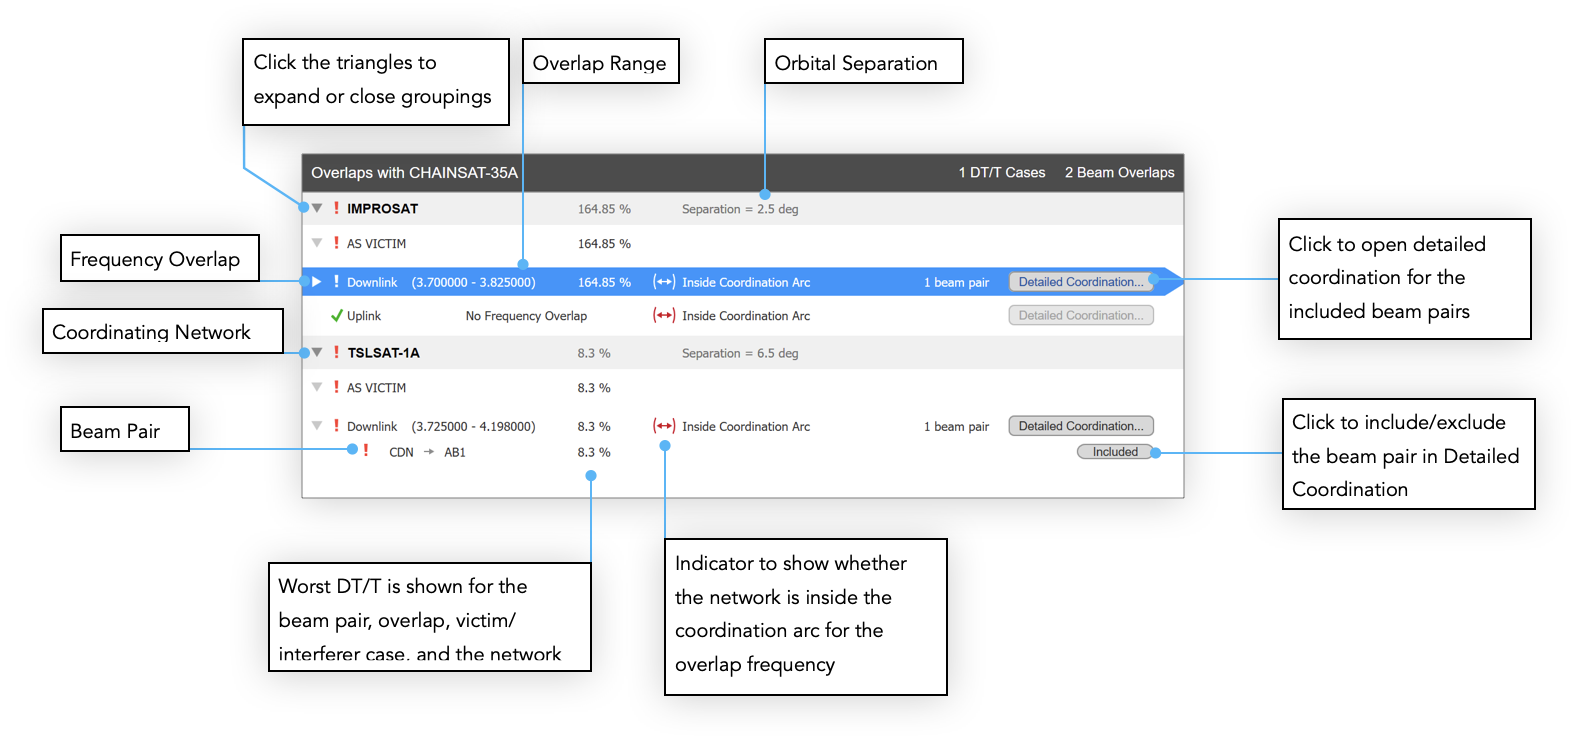
Overlap List
This window shows the interference paths between My Networks and the network selected from the Network List.
These are broken down into frequency overlaps and grouped by network, link direction (up/down) and then beam pair.
Selecting a beam pair will display the beams and coordination trigger calculation on their respective windows (we’ll talk about these next).
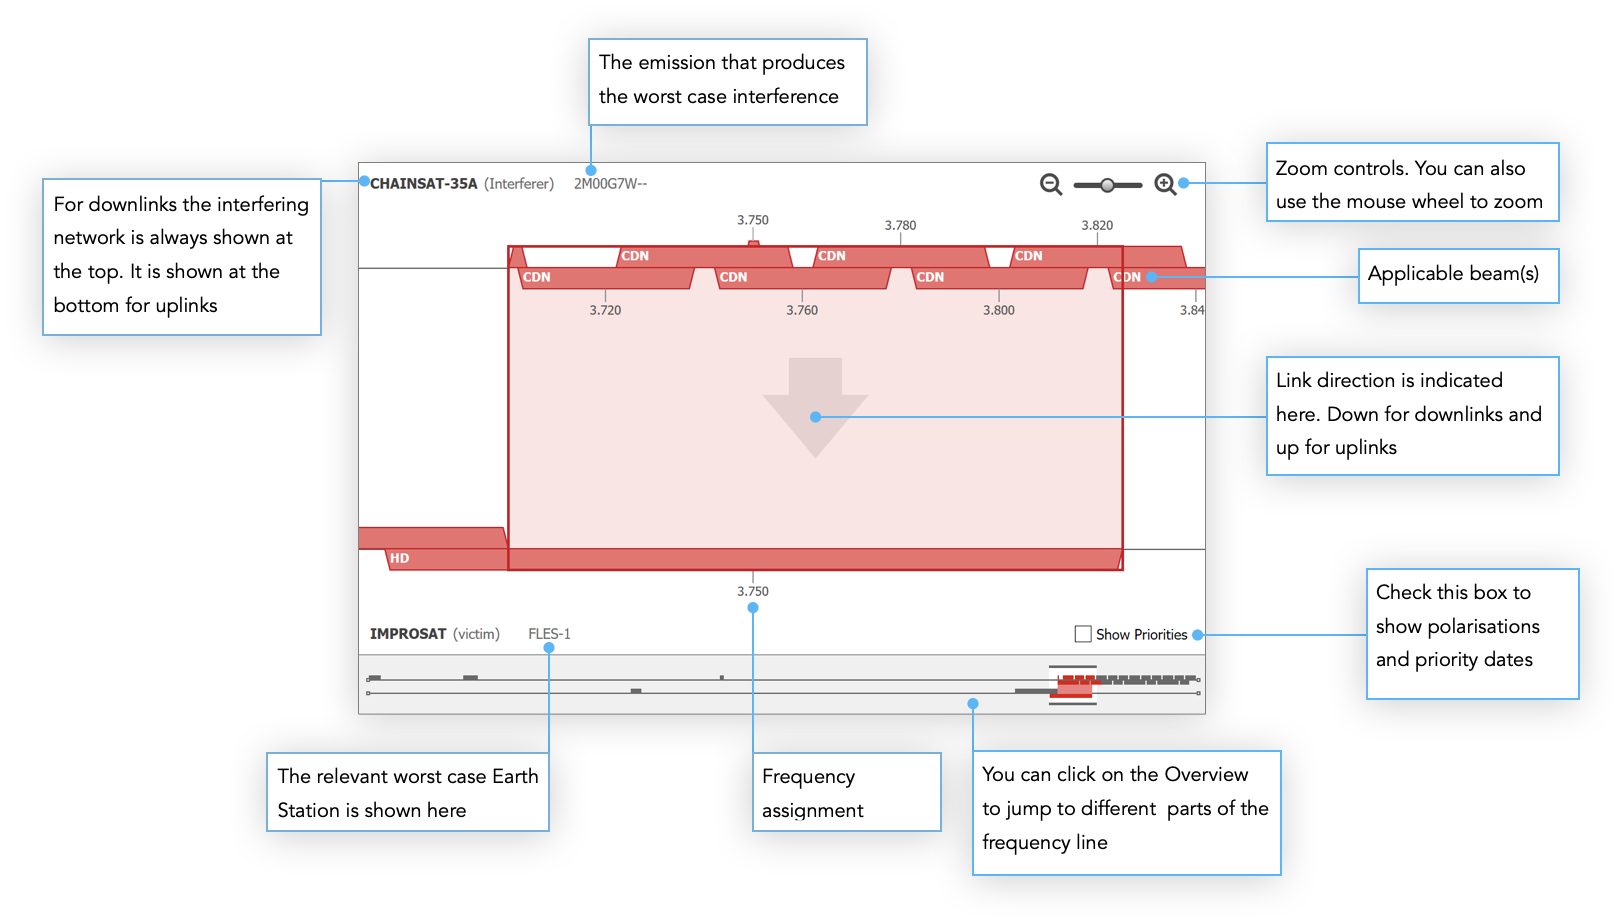
Overlap Diagram
The Overlap Diagram provides a graphical representation of the selected frequency overlap(s).
Frequency assignments are shown together with the group bandwidth to illustrate how the spectrum is occupied for each network.
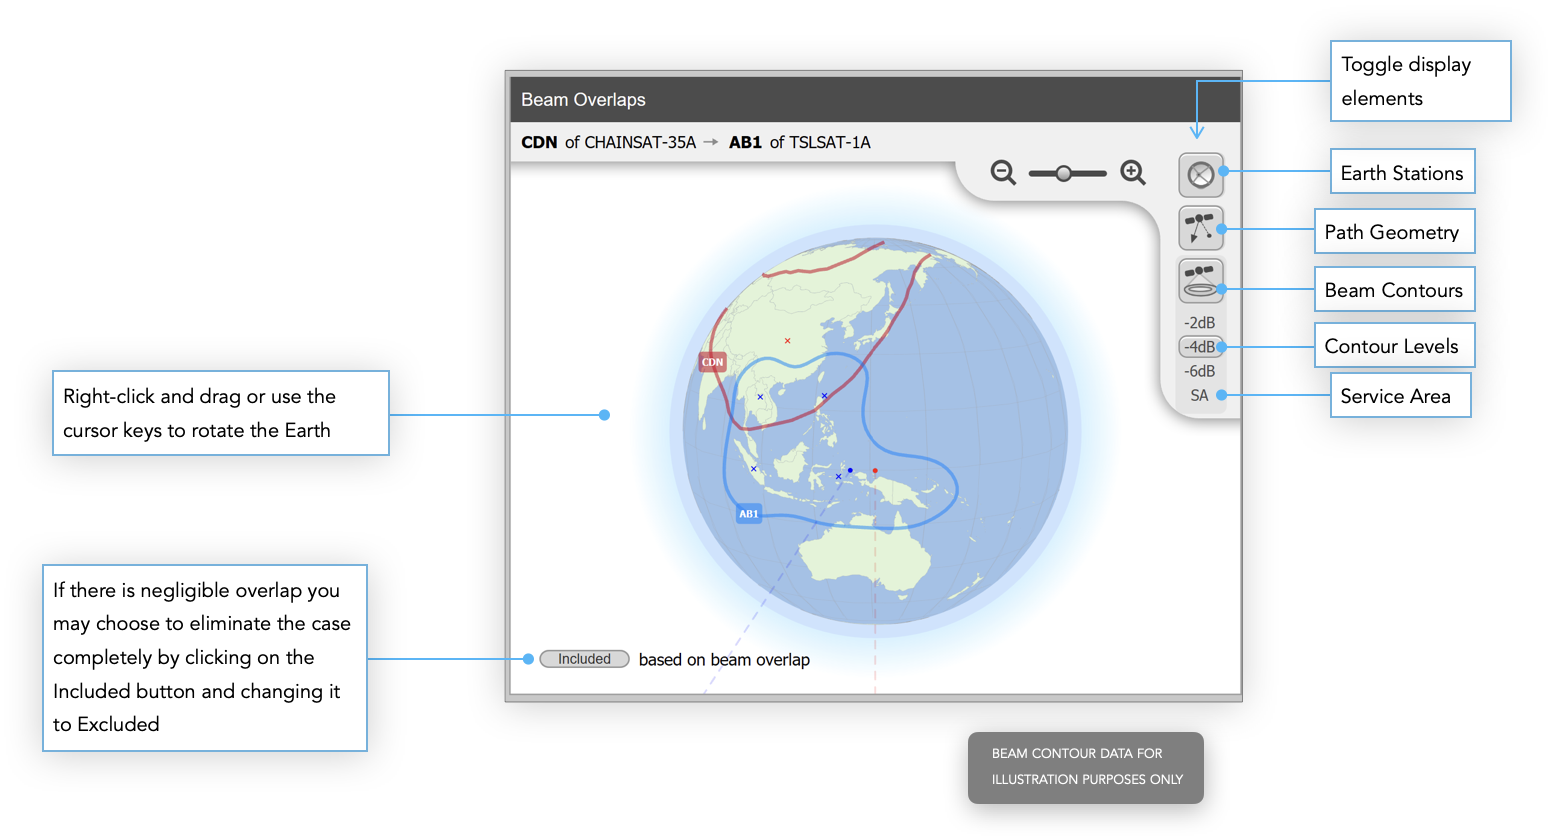
Beam Overlaps
The Map View is used to perform an initial visual inspection and eliminate cases based on beam overlap.
Beam contour data is automatically loaded from GIMS when available.
When you click on a Beam Pair in the Overlap List you should see the contours on the Beam Overlaps window.
As our example uses fictional networks, there is no beam data in GIMS so we’ve added some to the here just for illustration purposes.
If there is a sufficient overlap not to discount the beam pair you would next look at the coordination trigger calculations.
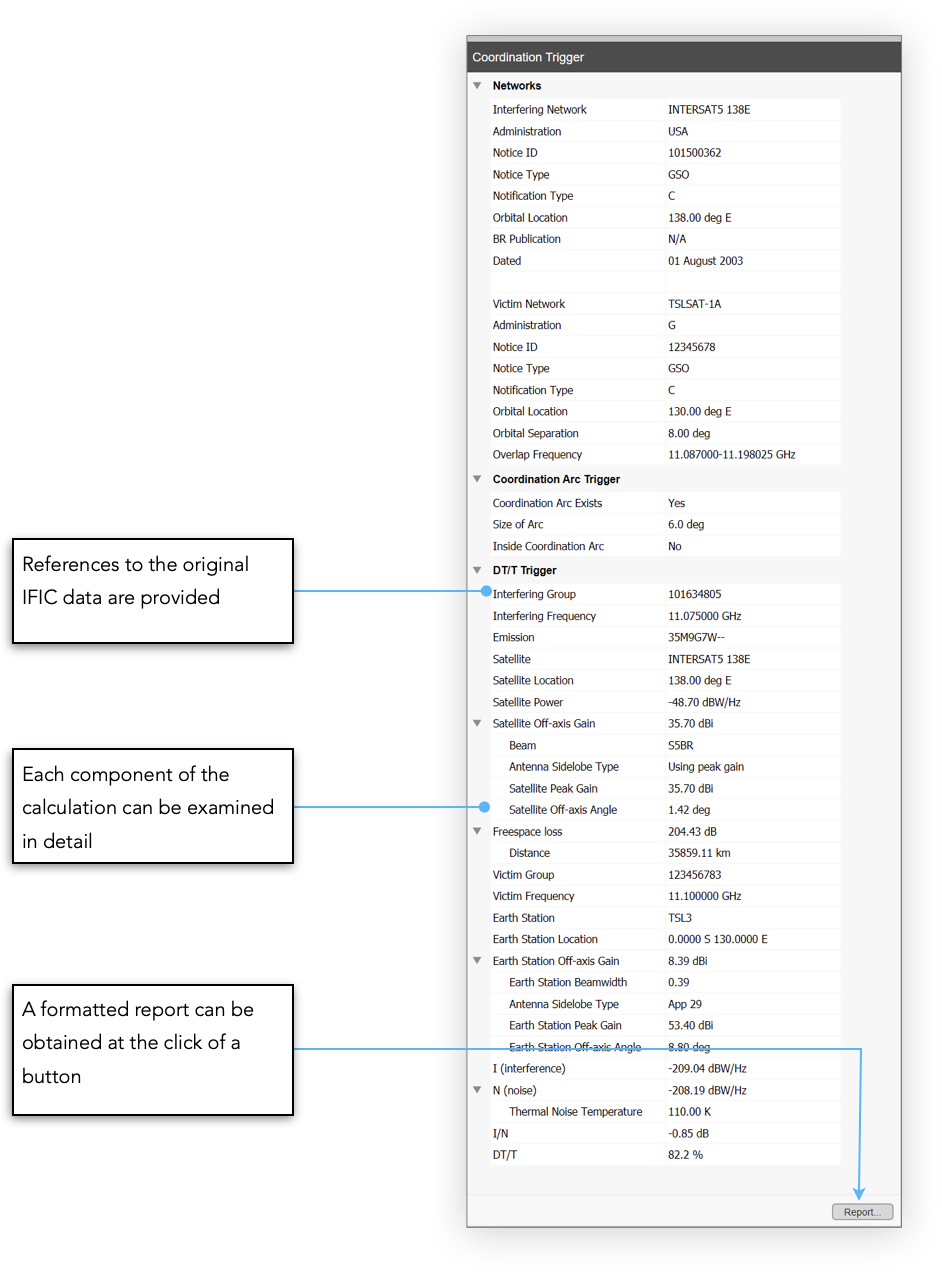
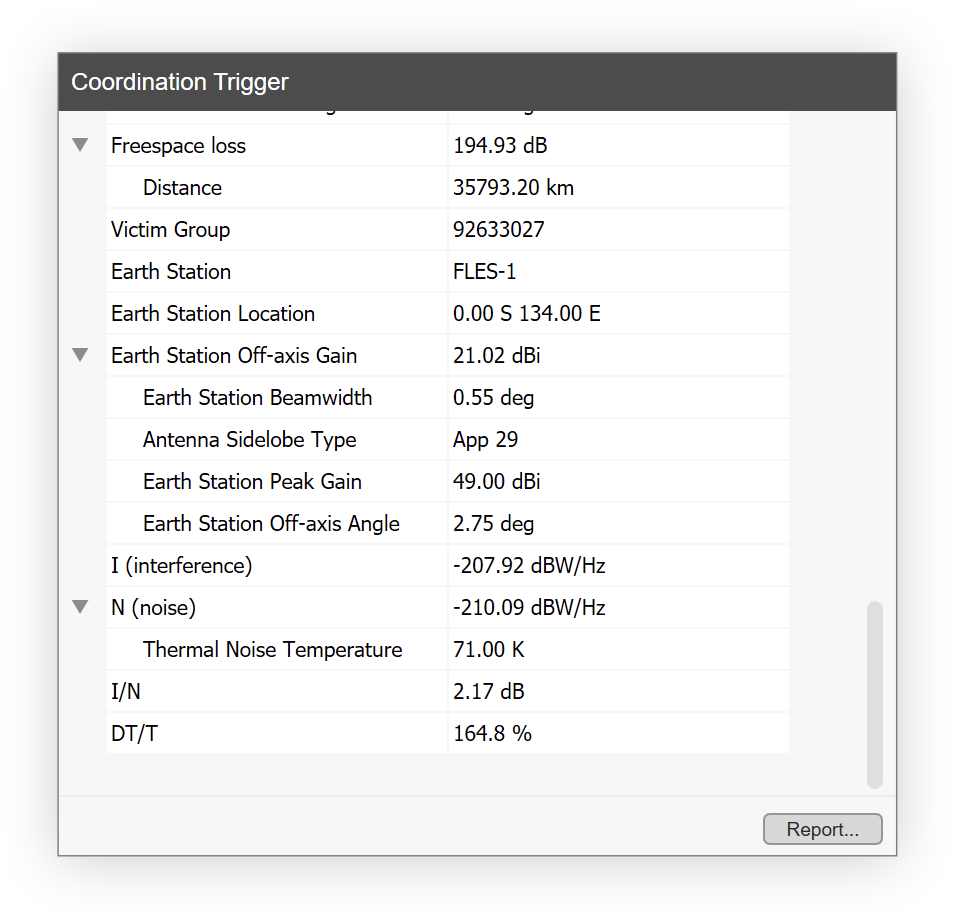
Coordination Trigger
This shows a detailed breakdown of the Coordination Trigger.
It gives more detailed information about the networks concerned including the coordination arc, and how the calculation of DT/T was arrived at based on the parameters of the selected networks.
For our example we see the following:
- Interfering network CHAINSAT-35A
- Victim network IMPROSAT
- Orbital separation 2.5°
- Inside coordination arc Yes
- DT/T 164.8%
From both triggers we see that coordination would be required so we can proceed and include this beam pair in our detailed coordination.
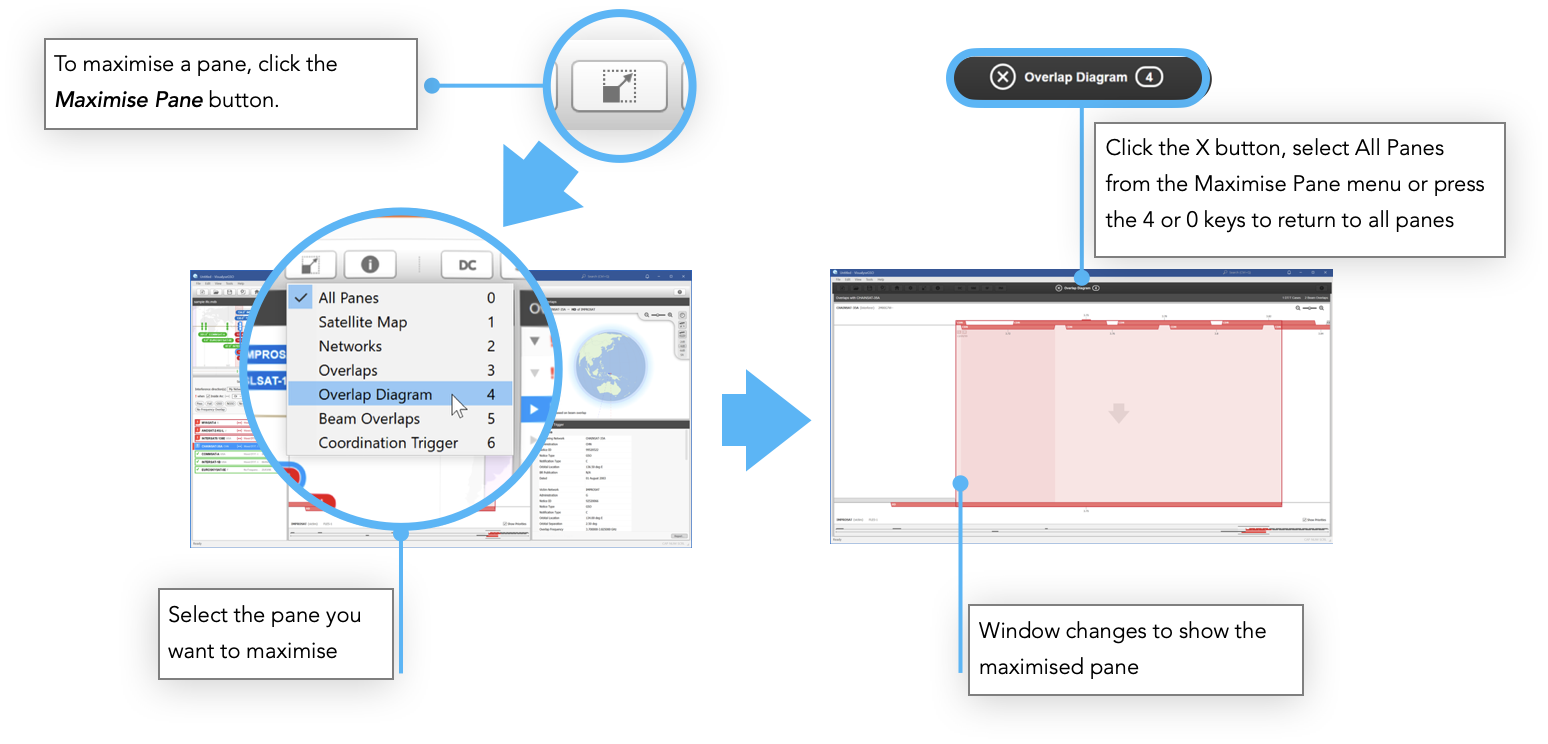
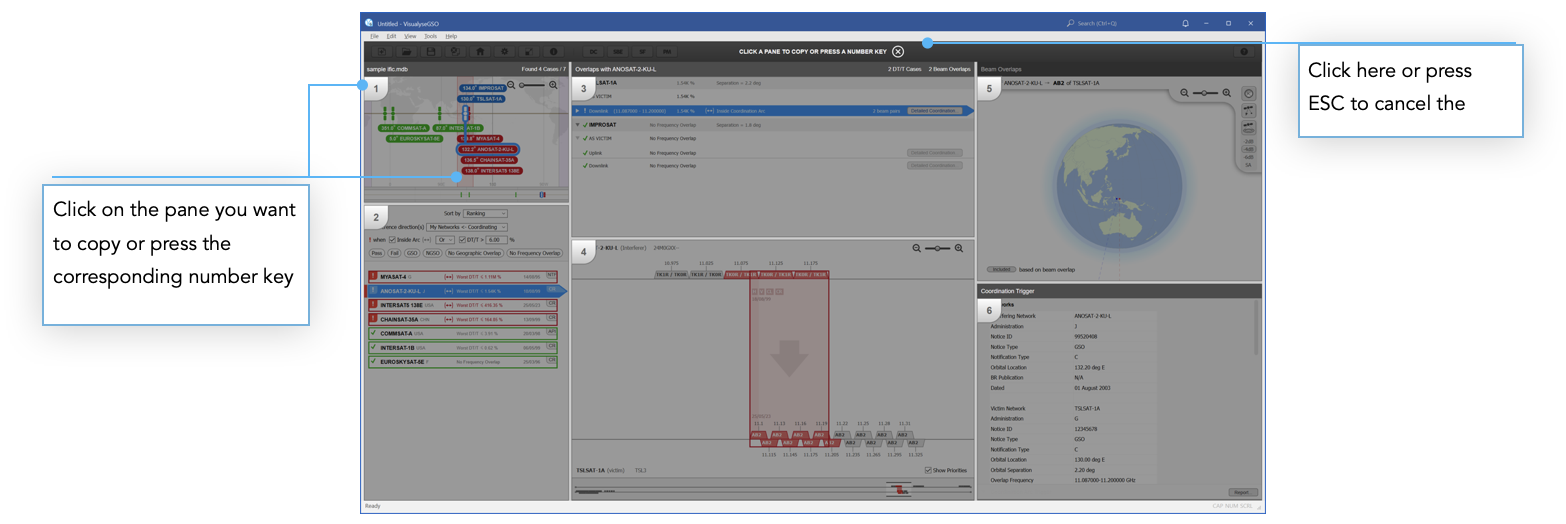
Maximise Pane
If you’re working on a laptop or with a small display then you'll have limited space to see all the application panes in detail at the same time.
To help with this we have added the ability to temporarily maximise any of the panes.
You can easily flick between maximised panes using the number keys. You can also configure the maximised panes so that you can show two or three panes at a time.
Simply adjust the pane splitters while a pane is maximised. The software will then remember this configuration for you.
Detailed Coordination (DC)
REQUIREMENTS
The previous section described how to identify which networks require coordination, by considering the DT/T and the coordination arc. This can be used by operators and administrations to decide which notices they could have an issue with and hence which require a notification to be sent requesting coordination to the BR and other operators and administrations.
Having entered into detailed coordination with another operator a different approach is required – not looking at a range of systems in an IFIC or SRS, but considering one or a small number of systems in detail, to see how interference could be managed so that both could operate. This will involve negotiation between the parties, which must take into account which network has regulatory priority. However there is a provision in Article 9.53 that both parties should make every possible mutual effort to overcome any difficulties, which is intended to facilitate the entry of the newer system.
These negotiations must take account of details of each system, their beams, service areas, polarisations, emission codes, e.i.r.p.s, frequencies, and earth station characteristics. Detailed discussions therefore must consider a large number of combinations of interfering and victim carriers plus link characteristics for each in great detail.
A successful outcome requires a good understanding of where the main problems are, why there are problems and what could be done to facilitate sharing. This can be achieved using the Visualyse GSO V3 Detailed Coordination tool.
Calculation of C/I
The basis of our Detailed Coordination tool is the C/I between the victim and the wanted network. This will depend upon the data in the Group pair selected – such as frequency, polarisation and associated earth station. The C/I threshold can either be directly entered or is derived based upon a calculated C/N, using the approach given in Recommendation ITU-R S.741-2:
C/I = C/N + 12.2
By default the C/I calculations use the worst case geometry. However, during analysis, specific locations can be included and hence the antenna directivity can be used to decrease interference.
Examining a Network in Detail
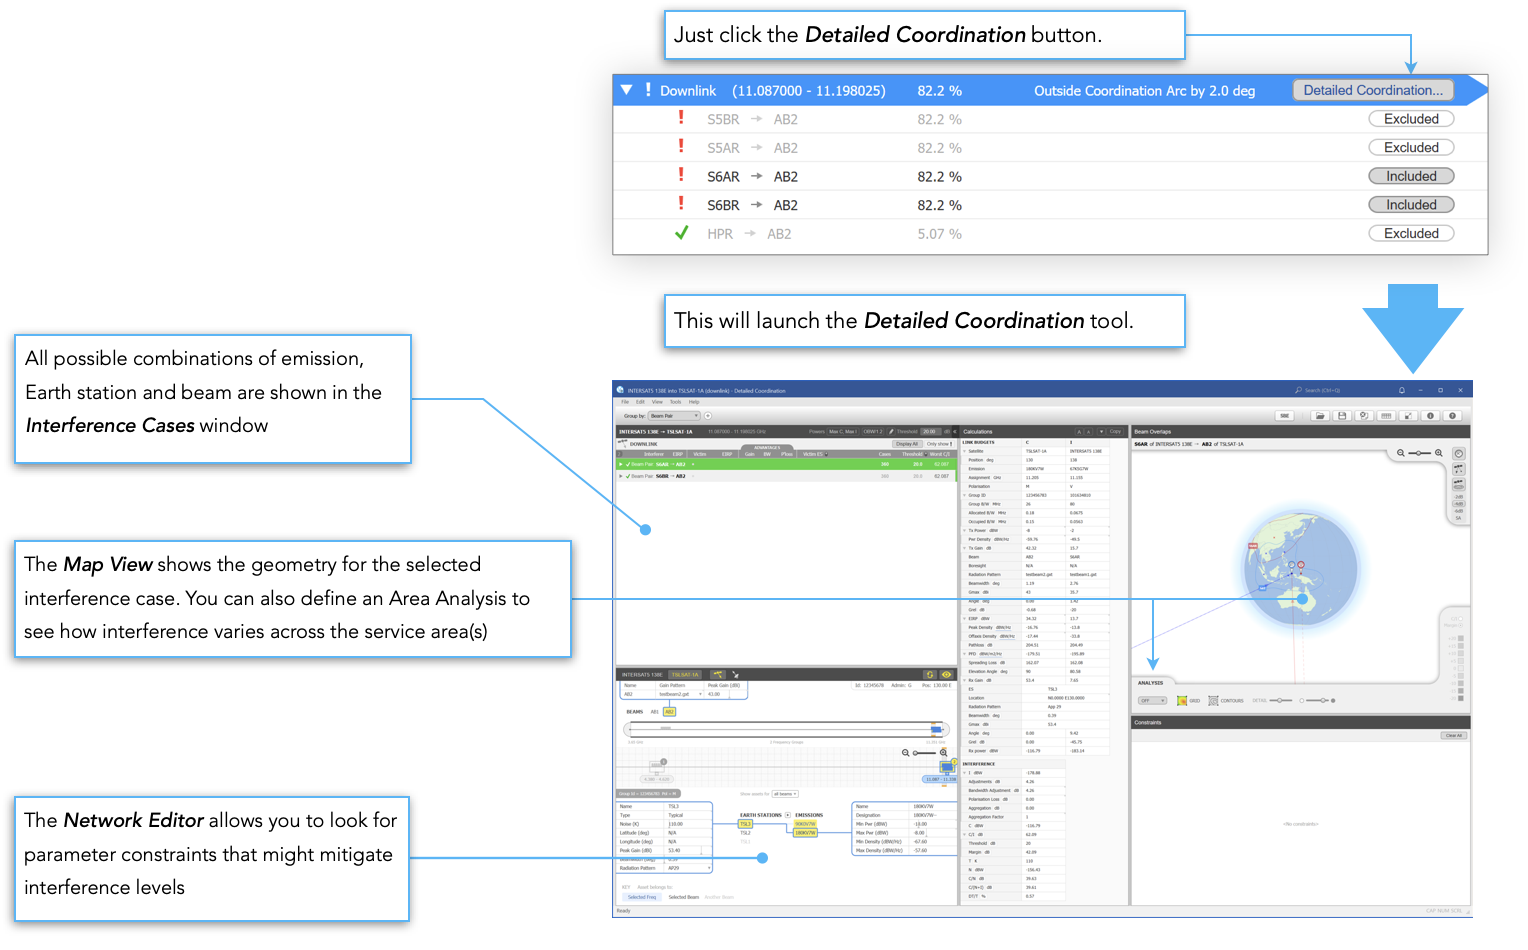
The Detailed Coordination tool can either be launched from Visualyse GSO V3 (by pressing one of the ‘Detailed Coordination’ buttons) or independently (by pressing the ‘DC’ button on the toolbar in Visualyse GSO V3) or by launching from the Start Menu or file system.
If launched independently the application will launch into the start screen. This is very similar to Visualyse GSO V3 and allows you to load up previously saved files.
We're going to launch from inside Visualyse GSO V3. Click the ‘Detailed Coordination’ button next to beam pair CDN (from CHAINSAT-35A) and HD (from IMPROSAT) i.e. ‘CDN → HD’.
The Detailed Coordination tool will appear.
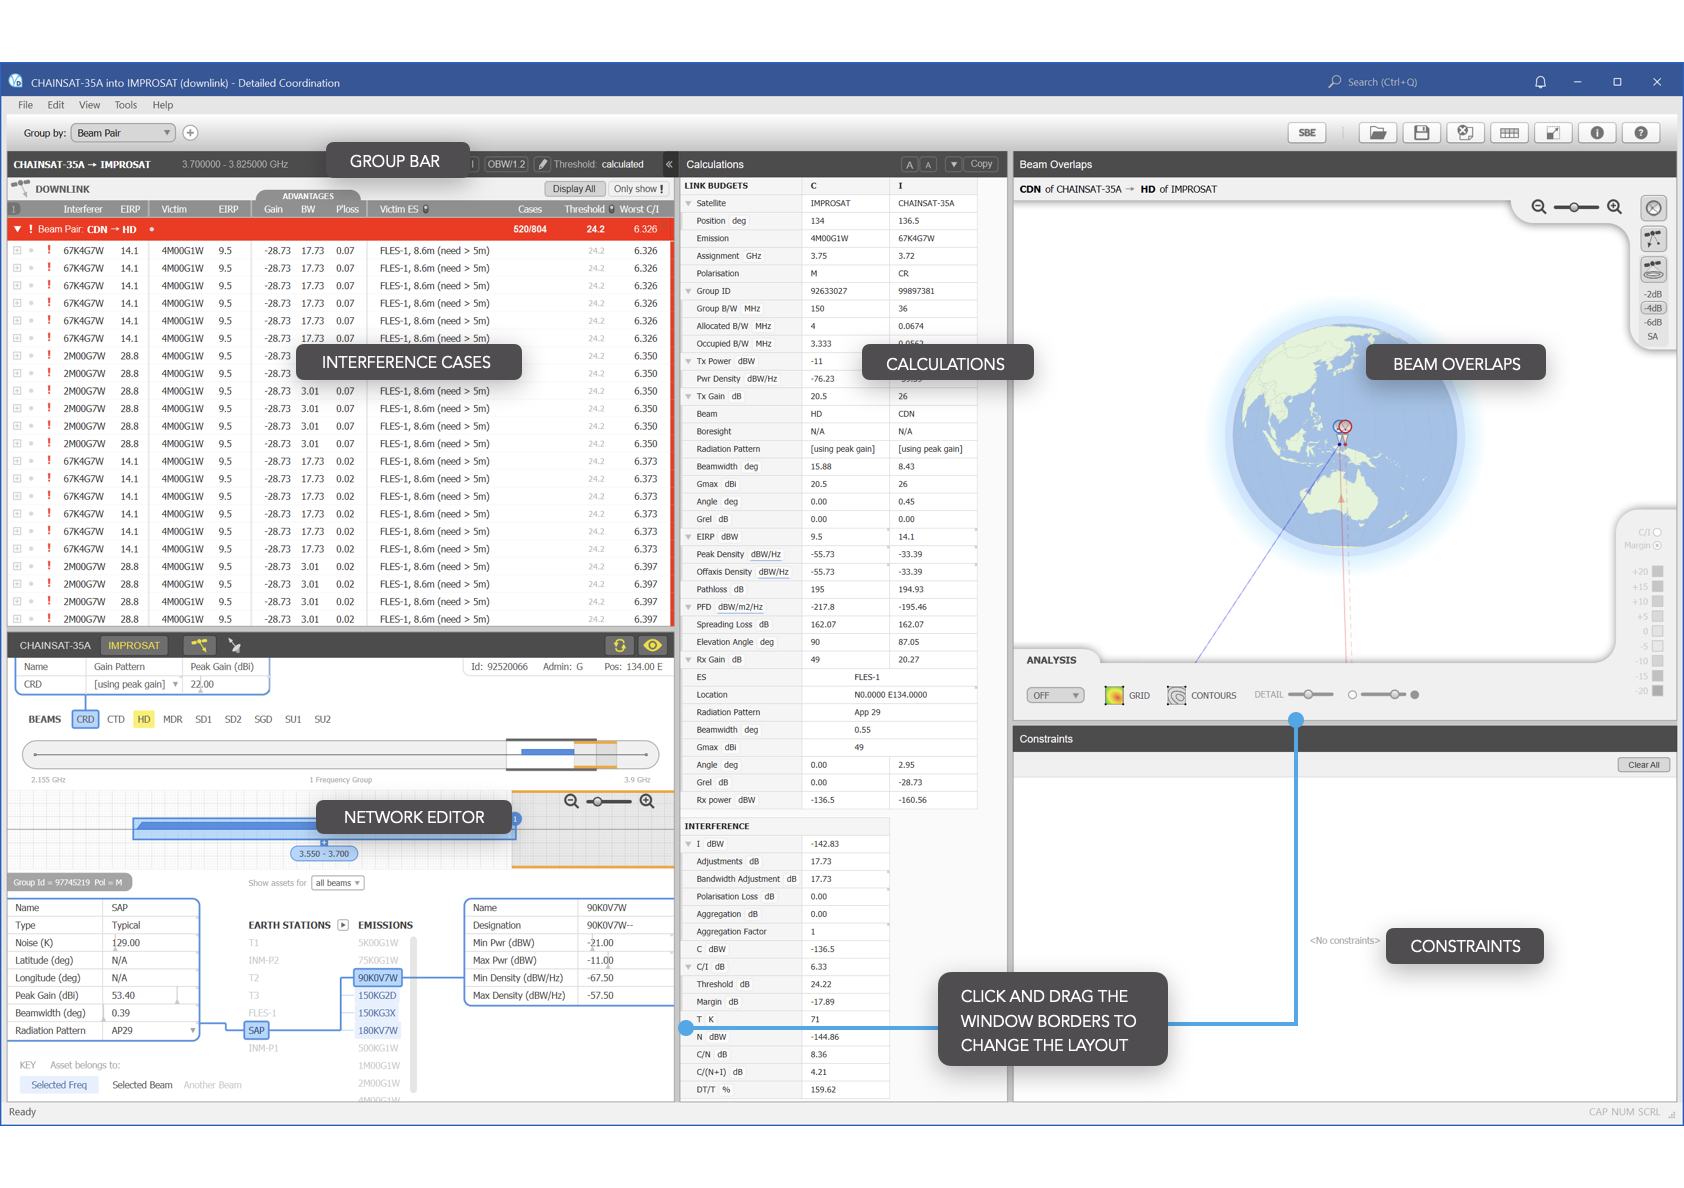
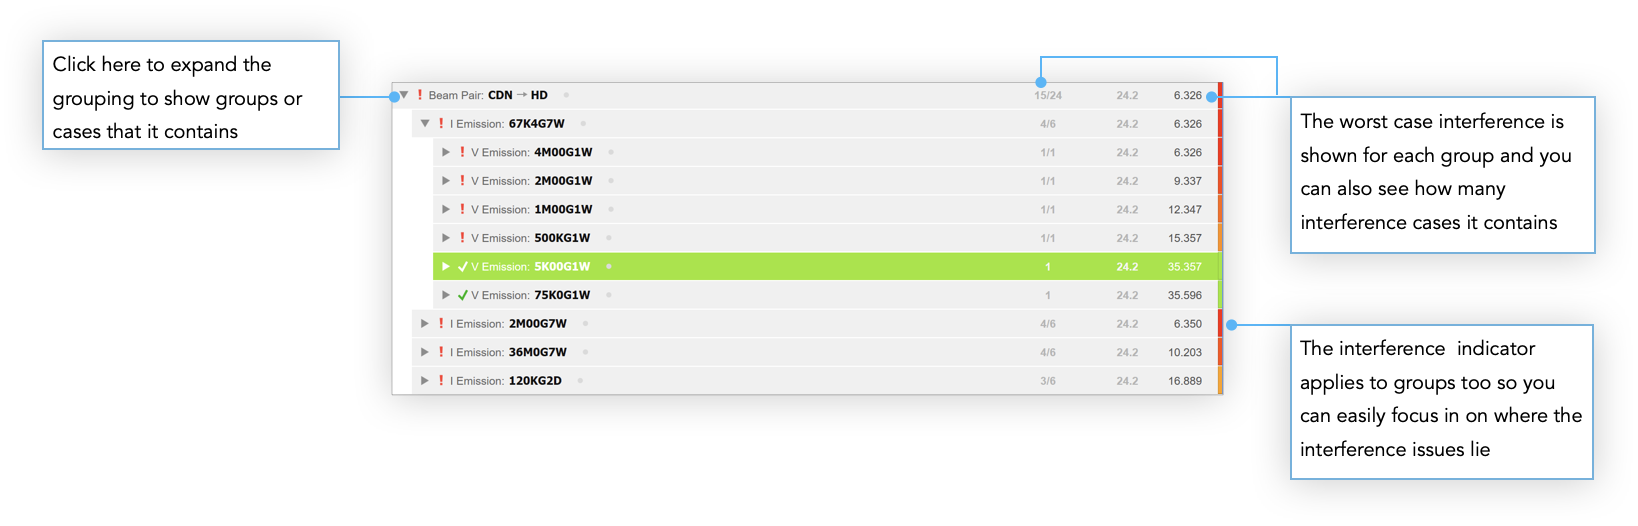
Interference Cases
The Detailed Coordination tool looks at interference cases. To create these the software looks at all the combinations of emission pairs, powers, frequencies and earth stations that could occur. It then calculates the interference.
The frequency producing the worst C/I for each combination is then taken and forms one interference case. Each is represented by a row in the list.
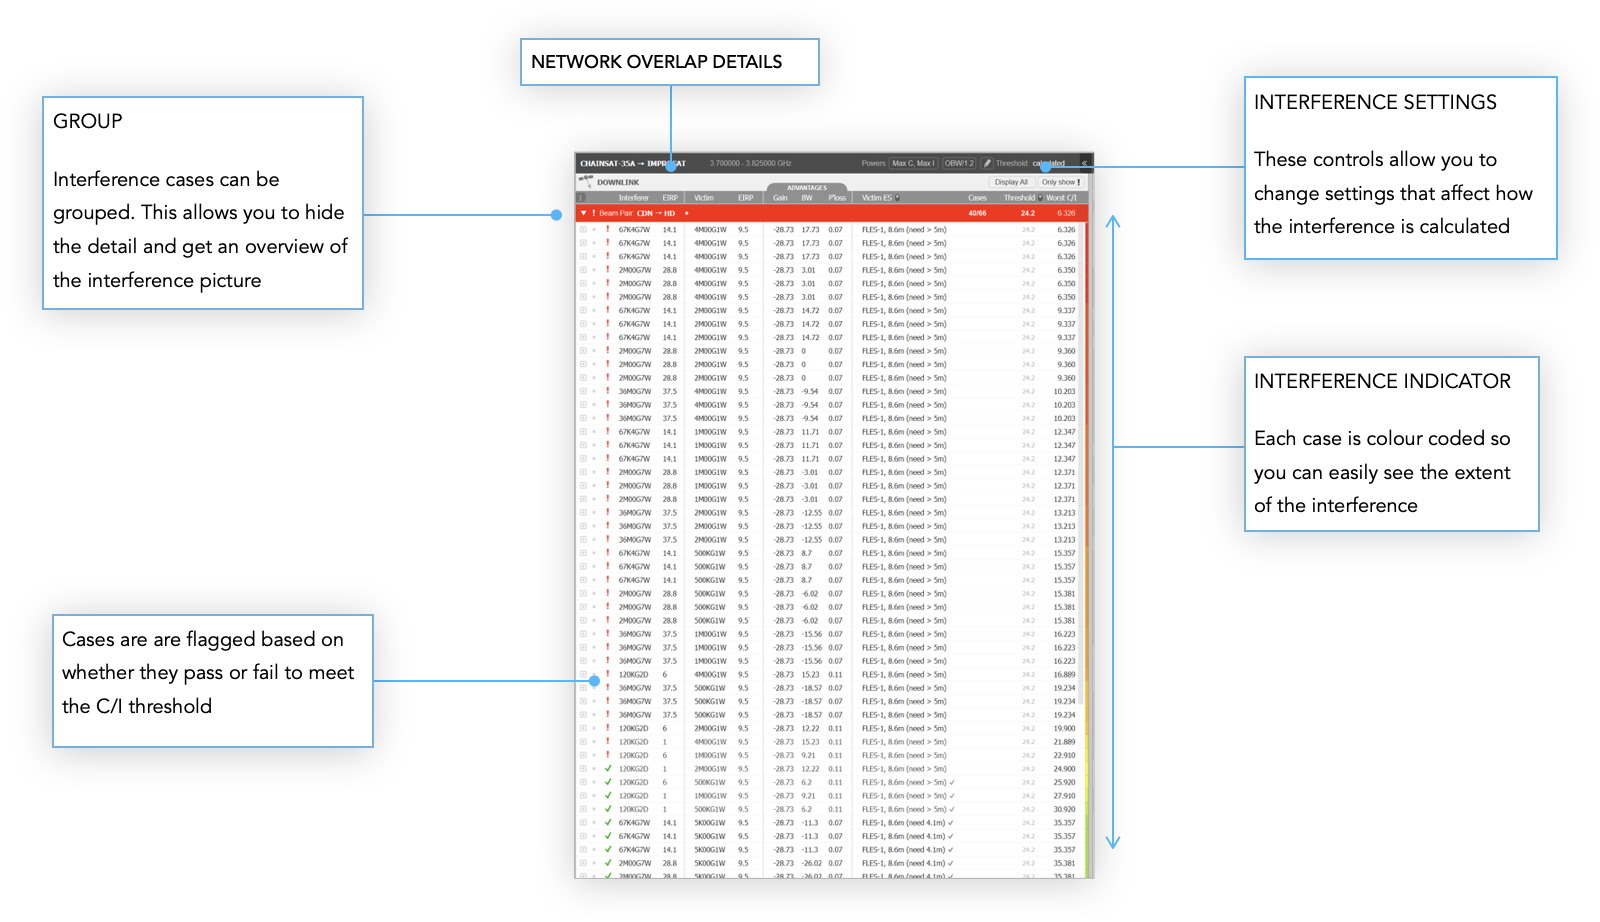
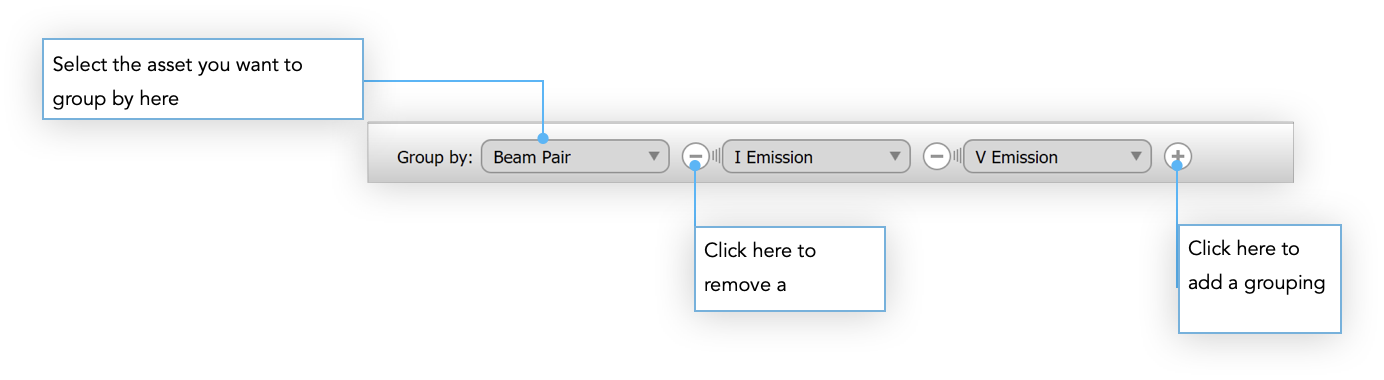
Group Bar
The Group Bar allows you to organise the interference cases into logical collections. You can group by beam, emission or earth station and by doing so, see how the interference cases are spread across a particular set of assets.
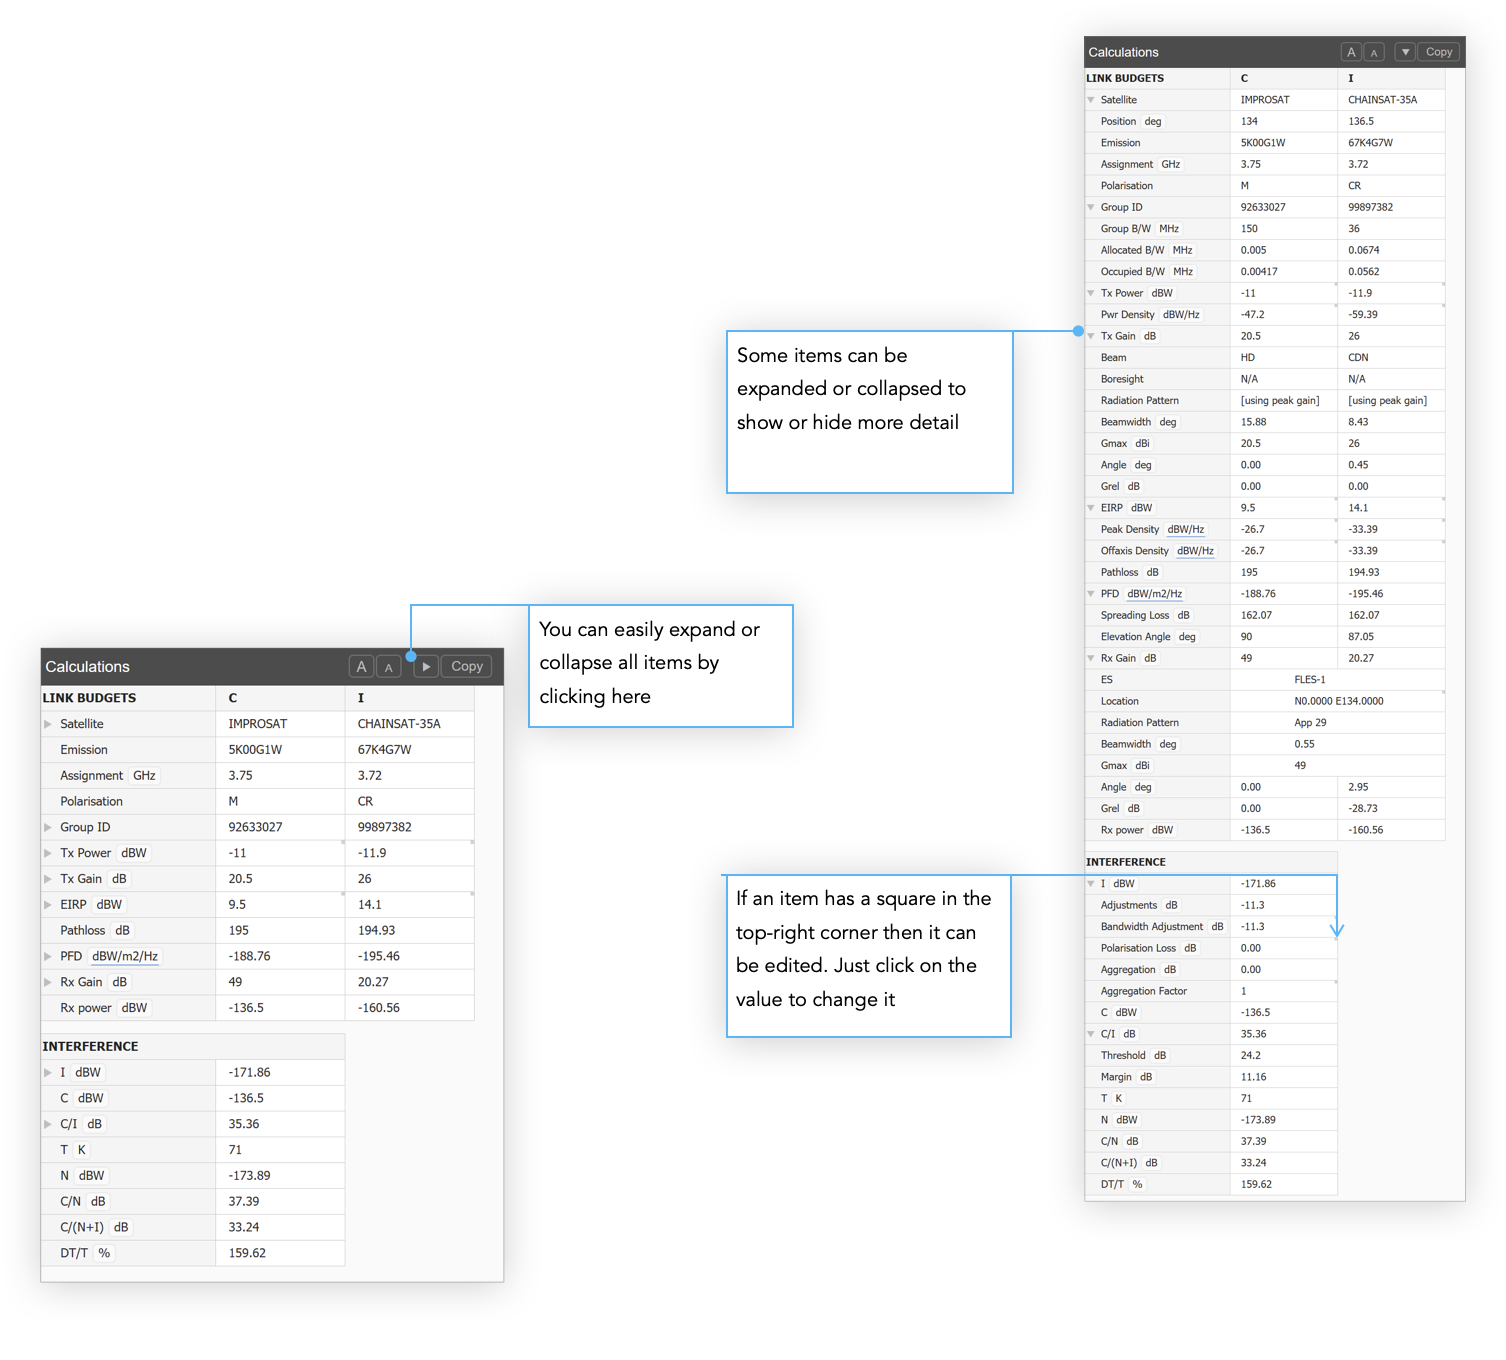
Calculations
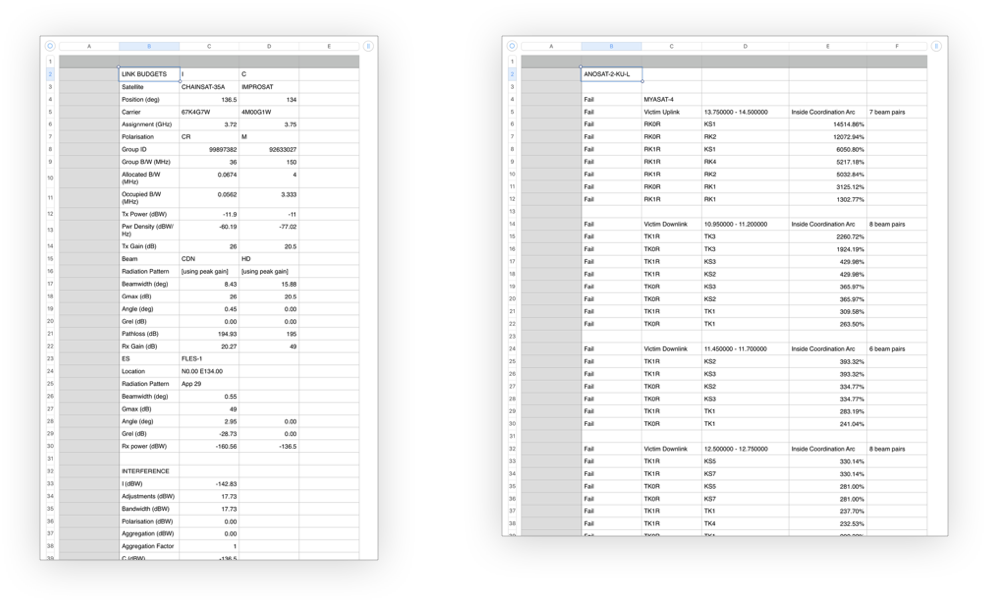
When you select an interference case, a full breakdown of all the components of the calculation are shown in the Calculations pane.
You can click the Copy button to copy the contents so that you can paste into applications like Microsoft Excel for further analysis.
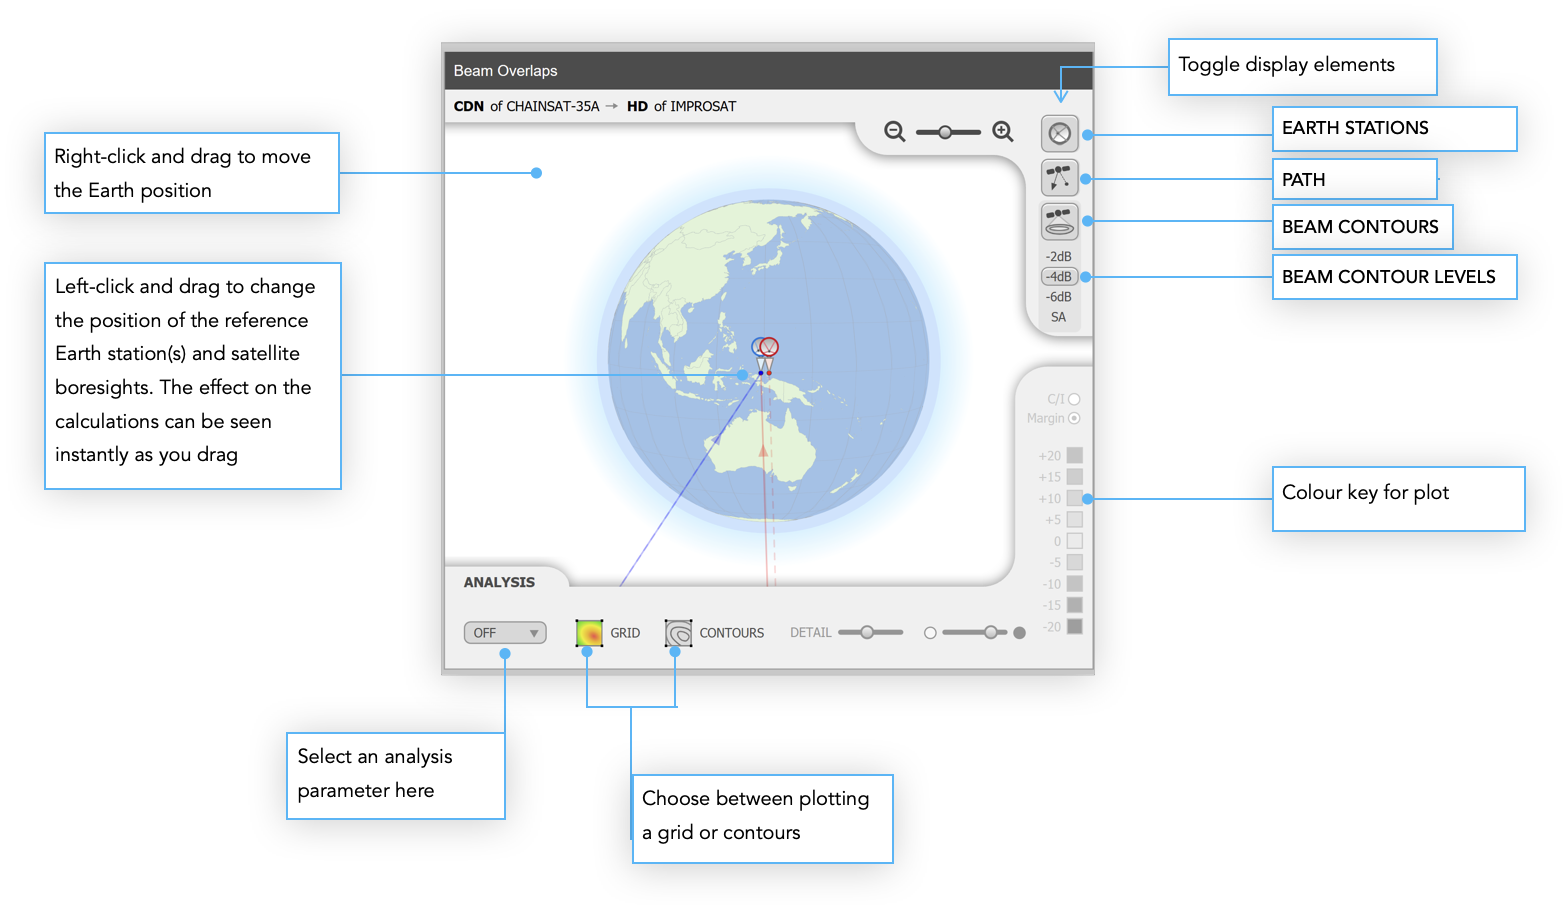
Beam Overlaps
In the Detailed Coordination tool the Beam Overlaps pane has extra analysis tools. These allow you to look at how parameters such as interference, EIRP or Required Dish Size vary as you move the Earth station across some defined area.
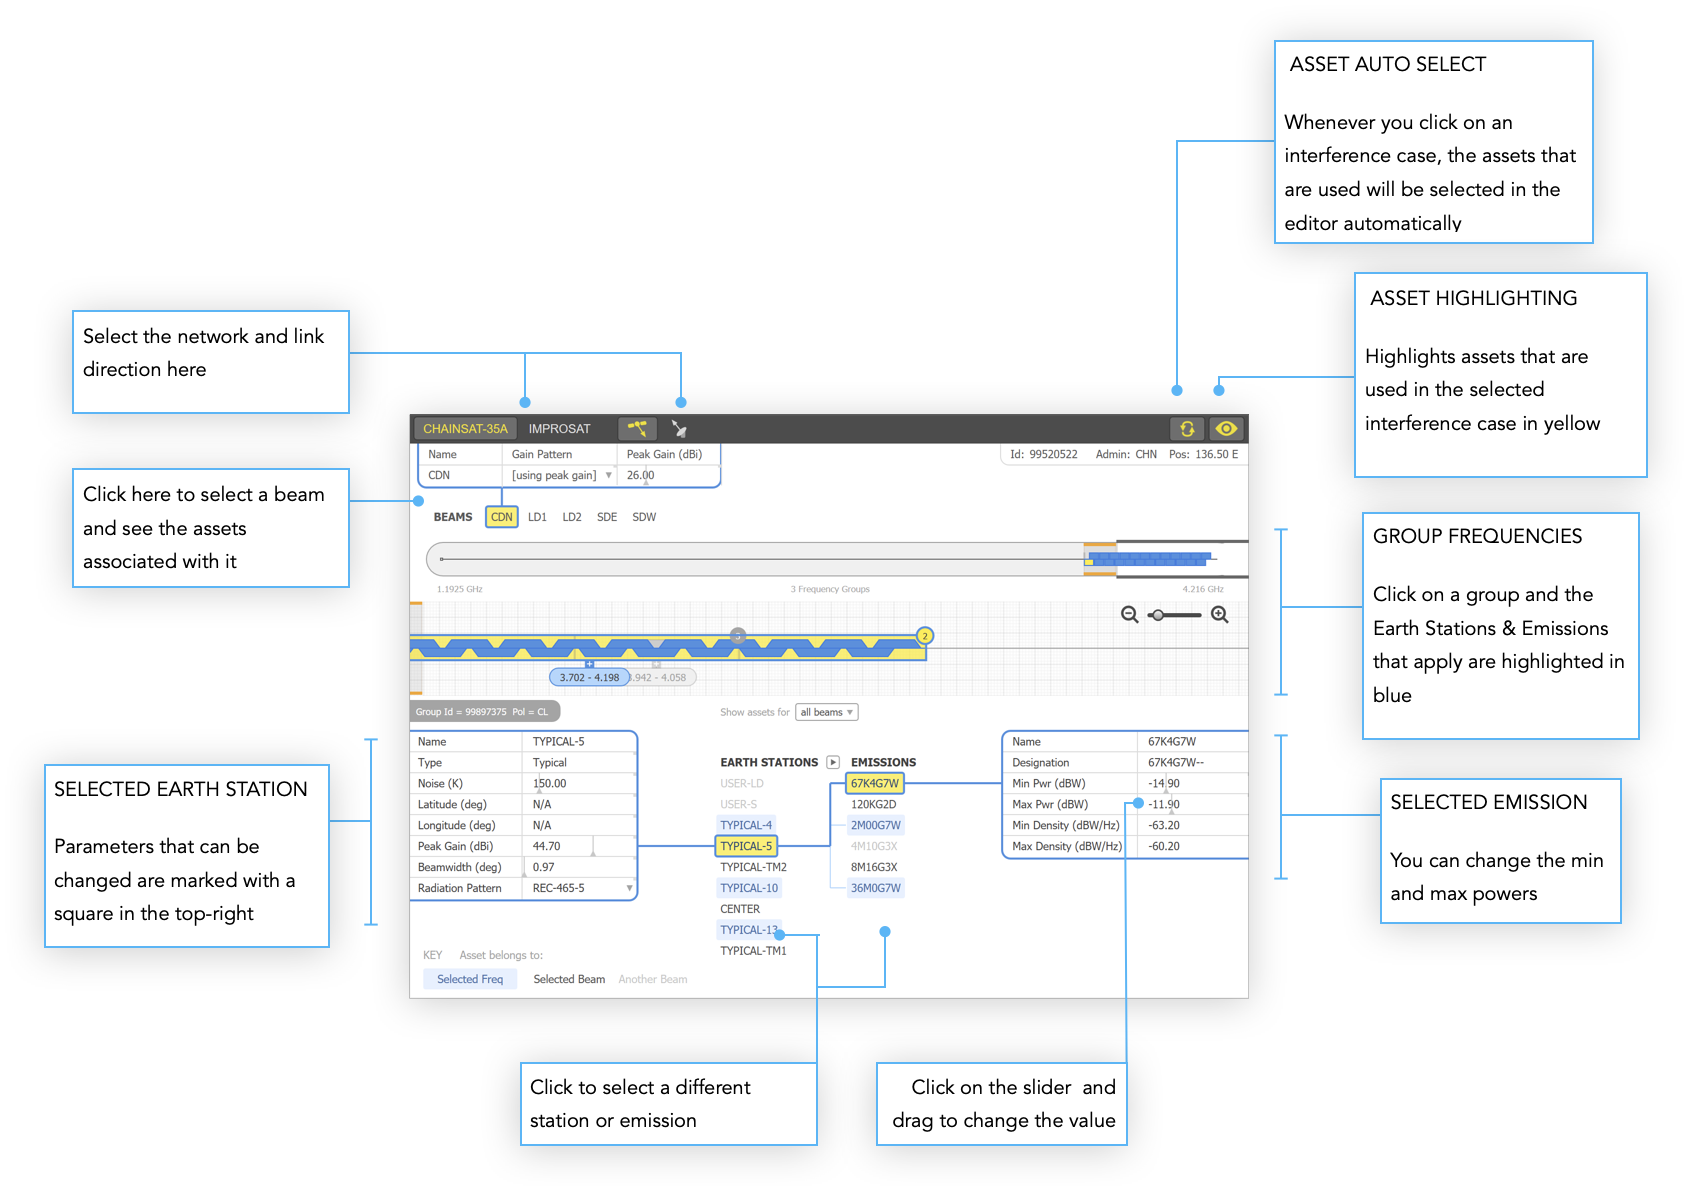
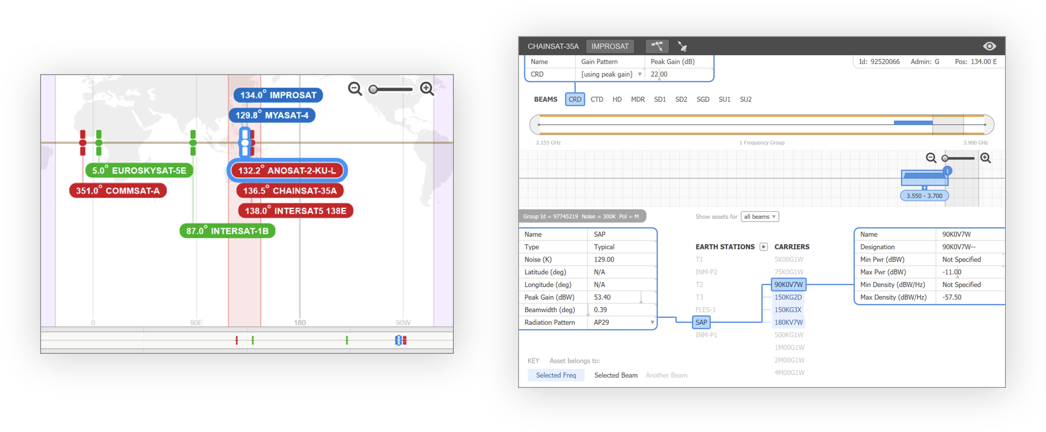
Network Editor
The Network Editor shows the full network definition for the both interferer and victim. You can use it to trace exactly which network parameters are contributing to a particular interference case. However, its real value is in the ability to change those parameters in order to explore ways of reducing the interference.
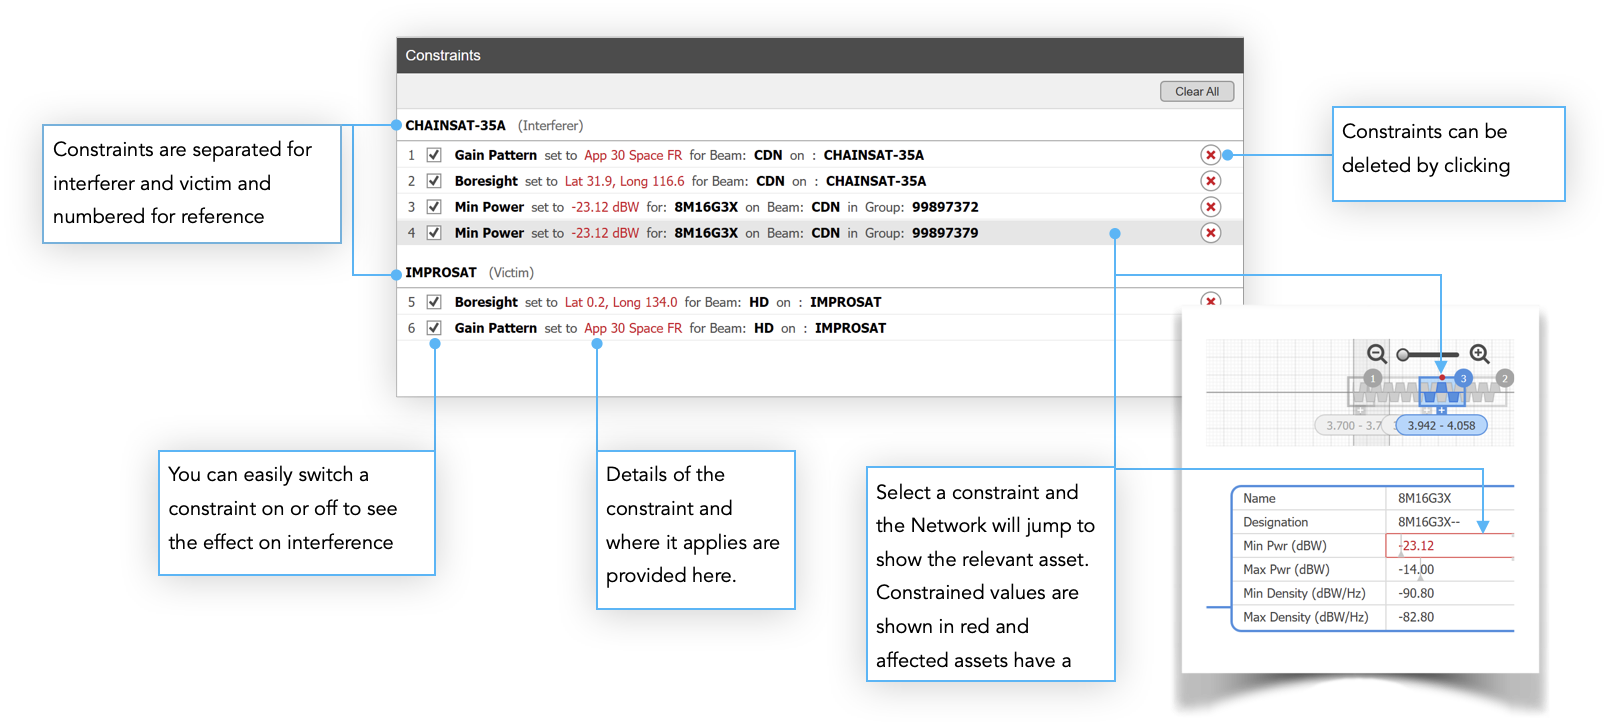
Constraints
When you make a change to a network asset you are not changing it permanently but merely exploring what might happen if the asset were altered. We call this kind of change a Constraint and these are collected in the Constraints pane.
By compiling a list of constraints you can go into a coordination meeting with a set of proposed solutions. Constraints can be toggled on and off for easy comparison or deleted completely. What’s more, because they apply to the asset, all interference cases that use the asset will be updated whenever a constraint is applied or removed.
Antenna Modelling
One of the best ways to mitigate interference is to use accurate antenna gain modelling.
If the software was not able to locate your beam data in GIMS then it will automatically use the worst case scenario of peak gain across the whole service area. Obviously if the interference levels are below the desired threshold then all is well. However, if that’s not the case then you can get a more realistic picture by either using an appropriate ITU gain pattern or by providing antenna gain contours
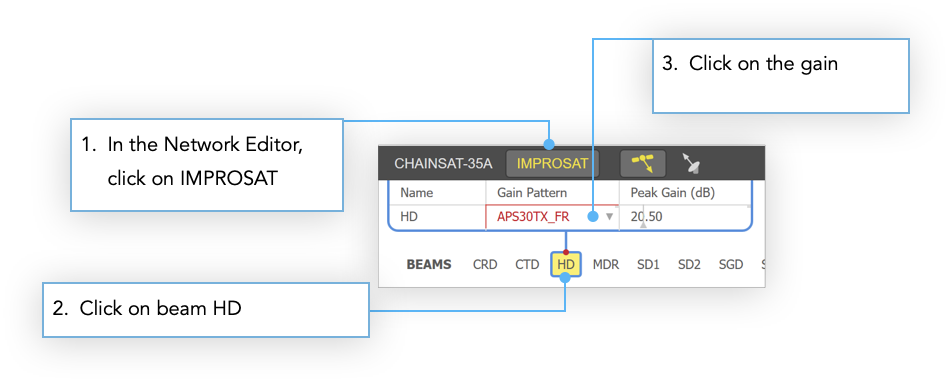
ITU Gain Patterns
To show you how to use an ITU gain pattern for a beam let’s change the one for CHAINSAT-35A in the example we’ve been looking at. In the Network Editor, click on CHAINSAT-35A
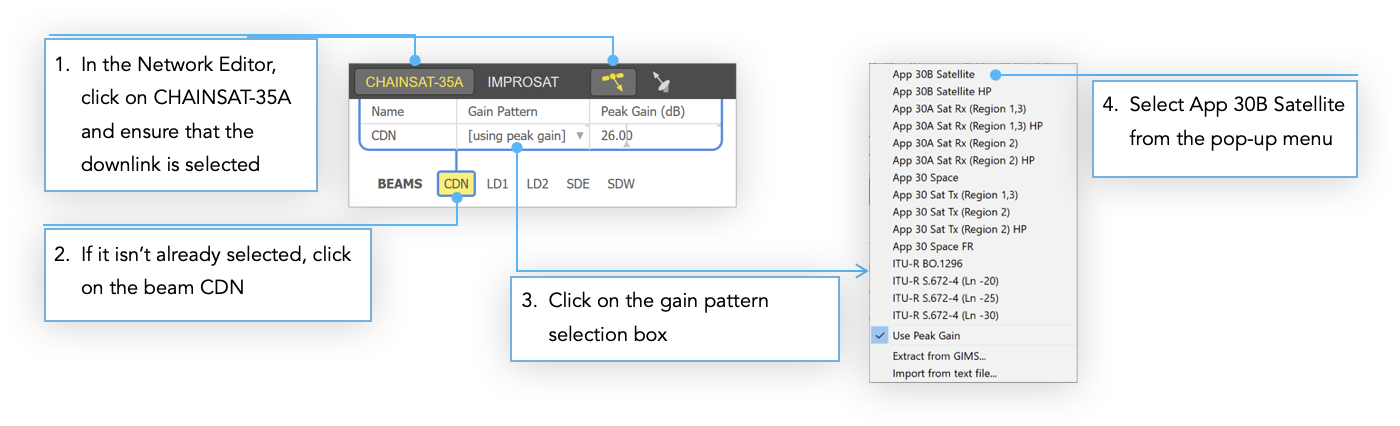
You should see the beam footprint on the Beam Overlaps pane. If you don’t then it could be that you have this switched off on the display options.
One other option you have with the ITU gain pattern is to change the pointing direction. Click and drag the boresight for CDN over to central China as shown.
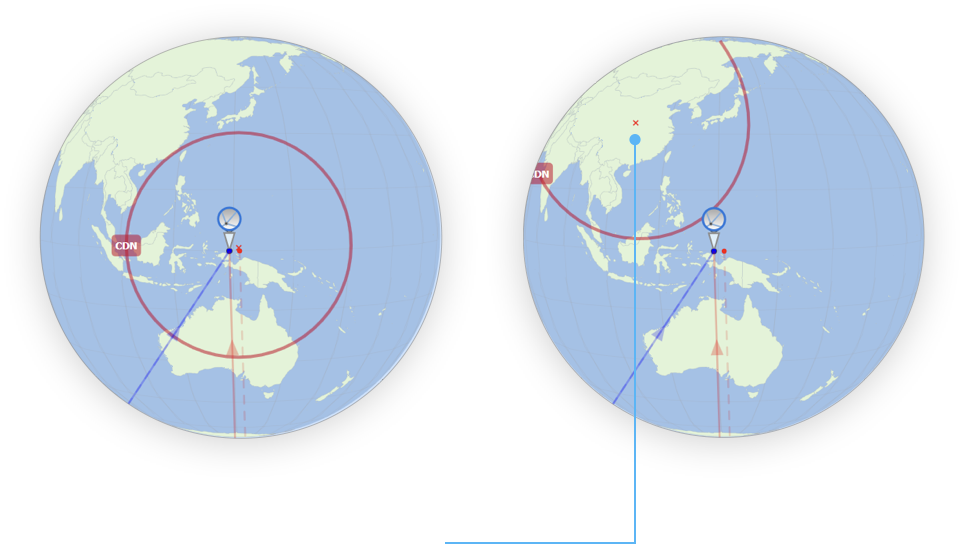
You should see that this immediately improves the interference picture as the off-axis gain for the interfering signal is significantly reduced
Try changing the gain pattern for the victim beam HD in the same way but this time choose ‘App 30 Space FR’.
Antenna Gain Contours
The other option for antenna modelling is to supply gain contour data. If you have this in a GIMS format .gxt file then you can easily load them into the software. To do this follow the same steps as for the ITU Gain Patterns but from the pop-up menu choose ‘Import from .gxt file…’.
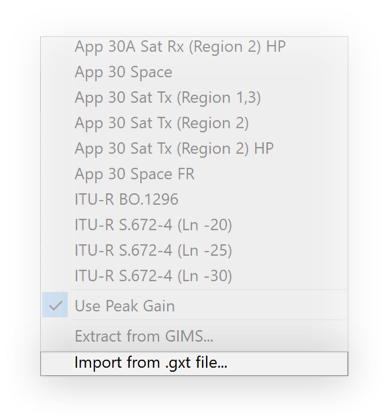
You can also choose the option to extract directly from GIMS if you have the data there.
Shaped Beam Editor
If you don’t have your gain contour data in GIMS format then you can use our Shaped Beam Editor (SBE) tool to capture this. Choose Shaped Beam Editor from the Tools menu or click the Shaped Beam Editor button on the toolbar.

For information on the Shaped Beam Editor see here.
Area Analysis
The interference cases show the C/I for one particular Earth Station arrangement. On the Beam Overlaps pane you can drag the Earth Station(s) to a different location and see all the calculations update as you drag. This is great for looking at individual ES locations in isolation, but what if you wanted to get an overview across a whole coverage area? What you need is Area Analysis.
Creating an Area Analysis
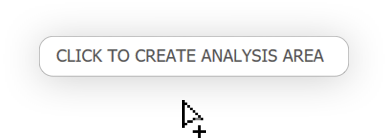
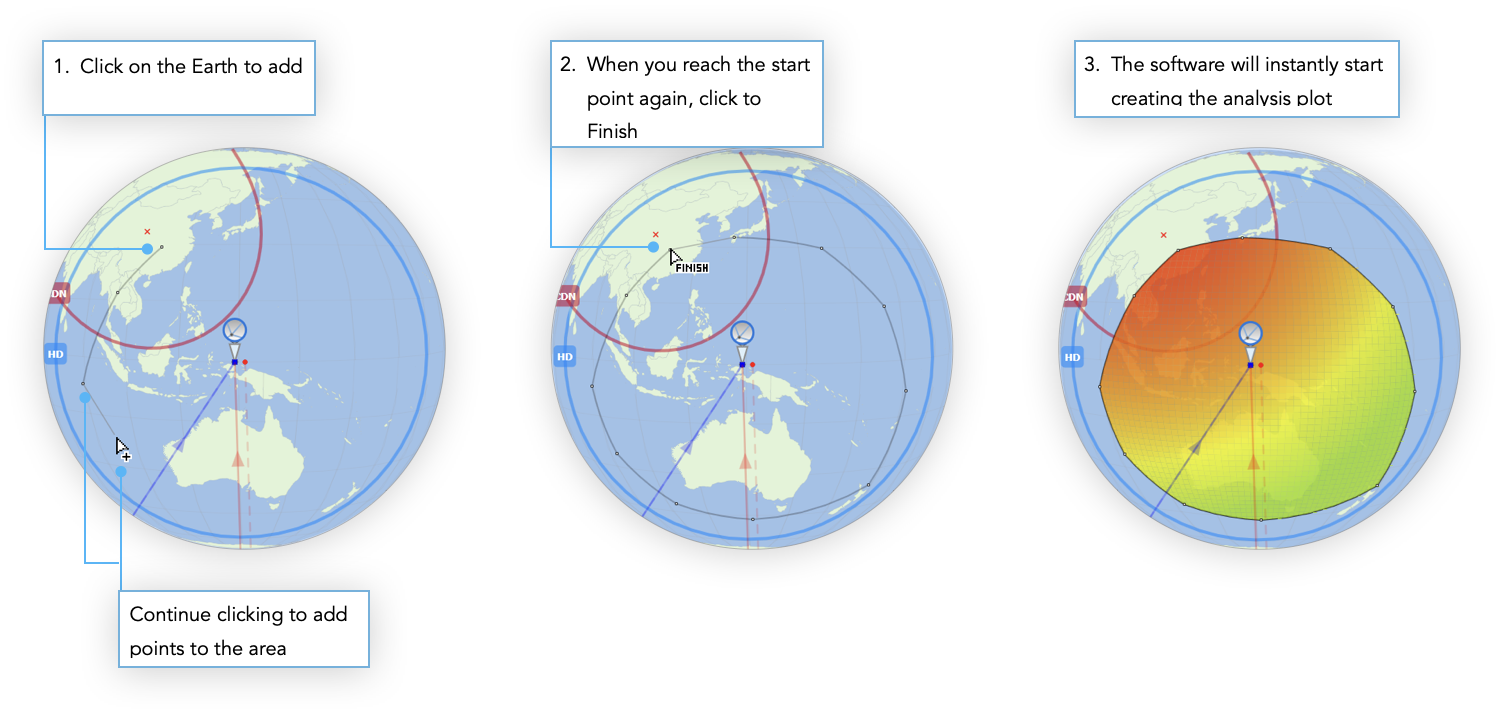
All you need to do is define the area and choose the plot parameter. The software then generates a coloured plot of the parameter across the area for every possible Earth Station location.
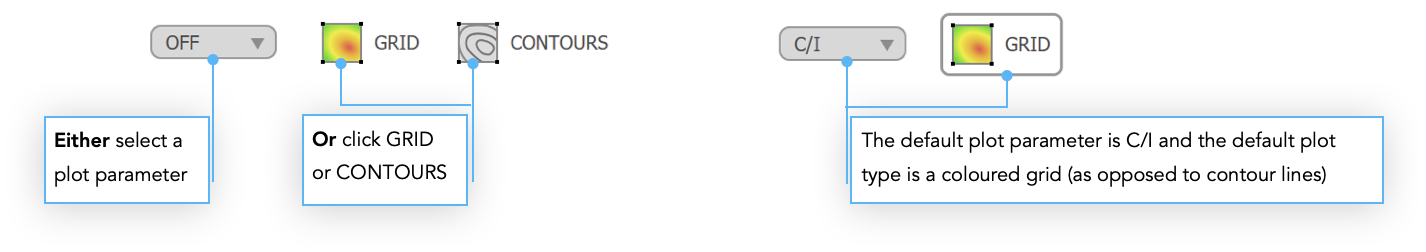
Try clicking on the GRID button. The cursor will change and a message will appear to show that you’re now in area definition mode.
You can see instantly that almost all Earth Stations in Australia meet the required threshold and that interference levels become a problem as the position moves towards China.
If you add any constraints then these will be reflected in the area analysis automatically. The analysis updates independently so you can drag a slider in the Network Editor and see the analysis update in real time, as you drag
Changing the Plot Parameter
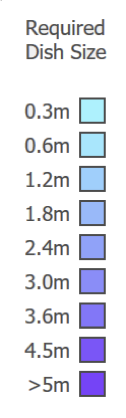
In addition to C/I, there are five other parameters you can plot on an Area Analysis. These are: C/(N+I), C/N, DT/T, I EIRP and Required Dish Size.
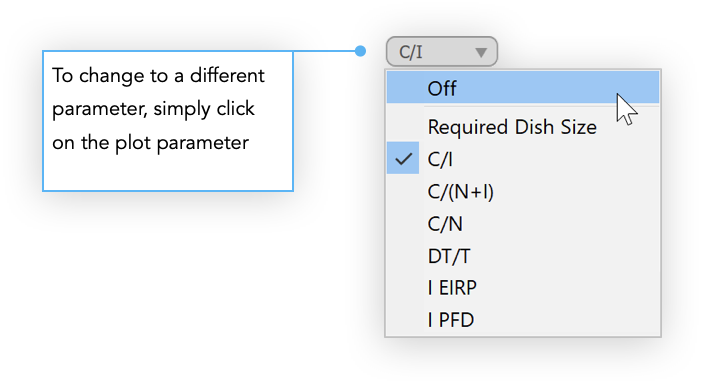
The parameters are self explanatory except for Required Dish Size. In this case we look at the dish size that would be required in order to reduce the C/I enough to meet the required threshold. Mostly this will be the victim Earth Station but for uplinks you can choose to look at the interfering Earth Station instead.
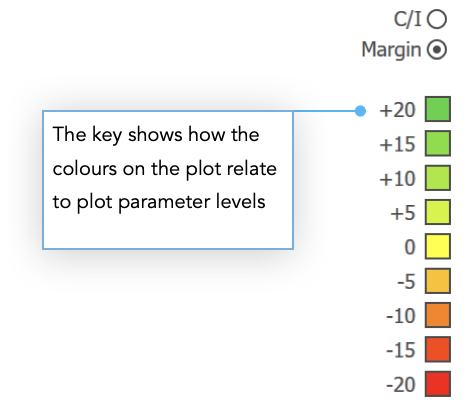
Try selecting Required Dish Size. In our example the plot is a uniform colour and the colour key tells us this is because the interference is so high that a dish size in excess of 5 metres would be required to meet the threshold.
If we change the network parameters slightly you can see more variation.
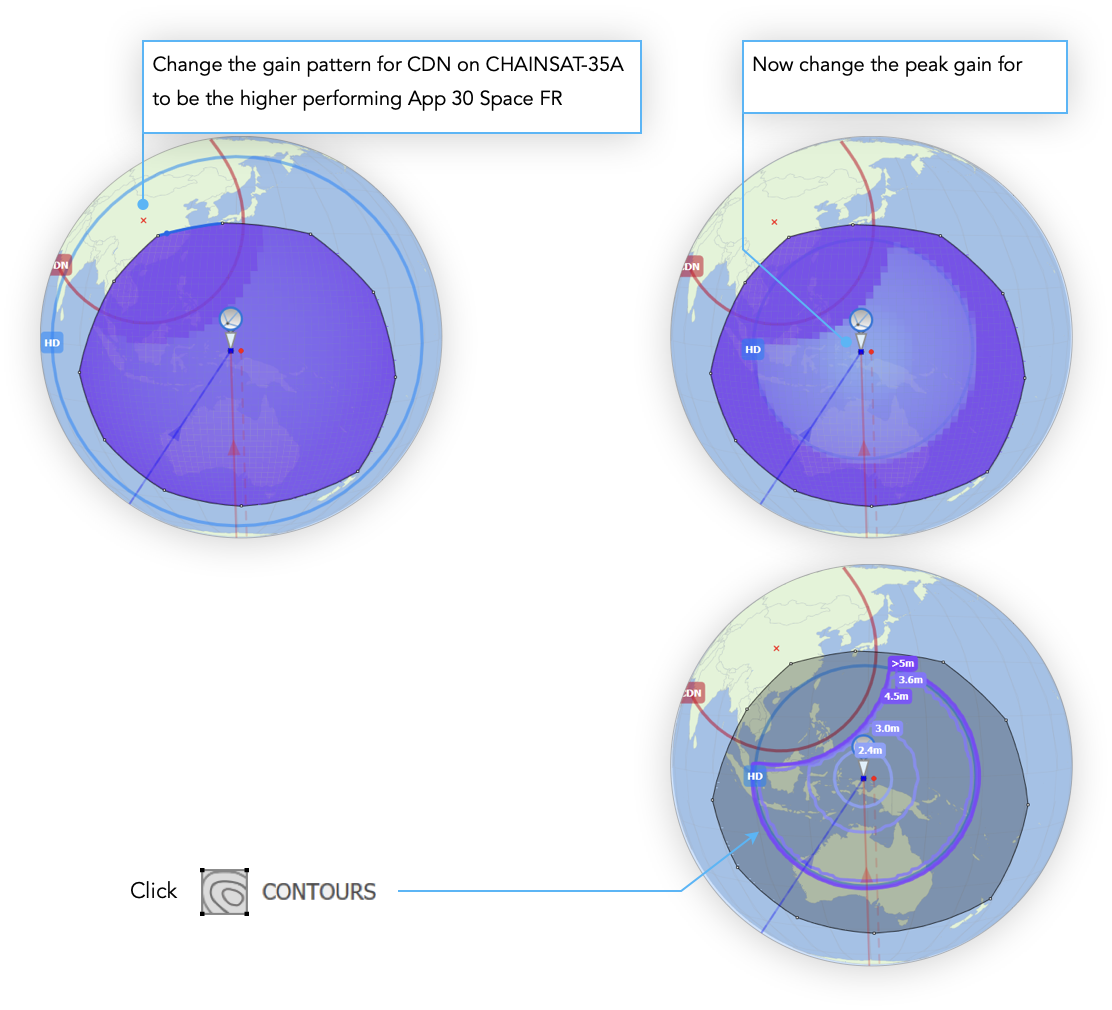
You’ll see now that within the 3 dB beam there’s an area where an Earth Station dish size of around 3m would be all that’s needed to mitigate the interference. You can get more explicit figures for required dish size by switching from a GRID to a CONTOUR plot.
If you drag the reference Earth Station to different points on the plot you should see the required dish size change accordingly on the Interference Cases pane
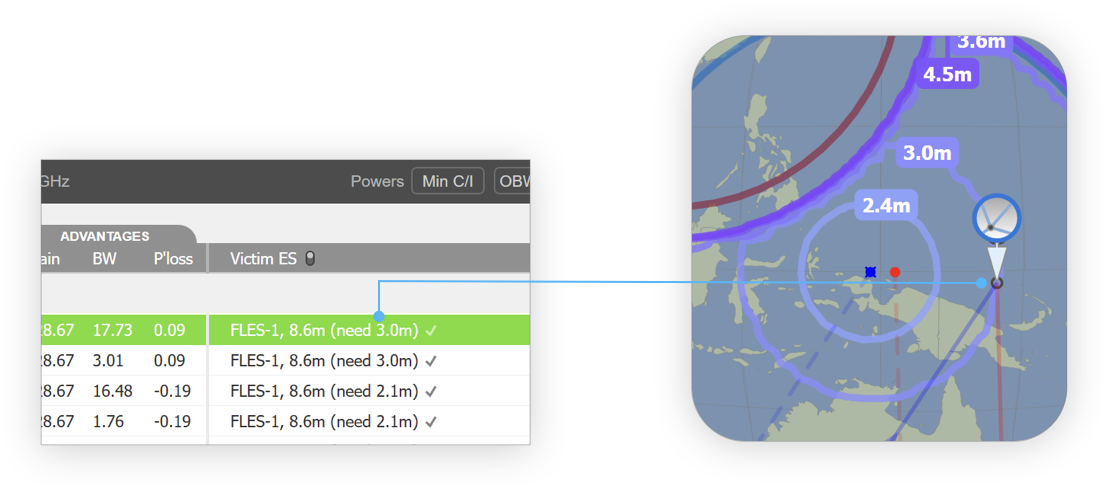
In the example above, we’ve dragged the reference Earth Station to the 3.0m contour and, as expected, the required dish size changes to 3.0m in the Interference Case.
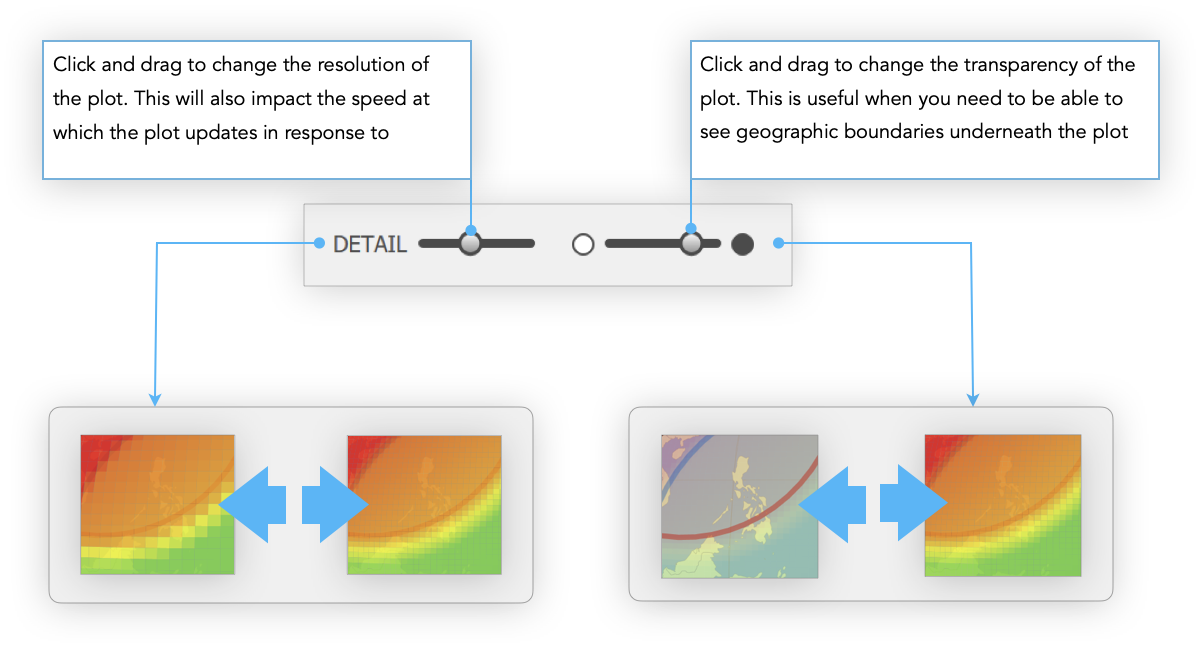
Modifying an Area Analysis
There are a few ways you can alter an Area Analysis after it has been created. First off are detail level and transparency. These can be adjusted using the two sliders on the Analysis toolbar
As well as the appearance, you can also change the size and shape of the Area Analysis. You can do this by moving, deleting or adding to the points that define the analysis boundary.
To Move a point
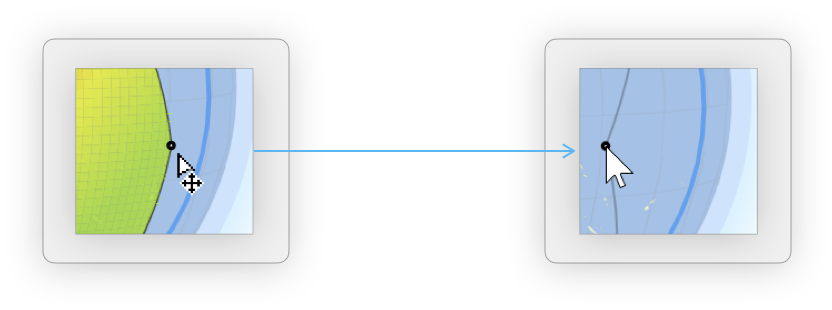
- Hover the mouse near the point you want to move until the point is highlighted and the mouse pointer changes.
- Click and hold. Drag the point to the new position and release the mouse button.
To Delete a point
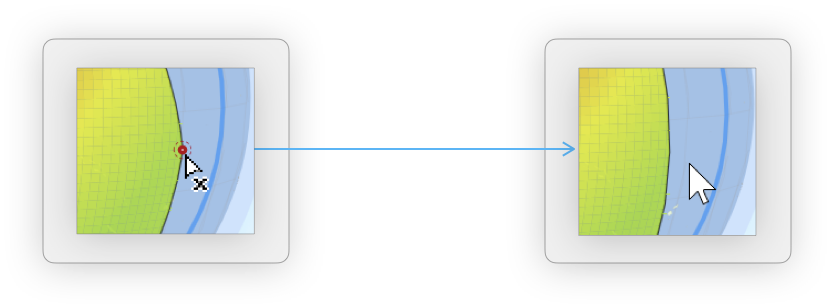
- Hold the CTRL key and hover the mouse near the point you want to delete until the point is highlighted in red and the mouse pointer changes.
- Click the mouse button to delete the point
To Add a point
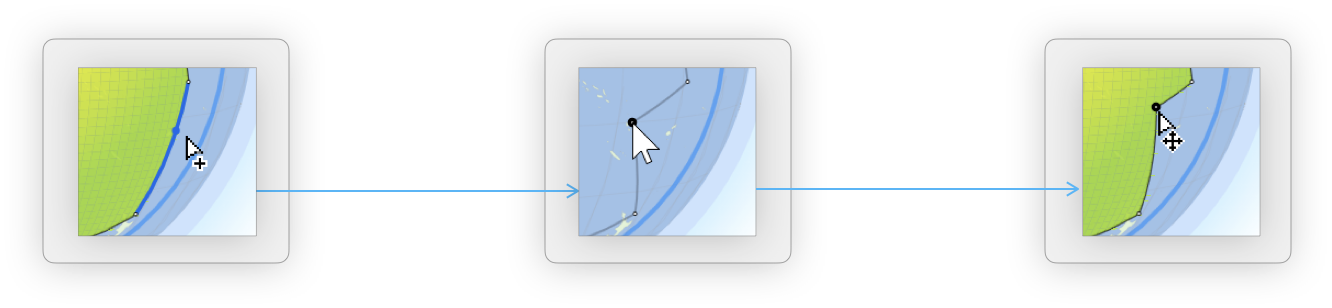
- Hover the mouse near where you want to add a point until the segment and potential new point are highlighted and the mouse pointer
- Click and hold. Drag the point to place it.
- Release the mouse button to finish.
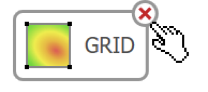
Removing an Area Analysis
If you only want to hide the analysis temporarily then you can just switch it off. It can then be recalled later by selecting a plot parameter or by clicking the ‘Grid or ‘Contours’ buttons.

If you want to remove an area analysis permanently then click on the delete button in the top-right corner of either the ‘Grid’ or ‘Contours’ buttons
Maximise Pane
The Maximise Pane feature is also available in Detailed Coordination. See here for details on how this works.
Data Output
Pane Copy
All the Visualyse tools have some way of getting data out of the software. The two main tools, Coordination Check and Detailed Coordination implement a system called Pane Copy. This is easy to use. Just choose Copy from the Edit menu or press CTRL + C.
Graphical panes like the Satellite Map or Network Editor (in Detailed Coordination) will have their contents copied to the clipboard as an image. You can then paste these into reports or e-mails just like any other image.
Panes that contain data like the Overlap List or Calculations Pane (in Detailed Coordination) will have their contents copied to the clipboard as formatted text. This is prepared in a format that will paste easily into spreadsheet applications like Microsoft Excel.
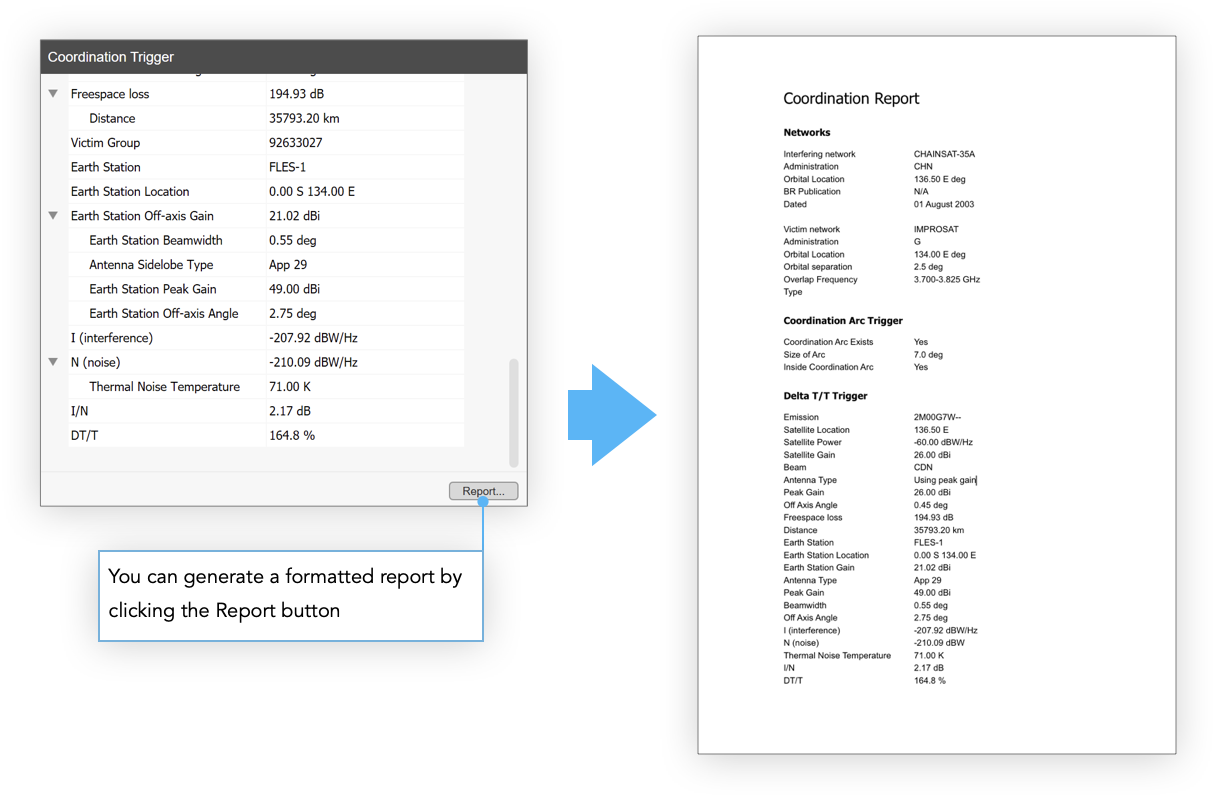
Reporting
In Visualyse GSO V3, when you select a beam pair for one of the overlaps you can choose to generate a report for the Coordination Trigger. This is created as a formatted Microsoft Word document.
Defining a Network
My Networks
There are two ways to get your networks into the software. You can either import them from an existing ITU format database (an IFIC or the SRS) or you can enter your data using the Network Editor. With both methods the first step is the same. Launch Visualyse GSO V3. From the Tools menu select Define My Networks. You can also click the My Networks button on the toolbar.
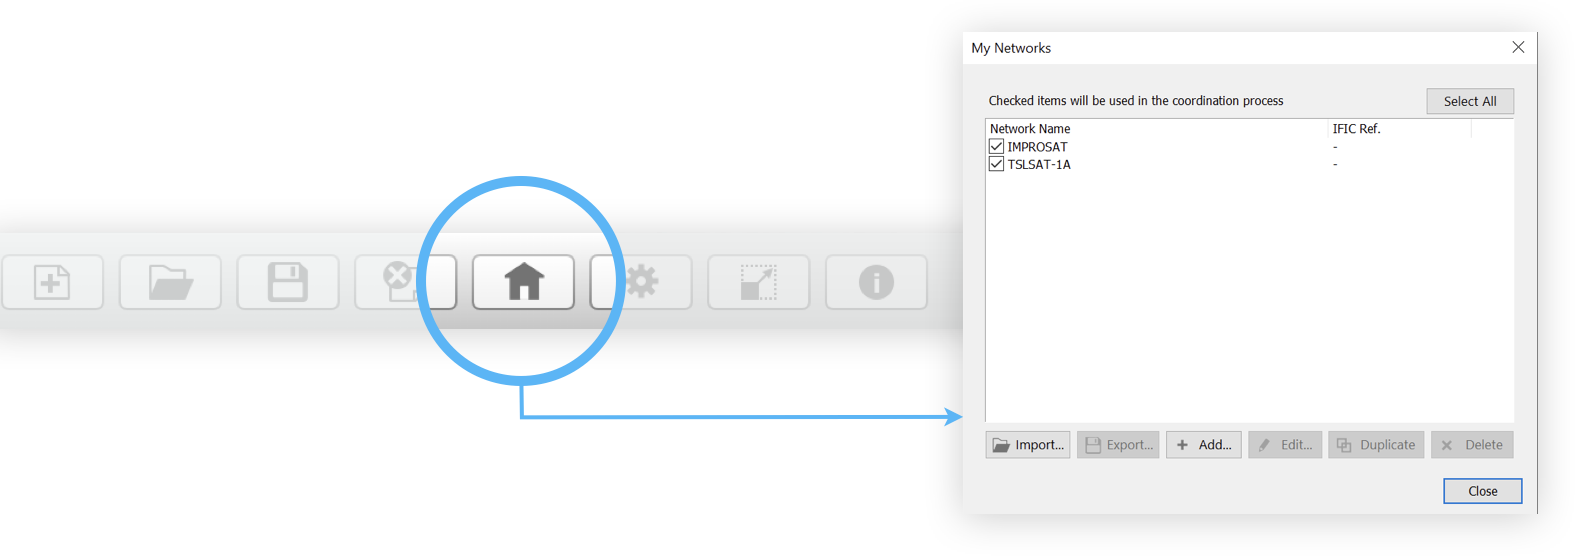
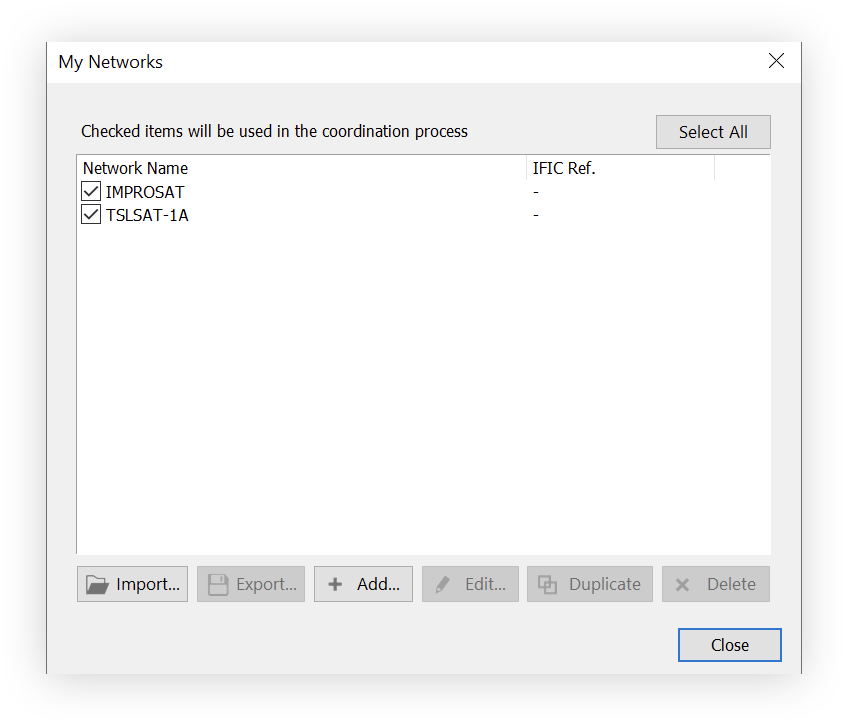
The My Networks dialog will be displayed. The dialog shows all the networks you have created or imported into your database. In the case of imported networks, the IFIC reference is also shown. Each network has a check box next to it. Checked networks will be included in the IFIC and Custom coordination checks.
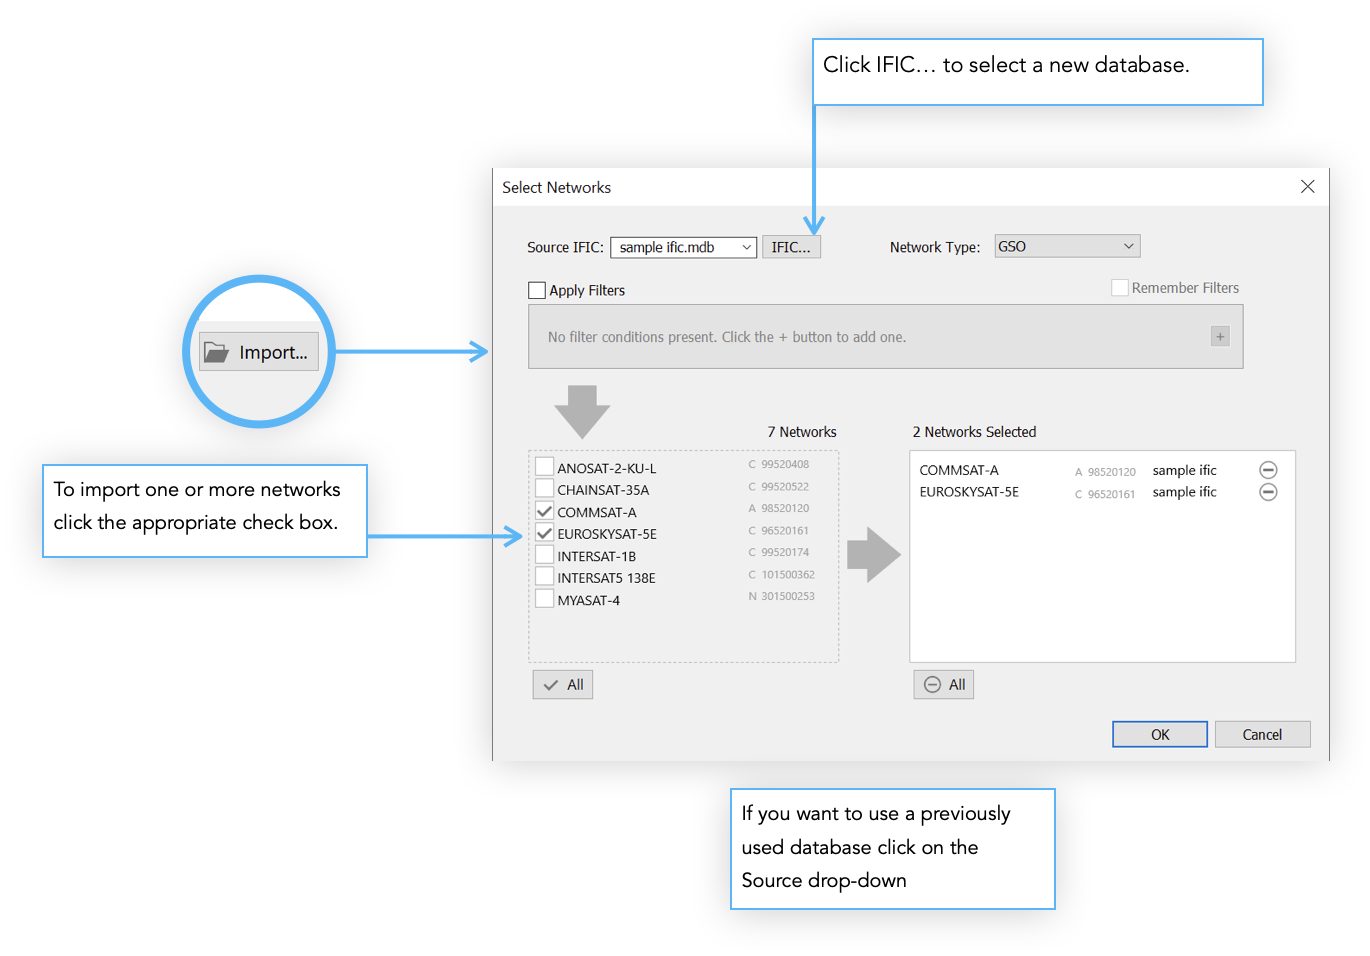
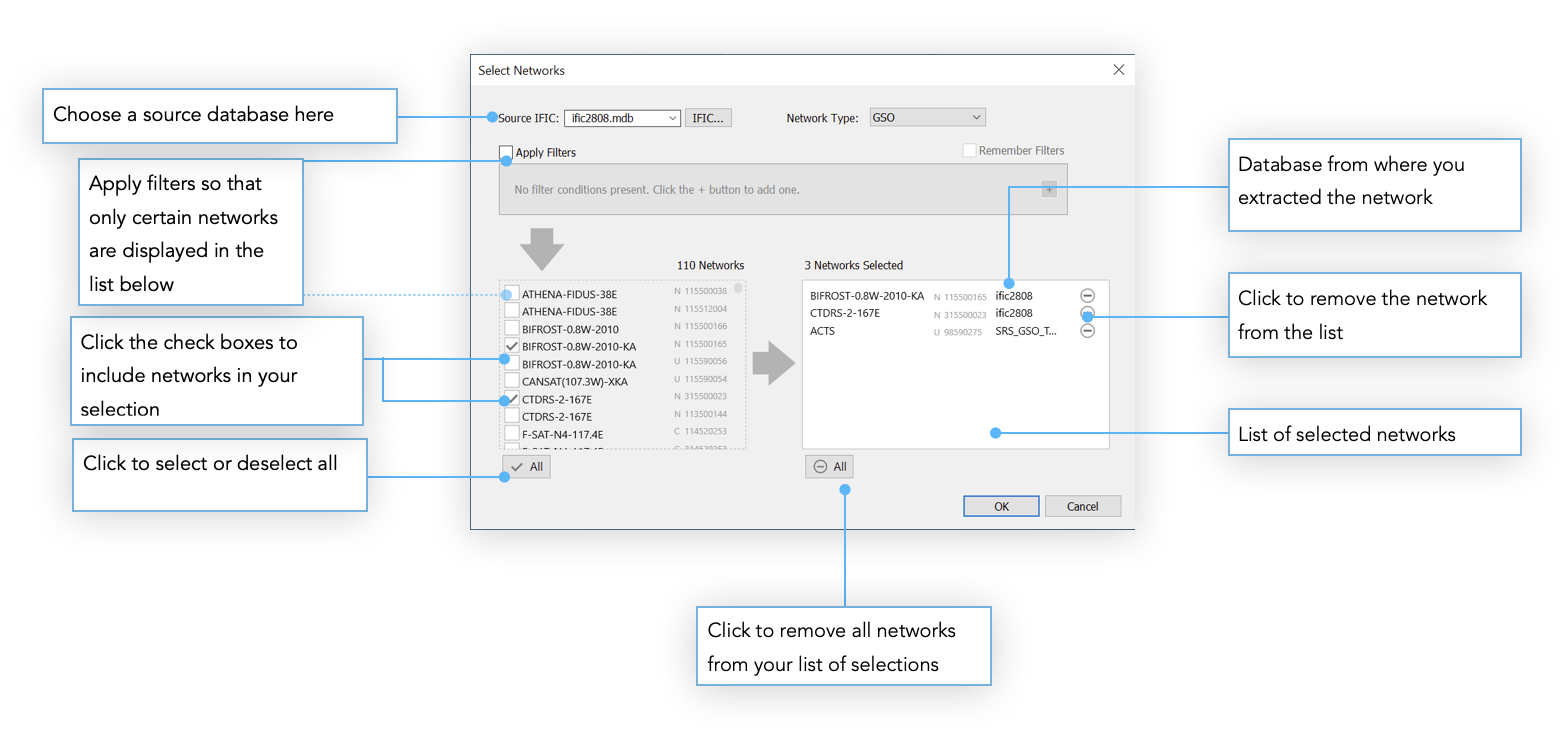
Importing From an ITU Format Database
To import a network from an ITU format database such as an IFIC or the SRS, open the My Networks dialog and click the Import button. The Select Networks dialog will be shown.
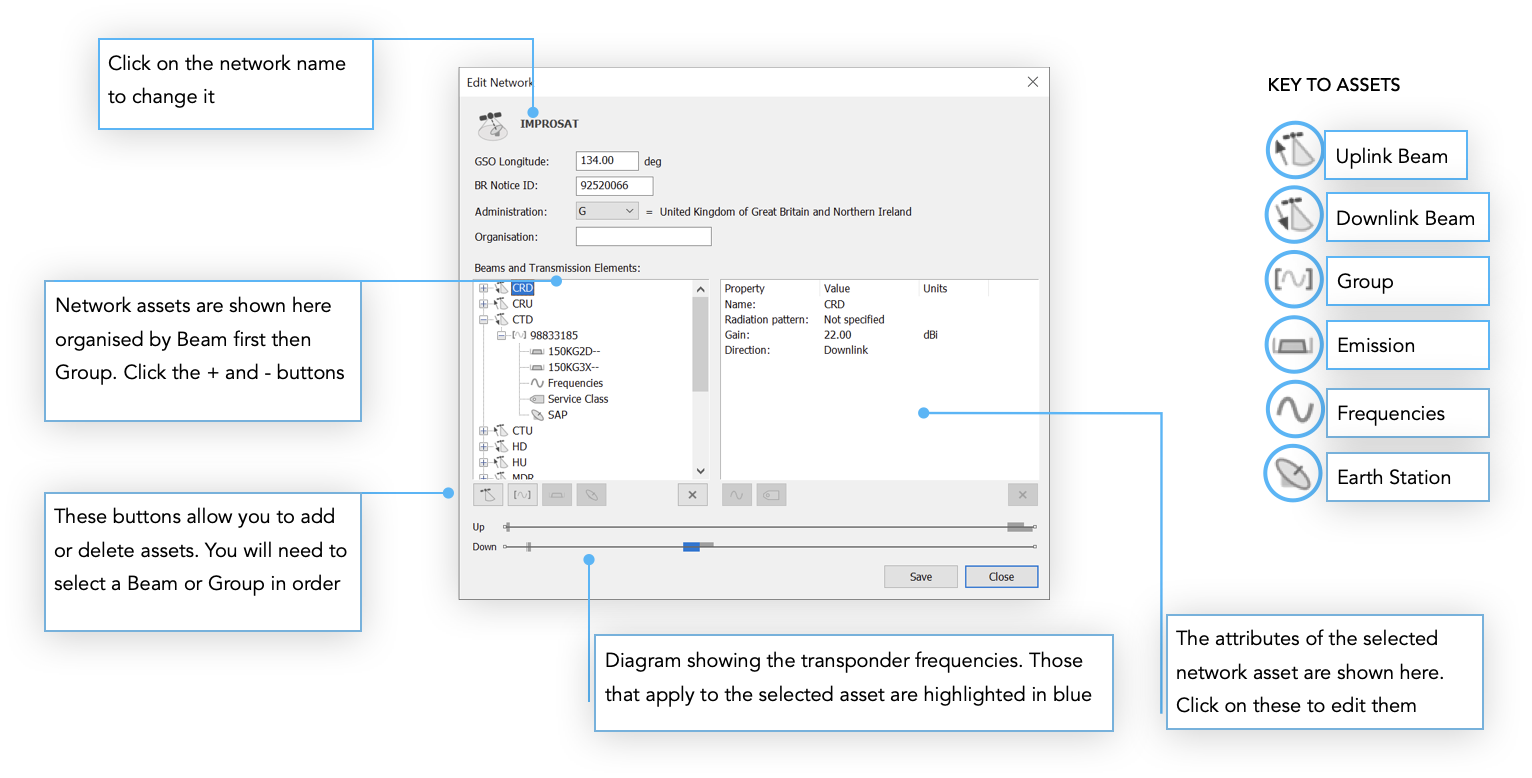
Editing Networks
You can create your networks from scratch using the Network Editor. You can also use the Network Editor to modify networks that you have imported from other databases. None of these features are available in the demo version.
On the My Networks dialog, select IMPROSAT and then click Edit to open the Network Editor.
Application Settings
The Settings and Defaults dialog was mentioned at the beginning of this document. You’ll recall that this can be invoked by selecting Settings from the Tools menu in Visualyse GSO V3.
The Settings and Defaults dialog can also be accessed by clicking on the Settings button on the toolbar.
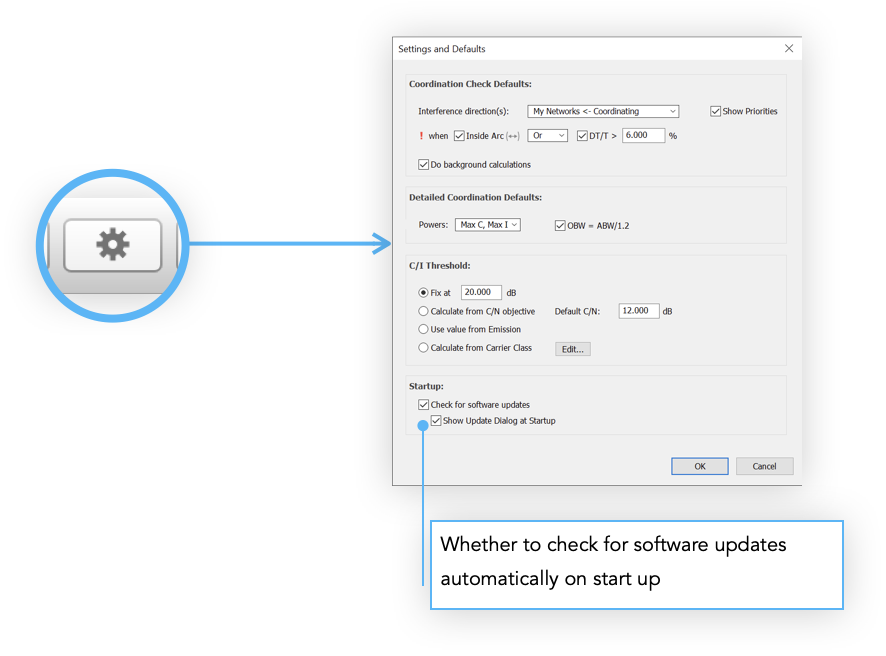
Aside from the option to check for software updates, the Settings are broken down into two different sections - those that affect the Coordination Check and those that affect Detailed Coordination.
Coordination Check
Detailed Coordination
These settings are only used in the Detailed Coordination (DC) tool. They govern how the Interference and C/I required level (threshold) are calculated.
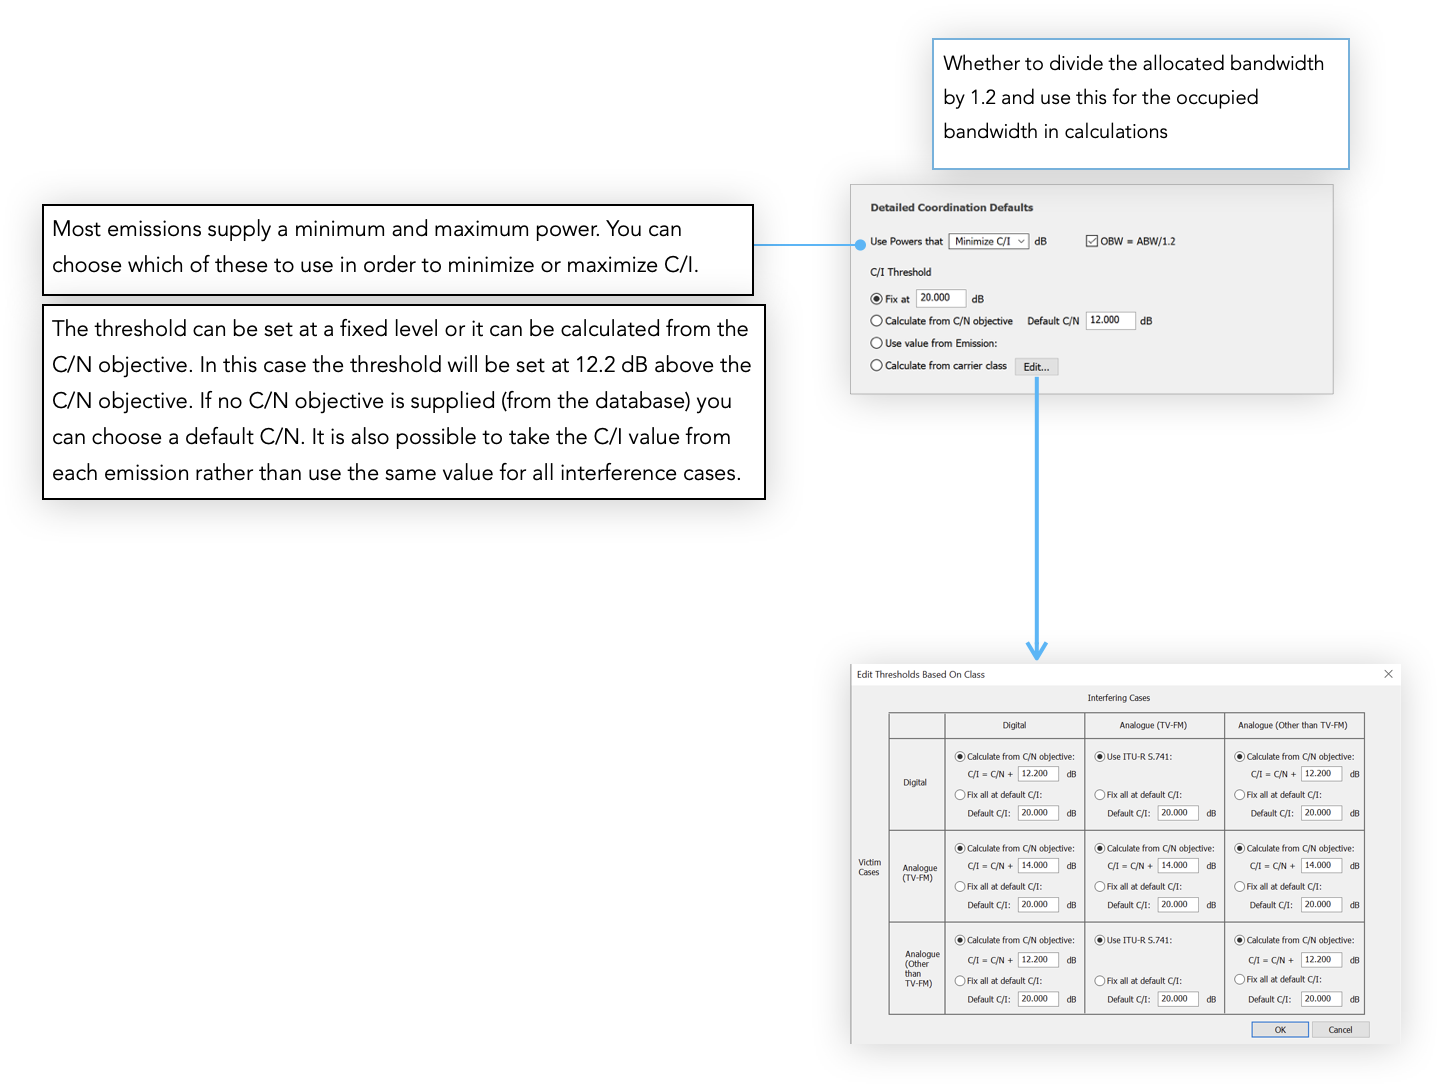
The final option is to calculate the C/I threshold based on the carrier class (extracted from the emission code). Click the “Edit” button and you’ll be able to select the option used for each carrier class pair.
When the Interferer is Analogue (TV-FM) and the victim is Digital or Analogue (Other) the equations used by ITU-R S. 741 option are as follows:
Interferer Analogue (TV-FM), Victim Digital
DeNeBd
DeNeBd
Interferer Analogue (TV-FM), Victim Analogue (Other)
in
DeNeBd = Necessary bandwidth of the desired carrier in
Equivalent bandwidth of the interfering carrier (equal to Total Power to Power Density ratio)
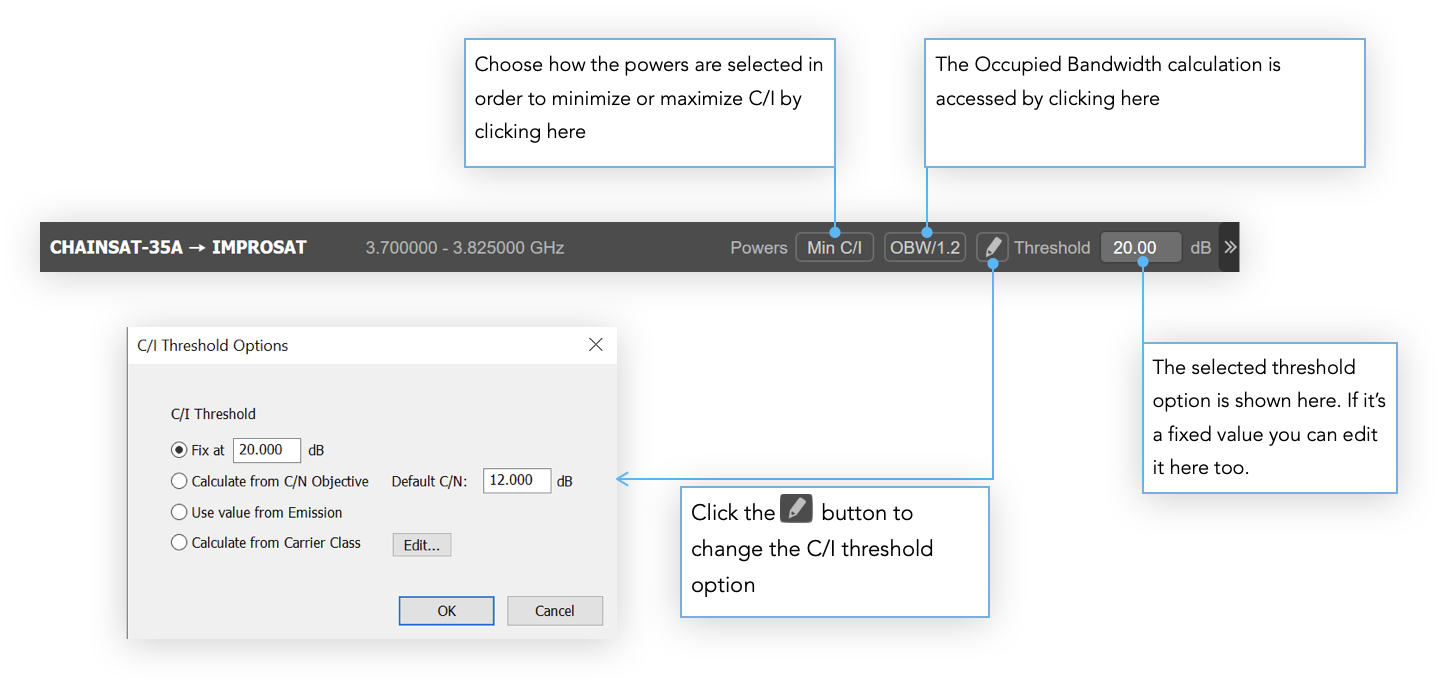
When you launch the Detailed Coordination tool you can access all of these settings from the toolbar at the top of the Interference Cases pane.
Shaped Beam Editor
The Shaped Beam Editor (SBE) allows you to edit or create shaped beams which can then be used as part of the detailed coordination process. The tool allows you to load GIMS format .gxt files. You can also export to GIMS format so anything you create can be exchanged with ITU software.
Launching
The Shaped Beam Editor is a separate tool from the main application. To open it choose Shaped Beam Editor from the Tools menu or click the Shaped Beam Editor button on the toolbar.

The Shaped Beam Editor window opens with a new shaped beam file by default. You can either proceed and start creating a beam from scratch or load in a GIMS .gxt file and work on that.
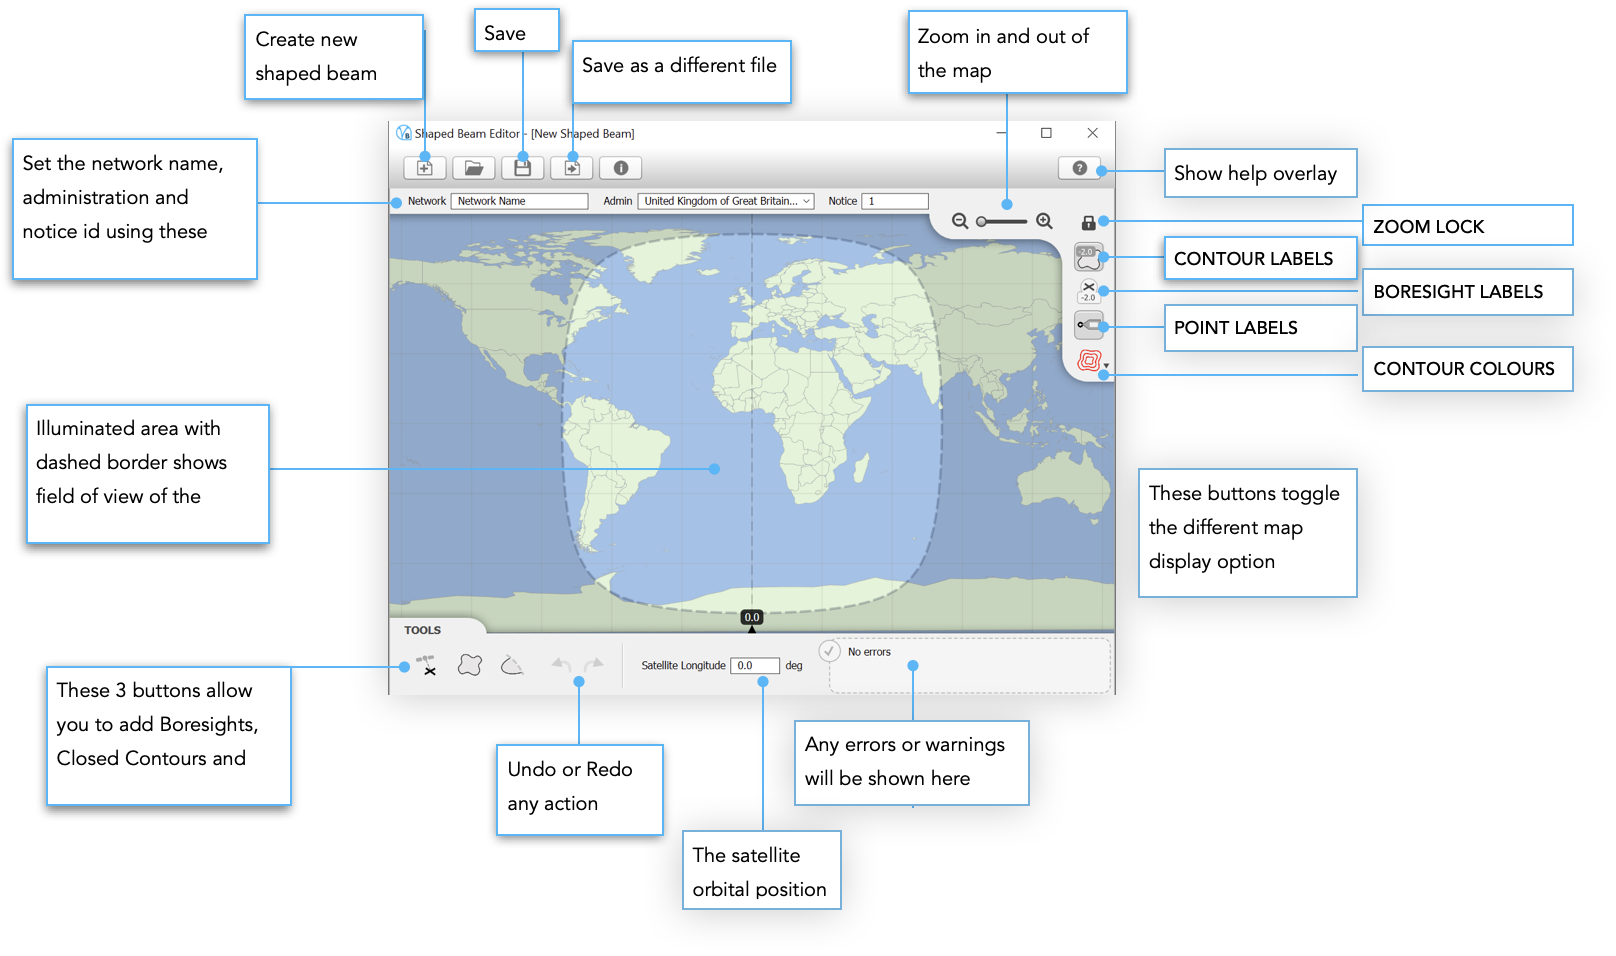
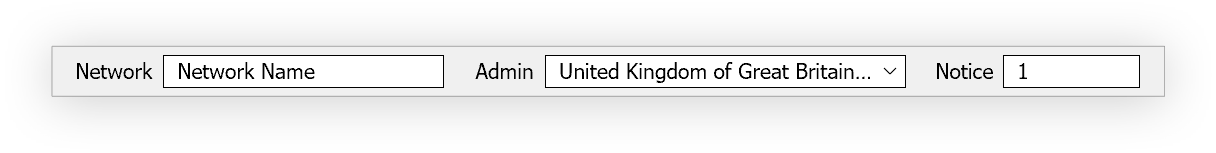
Setting Network Details
Use the controls at the top to set the name, admin and notice id for the network that the beam is to be a part of.
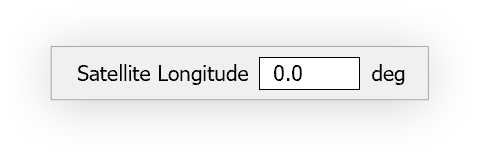
The orbital position of the satellite is set from the toolbar at the bottom of the window. When you change this you’ll see that the highlighted area of map representing the satellite field of view will change accordingly.
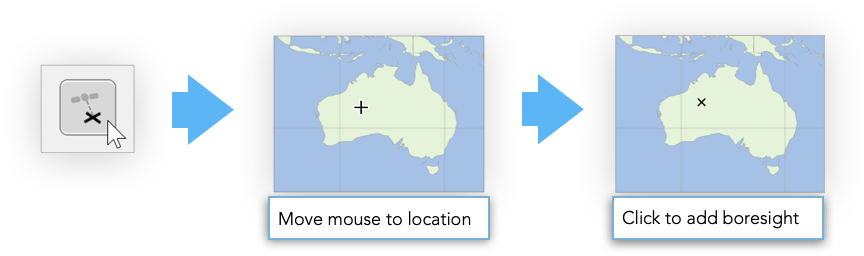
Adding Boresights
Click the Add Boresight button, then click on the map to add a boresight (hold SHIFT while clicking to add more than one).
Editing Boresights
You can move a boresight by clicking on it, holding the mouse button and dragging it to a new location.
To edit a boresight, first click to select it. You’ll see a small toolbar appear below the selection rectangle. This is called the Selection Toolbar
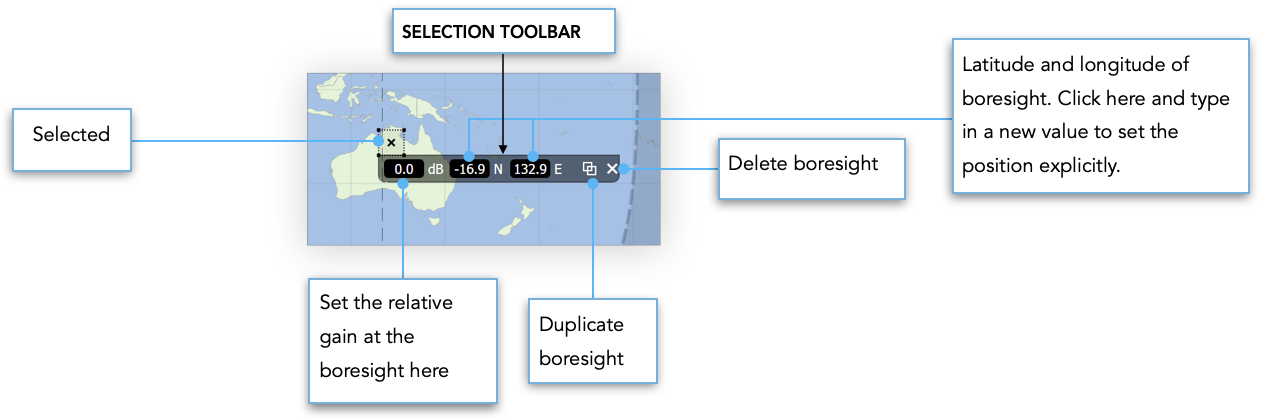
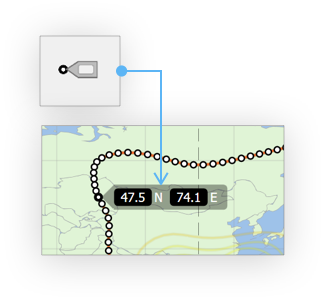
From here you can set the relative gain and the exact location in latitude and longitude coordinates. A boresight can also be duplicated and deleted from the selection toolbar.
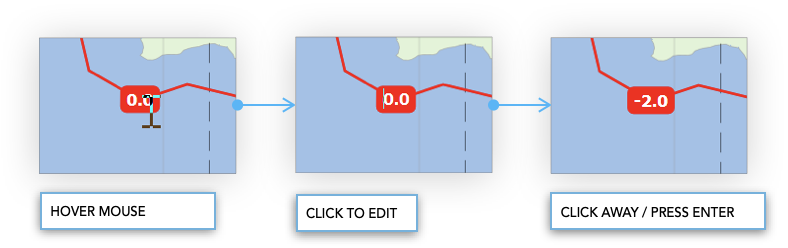
Adding Contours
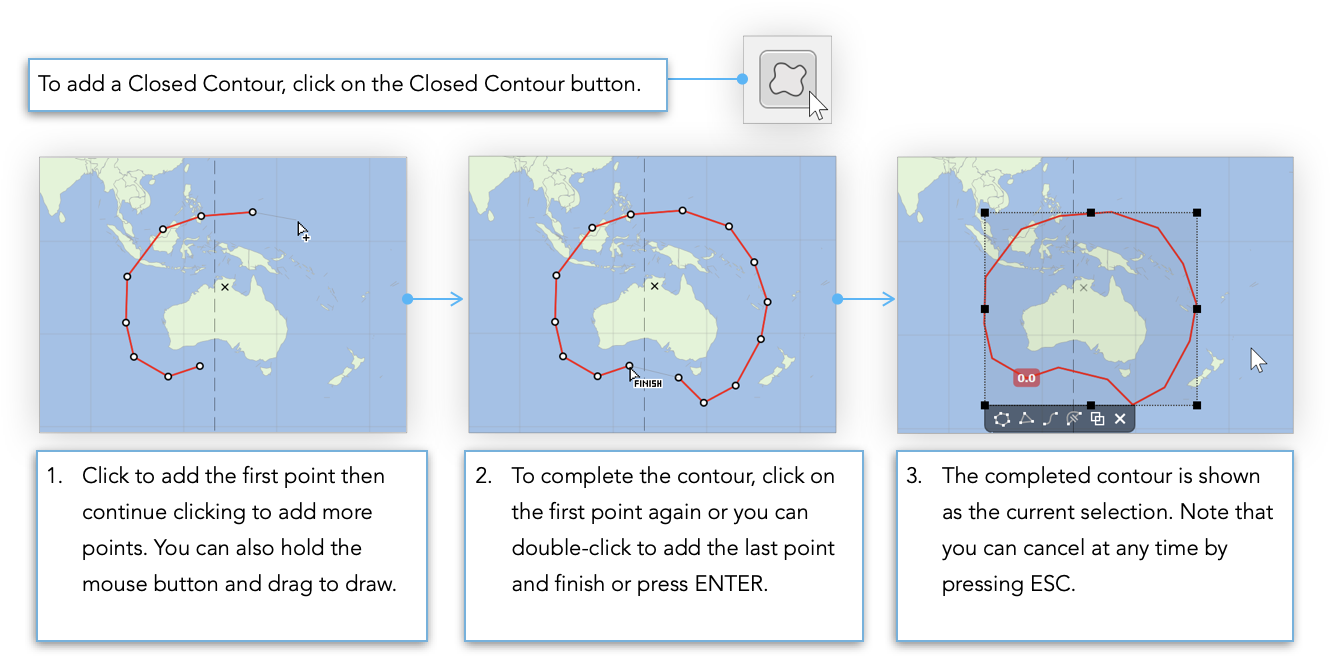
You then need to set the relative gain for the contour. This is shown in the label on the contour itself. By default it’s set to zero. To change it simply click on it then type in the relative gain you want and either click away or press ENTER.
Editing Contours
Click on a contour to select it. Just like boresights, contours have their own selection toolbar
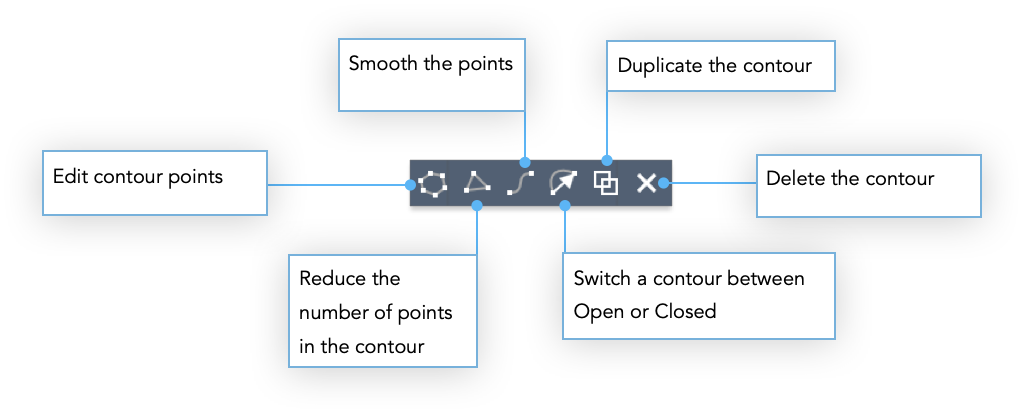
Editing contour points is described in the next section. Reducing the number of points will intelligently reduce the number of points by around half. Smoothing on the other hand will re-sample the contour and add extra points to smooth out any sharp edges.
Edit Contour Points
To edit a Contour (be it Closed or Open), either double-click on it or select it and then press the Edit Points button on the Selection Toolbar or press ENTER.
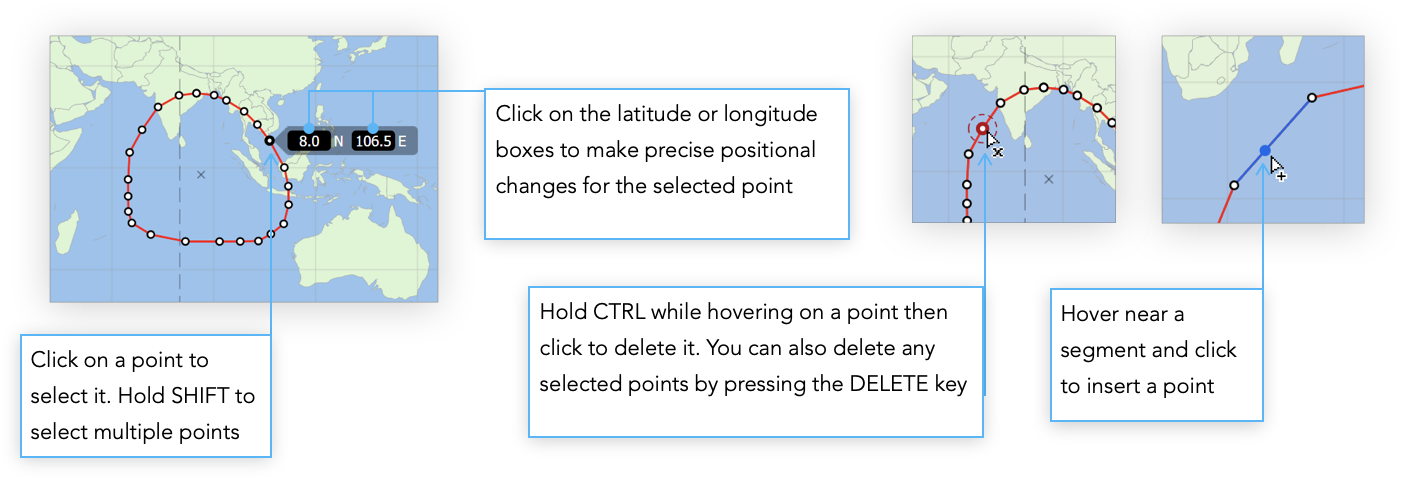
You can click on a point and drag it to a new position. You can also use the cursor keys to move the selected point by small amounts up, down, left or right. Hold SHIFT while doing this to move the point by a larger amount each time. The same applies to selections containing multiple points.
Pressing the TAB key will select the next point in the contour and SHIFT + TAB will select the previous point.
To finish editing either click on the Map or another item or alternatively press ESC.
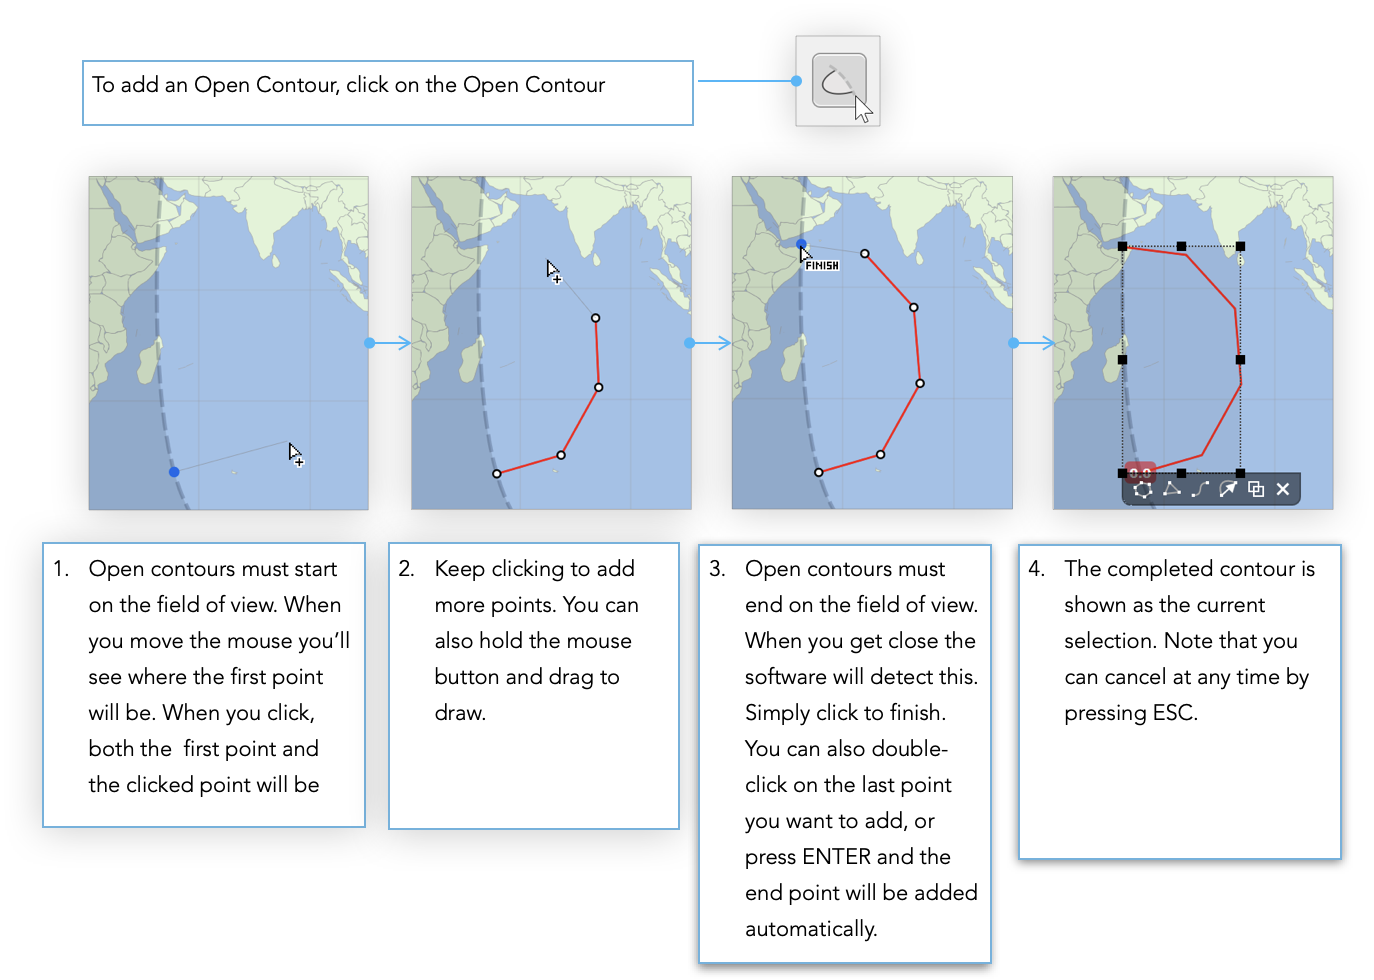
Detaching from the Field of View
As we mentioned earlier, open contours should start and end on the satellite field of view. If you drag an open contour then the end points will always remain on the field of view.
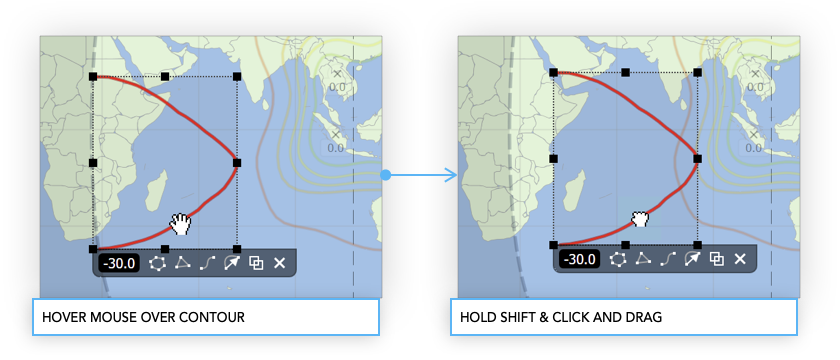
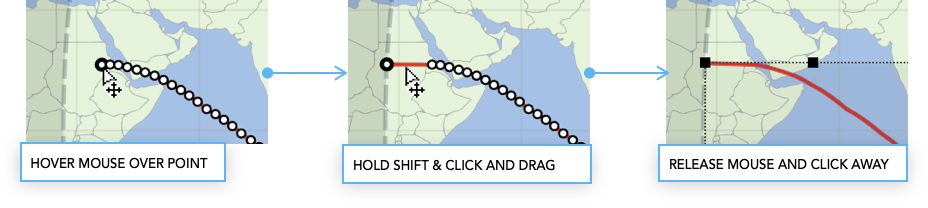
If you want to detach the end points from the field of view there are a couple of ways to do this. If you want to move the whole contour then simply click and drag it but hold SHIFT as you do this. The end points will then detach.
To re-attach the end points do exactly the same thing. Once an end point gets close to the Field of View both end points will re-attach at the nearest intersection.
HOVER MOUSE OVER CONTOUR HOLD SHIFT & CLICK AND DRAG If you only want to move the end points then first edit the contour. Click and drag an end point while holding SHIFT. The point will switch between being unattached or detached. Note that reattaching will only happen when you drag close to the field of view
Warnings and Errors
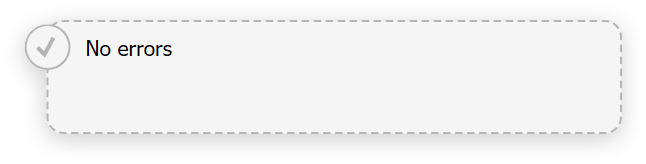
You may notice that as you start to construct your shaped beam an orange panel will appear in the bottom-right corner of the application window. This shows any warnings or errors. These are mostly advisory so that you can check your beam will conform to GIMS requirements as you go along.
If there are no errors or warnings you’ll see this:
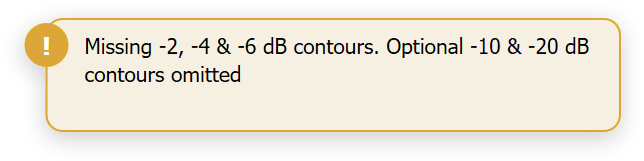
If there are any warnings or errors you’ll see something like this
Multiple Selections
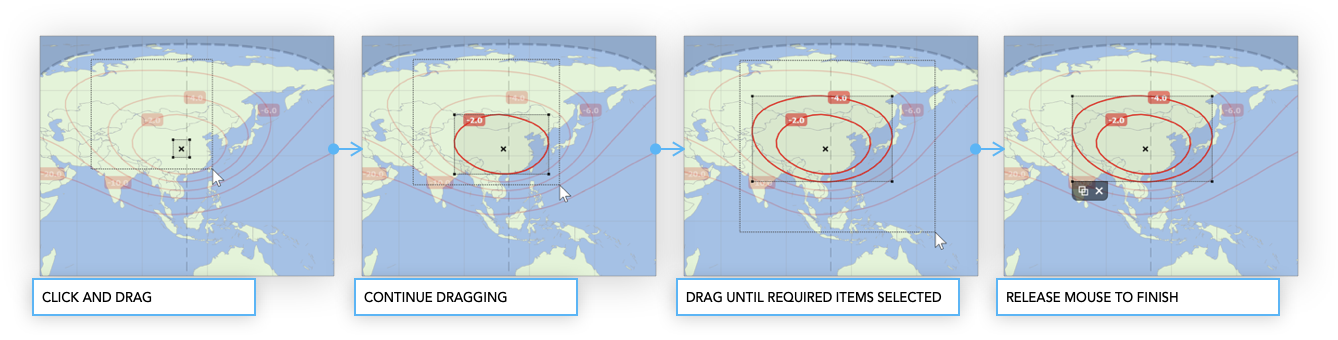
You can select multiple contours and boresights and then move, duplicate or delete all of them in one go. There are two ways to do this. You can click on an empty area of the map and then drag out a selection rectangle. Any contours or boresights that are caught in the rectangle will be selected. Alternatively just hold SHIFT and click to add or remove items from the selection.
Multiple selections have their own Selection Toolbar. If you have a combination of boresights and contours then you will only get options to Duplicate or Delete.
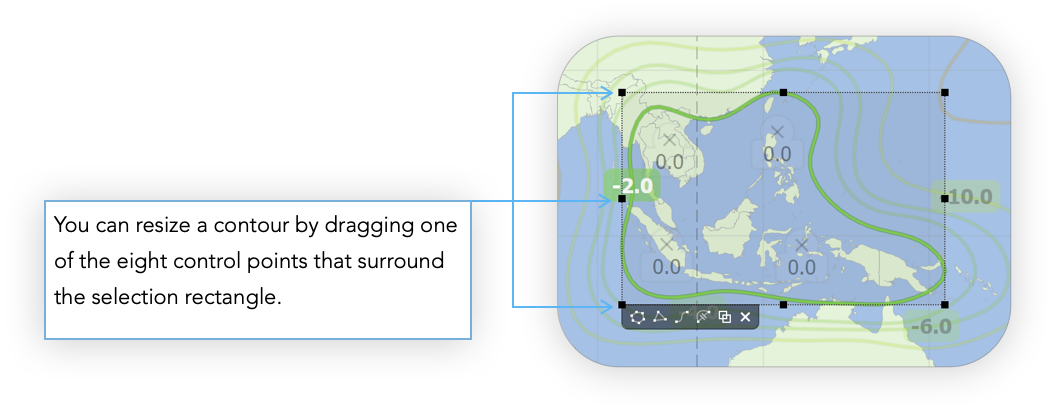
However, if your selection only contains contours then you’ll get all the options that are available to you when just a single contour is selected. This allows you make changes like smoothing or point reduction to several contours at once. You can also resize the selection when it only contains contours. All contours will size proportionally and maintain the same relative spacing from each another.
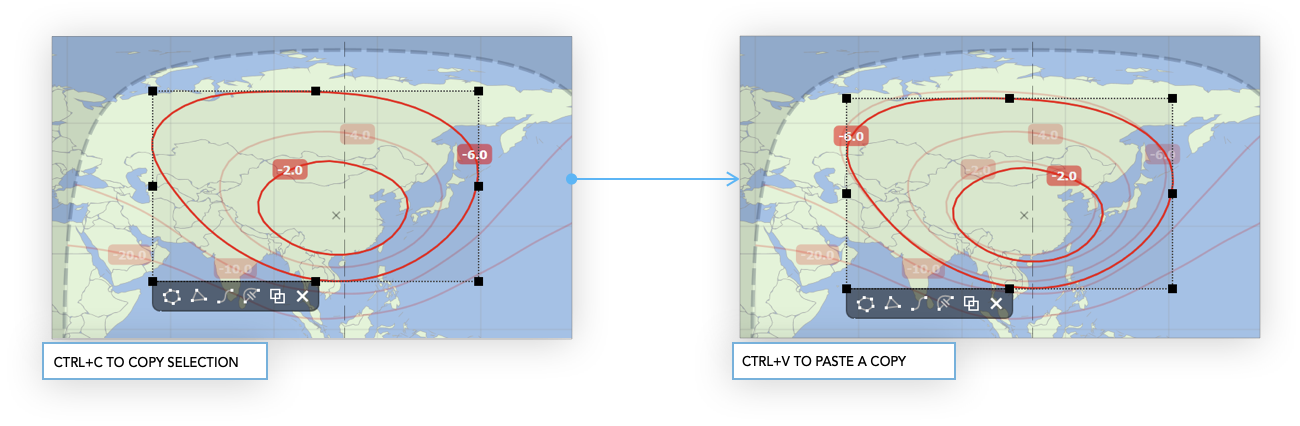
Copy and Paste
You can copy any selected contour or boresight, or any selected combination by using the standard keyboard shortcut CTRL+C. To paste the copied selection use the standard keyboard shortcut for paste, CTRL+V.
Display Options
There are several options for controlling the way that items are displayed. Click the Contour Colours button to choose one of eight built in colour schemes for displaying contours. Click on the map to finish.
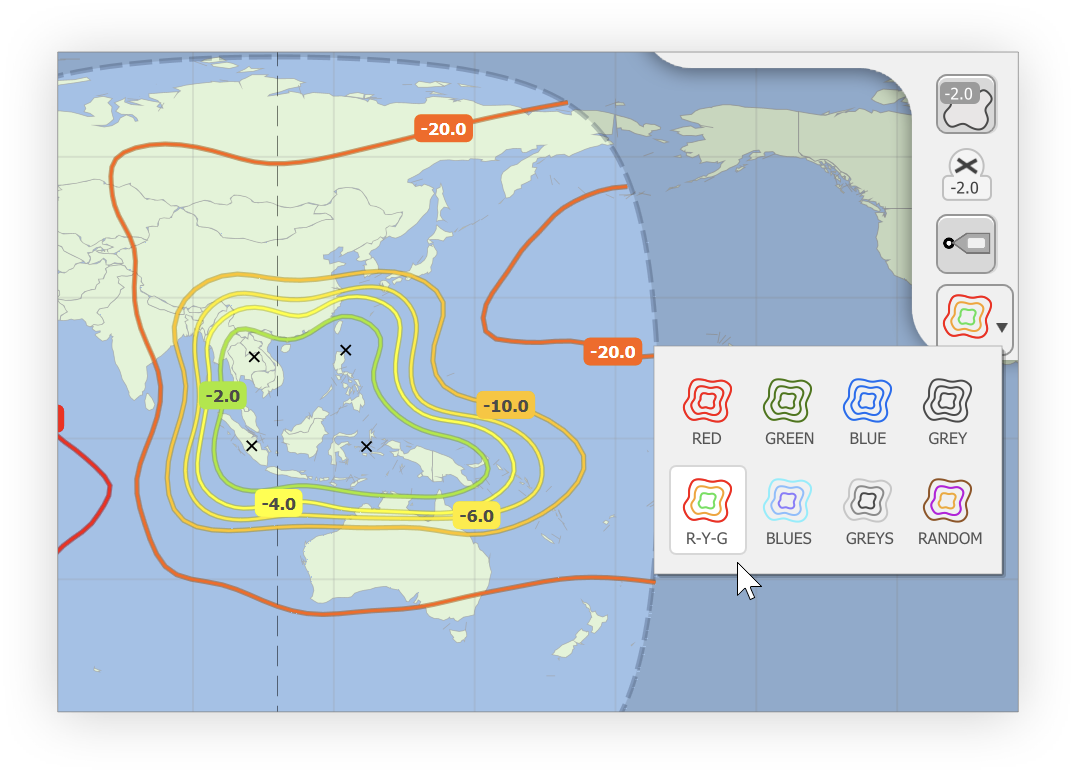
Contour and Boresight gain labels can be switched on and off independently.
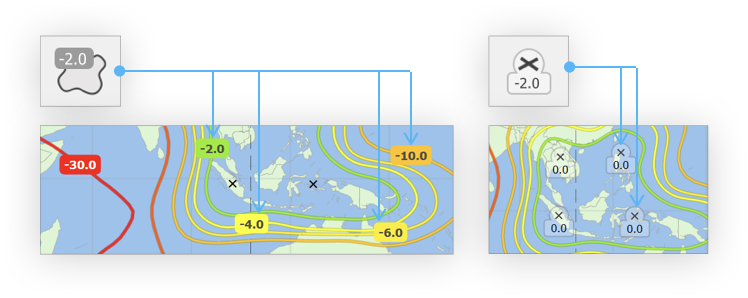
You can also hide contour point labels.
Saving Changes
When you’ve finished making changes to a shaped beam you can save it to GIMS .gxt format.
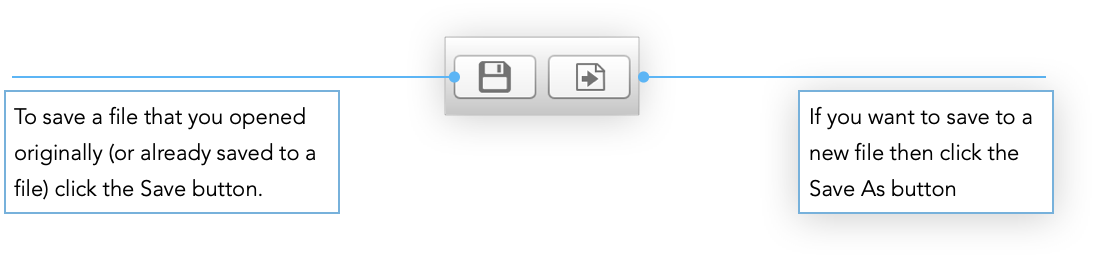
NOTE: Whilst the Shaped Beam Editor tool is available in the demo version, saving to .gxt file is disabled. You can still open and modify existing files and you can also create new ones, they just can’t be saved
Slot Finder
The Slot Finder (SF) is a separate tool for use in the design of new satellite networks. It can be used to locate the best orbital slot for a new satellite, one that will minimise the coordination process later down the line. All you need to do is define a network and a range of orbital slots.
For each slot, the software will calculate the number of co-frequency networks that would be within the coordination arc. The software also calculates the DT/T for each network and displays the number of networks that would fail to meet the 6% interference threshold.
For any given slot you can then go automatically to Visualyse GSO V3 and examine the interference in more detail.
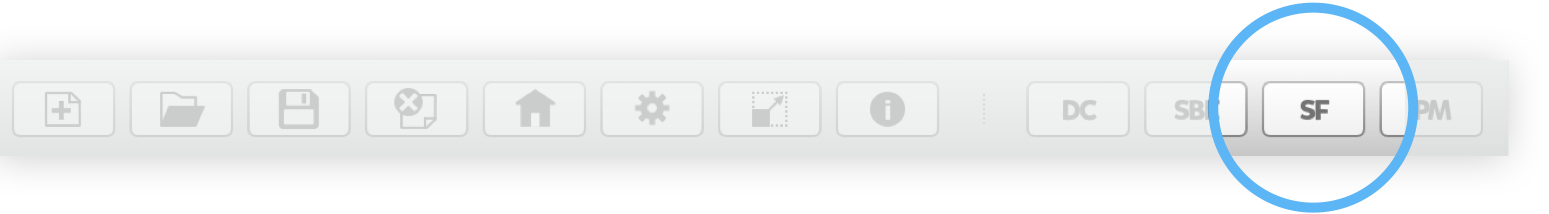
Launching
The Slot Finder is launched from Visualyse GSO V3 by clicking The SF button on the toolbar or by selecting Slot Finder from the Tools menu.
Alternatively, you can click your PC’s Start menu and select Slot Finder from the Visualyse GSO V3 program group
Defining the Analysis
When the Slot Finder starts for the first time you will see the Start Screen. This allows you to define your analysis.
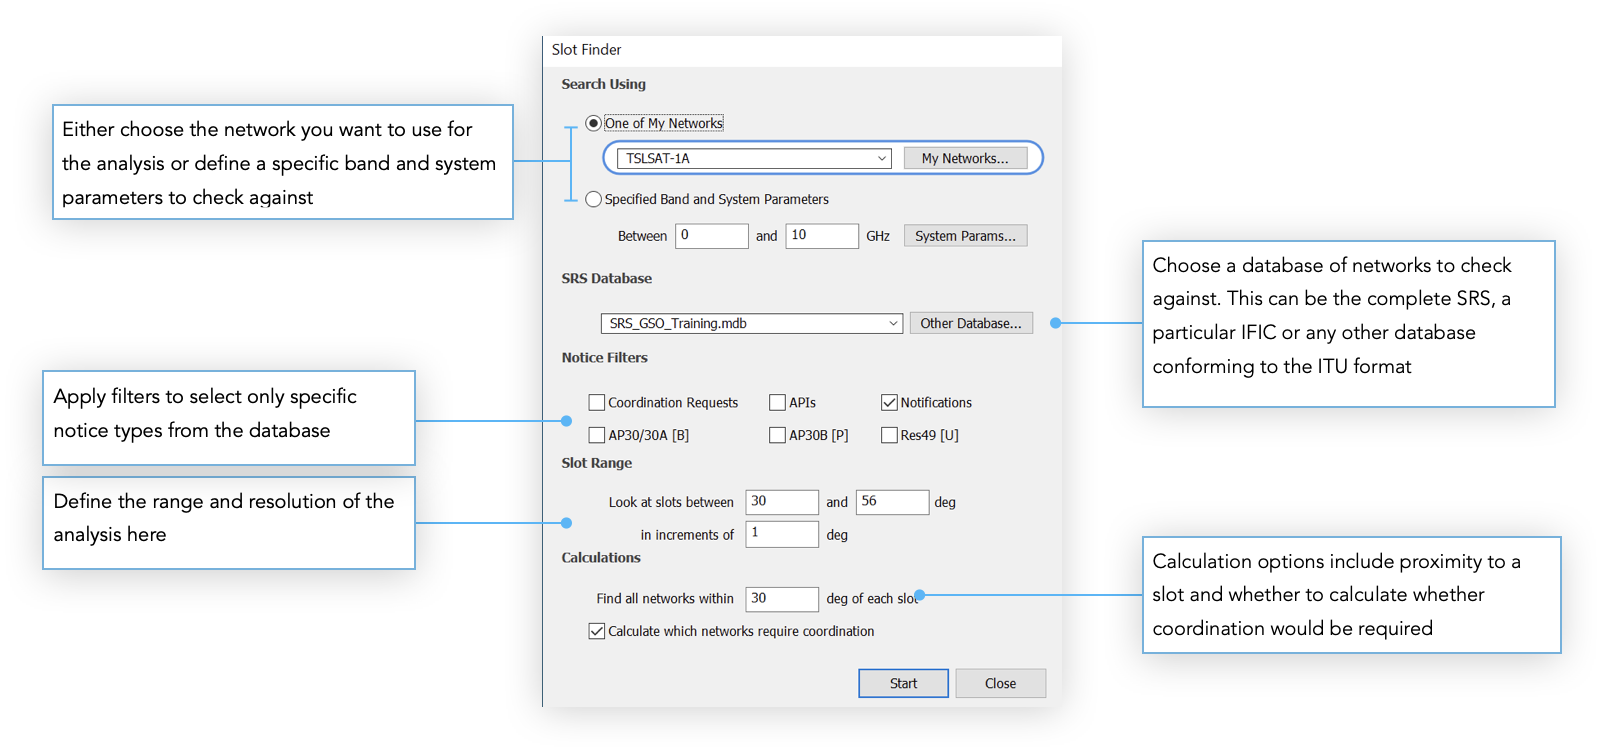
Search Network
If you have already defined a network or you know all the system parameters choose ‘One of My Networks’ then click on the currently selected network to choose a different one.
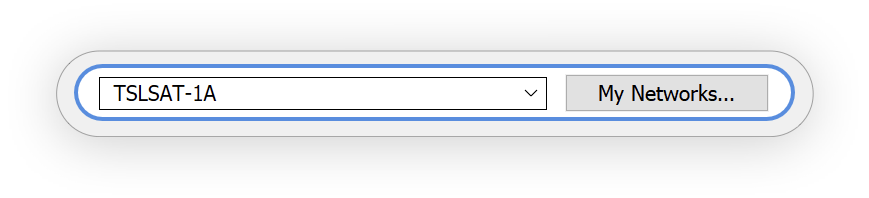
If you haven’t created any networks yet, click the My Networks button. The My Networks dialog will appear. This dialog is similar to the one in Visualyse GSO V3 and lists all the networks you have created.
Click Add to add a new network to the list, then click Edit. This will take you to the Network Editor (see the chapter on Defining a Network for information on how to use this).
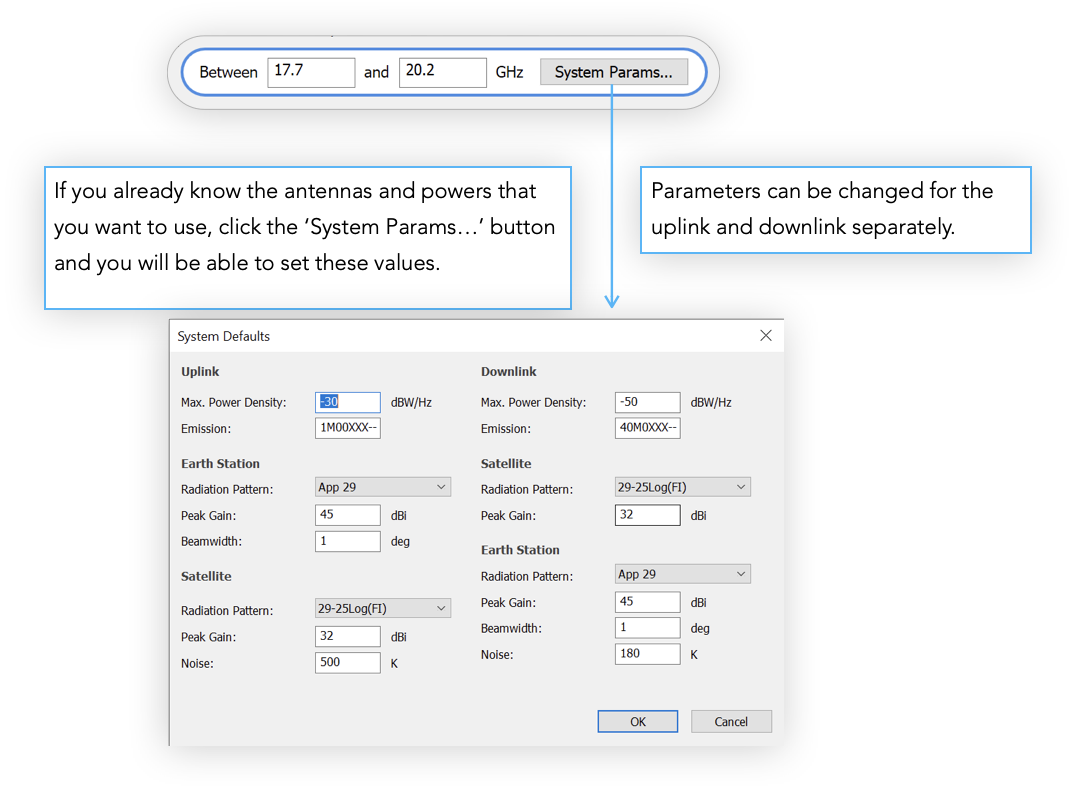
If you are at the early stages of design, you may only have a few system parameters. If this is the case, you can still use this information to perform an analysis. All you need is a frequency range. The software will use the system defaults for everything else.
To do this choose the ‘Specified Band and System Parameters’ option. Enter the frequency range
Database and Filters
Choose a database to search against. This can be the complete SRS or any other ITU format database containing networks. You can apply filters to select only specific notice types.
Slot Range
The slot range is defined by an upper and lower bound in degrees running eastward from the first longitude to the next. Longitudes West of zero degrees should be entered as negative values. Hence 30 deg West would be represented by a value of –30.
Calculations
You can define the coordination arc here. This will determine how many other networks are identified as being potential interferers. The Slot Finder will look at all networks within X degrees of a particular orbital slot where X is the size of the coordination arc that you are using.
Having determined the networks that may cause interference you can then say whether the actual interference is to be calculated. If you only want to see how many networks are within range then make sure that the Calculate box is not checked.
Once all the parameters have been filled in, click Start to begin the calculations.
Results
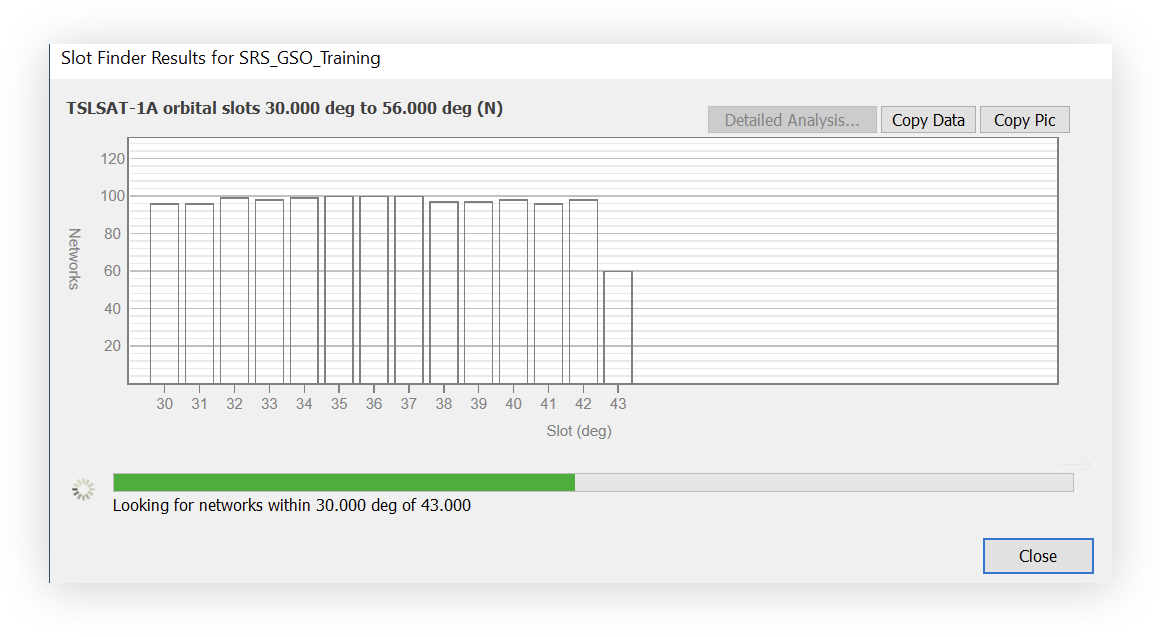
As soon as you click the start button the results will begin to be displayed. First the Slot Finder will calculate the number of networks that are within the coordination arc of each slot. You will see all this update in real time. The histogram bars will grow as new networks are added and the progress bar will extend.
Once all the networks have been identified, if you chose to calculate the interference this process will begin. The progress bar will reset and, just as before, the results will be updated as they are calculated. A red portion on a bar indicates a network that fails to meet the interference threshold. A grey portion represents a network that does meet the threshold.
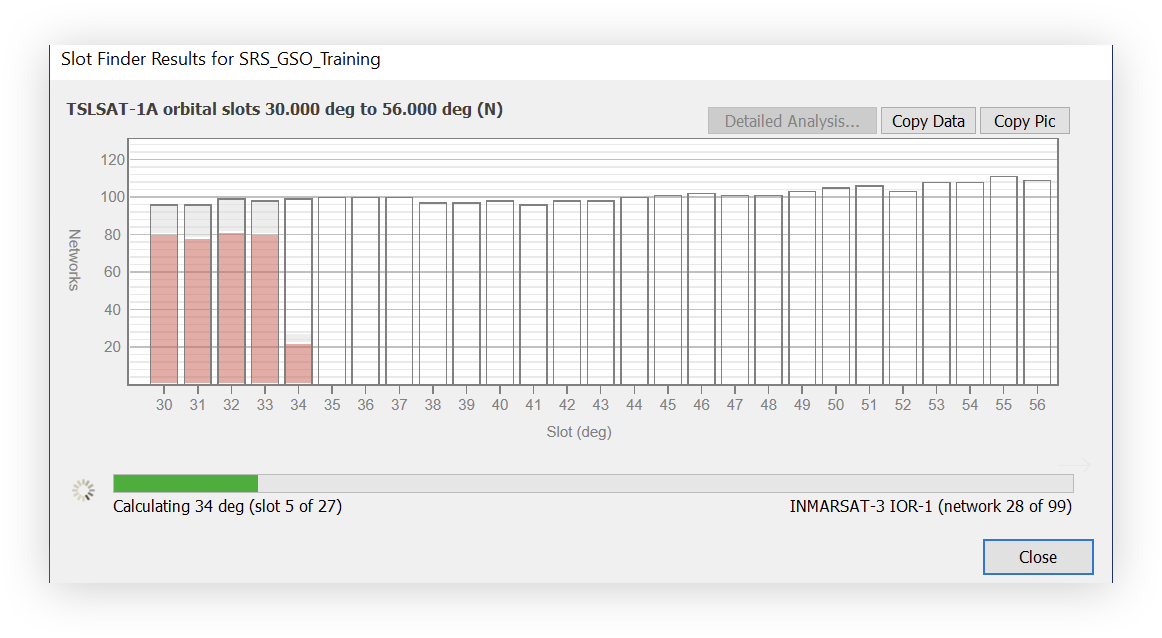
You can see from the image above that, part way through calculating the interference for the slot at 34 E, the Slot Finder has so far identified 20 bad networks and 8 good ones with 70 still to check.
When the calculations are complete the results can then be examined as a whole. Slots where less coordination is required can be identified visually. These slots can then be examined in more detail by double-clicking on them or by selecting them and clicking the Detailed Analysis button. This will take the complete analysis for this slot to Visualyse GSO V3.
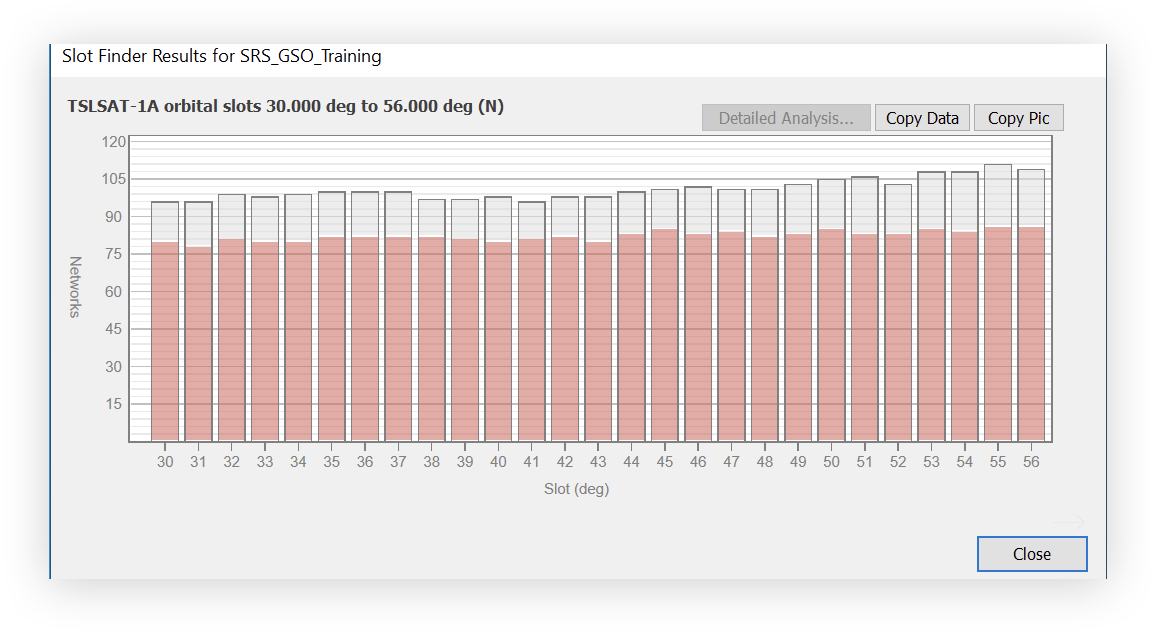
You can copy the chart data by clicking the Copy Data button. This can then be pasted into a spreadsheet like Microsoft Excel. You can also copy the chart as a picture by clicking the Copy Pic button
Priority Map
The Priority Map (PM) tool can be used to determine where one or more networks have regulatory priority over another set of networks. Priority is determined individually for each frequency band and polarisation.
The results can be used during the coordination process to try and get the best possible result for your systems during any negotiations. Having a clear picture of everybody’s assets is essential in these circumstances.
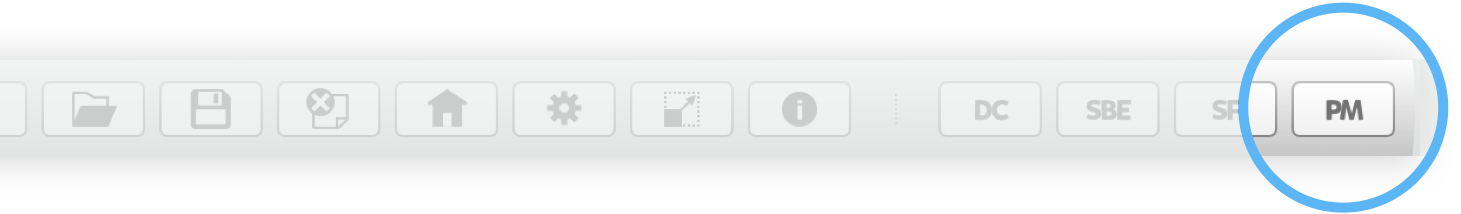
Launching
The Priority Map is launched from Visualyse GSO V3 by clicking the PM button on the toolbar or by selecting Priority Map from the Tools menu.
Alternatively, you can click your PC’s Start menu and select Priority Map from the Visualyse GSO V3 program group.
Defining the Analysis
When the Priority Map starts for the first time you will see the Main Screen.
You’ll notice this window looks exactly like the top part of the new coordination check dialog. It works exactly the same too, the purpose being to select two sets of networks to compare
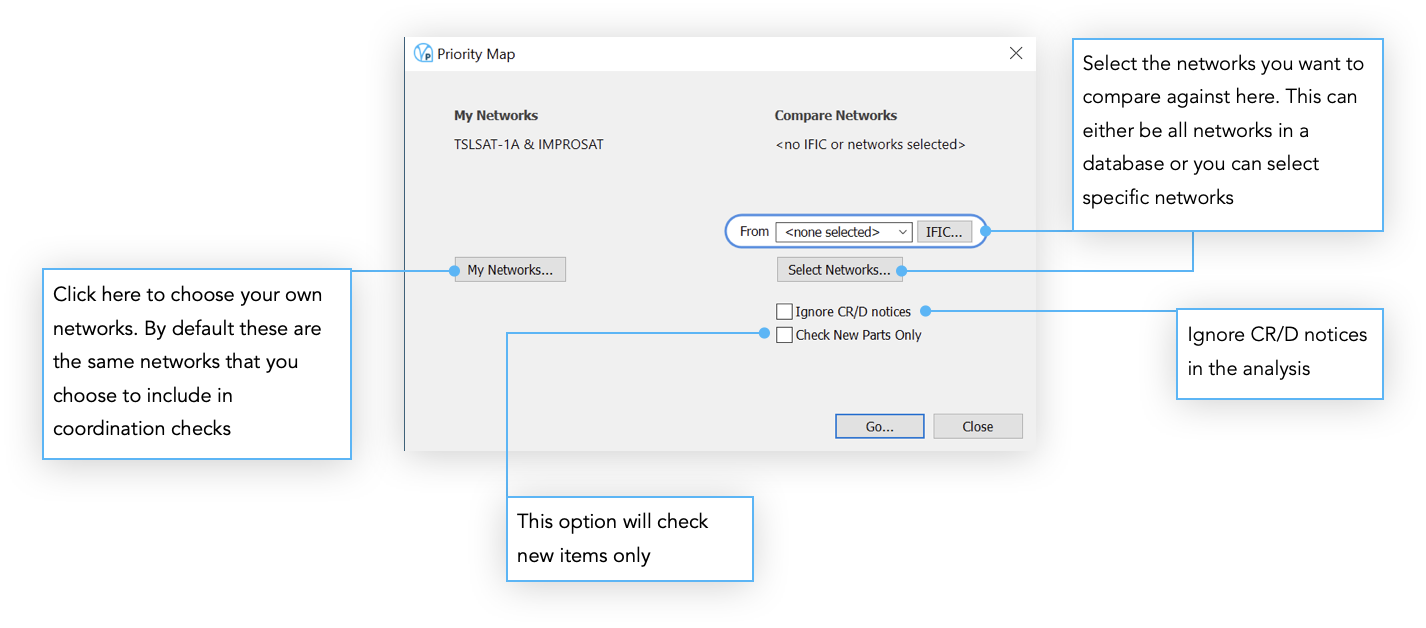
If you choose to select specific networks (by pressing the Select Networks button then the Select Networks dialog will appear. This allows you to hand pick a set of networks from one or more databases.
Results
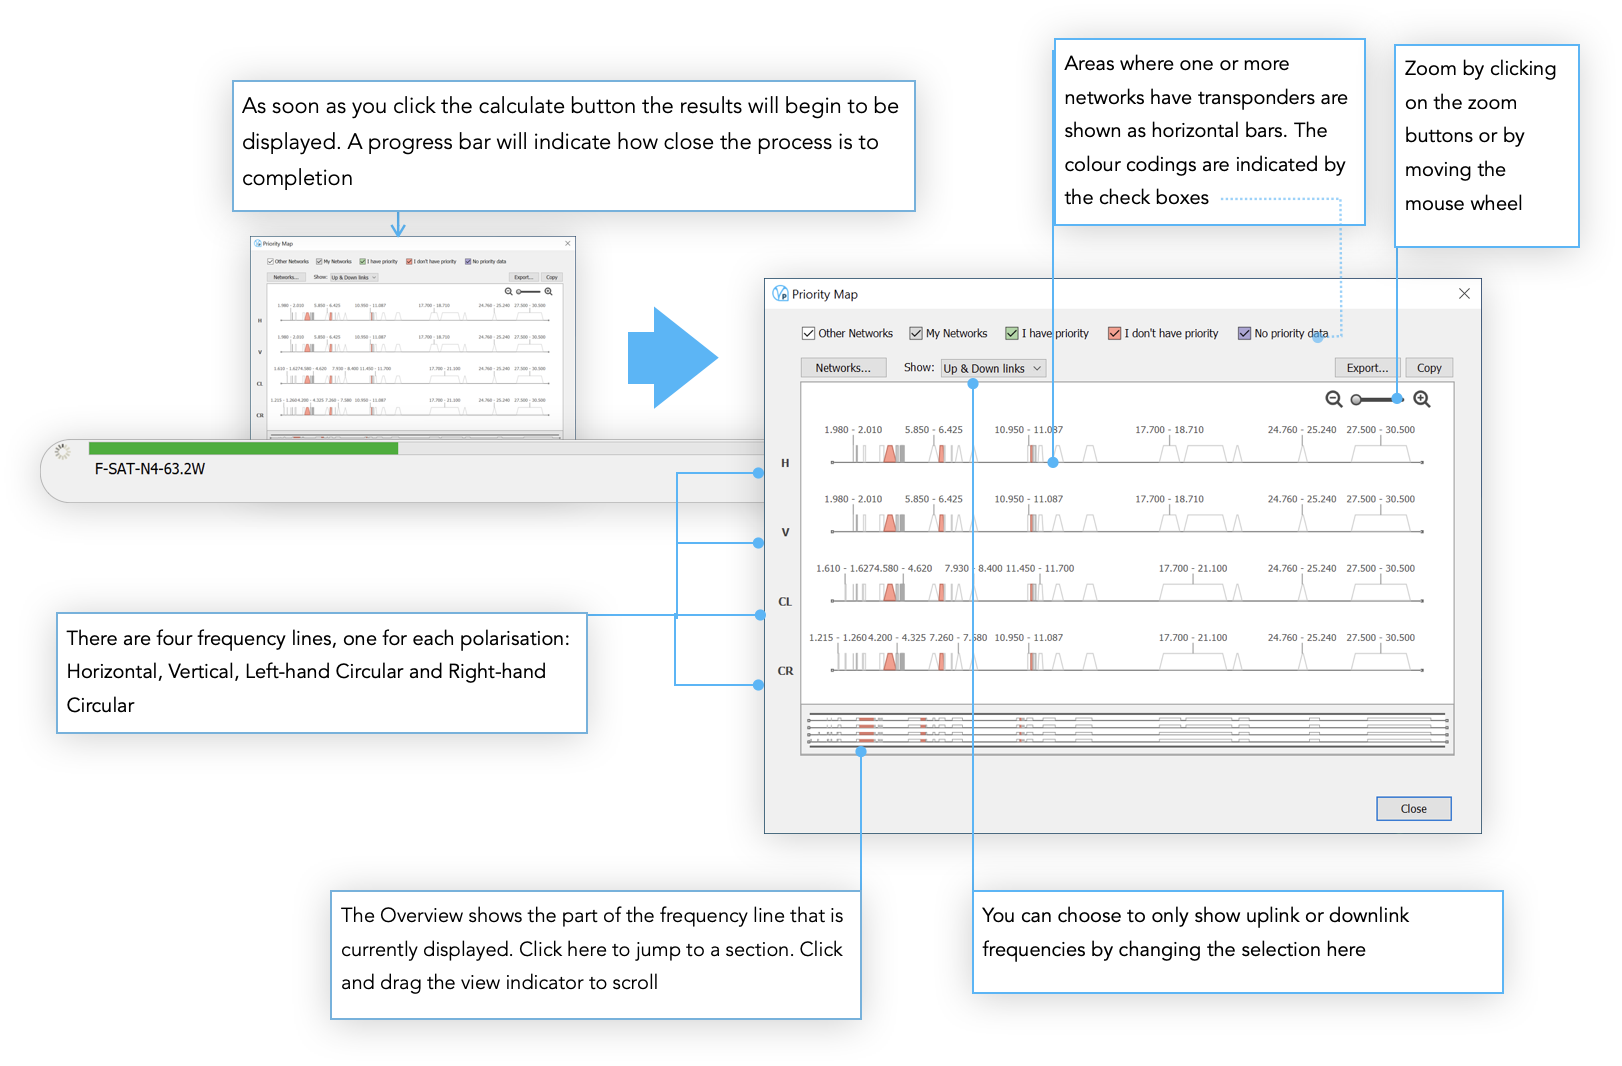
Areas where one or more networks have transponders are shown as horizontal bars. The bars are colour coded as follows:
White - only other networks operate here
Grey - only My Networks operate here
Green - My Networks and other networks operate here and My Networks have priority
Red - My Networks and other networks operate here but My Networks do not have priority
Blue - My Networks and other networks operate here but no priority data is supplied for either and so priority cannot be determined
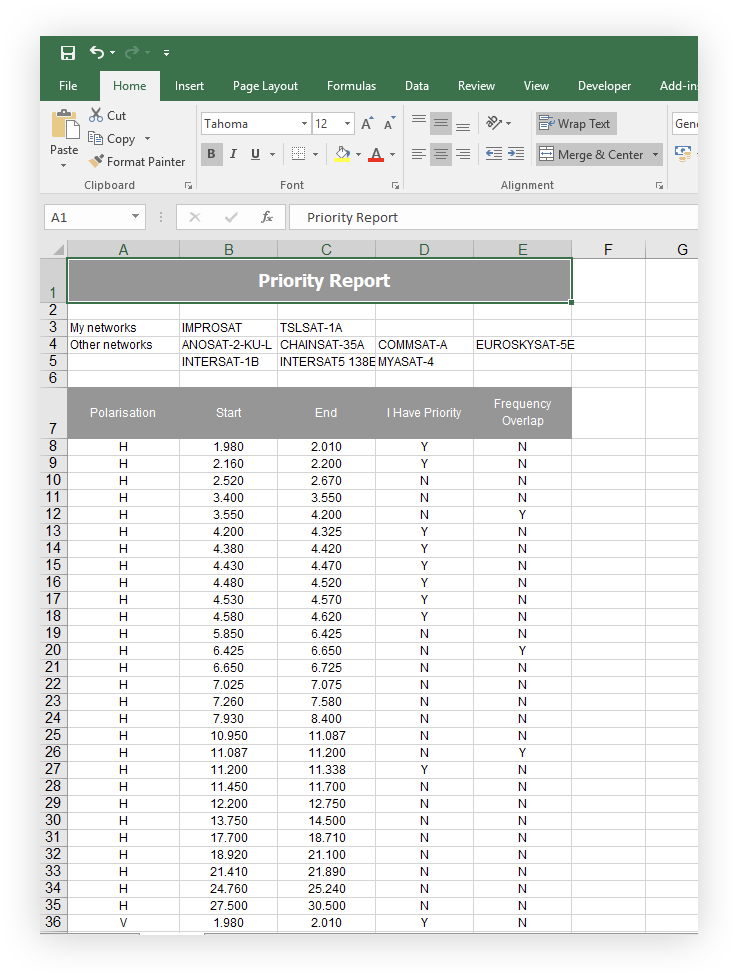
Outputs
If you click the Copy button, a picture of the visible contents of the main window will be copied to the clipboard. This can then be pasted into a report.
If you click the Export button, you can transfer the complete analysis to Microsoft Excel or a text file for further manipulation or analysis.
Keyboard Shortcuts
GSO
| Key | Description |
|---|---|
| CTRL +C | Copy pane |
| 1-6 | Maximise pane |
| 0 or ESC | Reset Maximise pane |
Detailed Coordination
| Key | Description |
|---|---|
| CTRL +C | Copy pane |
| 1-6 | Maximise pane |
| 0 or ESC | Reset Maximise pane |
CONSTRAINTS (DC)
| Key | Description |
|---|---|
| DELETE | Delete selected constraint |
| PGDN | Select last item in current grouping |
| CURSOR KEYS | Left and Right switch selection off or on |
| CURSOR KEYS | Up and Down moves between items |
MAP VIEW (DC & GSO)
| Key | Description |
|---|---|
| ESC | Cancel Area Analysis creation |
| CTRL + L | Toggle beam labels |
| CTRL + K | Toggle Area Analysis contour labels |
| CTRL + F | Show/hide satellite field of view |
| CTRL + B | Toggle show beam contours |
| CURSOR KEYS | Rotate globe |
| HOME | Reset view to default position |
| I | Zoom in |
| O | Zoom out |
| C | Start or finish creating Area Analysis |
| P | Set view position explicitly |
INTERFERENCE CASES (DC)
| Key | Description |
|---|---|
| PGUP | Select first item in current grouping |
| PGDN | Select last item in current grouping |
| CURSOR KEYS | Up and Down moves between items |
SHAPED BEAM EDITOR
| Key | Description |
|---|---|
| ESC | Cancel current operation or deselect |
| TAB | Select next point in contour |
| SHIFT + TAB | Select previous point in contour |
| CURSOR KEYS | Move selection |
| CURSOR KEYS + SHIFT | Move selection by larger amount |
| HOME | Reset view zoom and scroll position |
| DEL | Delete current selection |
| 0 | Reset zoom |
| 1 | Cycle through contour colour options |
| T | Smooth selected contour(s) |
| R | Reduce contour points |
| I | Insert intermediate points |
| CTRL + S | Save shaped beam |
| CTRL + D | Duplicate selection |
| CTRL + A | Select all |
| CTRL + C | Copy selection |
| CTRL + V | Paste |
| CTRL | Undo |
| CTRL + Y | Redo |
| CTRL | Zoom in |
| CTRL " | Zoom out |
Contact Information
TRANSFINITE SYSTEMS LTD
Suite 24 (5th Floor)
AMP House
Dingwall Road
Croydon, Surrey
CR0 2LX
United Kingdom
Phone: +44 (0)20 3904 3220
Fax: +44 (0)20 3904 3211
Email: info@transfinite.com
Web: www.transfinite.com
We Want To Hear From You
If you have any suggestions about this document or Visualyse GSO V3, please do not hesitate to contact us.
Disclaimer
Our products are constantly evolving and so features may change or be removed in the future. Contents of the demo version including system parameters might vary from those described in this document.
The supplied sample data may contain parameters that are unrealistic from an operational perspective. The sample IFIC and networks are provided only for the purpose of demonstrating the features of the software.
Technical Annex
APPLICATION OF APPENDIX 8 AND COORDINATION ARCS
The following excerpt is taken from a paper presented at the BR Seminar in Mexico 2001. It provides details of how the approaches to coordination triggering are (or should be) applied by Administrations.
For any new or modified GSO network the need for coordination exists with other 'existing' GSO networks which have already initiated the coordination process. For collecting information about the existing GSO networks and their technical parameters required, Administrations may check the CD-ROM on SRS (Space Radiocommunication Stations) for:
- all 'existing' GSOs under status (Coordination) or (Notification) having overlap with the frequency bands for the incoming satellite network.
- details of orbital position; service area; earth station geo-coordinates; space station, earth station transmitting and receiving antenna gain characteristics; transmission gains; Noise temperatures , and Precise frequency overlaps are established in either uplinks or downlinks.
Whether the process of coordination between the new and the "existing" GSO networks is necessary or not, may be determined by the following approach:
shall be calculated by treating the uplinks and downlinks of the wanted (or affected) satellite network, separately in accordance with the procedures mention in paragraphs 2.2.1.2 & 3.2 of Appendix 8.
The results can be categorised as follows:
- If the Value of or is greater than and the existing GSO network lies within the coordination arc, coordination with the incoming network is necessary.
- If the Value of or is greater than and the existing GSO network lies outside the coordination arc, the responsible administration for the existing network may request the BR for inclusion in the process of coordination with the incoming network.
The above approach works in those bands that have coordination arcs defined. For other bands, it is still, in theory, necessary to consider the frequency strapping information i.e. the way uplinks and downlinks are connected - and to look at the overall link performance. However, this is not considered necessary, and a separate comparison of the uplink and downlink DT/T to the 6% criterion is applied (see Section 2.2.1.2 for a discussion).
BASIC CALCULATIONS
This section describes the fundamental calculations that Visualyse GSO V3 performs when assessing whether coordination is needed between two networks.
The calculations are based on information taken from BR-IFIC and SRS databases, which is the method used to publish data submitted under Appendix 4 of the Radio Regulations.
Method
The basis of the method is that every radiocommunications link has inherent noise on it which can be expressed as a temperature value . Think of the noise as caused by electrons moving around and as the temperature rises the electrons become increasingly energized. Therefore a higher noise temperature means more noise on the link.
In analysis, the interference is characterised by calculating the rise in the noise temperature of the link that the interfering signal causes and comparing this with the noise temperature of the link without interference. The method is equivalent to looking the ratio of
The calculated value of is compared to a threshold criterion of . Values above act as a trigger for detailed analysis.
The basic calculation method, taken from Appendix 8 of the Radio Regulations, is given below.
Let be a satellite link of network associated with satellite and be a satellite link of network associated with satellite . The symbols relating to satellite link bear primes, those relating to satellite link do not bear primes.
The parameters are defined as follows:
the receiving system noise temperature of the space station, referred to the output of the receiving antenna of the satellite
the receiving system noise temperature of the earth station, referred to the output of the receiving antenna of the Earth station (K)
apparent increase in the receiving system noise temperature of the satellite , caused by an interfering emission, referred to the output of the receiving antenna of this satellite (K)
apparent increase in the receiving system noise temperature of the earth station , caused by an interfering emission, referred to the output of the receiving antenna of this Earth station (K)
maximum power density per delivered to the antenna of satellite (averaged over the worst band for a carrier frequency below or over the worst band above
transmitting antenna gain of satellite in the direction (numerical power ratio)
nA angle, from satellite , of the receiving earth station of satellite link
angle, from satellite , of the receiving earth station of satellite link
maximum power density per delivered to the antenna of the transmitting earth station (averaged over the worst band for a carrier frequency below or over the worst band above (W/Hz) angle, from satellite , of the transmitting earth station of satellite link
angle, from satellite , of the transmitting earth station of satellite link
topocentric angular separation in degrees between the two satellites
geocentric angular separation in degrees between the two satellites, taking the longitudinal station-keeping tolerances into account
transmitting antenna gain of the earth station in the direction of satellite (numerical power ratio)
receiving antenna gain of the earth station in the direction of satellite (numerical power ratio)
k Boltzmann's constant
free-space transmission loss on the downlink (numerical power ratio), evaluated from satellite to the receiving earth station for satellite link
Iu free-space transmission loss on the uplink (numerical power ratio), evaluated from the earth station , to satellite for satellite link
Based on the above parameters the uplink and downlink are given by:
WORST CASE CALCULATION
When assessing a value for a specific overlap, it is important that we are sure to be looking at the worst case that can occur for that overlap.
The worst case can be influenced by geometric and RF factors.
For each frequency assignment within a network filing there are often associated multiple carrier parameters and power levels. In other places, you may see reference to Most Sensitive Most Interfering (MSMI) analysis. The idea is that you find the wanted assignment with the lowest value of , and the interfering carrier with the highest EIRP density. This pair is then assumed to produce the largest value.
In Visualyse GSO V3, for each overlap all possible values of are calculated for all possible pairs and the highest value is displayed. This eliminates the need for MSMI analysis.
In combination with assumptions about worst case geometry', this produces a better estimate of the highest that might be found.
SEPARATE UPLINK AND DOWNLINK CALCULATIONS
The methods of Appendix 8 and Recommendation ITU-R S. 738 are based on the premise that uplinks and downlinks are combined and that DT/T calculations for the overall link take this into account.
This requirement has lead to a proliferation of data required for the analysis - the so-called strapping tables.
Each strapping i.e. each possible pair of uplinks and downlinks has an associated parameter called the processing gain, and noise on the uplink is propagated through to the downlink.
1 Visualyse GSO V3 assumes that the topocentric angle times geocentric angle as per Recommendation ITU-R S. 728
The requirement to link the uplink and downlink for "simple frequency-changing transponders" results in a large number of permutations in the filing and in a large amount of review work for the BR.
Many proposals have been made to eliminate the need for this strapping information and to treat uplinks and downlinks separately in all cases.
This is what is implemented in Visualyse GSO V3. It can be shown that this separate treatment of uplinks and downlinks has little impact on the effectiveness of the coordination process, whilst greatly simplifying the filing and the data analysis.
In particular, it can be shown that separately comparing uplink and downlink values against the criterion will identify all the necessary cases for coordination just as thoroughly as comparisons done with the for each uplink and downlink combination.
In some cases, calculations using only separate uplink and downlink parameters may cause networks to be brought into the coordination process that would not be included on the basis of the combined link calculations. However, the extra analysis is not too much of burden when compared to the simplification it brings.
A study by the BR has indicated that:
"Treatment of uplinks & downlinks separately for calculating increases by about 5-6%, the number of administrations involved in coordination and by about the number of networks involved in coordination. Number of networks omitted, when compared to the overall approach, is marginal."
Coordination Arcs
Coordination Arcs are an attempt to simplify the coordination triggering process. The idea is that spatial separation of the satellites can provide sufficient advantage to ensure that no interference will be seen. Therefore coordination is triggered if two systems operate via satellites that are within a predefined orbital separation.
WRC-2000 implemented a coordination-arc approach to replace the Appendix 8 (∆T/T) coordination threshold, in certain frequency bands. The coordination-arc approach affects the 6/4, 14/11, and 30/20 GHz “commercial” satellite bands.
The coordination arcs are shown in the table
It remains possible to call for coordination with systems outside these arcs, provided you can demonstrate by calculation that the DT/T values due to a new network exceeds the 6% trigger.
A co-frequency GSO FSS satellite network within the coordination arc may also be excluded from the coordination when the increase in system noise to the network is less than 6%.
Visualyse GSO V3 can be used to check which systems are within the coordination arc relevant to the frequency band in question.
| CASE | BANDS (MHz) | ARC | |
|---|---|---|---|
| 1 | 3400 - 4200 5725 - 5850 5850 - 6725 7025 - 7075 | (Region 1) | |
| 2 | 10950 - 11200 11450 - 11700 11700 - 12200 12200 - 12500 12500 - 12750 12700 - 12750 13750 - 14800 14500 - 14800 | (Region 2) (Region 3) (Regions 1 & 3) (Region 2) SRS or FSS | |
| 2bis | 13400 - 13650 | SRS | |
| 3 | 17700 - 20200 17300 - 20200 27500 - 30000 | (Regions 2 & 3) (Region 1) | |
| 3bis | 19700 - 20200 29500 - 30000 | ||
| 4 | 17300 - 17700 | (Regions 1 & 2) | |
| 5 | 17700 - 17800 | ||
| 6 | 18000 - 18300 18100 - 18400 | (Region 2) (Regions 1 & 3) | |
| 6bis | 21400 - 22000 | (Regions 1 & 3) | |
| 7 | 17300 and above | except those in (3) and (6) for FSS-FSS only | |
| 8 | 17300 and above | except those in (4), (5) and (6bis) and for non FSS-FSS only | |
| - | 13400 - 13650 | in Region1 as indicated in Article 5.499A for SRS |
Acronyms and Abbreviations
| Acronym / Abbreviation | Description |
|---|---|
| BR | Radio Communication Bureau (of the ITU) |
| CR | Coordination Request |
| DC | Detailed Coordination |
| e.i.r.p. | Equivalent Isotropic Radiated Power |
| GSO | Geostationary Orbit |
| IFIC | International Frequency Information Circular |
| ITU | International Telecommunication Union |
| PC | Personal Computer |
| PM | Priority Map |
| SBE | Shaped Beam Editor |
| SF | Slot Finder |
| SNS | Space Network System |
| SRS | Space Radio Communication Stations |
Visualyse GSO Maintenance History
This document describes the changes that have been made to Visualyse GSO for each maintenance release. If an existing feature has been modified, or a new feature has been added, information on how to use it can be found in the online user guide. To access this, select User Guide from the Help menu within the application.
Release 3.0.8.2 (June/2026)
The following changes have been made:
- Update CodeMeter drivers to 8.40d.
- Add "dismiss all" button to Notifications View.
- Ensure Notifications View sizes correctly.
- Update map data to latest version from IDWM.
- Update to fix a possible rendering issue on checkboxes at 200% scaling.
- Revise error message when connection is lost to CmContainer.
Release 3.0.8.1 (September/2025)
The following changes have been made:
- Fix issue where application Mainframe doesn’t update when licence status changes.
Release 3.0.8.0 (August/2025)
The following changes have been made:
- Add new licencing options.
Release 3.0.7.0 (May/2025)
The following changes have been made:
- Restore support for Windows 8.1/Server 2012 R2.
- Ensure My Networks has the latest ant_types.
- Add more standard and non-standard Antenna Patterns
- Add new dialog to display Antenna Patterns.
- Fixed error causing DC to crash, due to sorting frequency data for groups that have no data in the assgn table in the SRS.
- Added tooltips for items in List Ctrl that are too large
Release 3.0.6.0 (January/2025)
The following changes have been made:
- Add support for v10 SRS databases only
- Upgrade internal database to v10 format. Please note: that due to the nature of this change we advise, where possible, for you to delete then re-import your Networks into “My Networks”.
- Visualyse GSO no longer runs on Windows 7. Further details can be found here: https://www.transfinite.com/content/VisualyseGSOWindows7
It is recommended all users install the latest DK2 device drivers (V8.28.33) from https://www.transfinite.com/content/dongledriverinstall_V8_28_33
Release 3.0.5.5 (December/2024)
The following changes have been made:
- Warn that SRS v10 databases aren’t (currently) supported.
Release 3.0.5.4 (September/2024)
The following changes have been made:
- Fix possible U.I redraw issues on some DPI settings.
Release 3.0.5.3 (May/2024)
The following changes have been made:
- Fix issue with C/I Threshold radio buttons on Settings and Defaults dialog.
Release 3.0.5.2 (May/2024)
The following changes have been made:
- Increase number of D.P used in Overlap List / Coordination Trigger if required.
Release 3.0.5.1 (April/2024)
The following changes have been made:
- Fix issue where a file is loaded that hasn’t completed the analysis and the DB is no longer available.
- Add entry in Help menu for new online User Guide.
Release 3.0.5.0 (April/2024)
The following changes have been made:
- Fix issue where ShapedBm would complain if RefDB was setup.
- Re-init GIMS/ShapedBm if the user changes GIMS DB.
Release 3.0.4.9 (March/2024)
The following changes have been made:
- Add extra error checking for GIMS setup.
Release 3.0.4.8 (March/2024)
The following changes have been made:
- Add a setting to allow the user to specify the ITU GIMS Reference Database to use.
Release 3.0.4.7 (February/2024)
The following changes have been made:
- By default, order the My Networks list by name.
- Remember sort order on My Networks when adding/importing or duplicating networks.
- Fix issue where network added to My Networks then instantly deleted -> list not being updated.
Release 3.0.4.6 (February/2024)
The following changes have been made:
- Fix possible startup issue on x64 version when database drivers aren’t installed.
Release 3.0.4.5 (February/2024)
The following changes have been made:
- Fix possible locale issue with GXT files.
- Revise Lat/Long format to be 3.4 when exporting GXT files.
- Ensure COHeader information is preserved when doing import then export of GXT files.
Release 3.0.4.4 (January/2024)
The following changes have been made:
- Fix possible drawing issue with Overlap Diagram.
Release 3.0.4.3 (January/2024)
The following changes have been made:
- Fix possible issue with losing connection to DK2 Network Server when PC goes to sleep.
- Handle DK2 HID devices.
- Add sorting to the My Networks dialog.
- Add ntf_rsn to My Networks dialog.
- Allow the My Networks dialog to be resized.
- Fix DPI issue on the Coordination Check progress dialog.
- If there’s an error importing a network, then rollback (delete) any partial DB changes.
- Fix cursor issue on Detailed Coordination Calculations window.
Release 3.0.4.2 (November/2023)
The following changes have been made:
- Fix scrolling on Select Networks Filter Box.
- Add mouse scroll to Select Networks Filter Box.
Release 3.0.4.1 (October/2023)
The following changes have been made:
- Check software licence status before attempting any database migration actions.
- Improve GIMS error handling dialog with clickable link to PDF with steps to connect Visualyse GSO to GIMS.
Release 3.0.4.0 (July/2023)
The following changes have been made:
- Allow Non-GSO networks to be added to “My Networks”.
- Alter “Select Networks” dialog to allow filtering on GSO and Non-GSO.
- Add option to remember filters used in “Select Networks” dialog.
- Upgrade internal database to V9.1 format. Please note: that due to the nature of this change we advise, where possible, for you to delete then re-import your Networks into “My Networks”.
- Show ntf_rsn when presenting a list of networks in a dialog.
- Add Notice Type (GSO/NGSO) to Trigger view.
- Network List: Add Notice ID/Type to Edit/Copy.
- Revise Network List Edit/Copy for Non-GSO.
- Upgrade reports to .docx format.
- Add Notice Type (GSO/NGSO) to reports.
- Fix issue in Detailed Coordination when adding then removing various filters.
- Revise splitter handling at startup.
- Revise network filtering logic in some scenarios.
Release 3.0.3.10 (July/2023)
The following changes have been made:
- Revise install program.
Release 3.0.3.9 (July/2023)
The following changes have been made:
- Improve GIMS error handling.
Release 3.0.3.8 (June/2023)
The following changes have been made:
- Update installed DK2 DLL.
It is recommended all users install the latest DK2 device drivers (V8.22.26) from https://www.transfinite.com/content/dongledriverinstall_V8_22_26
Release 3.0.3.7 (April/2023)
The following changes have been made:
- Fix Export issue.
Release 3.0.3.6 (February/2023)
The following changes have been made:
- Add new Setting: "Show Update Dialog at Startup" so user can be informed of new version via Notifications only.
- Add Notification for possible screen resolution issues.
- Fix possible issues refreshing Notification List.
Release 3.0.3.5 (February/2023)
The following changes have been made:
- Fix possible issues importing from SRS V9.1 databases into My Networks.
Release 3.0.3.4 (November/2022)
The following changes have been made:
- Allow import from SRS V9.1 databases.
It is recommended all users install the latest DK2 device drivers (V8.20.21) from https://www.transfinite.com/content/dongledriverinstall
Release 3.0.3.3 (November/2022)
The following changes have been made:
- Improve warning message when GIMS fails to open reference database.
- Catch error when SRS hasn’t been linked correctly.
- Warn that SRS V9.1 (beta) databases aren’t (currently) supported.
- Fix display issue for NGSO coordination checks.
- Fix DPI issues on Coordination Check dialog.
Release 3.0.3.2 (October/2022)
The following changes have been made:
- Fix version info display on Notifications View.
Release 3.0.3.1 (October/2022)
The following changes have been made:
- Fix possible display issue when “Display All” button is toggled from On to Off.
- Fix units display issue in Constraints View in Detailed Coordination.
- Performance improvements.
Release 3.0.3.0 (July/2022)
The following changes have been made:
- Add a search bar to the Application Title bar. This allows users to search the menu options.
- Add a notification icon to the Application Title Bar. This displays a badge with the number of notifications. Clicking displays the Notifications View. At present this is used to display general application information (new software updates, DK2 driver updates etc).
- Implemented Windows 11 Snap Layout. When the program is running on Windows 11 and the maximize/restore caption button is hovered, the layout popup menu will appear near this button.
- Update installed DK2 DLL.
Release 3.0.2.9 (January/2022)
The following changes have been made:
- Improve scaling of UI components for Windows 10/11 scale factors of 125%, 175%, 225%
Release 3.0.2.8 (August/2021)
The following changes have been made:
- Install latest DK2 DLL.
- Display DK2 driver version on About dialog.
It is recommended all users install the latest DK2 device drivers (V8.19.7) from https://www.transfinite.com/content/dongledriverinstall
Release 3.0.2.7 (March/2021)
The following changes have been made:
- Install newer DK2 DLL.
Release 3.0.2.6 (March/2021)
The following changes have been made:
- Fix SQL error when using a specific set of Select Network filters.
Release 3.0.2.5 (February/2021)
The following changes have been made:
- Add “Display All” button to Interference Cases view in DC to toggle the display of All/Worst case. By default ALL cases are shown.
- Resolve display issue with displaying values to high number of decimal places.
Release 3.0.2.4 (January/2021)
The following changes have been made:
- Revise GIMS error message to reference V13
- Improve compatibility with APL.
- Ensure all dialogs use same font.
- When importing trim spurious whitespace.
- Fix possible display issue in GSO coordination check.
- Give more error information in event of issues in Edit Network dialog.
- Fix possible issue saving srv_cls information in Edit Network dialog.
- Export in V9 format.
- Fix typos on Priority Map dialog.
- Resolve issue invoking Priority Map following a coordination check.
Release 3.0.2.3 (June/2020)
The following changes have been made:
- Fix issue with loaded files in Visualyse GSO losing the selected item.
- Rename “Carriers” in Detailed Coordination to “Emissions” to better reflect the SRS table the data maps to.
- Show AMS date in long format to avoid day/month confusion.
Release 3.0.2.2 (April/2020)
The following changes have been made:
- Fix issue displaying the Edit Network dialog when invoked from Slot Finder / Priority Map.
- Change button labels to “Save” / “Close” on Edit Network dialog to make their actions clearer.
- Make the default button on the “Edit Network” dialog “Close”.
- Add confirmation dialog when pressing “Save” on Edit Network dialog.
Release 3.0.2.1 (April/2020)
The following changes have been made:
- Fix issue with the Edit Network dialog that could possibly corrupt the C/N value in the database.
We advise customers delete then re-import their data into “My Networks” after installing this version.
Release 3.0.2.0 (April/2020)
The following changes have been made:
- Add missing section headers to the Settings and Defaults dialog.
Service Area Contours
Visualyse GSO can now extract Service Area contours from GIMS and display them via the “SA” button.
Release 3.0.1.0 (February/2020)
The following changes have been made:
- Add post WRC 2019 3bis coordination arc.
- Add sort by LONGITUDE option to the Network List.
- Improve the default sample data in My Networks / Sample IFIC.
- Improve dialog feedback when deleting many items from My Networks.
- Fix possible crash in Detailed Coordination.
- Resolve possible copy operation failure in Slot Finder.
- Show c_to_n value on Edit Network dialog.
Visualyse GSO x64
Visualyse GSO is now available in a 64-bit version. This can be useful in scenarios where the existing 32-bit version used a lot of RAM when performing the analysis. Note: a working installation of the x64 Access Database Engine is required to use this version.
Release 3.0.0.81 (January/2020)
The following changes have been made:
- Shaped Beam Editor can have redraw issues on some graphics cards.
- Better handle scenario where user accidentally removes/renames/moves My Networks database.
- Improve display of long entries in Import IFIC dialog.
- Be less strict when validating a GXT file that has a missing ntc_id value.
- Better abbreviate the display of large values.
- On clean installs setup better default directories for various dialogs.
Release 3.0.0.80 (January/2020)
The following changes have been made:
- Shaped Beam Editor can crash if resized to a very small size.
- Handle GXT import errors better.
- Detailed Coordination can fail to update 3D View correctly after editing boresight location
- Ensure all ES cases are displayed in Detailed Coordination.
- Fix potential Import error when source Network has a large number of entries in the grp table.
- Resolve bug when doing a Coordination Check using networks from different databases.
Release 3.0.0.79 (December/2019)
The following changes have been made:
- Fix issue loading GXT files in Detailed Coordination.
Release 3.0.0.78 (December/2019)
The following changes have been made:
- Revise number of decimal places used for display of frequency and ES location.
- Fix issue when using filters in certain locales.
Release 3.0.0.77 (December/2019)
The following changes have been made:
- Fix possible resource leak in Shaped Beam Editor when using PC that uses software rendering (rather than the GPU).
- Resolve possible issue with software when running on an (unpatched) version of Windows 7 SP1.
- Fix possible crash when GIMS is not installed correctly.
Release 3.0.0.76 (November/2019)
The following changes have been made:
- Fix possible issue adding new networks to “My Networks”
Release 3.0.0.75 (November/2019)
The following changes have been made:
- If SHIFT is pressed when selecting an item to expand/collapse in the Overlap List it will apply the action to ALL items at that level.
- Modify the Frequency | Is in the range filter to match the SpaceQry one.
- Add missing high DPI cursors.
- Update images used in installer for high DPI.
Release 3.0.0.74 (November/2019)
The following changes have been made:
- Ensure the CoordinationTrigger window is completely cleared when switching the selected item.
- Improve the display of the filename when loading a Detailed Coordination file.
- Improve performance when switching selected items/closing a file.
- Use better cursors for high DPI displays.
Release 3.0.0.73 (August/2019)
The following changes have been made:
- Handle case where nat_srv in the srv_cls table is NULL.
Release 3.0.0.72 (July/2019)
The following changes have been made:
- Fix problems with display of priority dates and polarisation on the overlap diagram
Release 3.0.0.71 (July/2019)
The following changes have been made:
- Fix potential crash when displaying non-GSO data.
- Improve display of data in Overlap List when non-GSO.
Release 3.0.0.70 (June/2019)
The following changes have been made:
- Thresholds based on Class can fail to load correctly from a saved file.
- BR Publication data can fail to be displayed when loading from a saved file.
- Add option to the New Coordination Check dialog to make explicit when Non-GSO are included in the check.
Release 3.0.0.69 (June/2019)
The following changes have been made:
- Edit | Copy can fail in some circumstance when copying from the Network List.
Release 3.0.0.68 (June/2019)
The following changes have been made:
- Prompt user for save location if the reports can’t be written to “My Documents”
- Revise GIMS error message to reference V12.
Release 3.0.0.67 (May/2019)
The following changes have been made:
- Fix possible issue when Exporting from My Networks dialog.
- Revise location of Word/Excel template documents to handle scenario where user has limited access to C:\Program Files (x86)\VisualyseGSOV3
Release 3.0.0.66 (March/2019)
The following changes have been made:
- Add better feedback when interacting with large networks in My Networks dialog.
- Improve performance when editing/importing large networks.
Release 3.0.0.65 (March/2019)
The following changes have been made:
- Improve algorithm for spacing/size of labels in Shaped Beam Editor.
- Improve GSO V2 windows sizing/position interoperability.
- Minor performance improvements.
Release 3.0.0.64 (March/2019)
The following changes have been made:
- Allow Bandwidth Adjustment to be edited / constrained in DC.
Release 3.0.0.63 (January/2019)
The following changes have been made:
- Performance improvements
Release 3.0.0.62 (September/2018)
The following changes have been made:
- Handle error conditions better when SRS/IFIC has corruptions.
- Removed 'one-click' from text on My Networks dialogs.
- Widen the column for showing case counts in DC.
- Filtering out of CtoIs when populating the cases list wasn’t working as expected in DC.
- Ensure that all interfering ES are represented in downlink cases in DC,
- Make first point in area analysis more obvious during creation phase.
- Minor change to delete feedback for AA points.
- Allow editing of Power Density in calculations pane in DC.
- Show boresight location in calculations pane and allow it to be edited.
Release 3.0.0.61 (August/2018)
The following changes have been made:
- Fix potential memory issues in Slot Finder.
- Issues importing networks in My Networks dialog in Slot Finder
Release 3.0.0.60 (June/2018)
This was the first Release of the software.