Coordination Check
The Coordination Check is one of the main features of Visualyse GSO V3. It is used to determine whether coordination is required, based upon one of two forms of coordination trigger:
- DT/T - using a threshold, typically 6%
- Coordination Arc - using a maximum orbital separation
Starting a Coordination Check
To start a coordination check click New Coordination Check on the start screen.

The New Coordination Check dialog will appear:
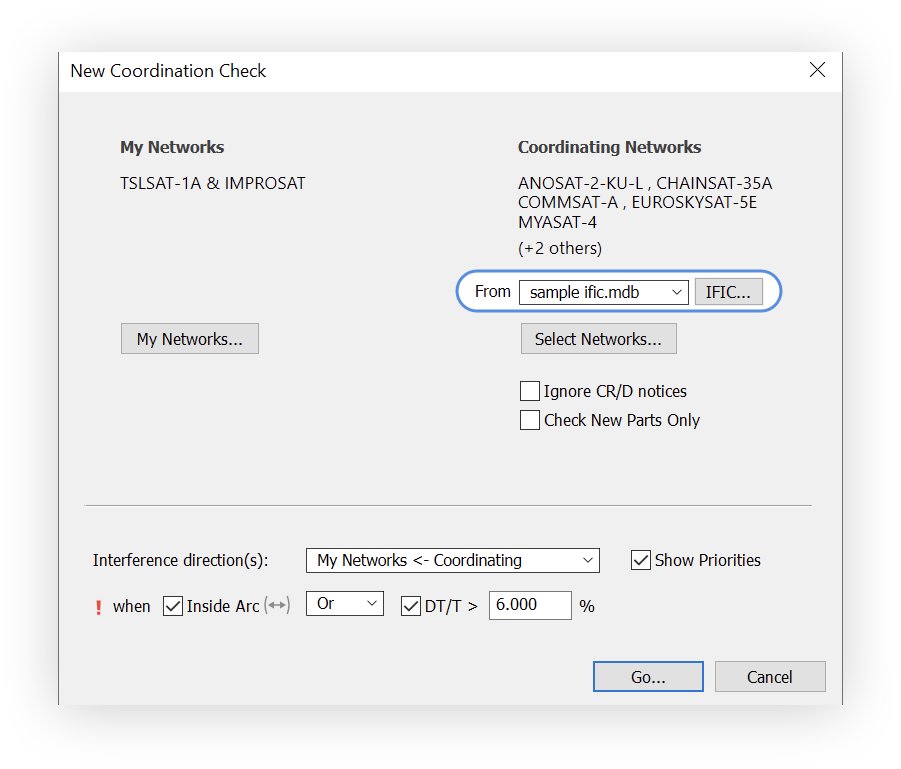
To undertake a coordination check you need a set of Coordinating Networks and in Visualyse GSO V3 there are two options for defining these
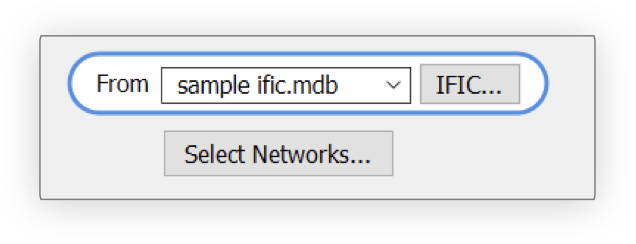
- IFIC - this will use all the networks in an IFIC
- Select Networks - here you can define subset of networks selected from any number of different IFICs or the SRS
By default the sample ific.mdb database is selected.
Click Go. Visualyse GSO V3 will now examine each network in this sample IFIC against both of the two networks defined in My Networks.
Note: All data in the sample IFIC and those in "My Networks" has been created for this demo and does not have any particular significance.
Calculation of DT/T
The DT/T is calculated from the data in the chosen IFIC or SRS using standard ITU-R approaches such as those identified in Appendix 8 of the Radio Regulations.
The software takes each network in turn and calculates the worst case DT/T to, or from each of your own networks. To do this, for the interfering network the emission with the highest e.i.r.p spectral power density is used and for the victim network the highest receive gain and lowest noise temperature are used. A worst-case geometry is assumed.
Frequency and geographical overlaps are also considered and if none are found for a particular network then the software will show this.
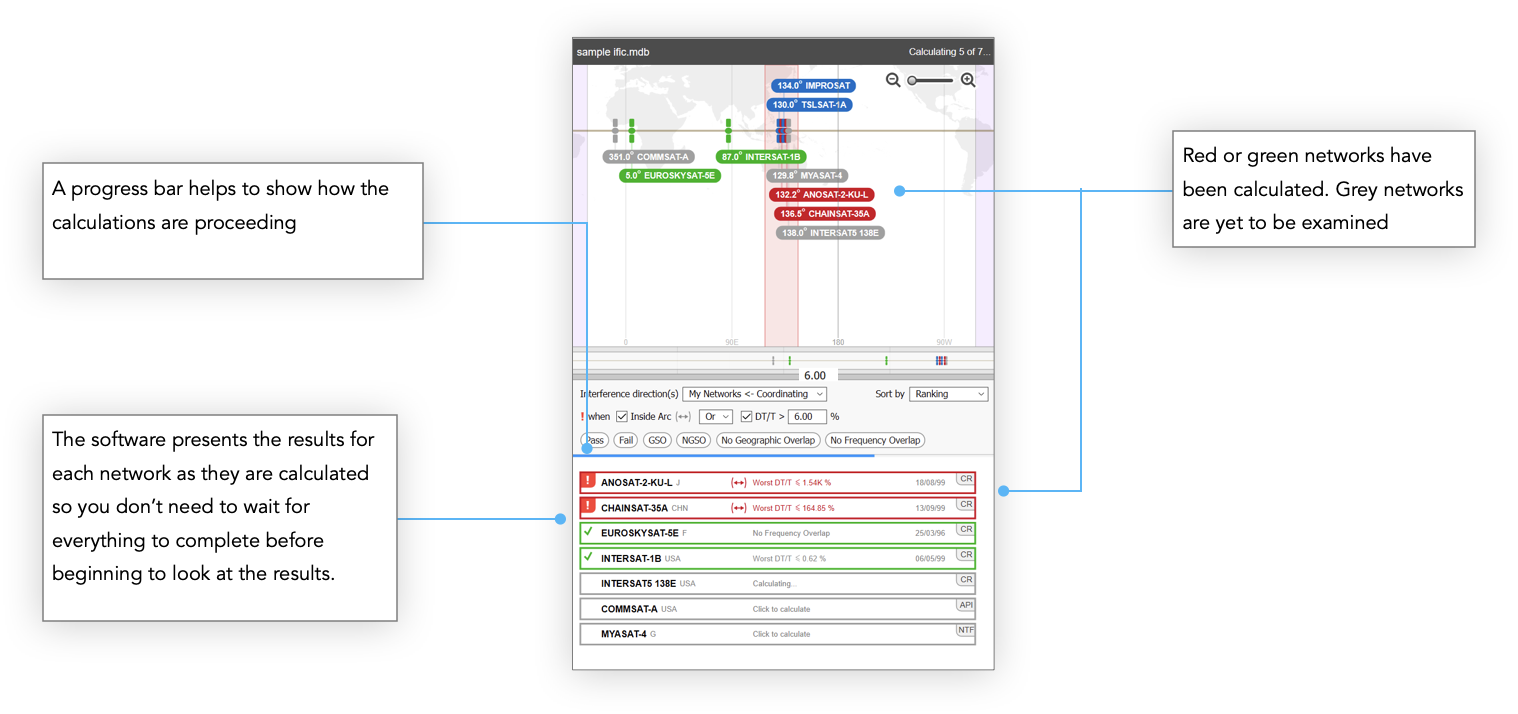
As soon as calculations are complete on a network it is possible to examine the results. When CHAINSAT 35A is complete, select it to show the coordination details.
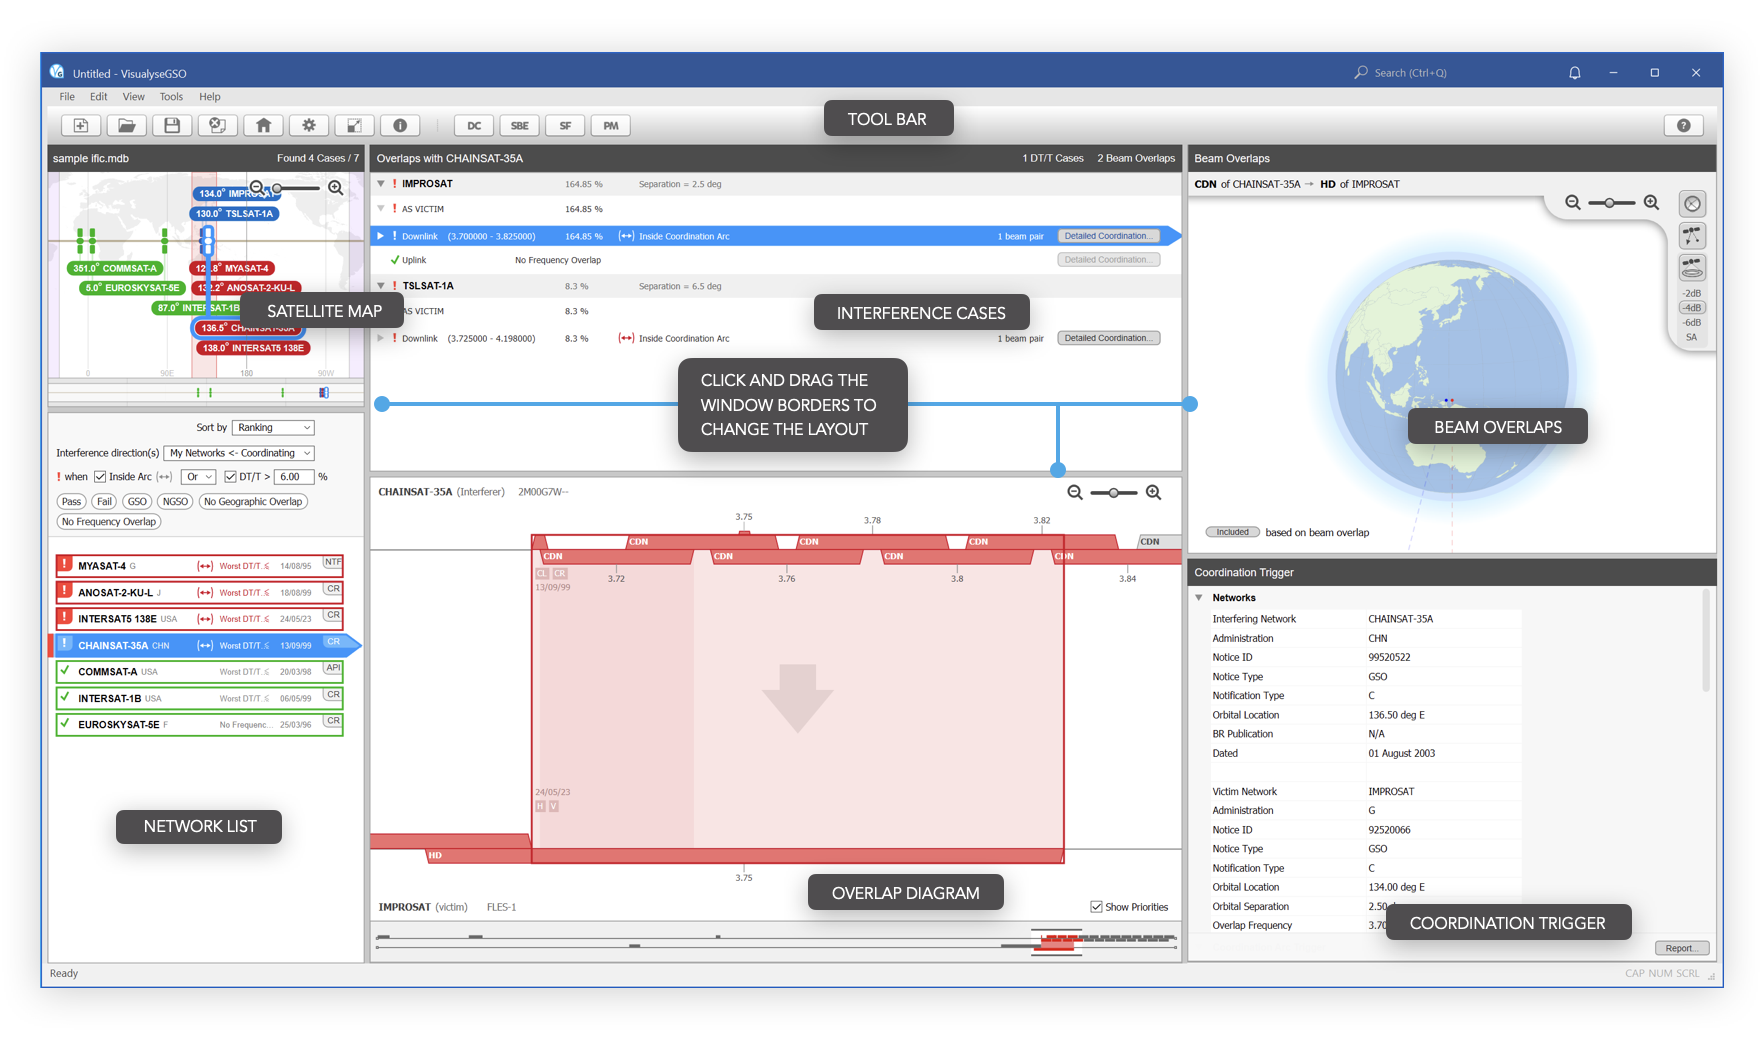
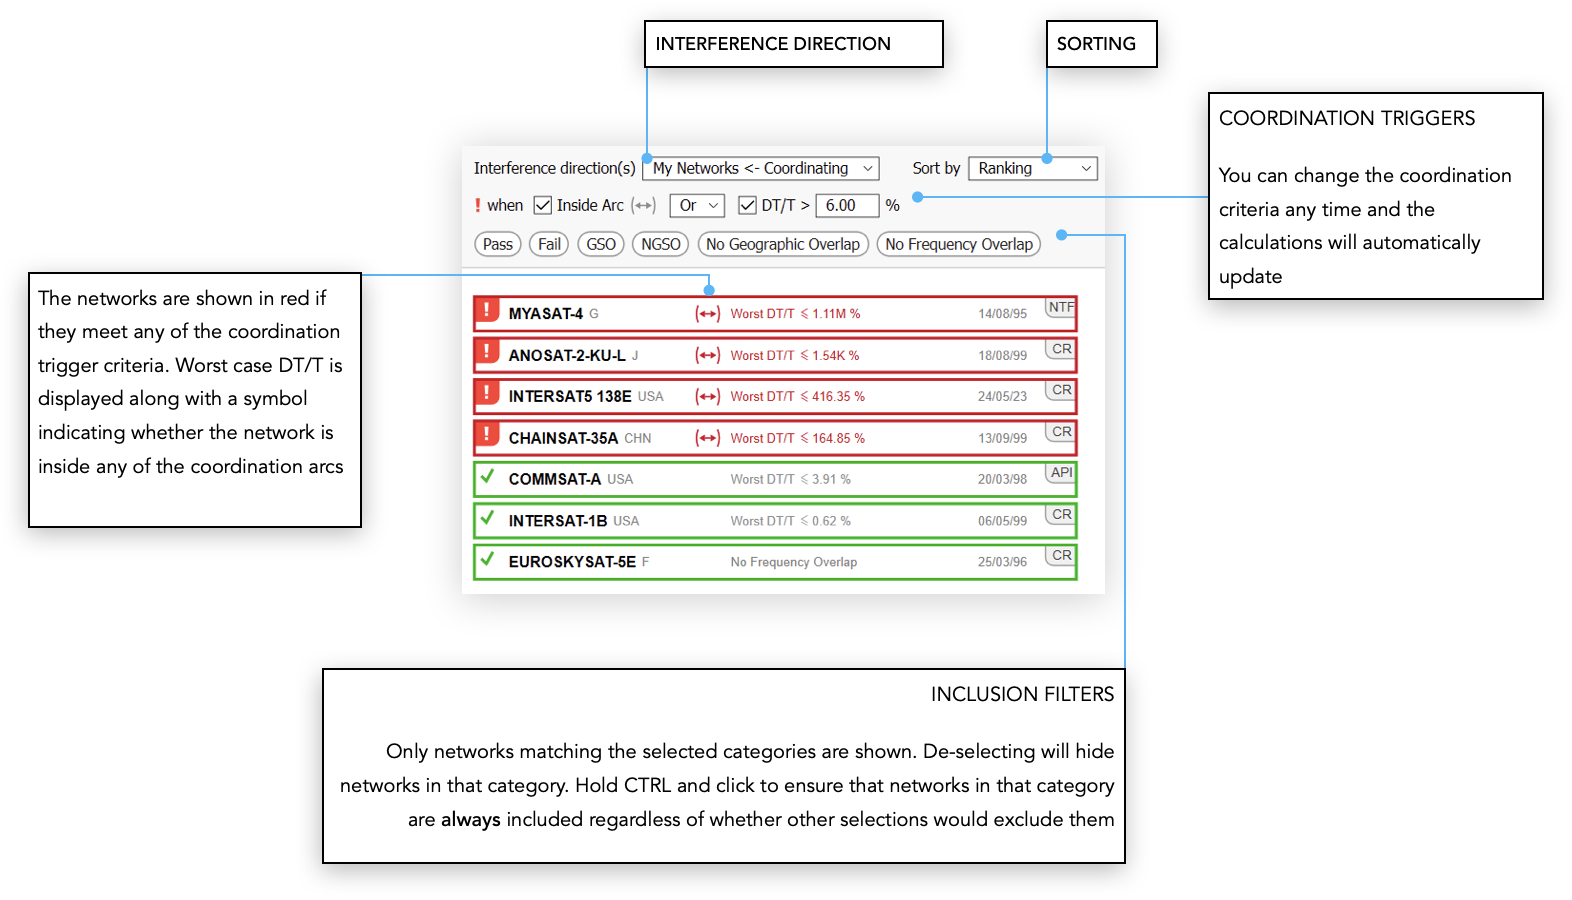
Network List
This shows the 7 networks in the IFIC including their administration, notification reason (API, CR etc.) and date.
Selecting a network updates the other windows with data related to that network.
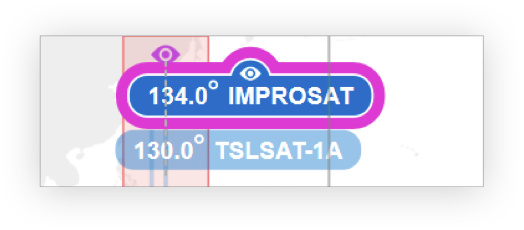
Satellite Map
The Satellite Map provides a graphical representation of the satellite positions on the GSO arc.
It allows you to easily determine the relative orbital proximity of satellites and see whether they lie within any coordination arc(s).
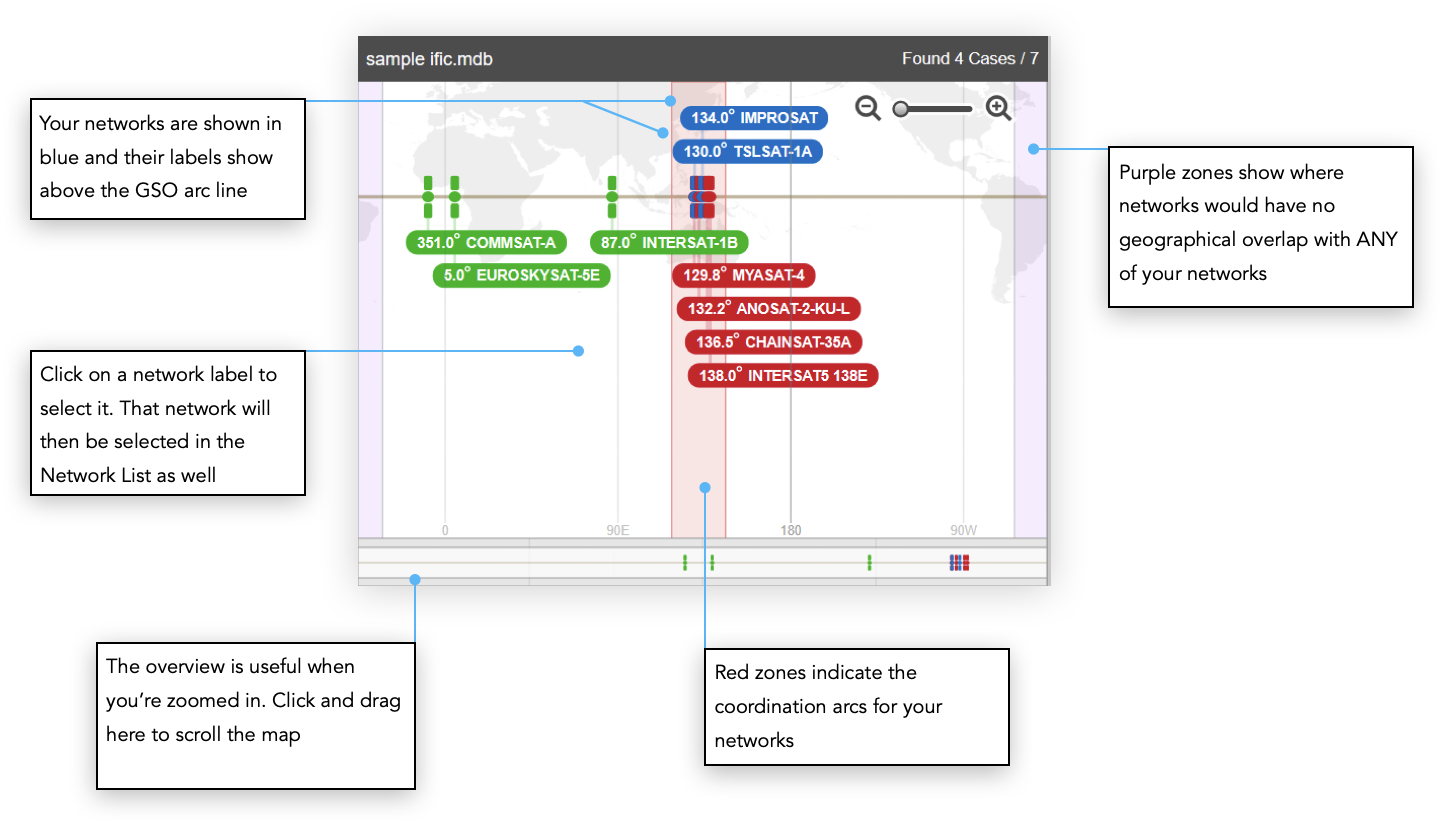
Focus Network
By default the purple ‘no geographical overlap’ area shows where coordinating networks would have no geographical overlap with any of your networks.
If you double-click on a coordinating network you can ‘focus’ on that network and instead show where there’s no geographical overlap with only that network.
A small eye icon will appear above the label and another in line with the network location.
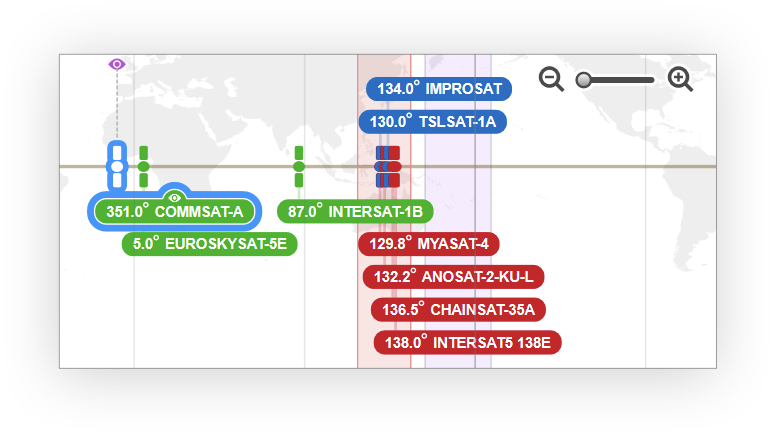
You can also double-click to focus on one of your own networks. The ‘no geographical overlap’ area will change to show the area that applies only to that network.
In addition the entire network list will update to show the coordination status based on looking at overlaps with the focused network only.
To reflect this the focused network will be highlighted with a purple border.
To exit Network Focus double-click on an empty area of the Satellite Map background.
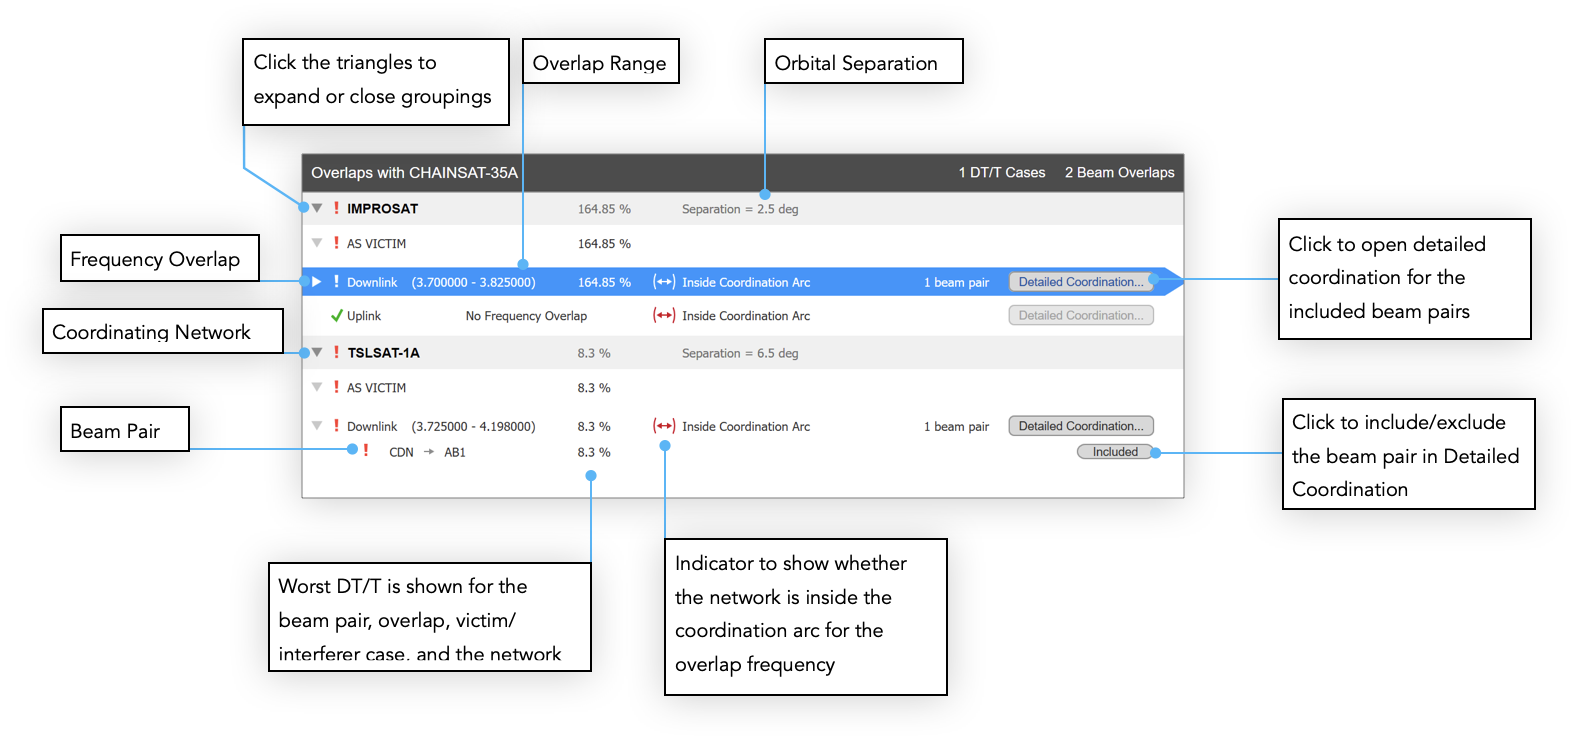
Overlap List
This window shows the interference paths between My Networks and the network selected from the Network List.
These are broken down into frequency overlaps and grouped by network, link direction (up/down) and then beam pair.
Selecting a beam pair will display the beams and coordination trigger calculation on their respective windows (we’ll talk about these next).
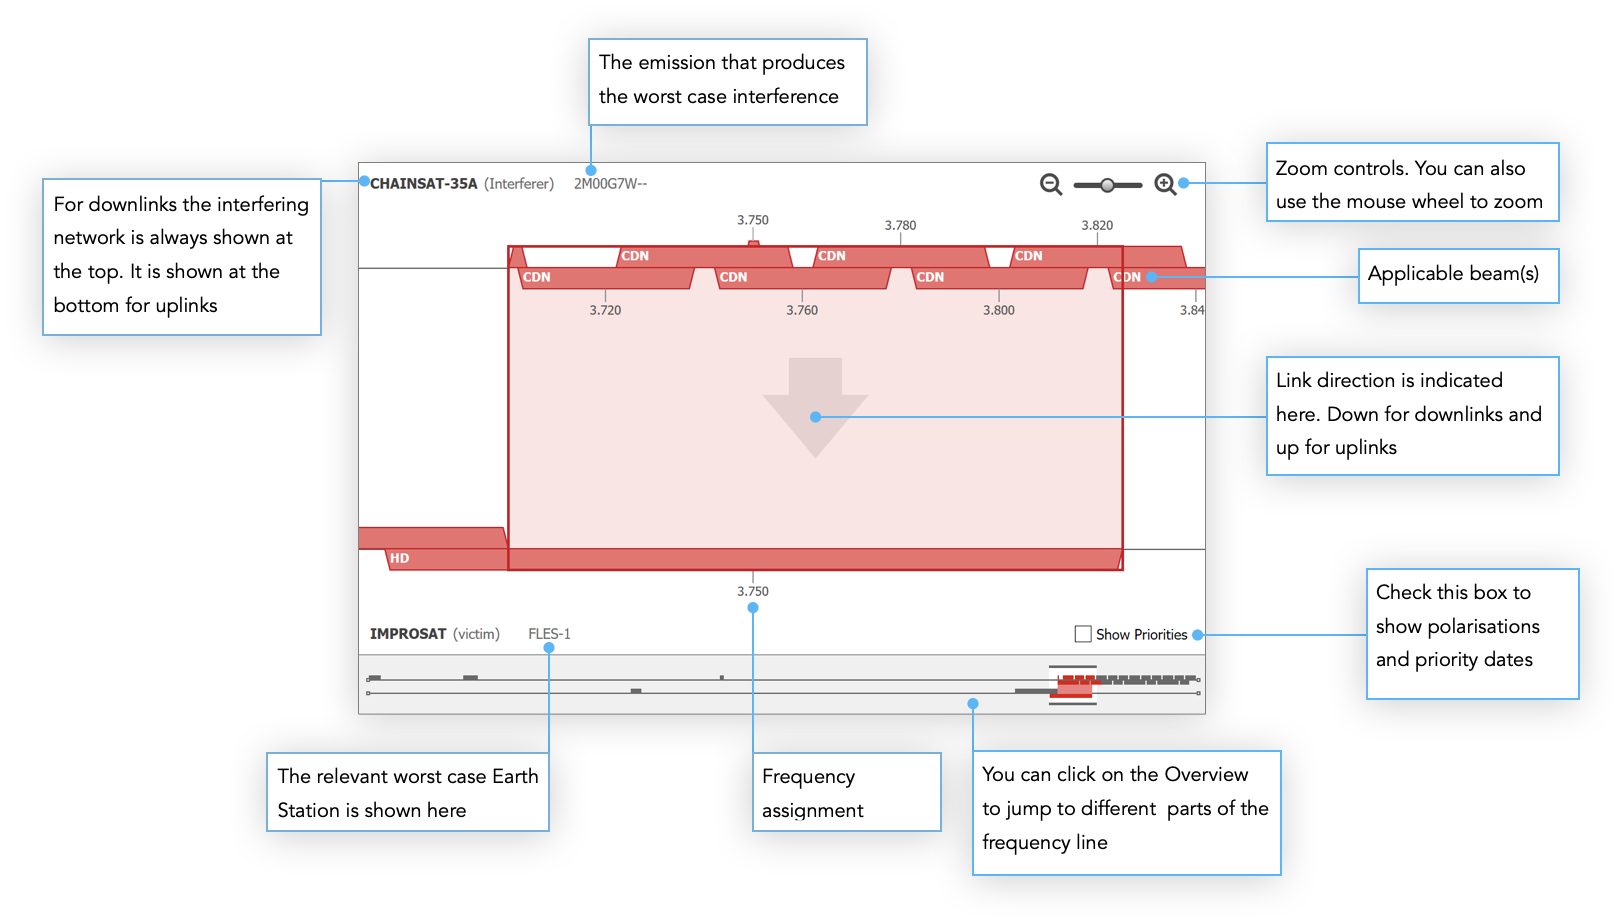
Overlap Diagram
The Overlap Diagram provides a graphical representation of the selected frequency overlap(s).
Frequency assignments are shown together with the group bandwidth to illustrate how the spectrum is occupied for each network.
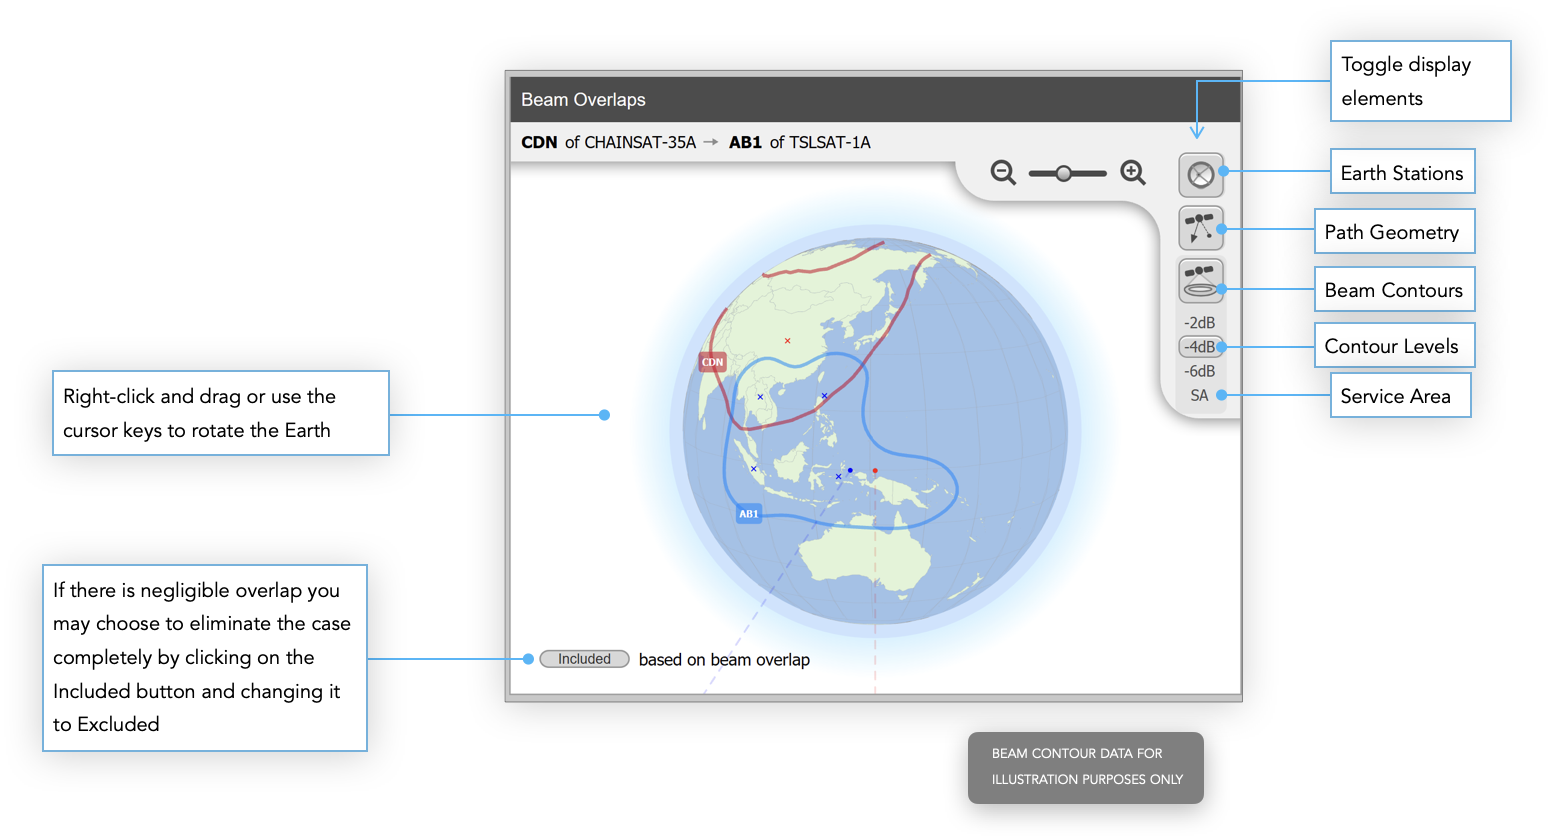
Beam Overlaps
The Map View is used to perform an initial visual inspection and eliminate cases based on beam overlap.
Beam contour data is automatically loaded from GIMS when available.
When you click on a Beam Pair in the Overlap List you should see the contours on the Beam Overlaps window.
As our example uses fictional networks, there is no beam data in GIMS so we’ve added some to the here just for illustration purposes.
If there is a sufficient overlap not to discount the beam pair you would next look at the coordination trigger calculations.
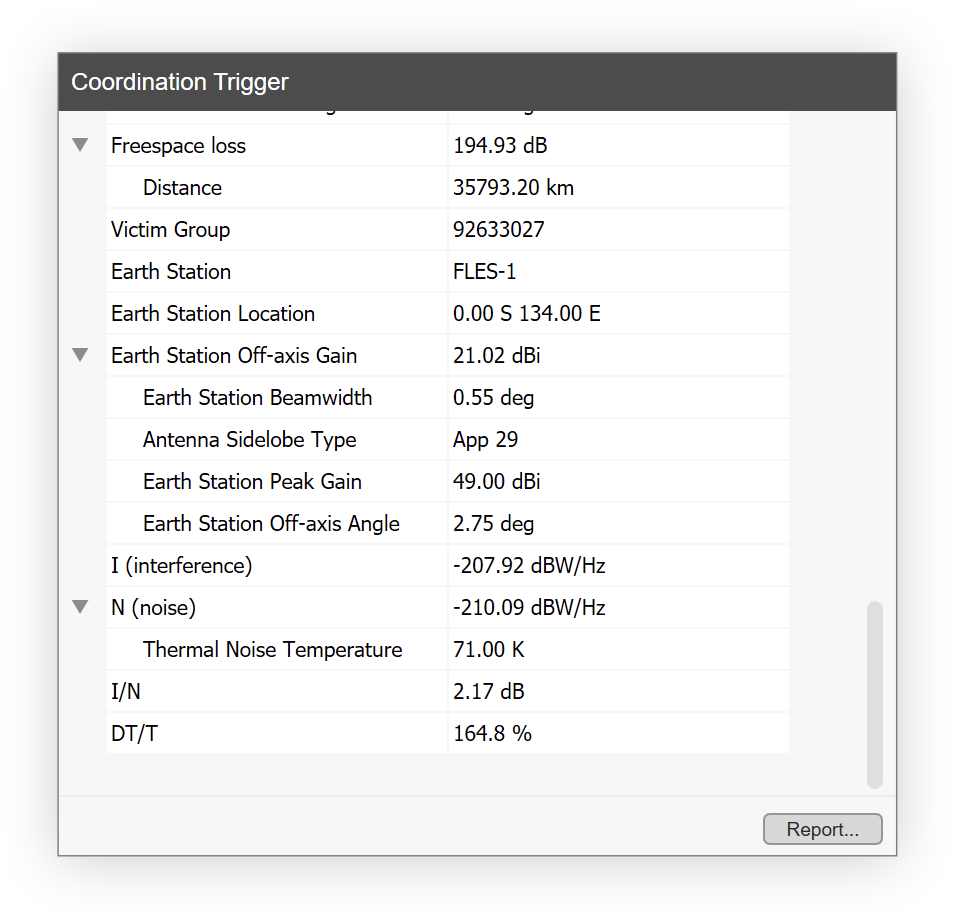
Coordination Trigger
This shows a detailed breakdown of the Coordination Trigger.
It gives more detailed information about the networks concerned including the coordination arc, and how the calculation of DT/T was arrived at based on the parameters of the selected networks.
For our example we see the following:
- Interfering network CHAINSAT-35A
- Victim network IMPROSAT
- Orbital separation 2.5°
- Inside coordination arc Yes
- DT/T 164.8%
From both triggers we see that coordination would be required so we can proceed and include this beam pair in our detailed coordination.
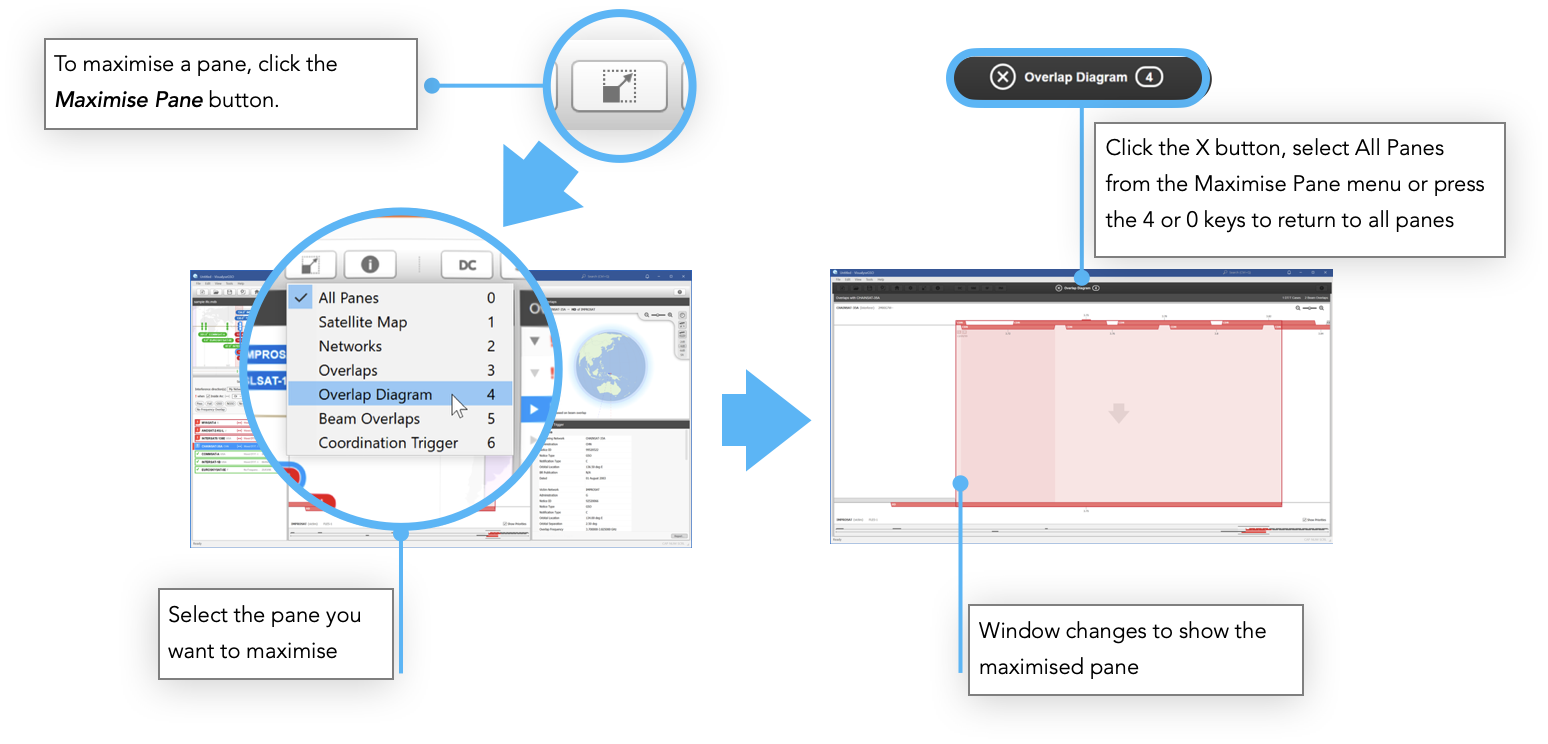
Maximise Pane
If you’re working on a laptop or with a small display then you'll have limited space to see all the application panes in detail at the same time.
To help with this we have added the ability to temporarily maximise any of the panes.
You can easily flick between maximised panes using the number keys. You can also configure the maximised panes so that you can show two or three panes at a time.
Simply adjust the pane splitters while a pane is maximised. The software will then remember this configuration for you.