Detailed Coordination (DC)
REQUIREMENTS
The previous section described how to identify which networks require coordination, by considering the DT/T and the coordination arc. This can be used by operators and administrations to decide which notices they could have an issue with and hence which require a notification to be sent requesting coordination to the BR and other operators and administrations.
Having entered into detailed coordination with another operator a different approach is required – not looking at a range of systems in an IFIC or SRS, but considering one or a small number of systems in detail, to see how interference could be managed so that both could operate. This will involve negotiation between the parties, which must take into account which network has regulatory priority. However there is a provision in Article 9.53 that both parties should make every possible mutual effort to overcome any difficulties, which is intended to facilitate the entry of the newer system.
These negotiations must take account of details of each system, their beams, service areas, polarisations, emission codes, e.i.r.p.s, frequencies, and earth station characteristics. Detailed discussions therefore must consider a large number of combinations of interfering and victim carriers plus link characteristics for each in great detail.
A successful outcome requires a good understanding of where the main problems are, why there are problems and what could be done to facilitate sharing. This can be achieved using the Visualyse GSO V3 Detailed Coordination tool.
Calculation of C/I
The basis of our Detailed Coordination tool is the C/I between the victim and the wanted network. This will depend upon the data in the Group pair selected – such as frequency, polarisation and associated earth station. The C/I threshold can either be directly entered or is derived based upon a calculated C/N, using the approach given in Recommendation ITU-R S.741-2:
C/I = C/N + 12.2
By default the C/I calculations use the worst case geometry. However, during analysis, specific locations can be included and hence the antenna directivity can be used to decrease interference.
Examining a Network in Detail
The Detailed Coordination tool can either be launched from Visualyse GSO V3 (by pressing one of the ‘Detailed Coordination’ buttons) or independently (by pressing the ‘DC’ button on the toolbar in Visualyse GSO V3) or by launching from the Start Menu or file system.
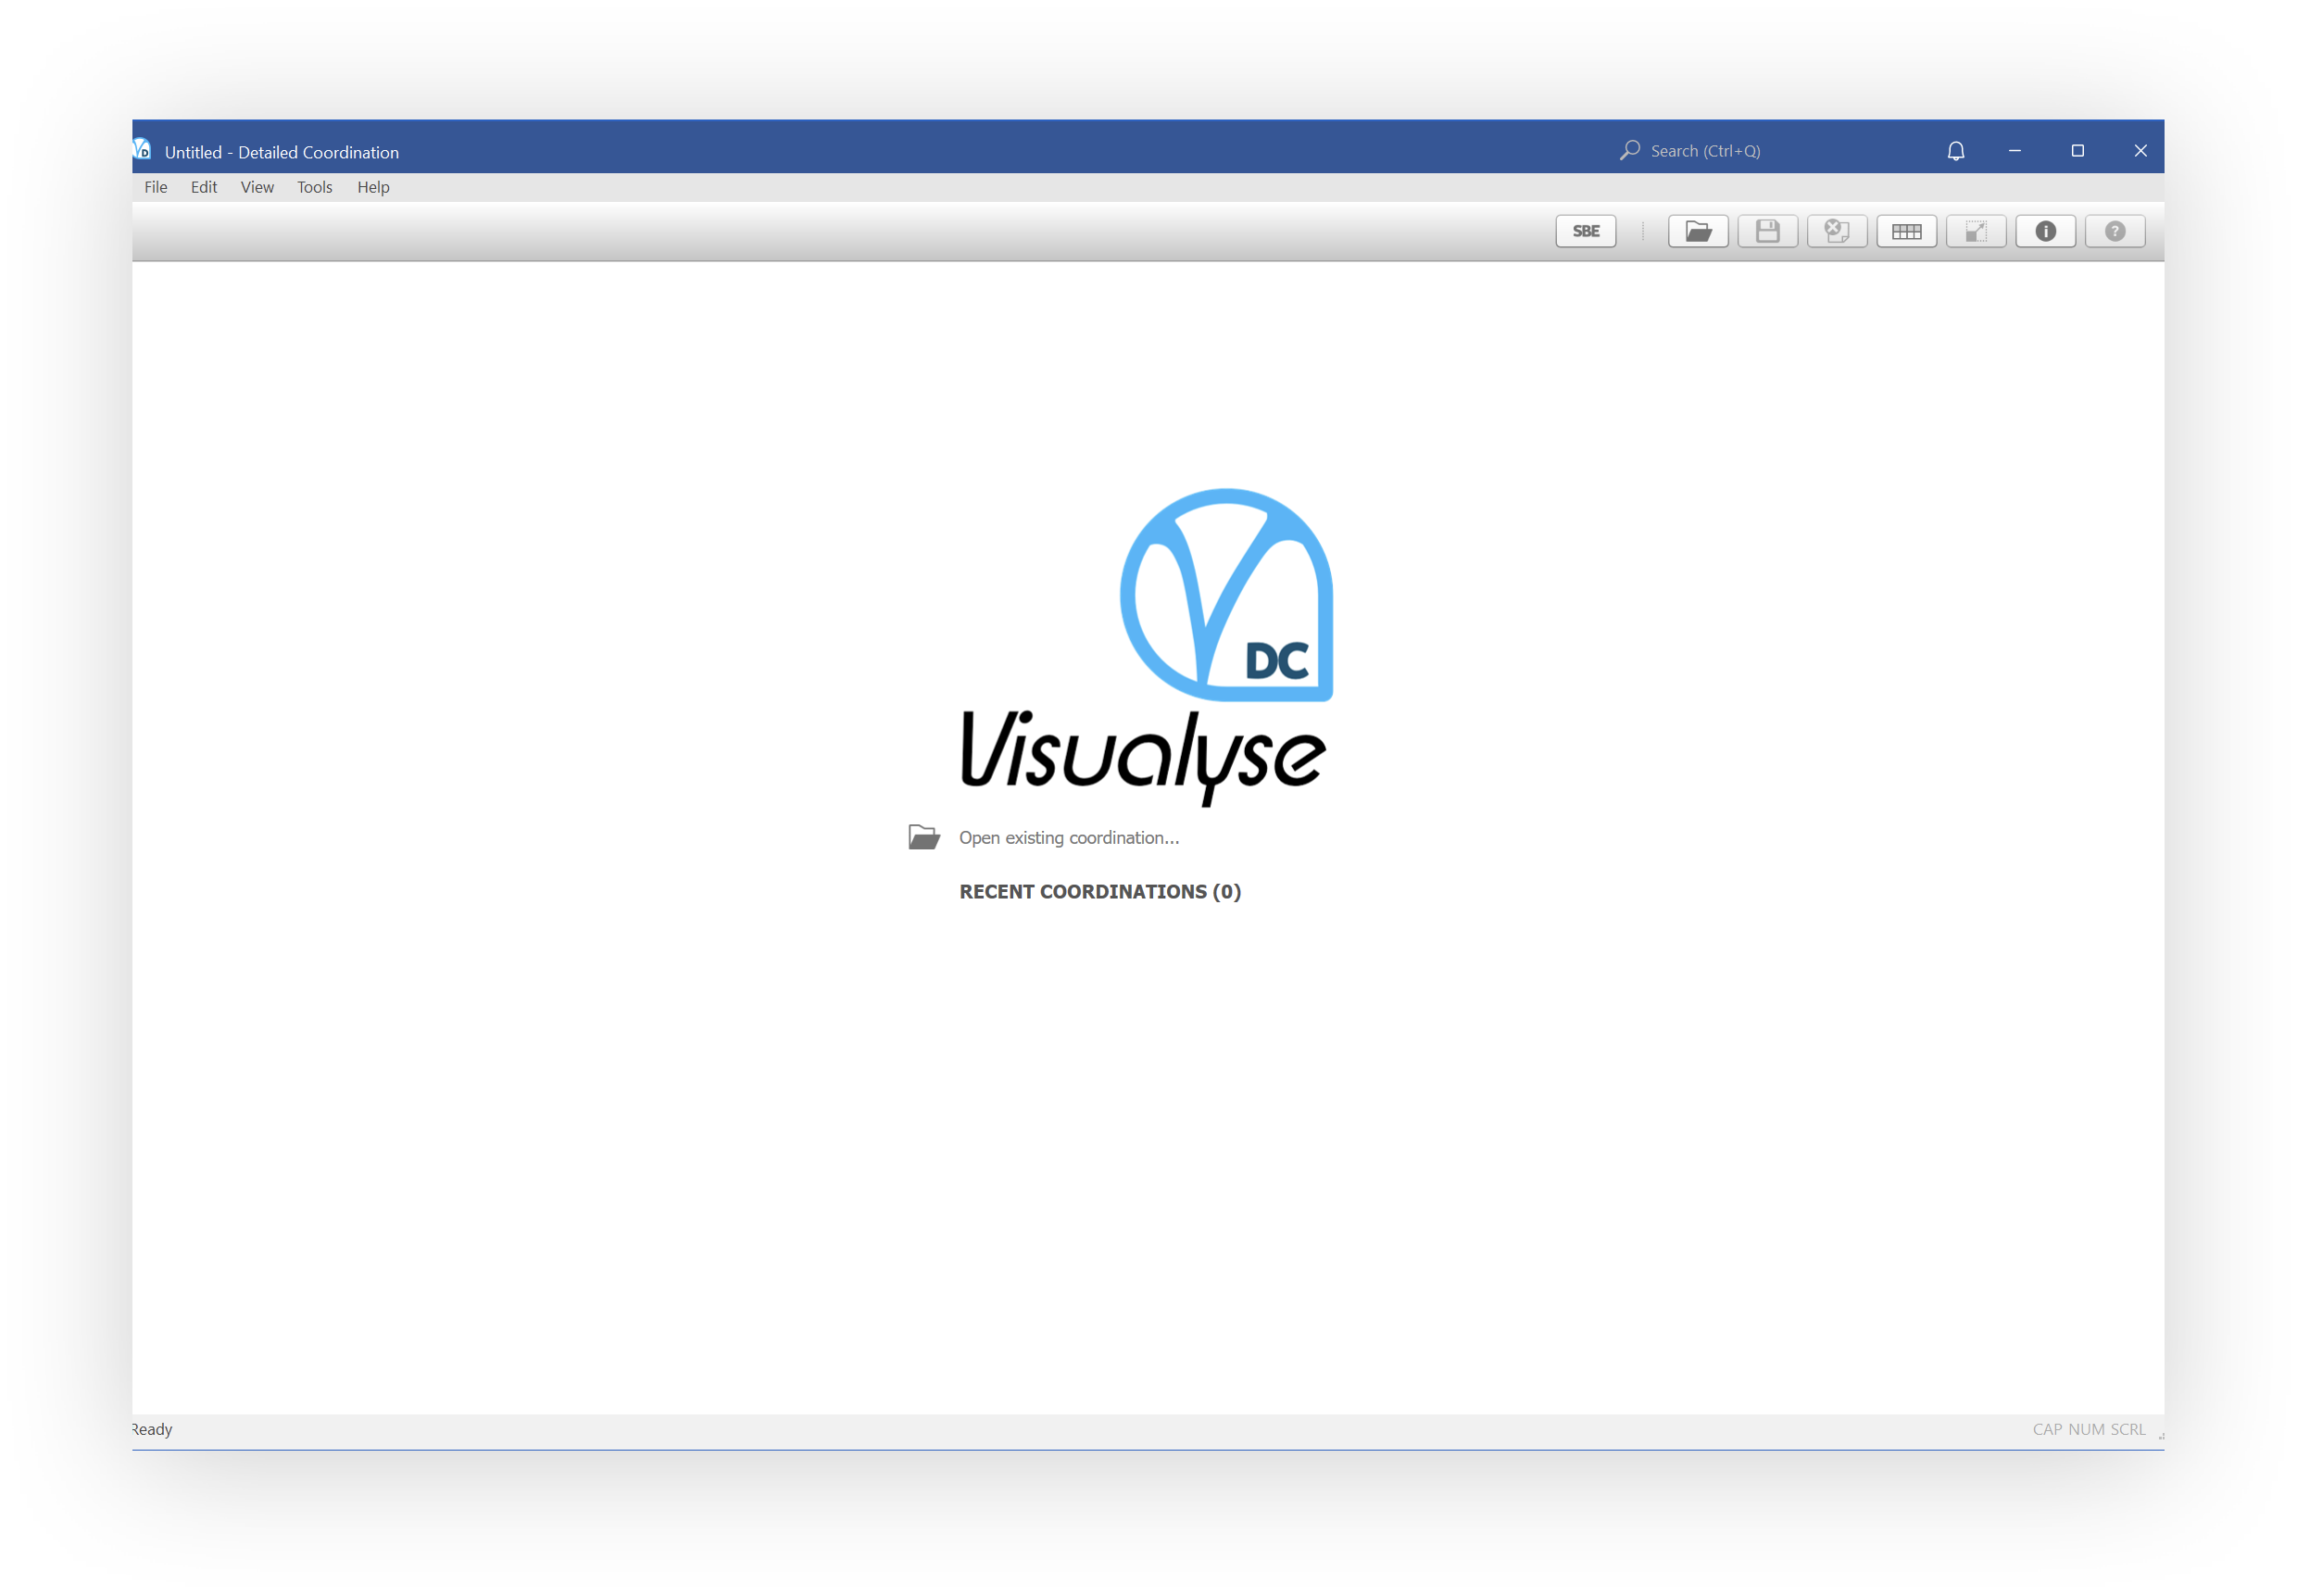
If launched independently the application will launch into the start screen. This is very similar to Visualyse GSO V3 and allows you to load up previously saved files.
We're going to launch from inside Visualyse GSO V3. Click the ‘Detailed Coordination’ button next to beam pair CDN (from CHAINSAT-35A) and HD (from IMPROSAT) i.e. ‘CDN → HD’.
The Detailed Coordination tool will appear.
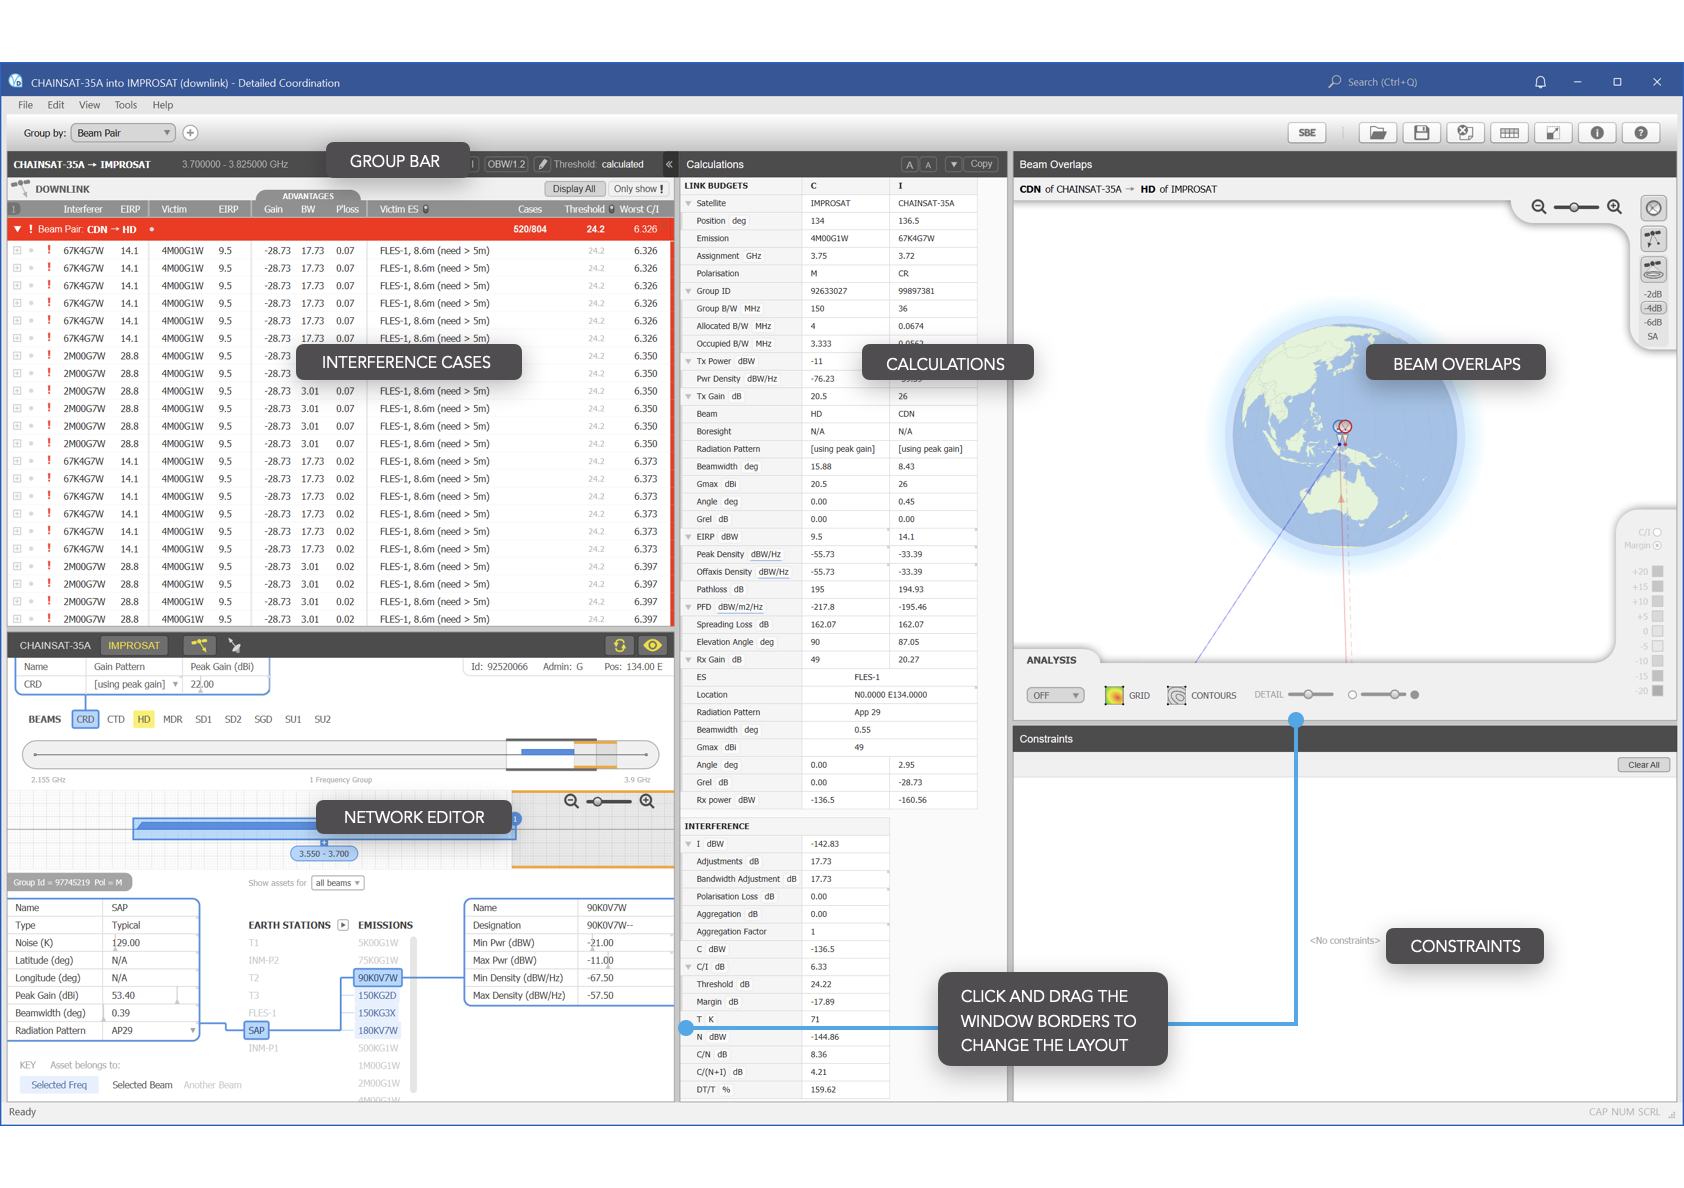
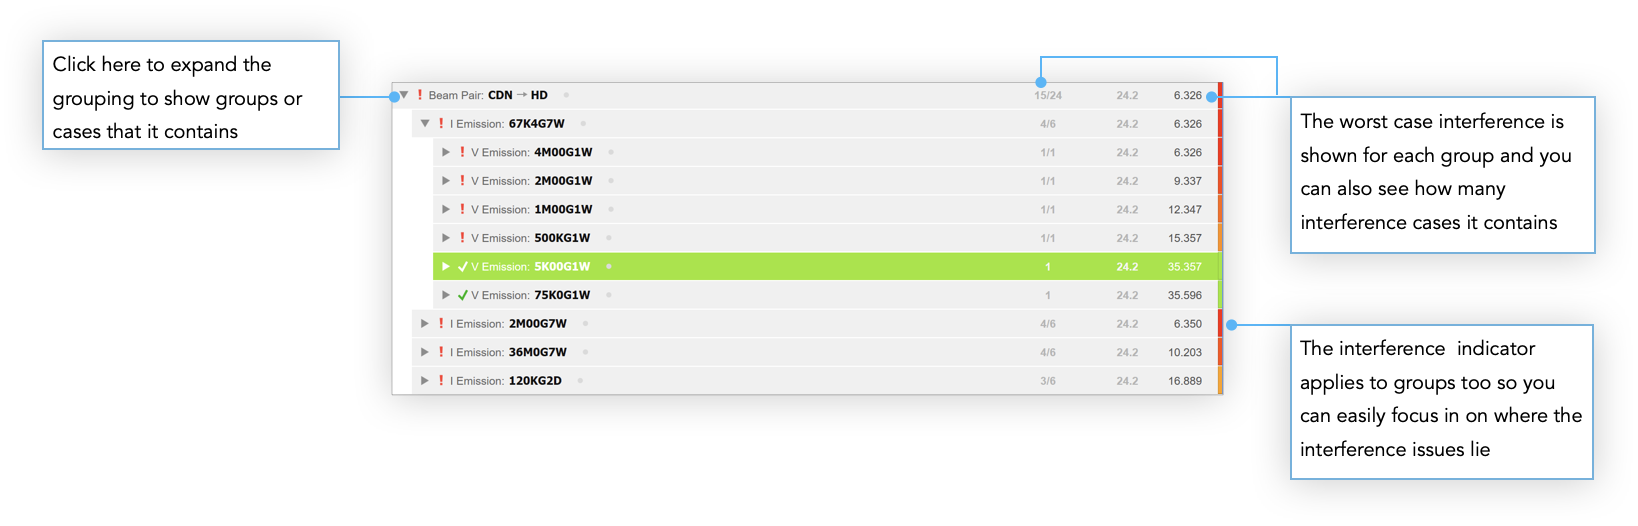
Interference Cases
The Detailed Coordination tool looks at interference cases. To create these the software looks at all the combinations of emission pairs, powers, frequencies and earth stations that could occur. It then calculates the interference.
The frequency producing the worst C/I for each combination is then taken and forms one interference case. Each is represented by a row in the list.
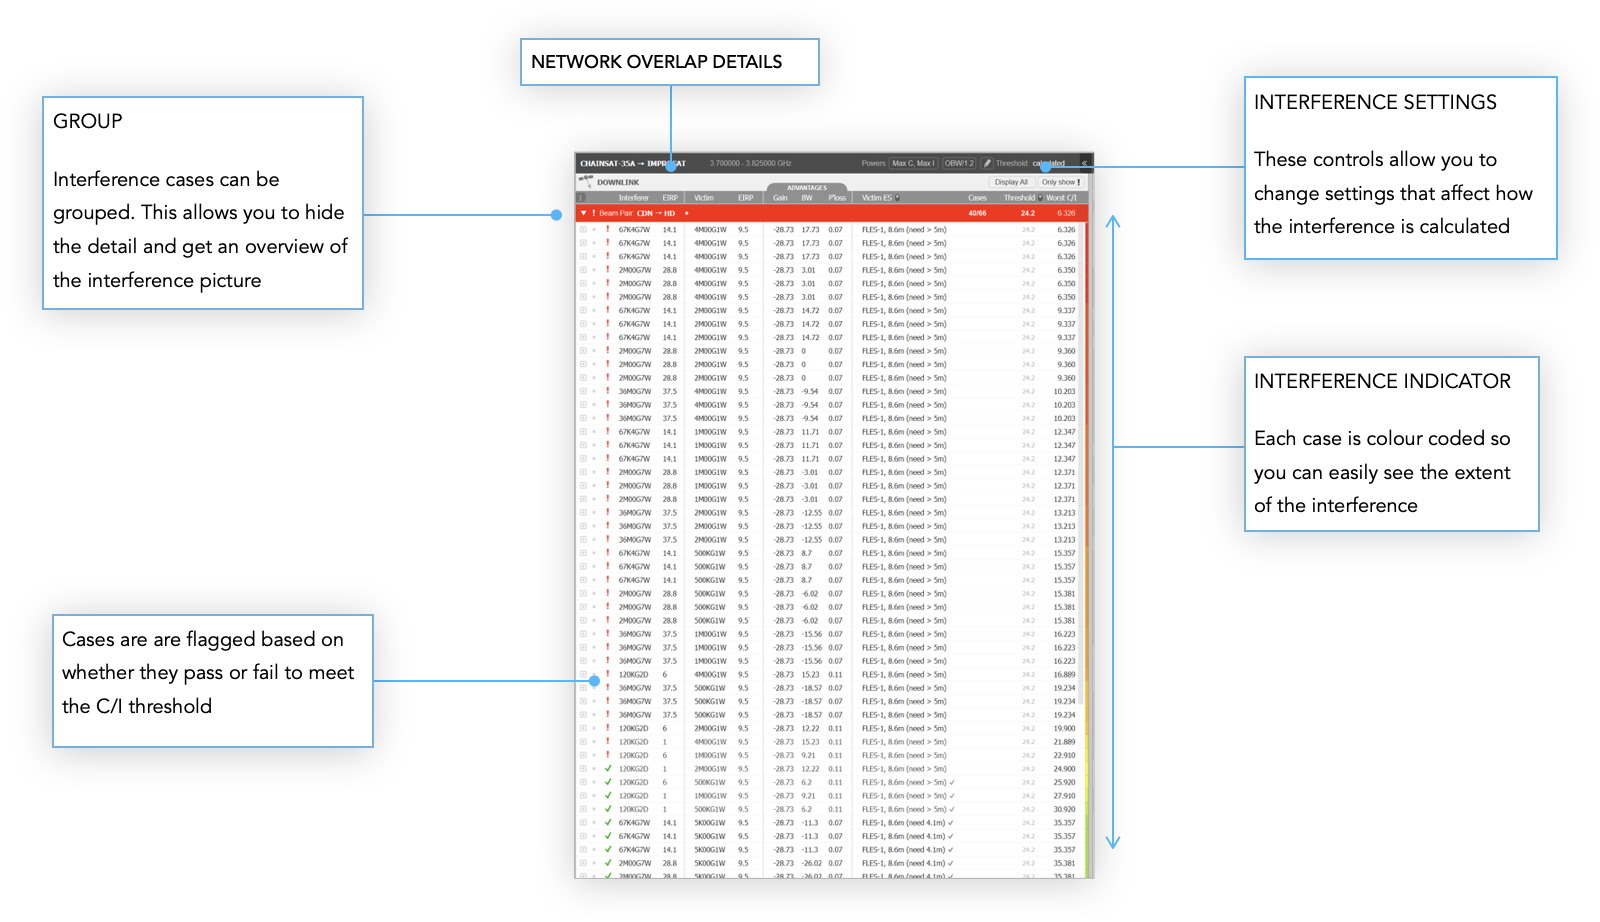
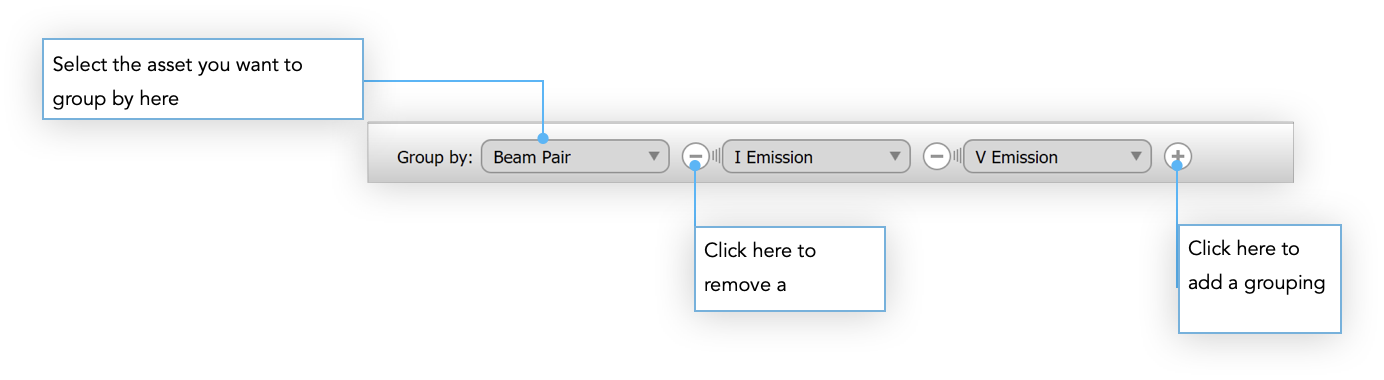
Group Bar
The Group Bar allows you to organise the interference cases into logical collections. You can group by beam, emission or earth station and by doing so, see how the interference cases are spread across a particular set of assets.
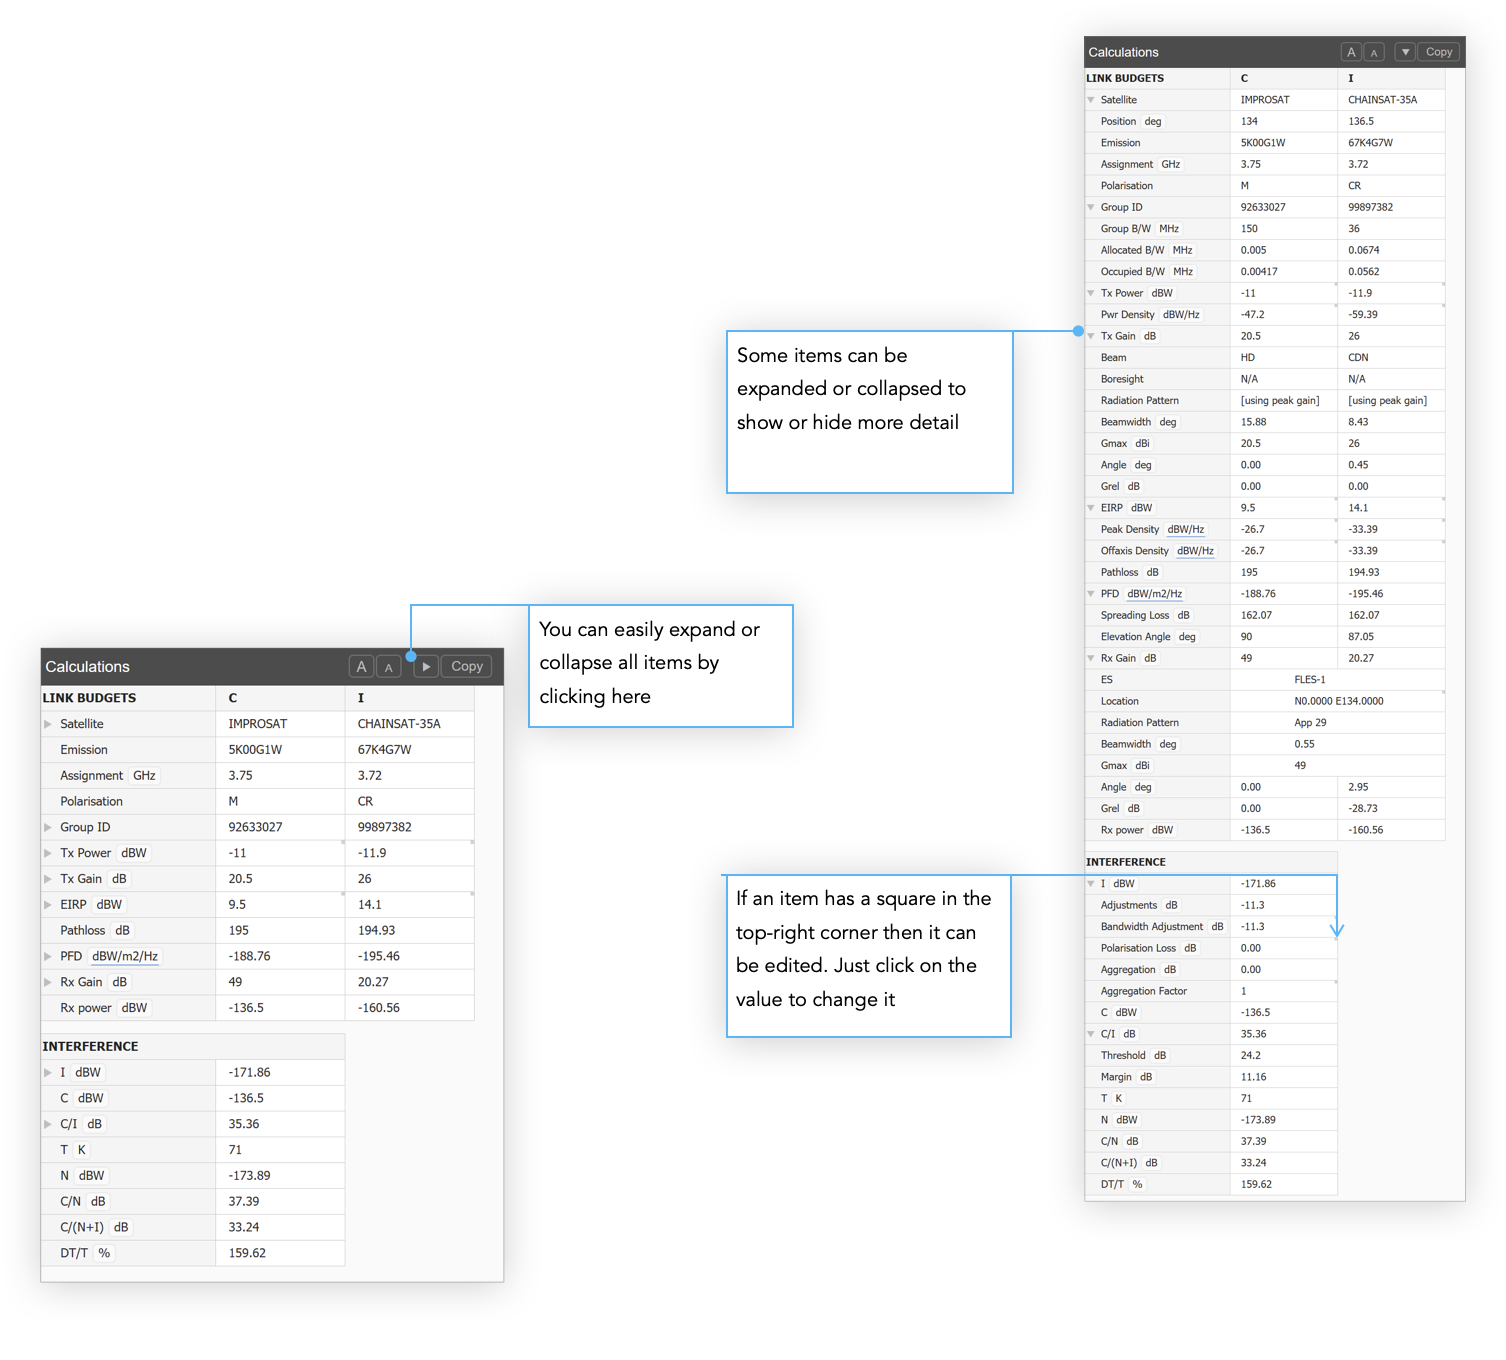
Calculations
When you select an interference case, a full breakdown of all the components of the calculation are shown in the Calculations pane.
You can click the Copy button to copy the contents so that you can paste into applications like Microsoft Excel for further analysis.
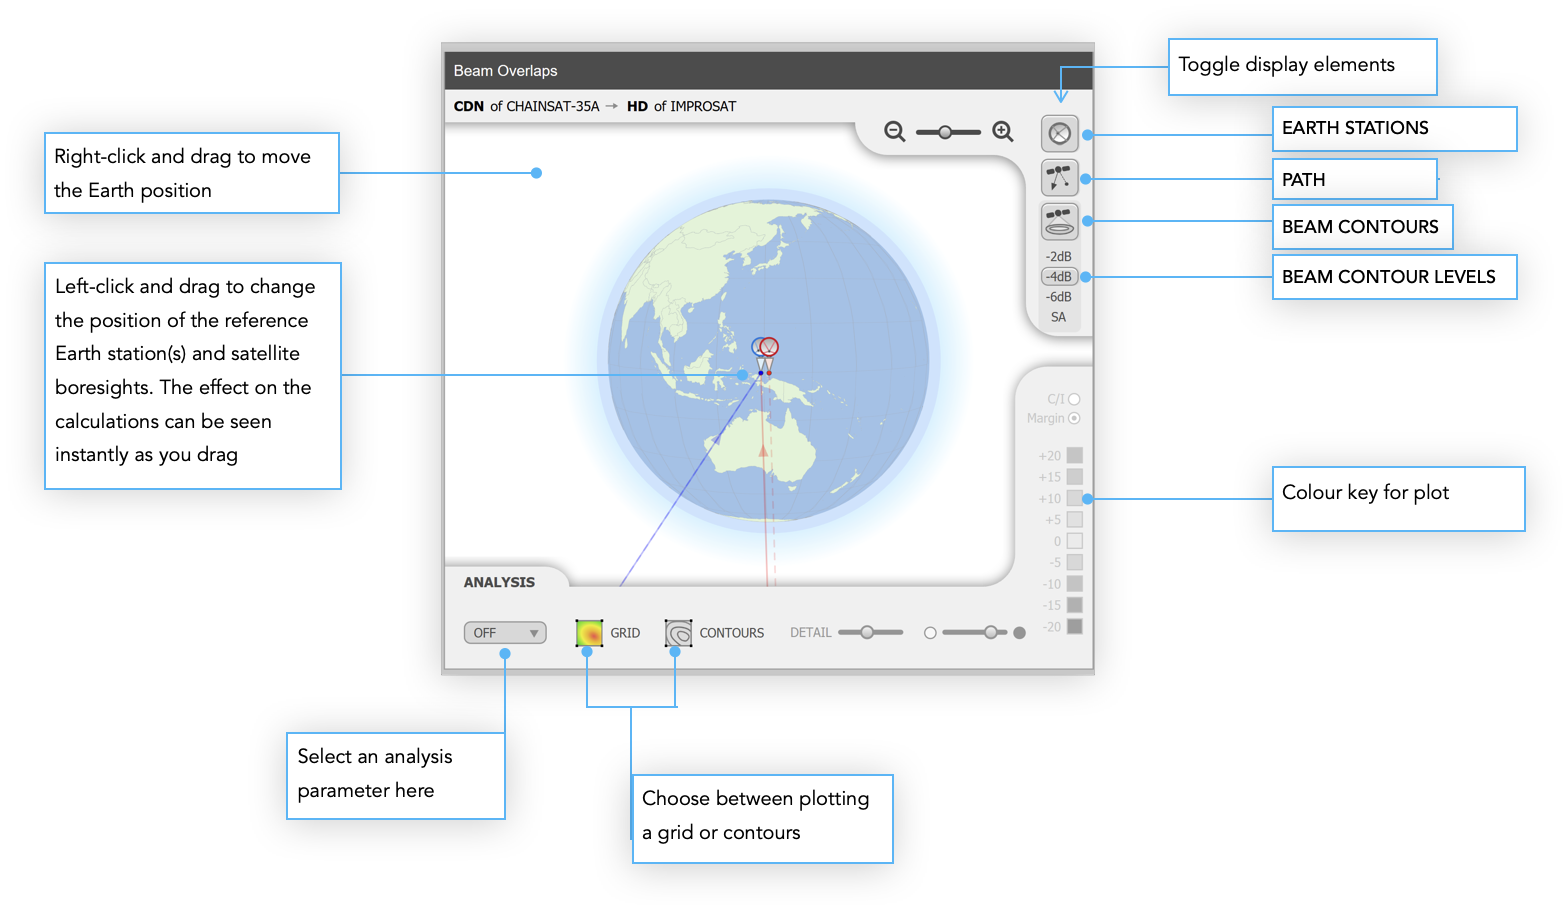
Beam Overlaps
In the Detailed Coordination tool the Beam Overlaps pane has extra analysis tools. These allow you to look at how parameters such as interference, EIRP or Required Dish Size vary as you move the Earth station across some defined area.
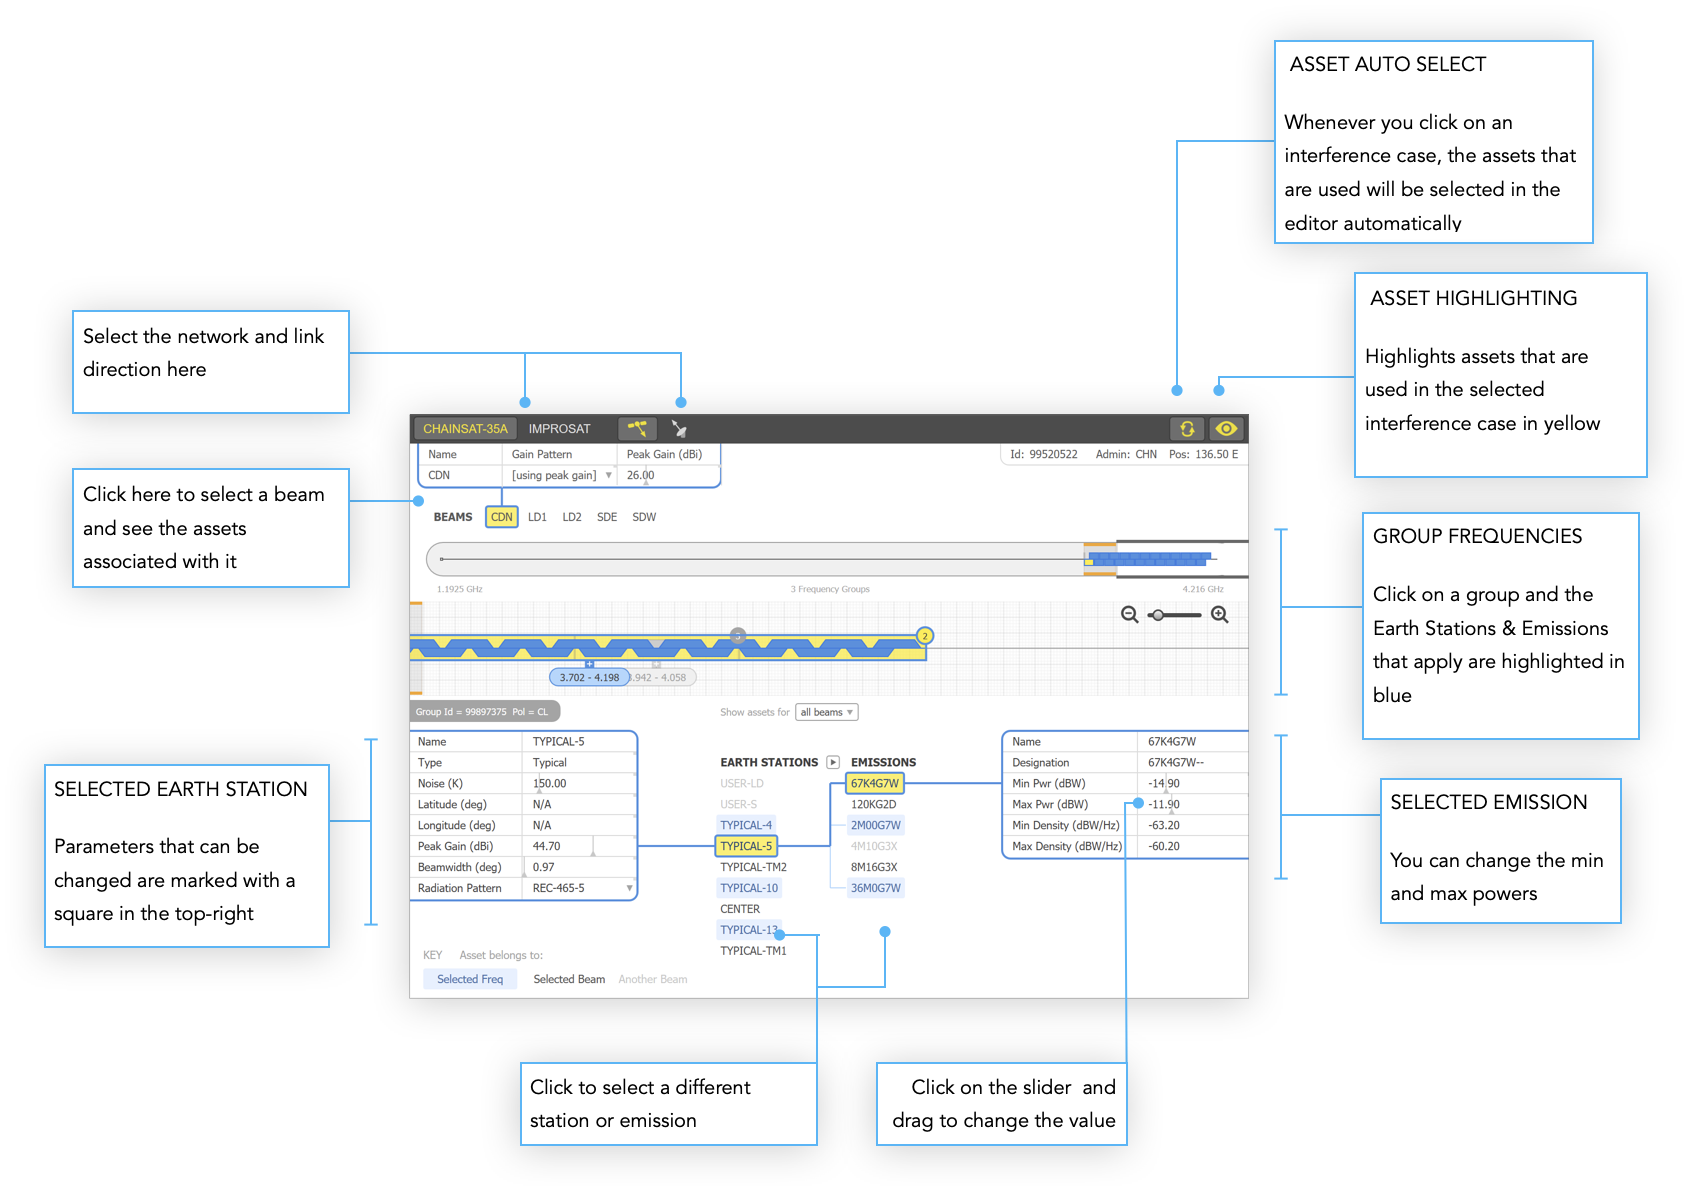
Network Editor
The Network Editor shows the full network definition for the both interferer and victim. You can use it to trace exactly which network parameters are contributing to a particular interference case. However, its real value is in the ability to change those parameters in order to explore ways of reducing the interference.
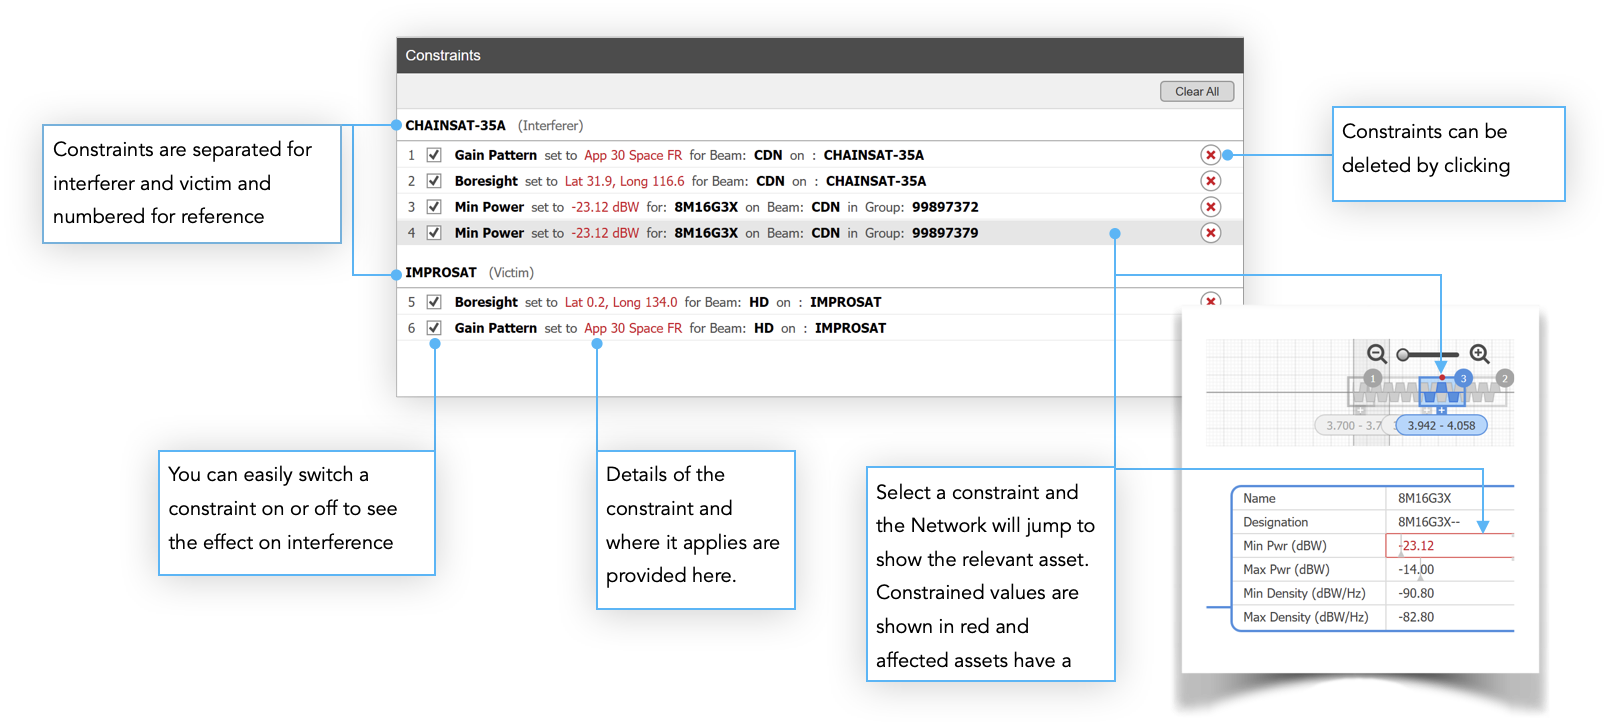
Constraints
When you make a change to a network asset you are not changing it permanently but merely exploring what might happen if the asset were altered. We call this kind of change a Constraint and these are collected in the Constraints pane.
By compiling a list of constraints you can go into a coordination meeting with a set of proposed solutions. Constraints can be toggled on and off for easy comparison or deleted completely. What’s more, because they apply to the asset, all interference cases that use the asset will be updated whenever a constraint is applied or removed.
Antenna Modelling
One of the best ways to mitigate interference is to use accurate antenna gain modelling.
If the software was not able to locate your beam data in GIMS then it will automatically use the worst case scenario of peak gain across the whole service area. Obviously if the interference levels are below the desired threshold then all is well. However, if that’s not the case then you can get a more realistic picture by either using an appropriate ITU gain pattern or by providing antenna gain contours
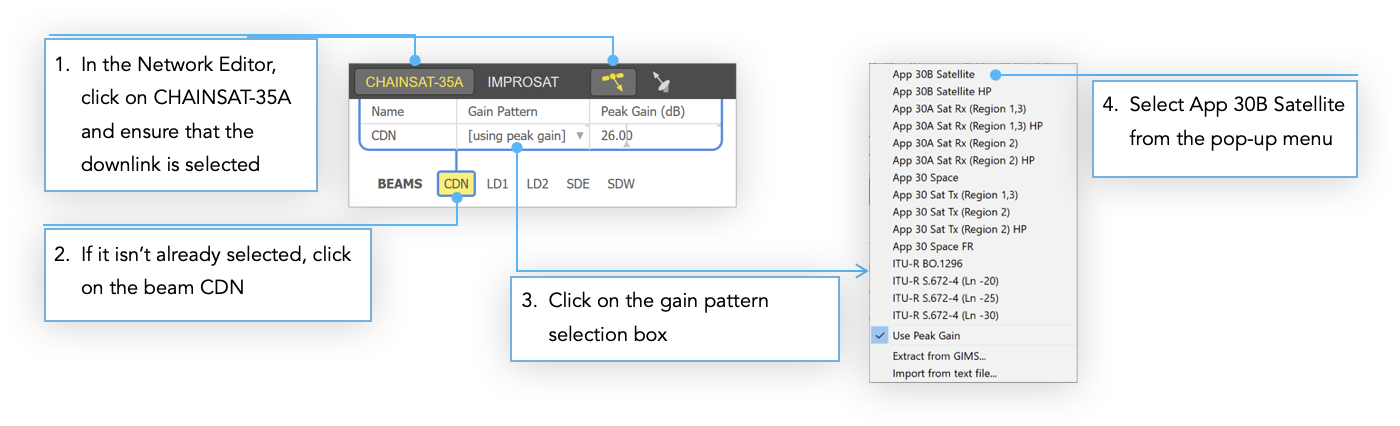
ITU Gain Patterns
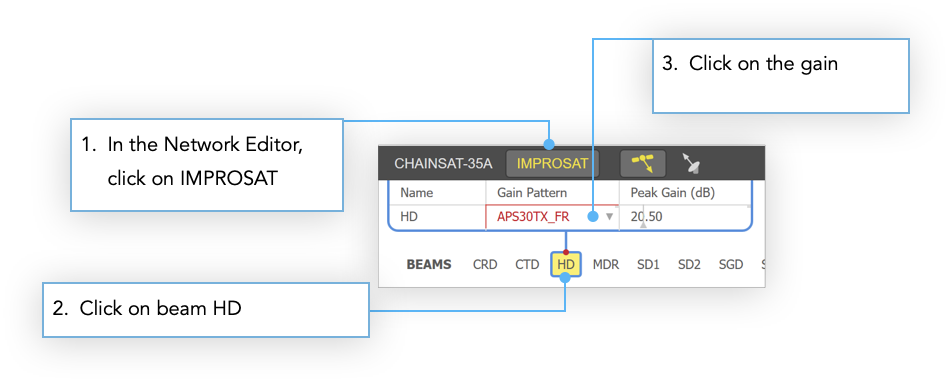
To show you how to use an ITU gain pattern for a beam let’s change the one for CHAINSAT-35A in the example we’ve been looking at. In the Network Editor, click on CHAINSAT-35A
You should see the beam footprint on the Beam Overlaps pane. If you don’t then it could be that you have this switched off on the display options.
One other option you have with the ITU gain pattern is to change the pointing direction. Click and drag the boresight for CDN over to central China as shown.
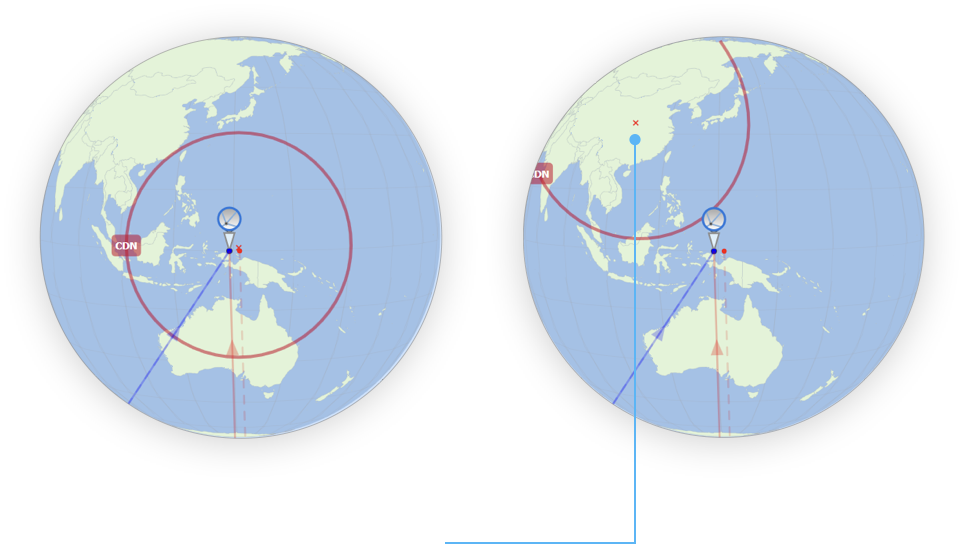
You should see that this immediately improves the interference picture as the off-axis gain for the interfering signal is significantly reduced
Try changing the gain pattern for the victim beam HD in the same way but this time choose ‘App 30 Space FR’.
Antenna Gain Contours
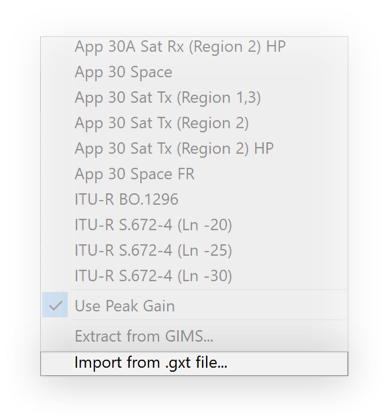
The other option for antenna modelling is to supply gain contour data. If you have this in a GIMS format .gxt file then you can easily load them into the software. To do this follow the same steps as for the ITU Gain Patterns but from the pop-up menu choose ‘Import from .gxt file…’.
You can also choose the option to extract directly from GIMS if you have the data there.
Shaped Beam Editor
If you don’t have your gain contour data in GIMS format then you can use our Shaped Beam Editor (SBE) tool to capture this. Choose Shaped Beam Editor from the Tools menu or click the Shaped Beam Editor button on the toolbar.

For information on the Shaped Beam Editor see here.
Area Analysis
The interference cases show the C/I for one particular Earth Station arrangement. On the Beam Overlaps pane you can drag the Earth Station(s) to a different location and see all the calculations update as you drag. This is great for looking at individual ES locations in isolation, but what if you wanted to get an overview across a whole coverage area? What you need is Area Analysis.
Creating an Area Analysis
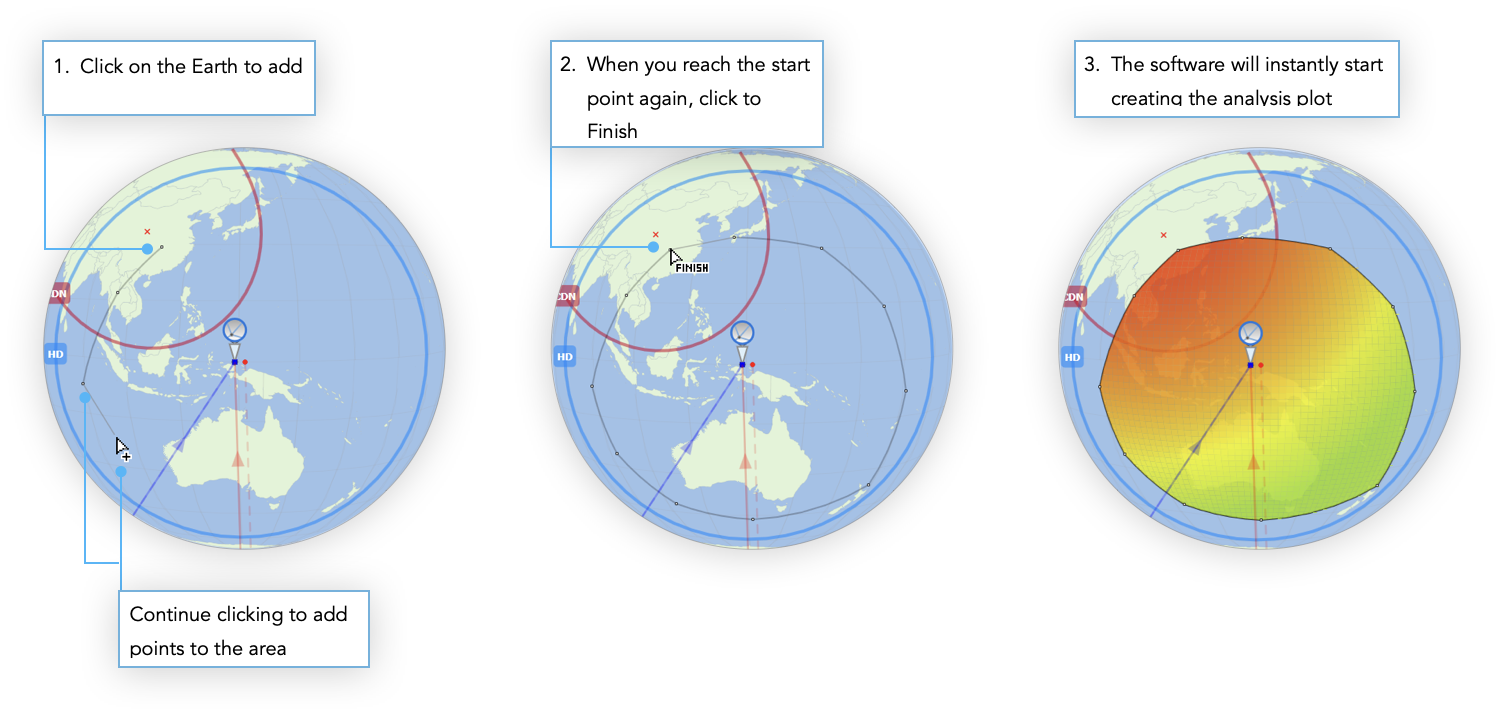
All you need to do is define the area and choose the plot parameter. The software then generates a coloured plot of the parameter across the area for every possible Earth Station location.
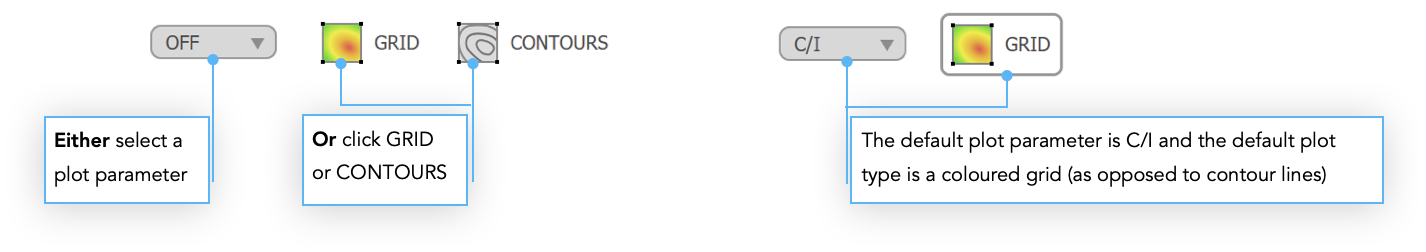
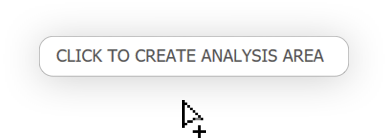
Try clicking on the GRID button. The cursor will change and a message will appear to show that you’re now in area definition mode.
You can see instantly that almost all Earth Stations in Australia meet the required threshold and that interference levels become a problem as the position moves towards China.
If you add any constraints then these will be reflected in the area analysis automatically. The analysis updates independently so you can drag a slider in the Network Editor and see the analysis update in real time, as you drag
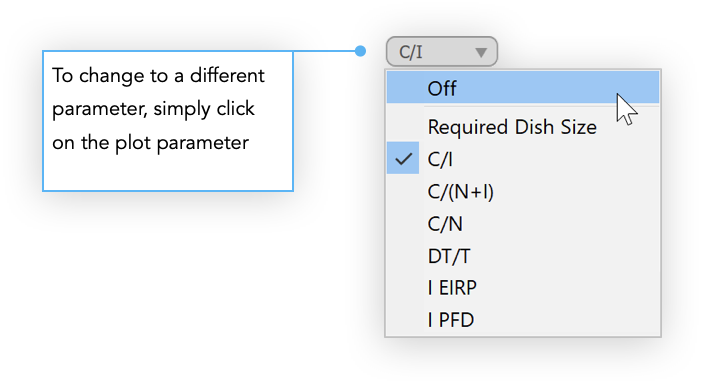
Changing the Plot Parameter
In addition to C/I, there are five other parameters you can plot on an Area Analysis. These are: C/(N+I), C/N, DT/T, I EIRP and Required Dish Size.
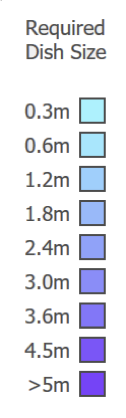
The parameters are self explanatory except for Required Dish Size. In this case we look at the dish size that would be required in order to reduce the C/I enough to meet the required threshold. Mostly this will be the victim Earth Station but for uplinks you can choose to look at the interfering Earth Station instead.
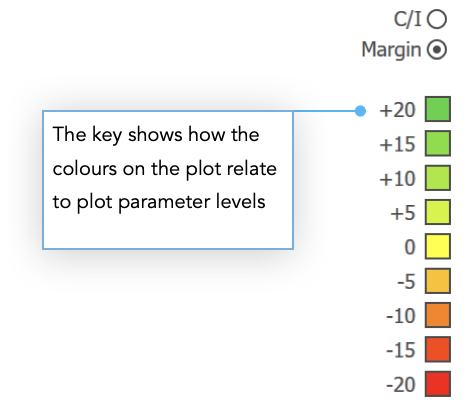
Try selecting Required Dish Size. In our example the plot is a uniform colour and the colour key tells us this is because the interference is so high that a dish size in excess of 5 metres would be required to meet the threshold.
If we change the network parameters slightly you can see more variation.
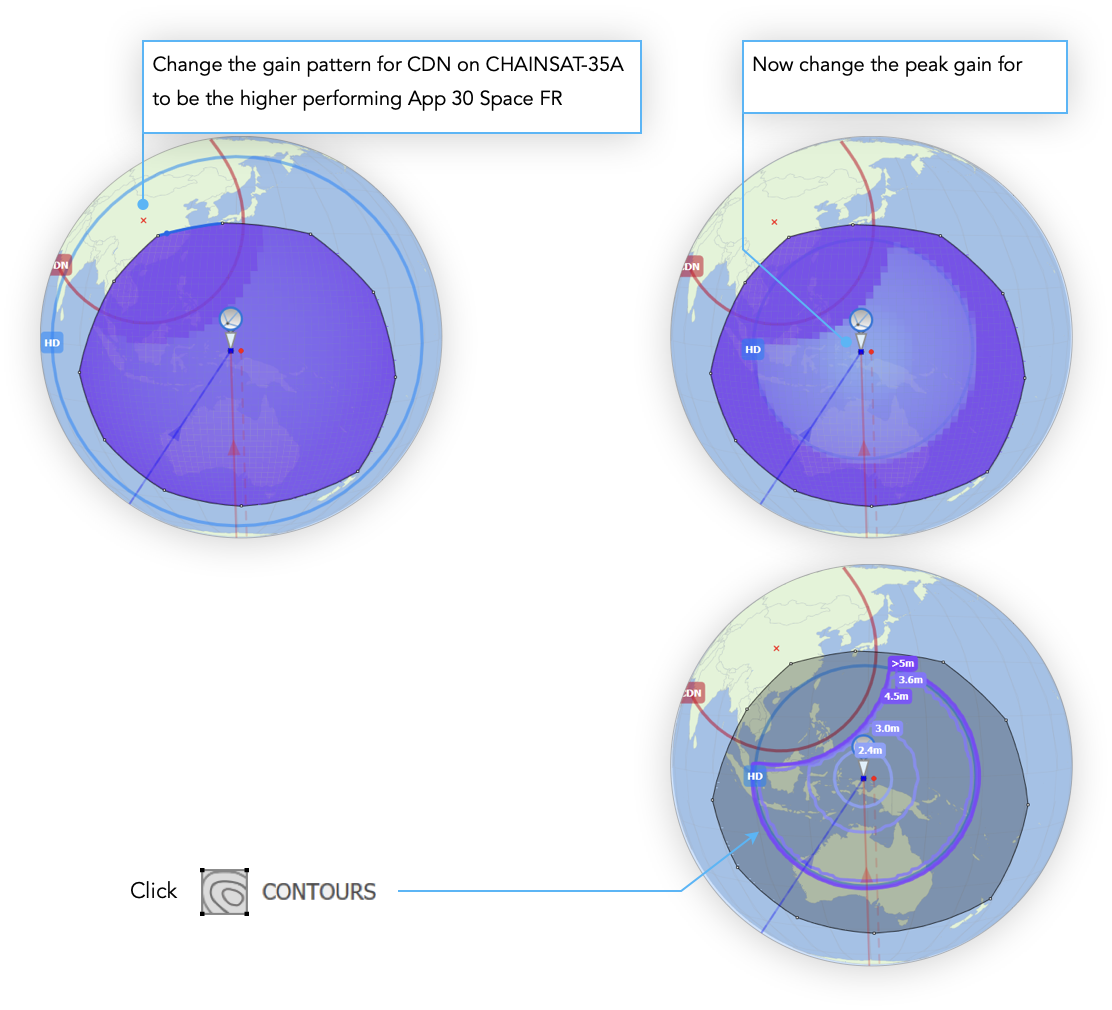
You’ll see now that within the 3 dB beam there’s an area where an Earth Station dish size of around 3m would be all that’s needed to mitigate the interference. You can get more explicit figures for required dish size by switching from a GRID to a CONTOUR plot.
If you drag the reference Earth Station to different points on the plot you should see the required dish size change accordingly on the Interference Cases pane
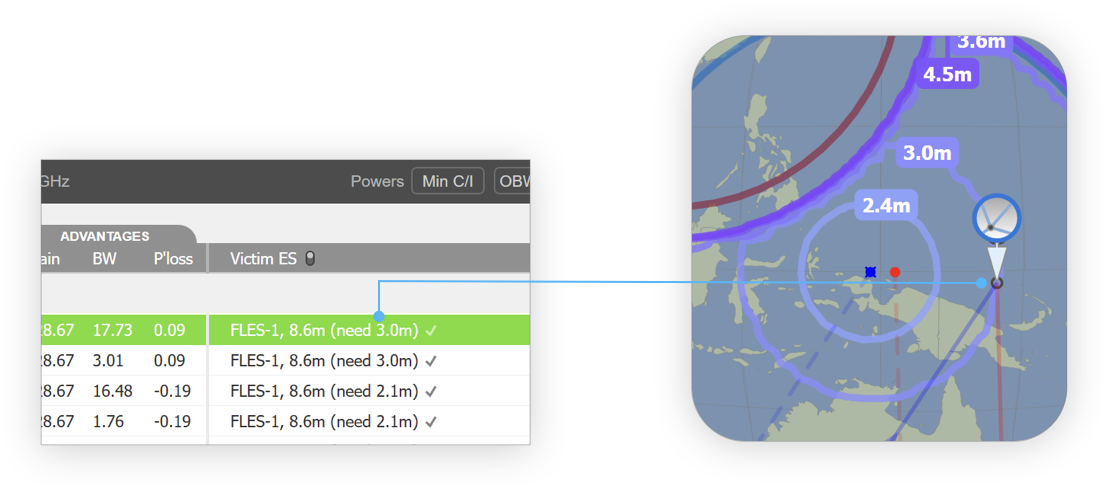
In the example above, we’ve dragged the reference Earth Station to the 3.0m contour and, as expected, the required dish size changes to 3.0m in the Interference Case.
Modifying an Area Analysis
There are a few ways you can alter an Area Analysis after it has been created. First off are detail level and transparency. These can be adjusted using the two sliders on the Analysis toolbar
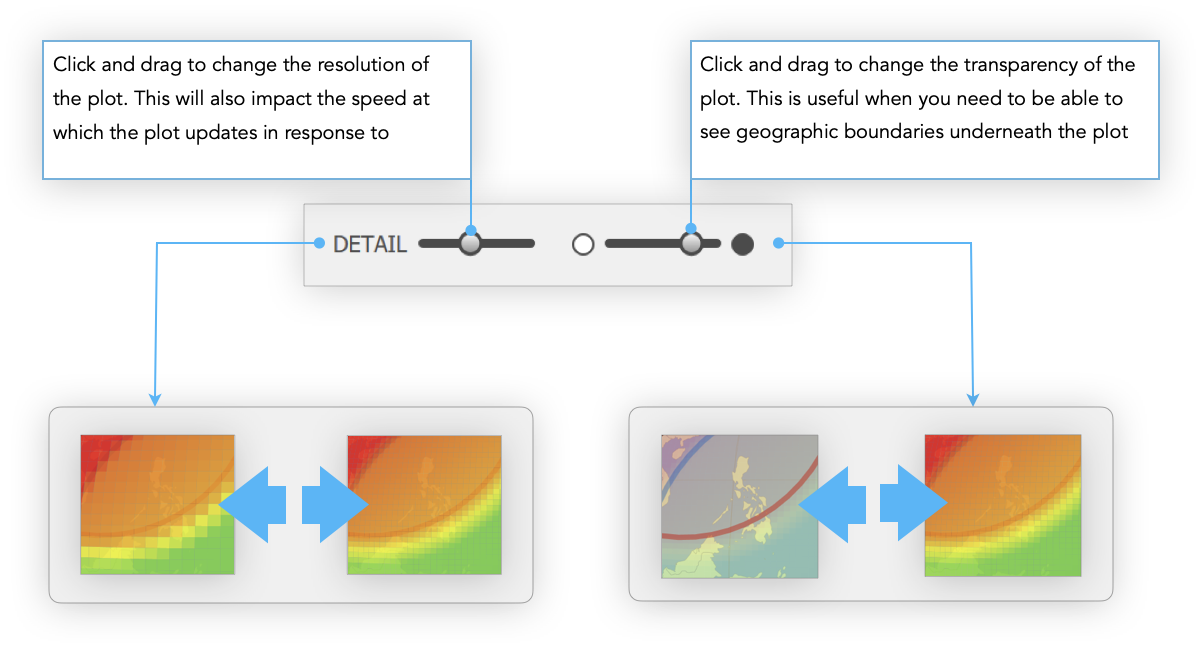
As well as the appearance, you can also change the size and shape of the Area Analysis. You can do this by moving, deleting or adding to the points that define the analysis boundary.
To Move a point
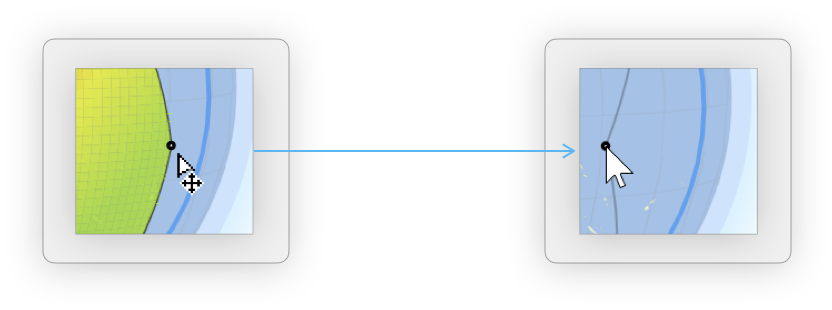
- Hover the mouse near the point you want to move until the point is highlighted and the mouse pointer changes.
- Click and hold. Drag the point to the new position and release the mouse button.
To Delete a point
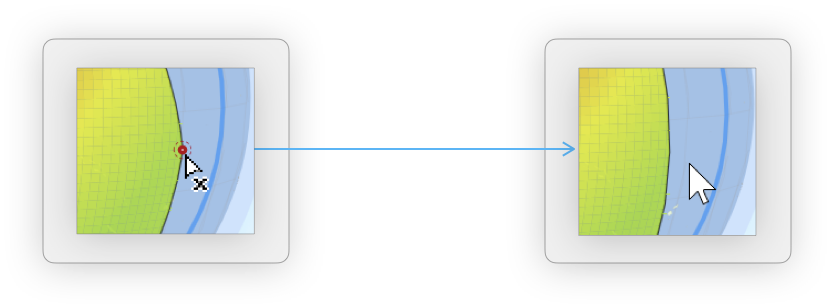
- Hold the CTRL key and hover the mouse near the point you want to delete until the point is highlighted in red and the mouse pointer changes.
- Click the mouse button to delete the point
To Add a point
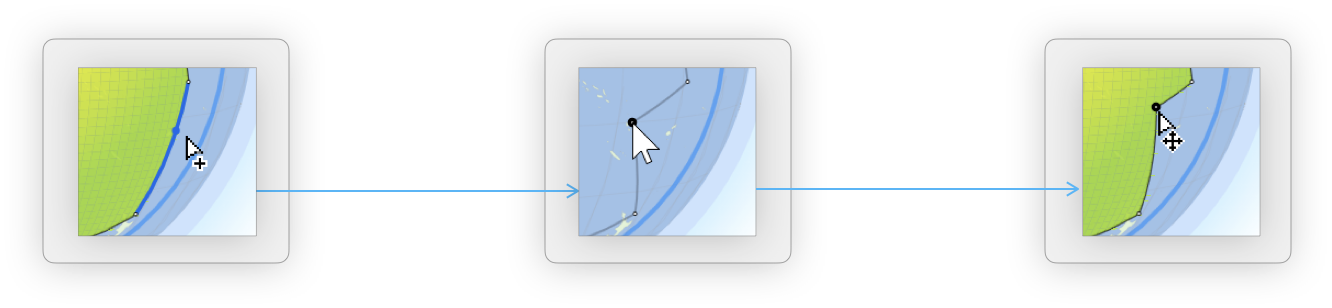
- Hover the mouse near where you want to add a point until the segment and potential new point are highlighted and the mouse pointer
- Click and hold. Drag the point to place it.
- Release the mouse button to finish.
Removing an Area Analysis
If you only want to hide the analysis temporarily then you can just switch it off. It can then be recalled later by selecting a plot parameter or by clicking the ‘Grid or ‘Contours’ buttons.

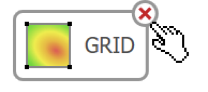
If you want to remove an area analysis permanently then click on the delete button in the top-right corner of either the ‘Grid’ or ‘Contours’ buttons
Maximise Pane
The Maximise Pane feature is also available in Detailed Coordination. See here for details on how this works.