Slot Finder
The Slot Finder (SF) is a separate tool for use in the design of new satellite networks. It can be used to locate the best orbital slot for a new satellite, one that will minimise the coordination process later down the line. All you need to do is define a network and a range of orbital slots.
For each slot, the software will calculate the number of co-frequency networks that would be within the coordination arc. The software also calculates the DT/T for each network and displays the number of networks that would fail to meet the 6% interference threshold.
For any given slot you can then go automatically to Visualyse GSO V3 and examine the interference in more detail.
Launching
The Slot Finder is launched from Visualyse GSO V3 by clicking The SF button on the toolbar or by selecting Slot Finder from the Tools menu.
Alternatively, you can click your PC’s Start menu and select Slot Finder from the Visualyse GSO V3 program group

Defining the Analysis
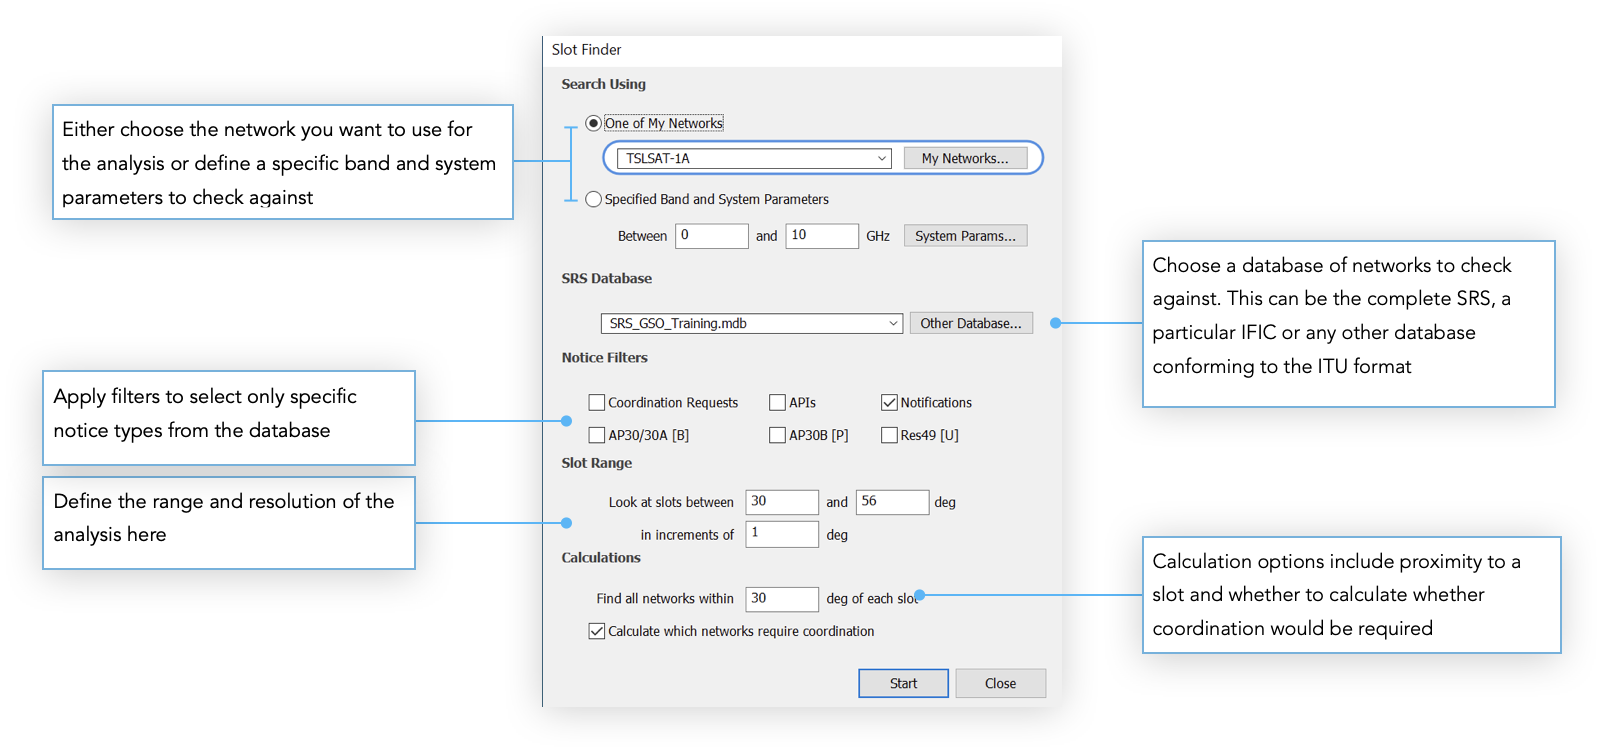
When the Slot Finder starts for the first time you will see the Start Screen. This allows you to define your analysis.
Search Network
If you have already defined a network or you know all the system parameters choose ‘One of My Networks’ then click on the currently selected network to choose a different one.

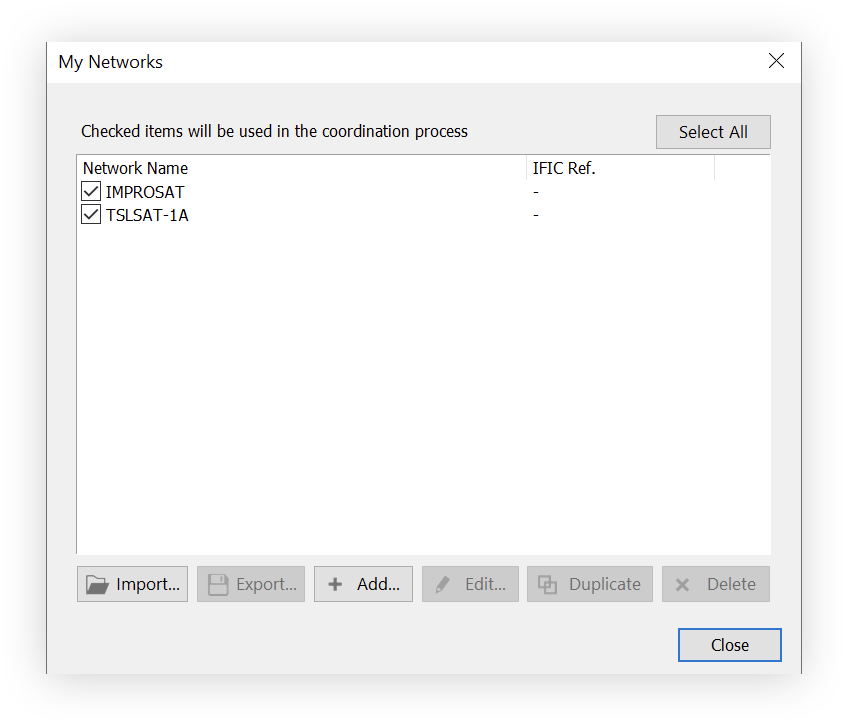
If you haven’t created any networks yet, click the My Networks button. The My Networks dialog will appear. This dialog is similar to the one in Visualyse GSO V3 and lists all the networks you have created.
Click Add to add a new network to the list, then click Edit. This will take you to the Network Editor (see the chapter on Defining a Network for information on how to use this).
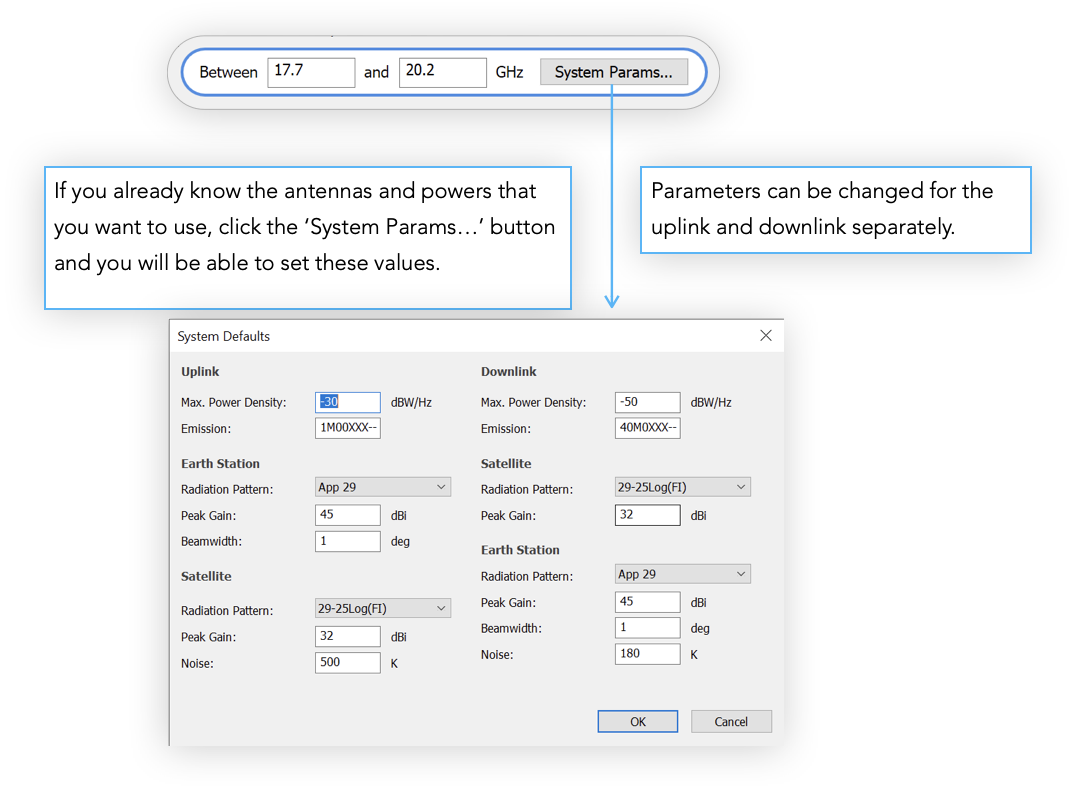
If you are at the early stages of design, you may only have a few system parameters. If this is the case, you can still use this information to perform an analysis. All you need is a frequency range. The software will use the system defaults for everything else.
To do this choose the ‘Specified Band and System Parameters’ option. Enter the frequency range
Database and Filters
Choose a database to search against. This can be the complete SRS or any other ITU format database containing networks. You can apply filters to select only specific notice types.
Slot Range
The slot range is defined by an upper and lower bound in degrees running eastward from the first longitude to the next. Longitudes West of zero degrees should be entered as negative values. Hence 30 deg West would be represent by a value of –30.
Calculations
You can define the coordination arc here. This will determine how many other networks are identified as being potential interferers. The Slot Finder will look at all networks within X degrees of a particular orbital slot where X is the size of the coordination arc that you are using.
Having determined the networks that may cause interference you can then say whether the actual interference is to be calculated. If you only want to see how many networks are within range then make sure that the Calculate box is not checked.
Once all the parameters have been filled in, click Start to begin the calculations.
Results
As soon as you click the start button the results will begin to be displayed. First the Slot Finder will calculate the number of networks that are within the coordination arc of each slot. You will see all this update in real time. The histogram bars will grow as new networks are added and the progress bar will extend.
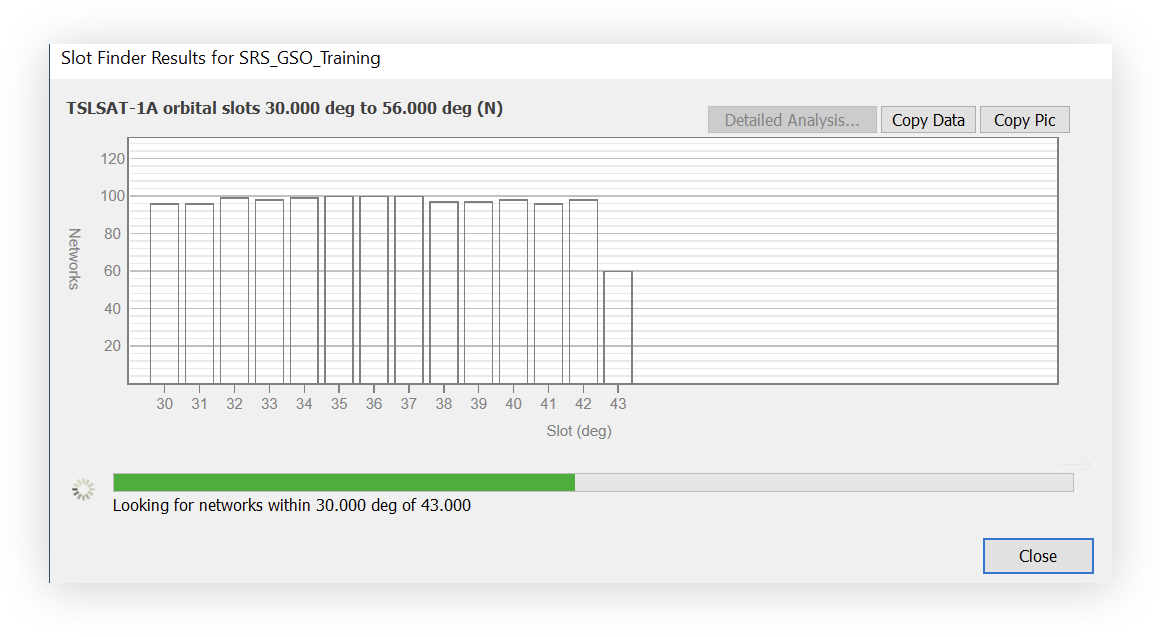
Once all the networks have been identified, if you chose to calculate the interference this process will begin. The progress bar will reset and, just as before, the results will be updated as they are calculated. A red portion on a bar indicates a network that fails to meet the interference threshold. A grey portion represents a network that does meet the threshold.
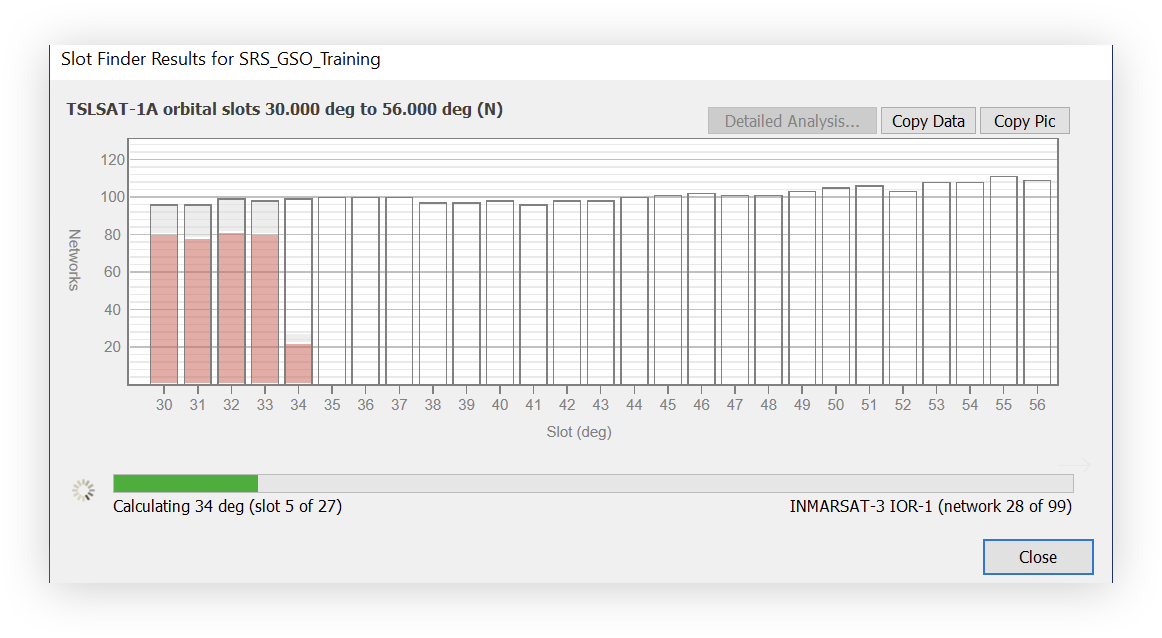
You can see from the image above that, part way through calculating the interference for the slot at 34 E, the Slot Finder has so far identified 20 bad networks and 8 good ones with 70 still to check.
When the calculations are complete the results can then be examined as a whole. Slots where less coordination is required can be identified visually. These slots can then be examined in more detail by double-clicking on them or by selecting them and clicking the Detailed Analysis button. This will take the complete analysis for this slot to Visualyse GSO V3.
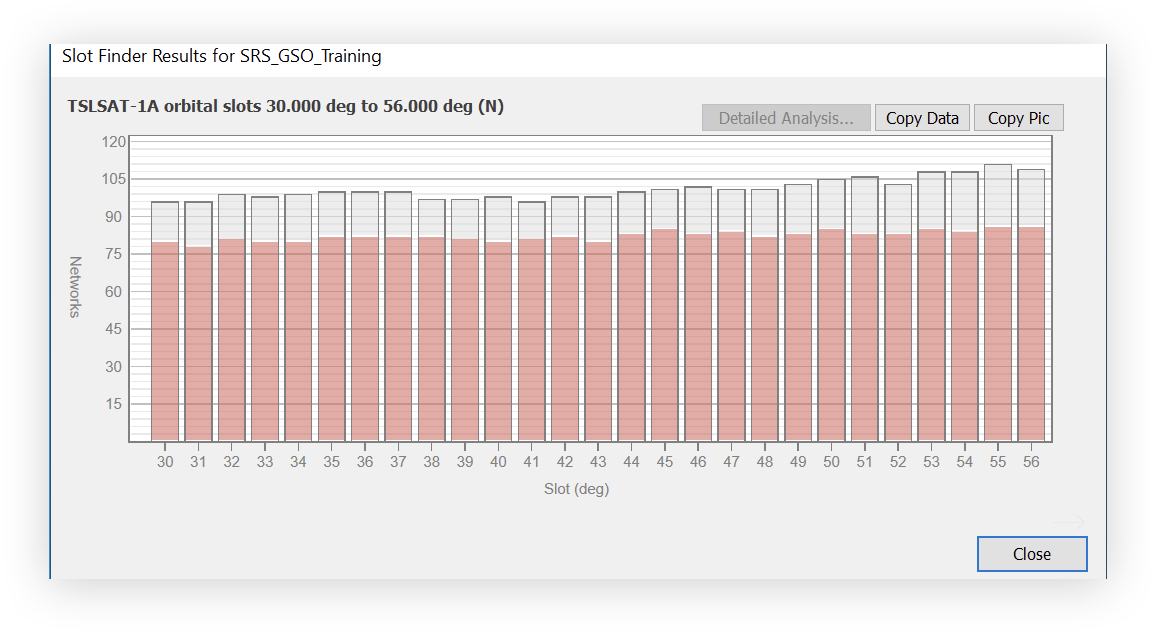
You can copy the chart data by clicking the Copy Data button. This can then be pasted into a spreadsheet like Microsoft Excel. You can also copy the chart as a picture by clicking the Copy Pic button