Digital Dividend
This section contains the following examples:
This section considers issues relating to the so-called “Digital Dividend”, the release of spectrum in parts of UHF as analogue TV is switched off. This could be used for a variety of purposes, including mobile applications such as IMT-2000, WiMAX, and DVB-H. However, these cellular like services could cause or suffer interference with broadcasting applications, and so there has been a request for studies by the ITU under WRC-11 Agenda Item 1.17.
The examples are based around sharing scenarios between digital TV and mobile applications – and in particular between fixed TV receivers and IMT-2000 services. Others scenarios could be considered and we would be happy to discuss this further. There are also sharing scenarios involving other services – such as aeronautical radionavigation – for which there could be examples in other sections of this document.
3G into DVB Punched Holes
| Action: | None |
| Modules used: | Terrain, IDWM |
| Terrain regions: | South Wales |
| Frequency band: | UHF |
| Station types: | Broadcasting, Mobile |
| Propagation models: | ITU-R Rec.P.1546, ITU-R Rec.P.452 |
This example considers the impact of a mobile network working in an adjacent band to a broadcaster. It considers a 1 kW local in-fill transmitter in the South Wales part of Britain transmitting DVB-T on channel C63, i.e. a frequency of 810 MHz. In the adjacent channel C64, i.e. a frequency of 818 MHz is the downlink or base station transmit part of a 3G / IMT-2000 network.
The analysis identifies the locations where interference from the adjacent mobile operator would cause interference into a fixed TV receiver. The analysis takes account of all the key factors including:
- Terrain and land-use data: we have loaded the relevant terrain data and (where available for copyright reasons) the land-use data to derive clutter loss
- Propagation models: we have used ITU-R Rec.P.1546 for the calculation of the broadcaster’s wanted signal, using a location variability of 95%. For the interference path we have used ITU-R Rec.P.452 due to its detailed modelling when terrain data is available. We have a library of other ITU-R models including P.1812 and generic models such as Hata and dual slope.
- Gain patterns: we have modelled the fixed receive antenna using the pattern in the RRC-06 Final Acts and the base stations as having three sector antennas with downtilt of 2°. Visualyse Professional includes a wide range of gain patterns and can include measured data in table format
- Interference measures: we have undertaken this analysis using the C/N or C/(N+I) measure, but we can also calculate I, I/N, C/I, and PFD / field strength.
- Carrier shapes and net filter discrimination (NFD): Visualyse Professional undertakes a direct analytic integration of the TX spectrum mask and RX filter characteristics to calculate the NFD for this path.
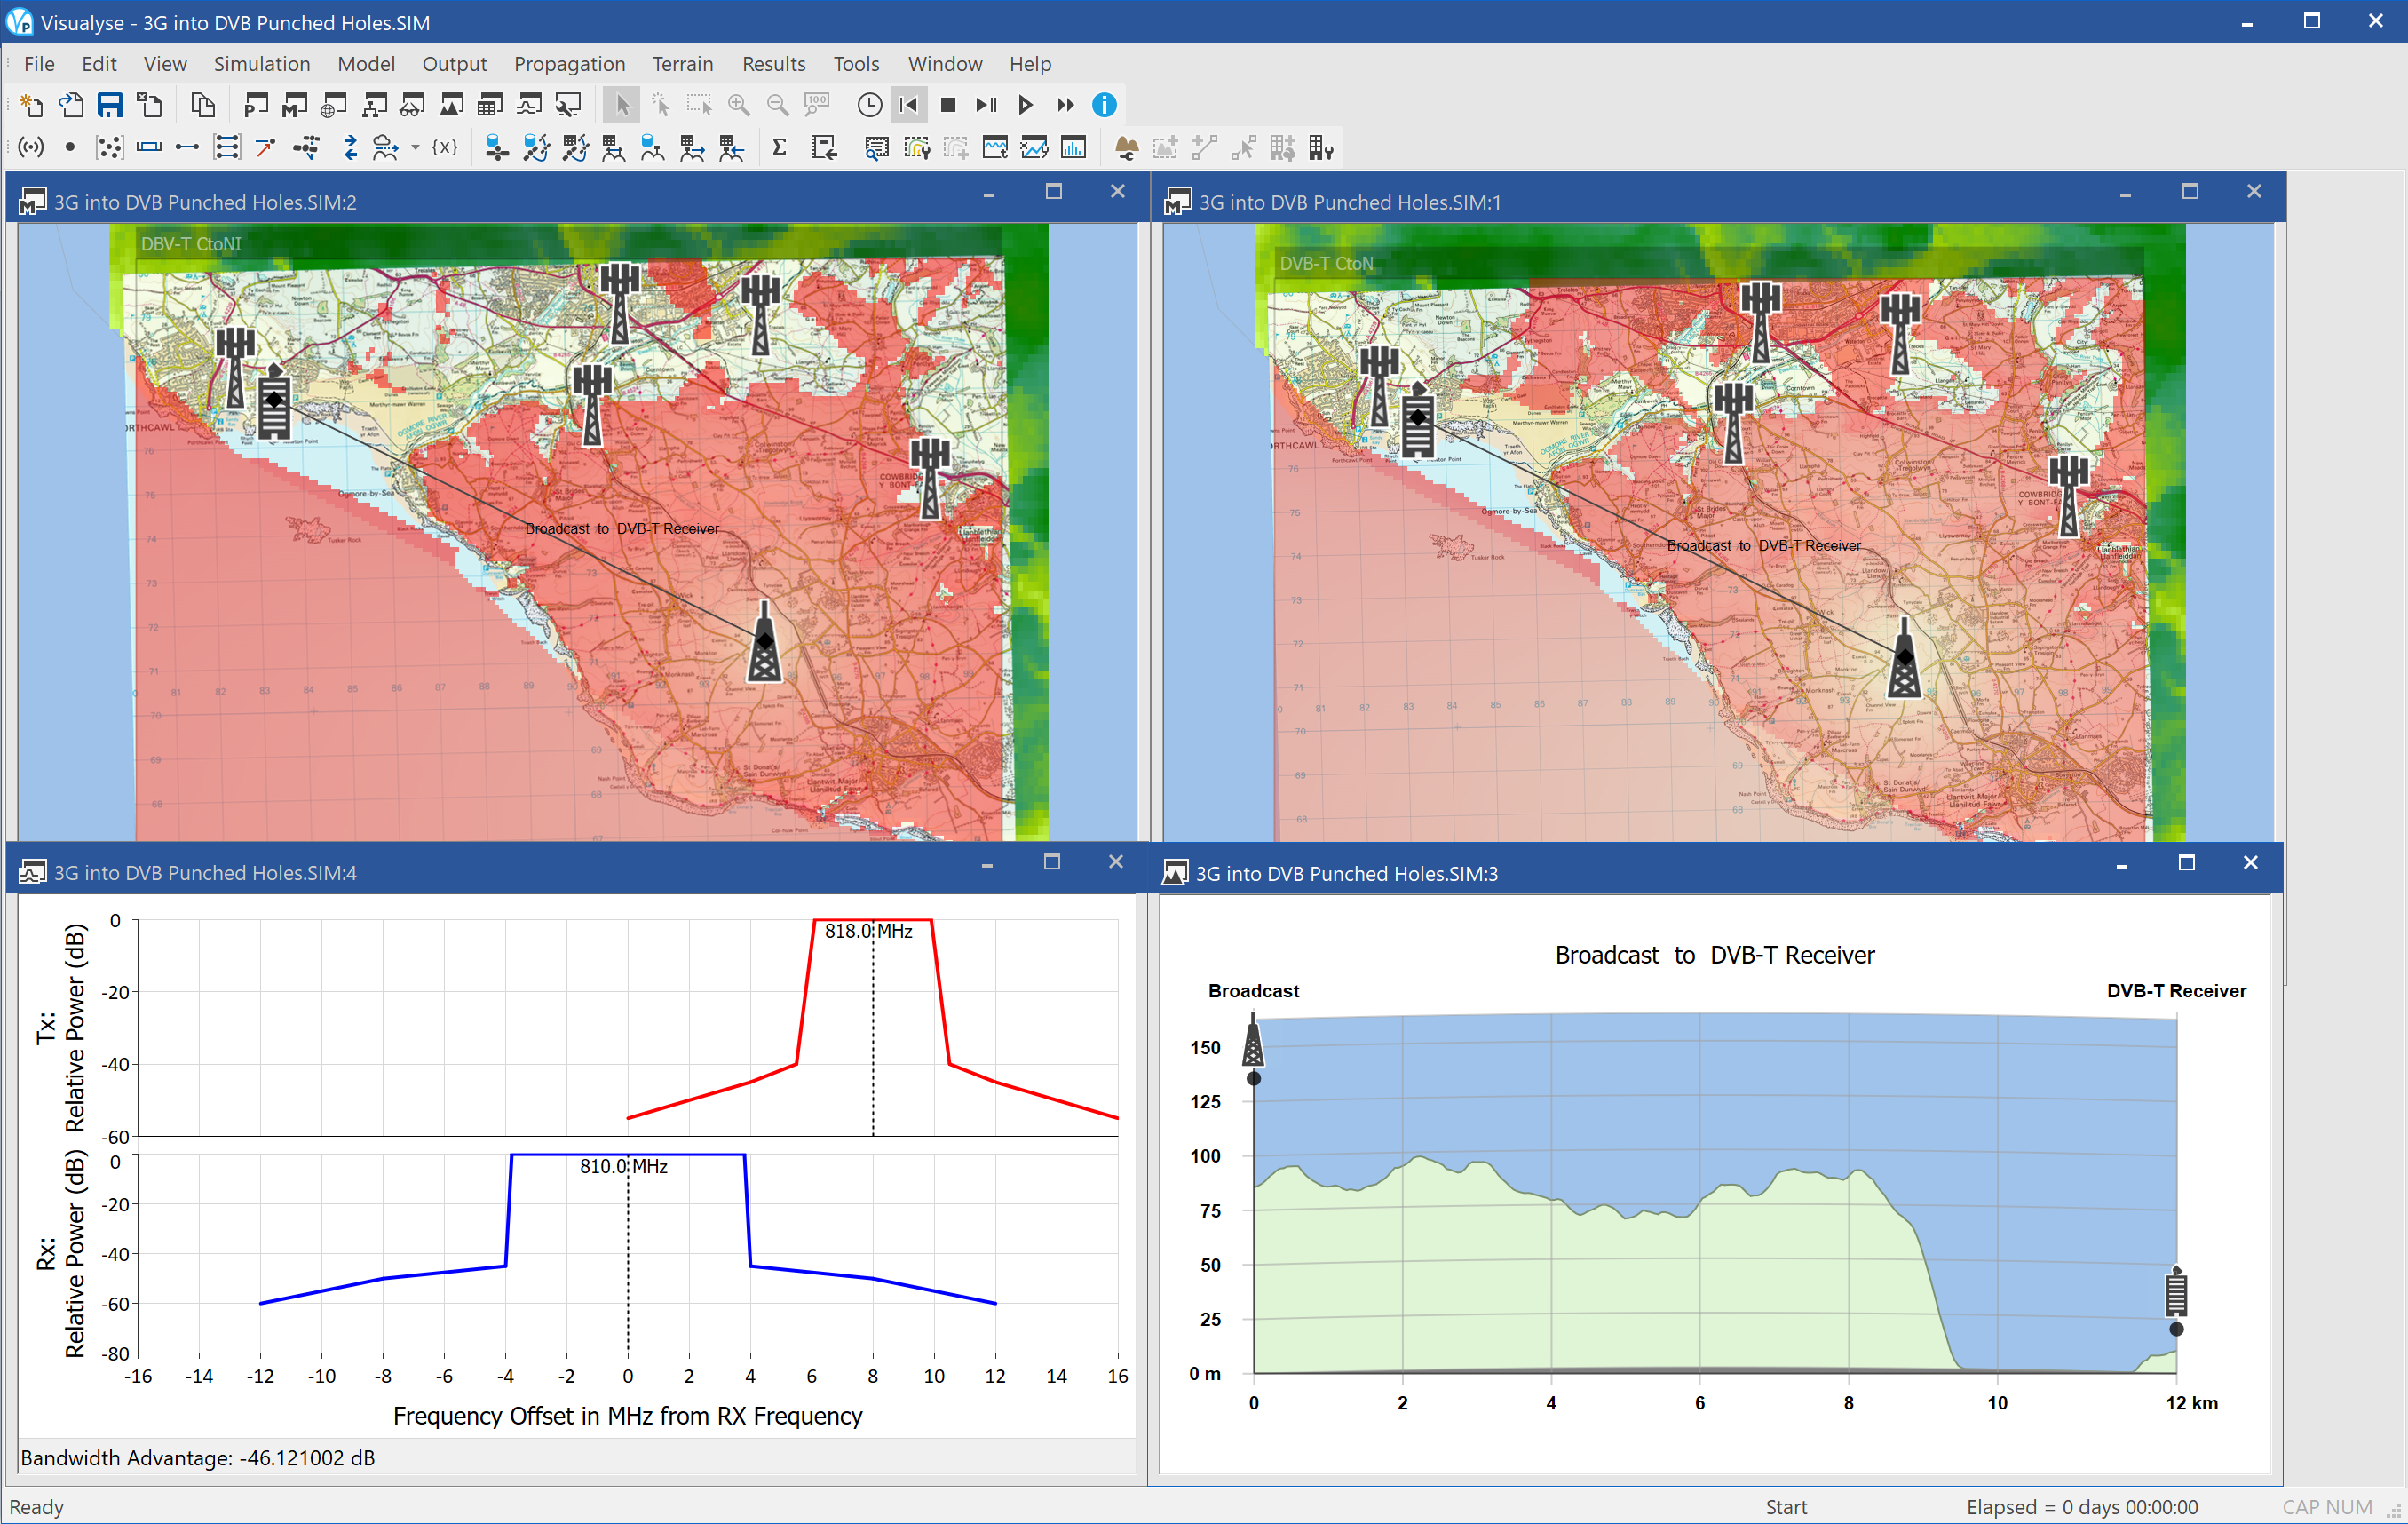
The result is a highly accurate prediction of the impact of a 3G network operating in an adjacent band on the coverage of a broadcasting network. In the screen shot above you can see four windows:
- Mercator map view (top right) showing the coverage of the broadcasting system in the absence of interference overlaid on a map and also showing the clutter database categories (where available)
- Mercator map view (top left) showing the reduction in coverage of the broadcasting system due to the “punched-holes” from the 3G network’s base station transmissions
- Frequency view (bottom left) showing the broadcasting receive mask assumed and the spectrum mask of the 3G transmitter, and the NFD calculated, around 46 dB
- Path profile view (bottom right) showing the terrain between the broadcast transmitter and the test point fixed receiver.
DVB into 3G Punched Holes
| Action: | None |
| Modules used: | Terrain, IDWM |
| Terrain regions: | South Wales |
| Frequency band: | UHF |
| Station types: | Broadcasting, Mobile |
| Propagation models: | ITU-R Rec.P.452 |
This scenario considers the reverse case to the previous example, and analyses where the mobile network’s coverage would be reduced due to adjacent band interference from the broadcaster.
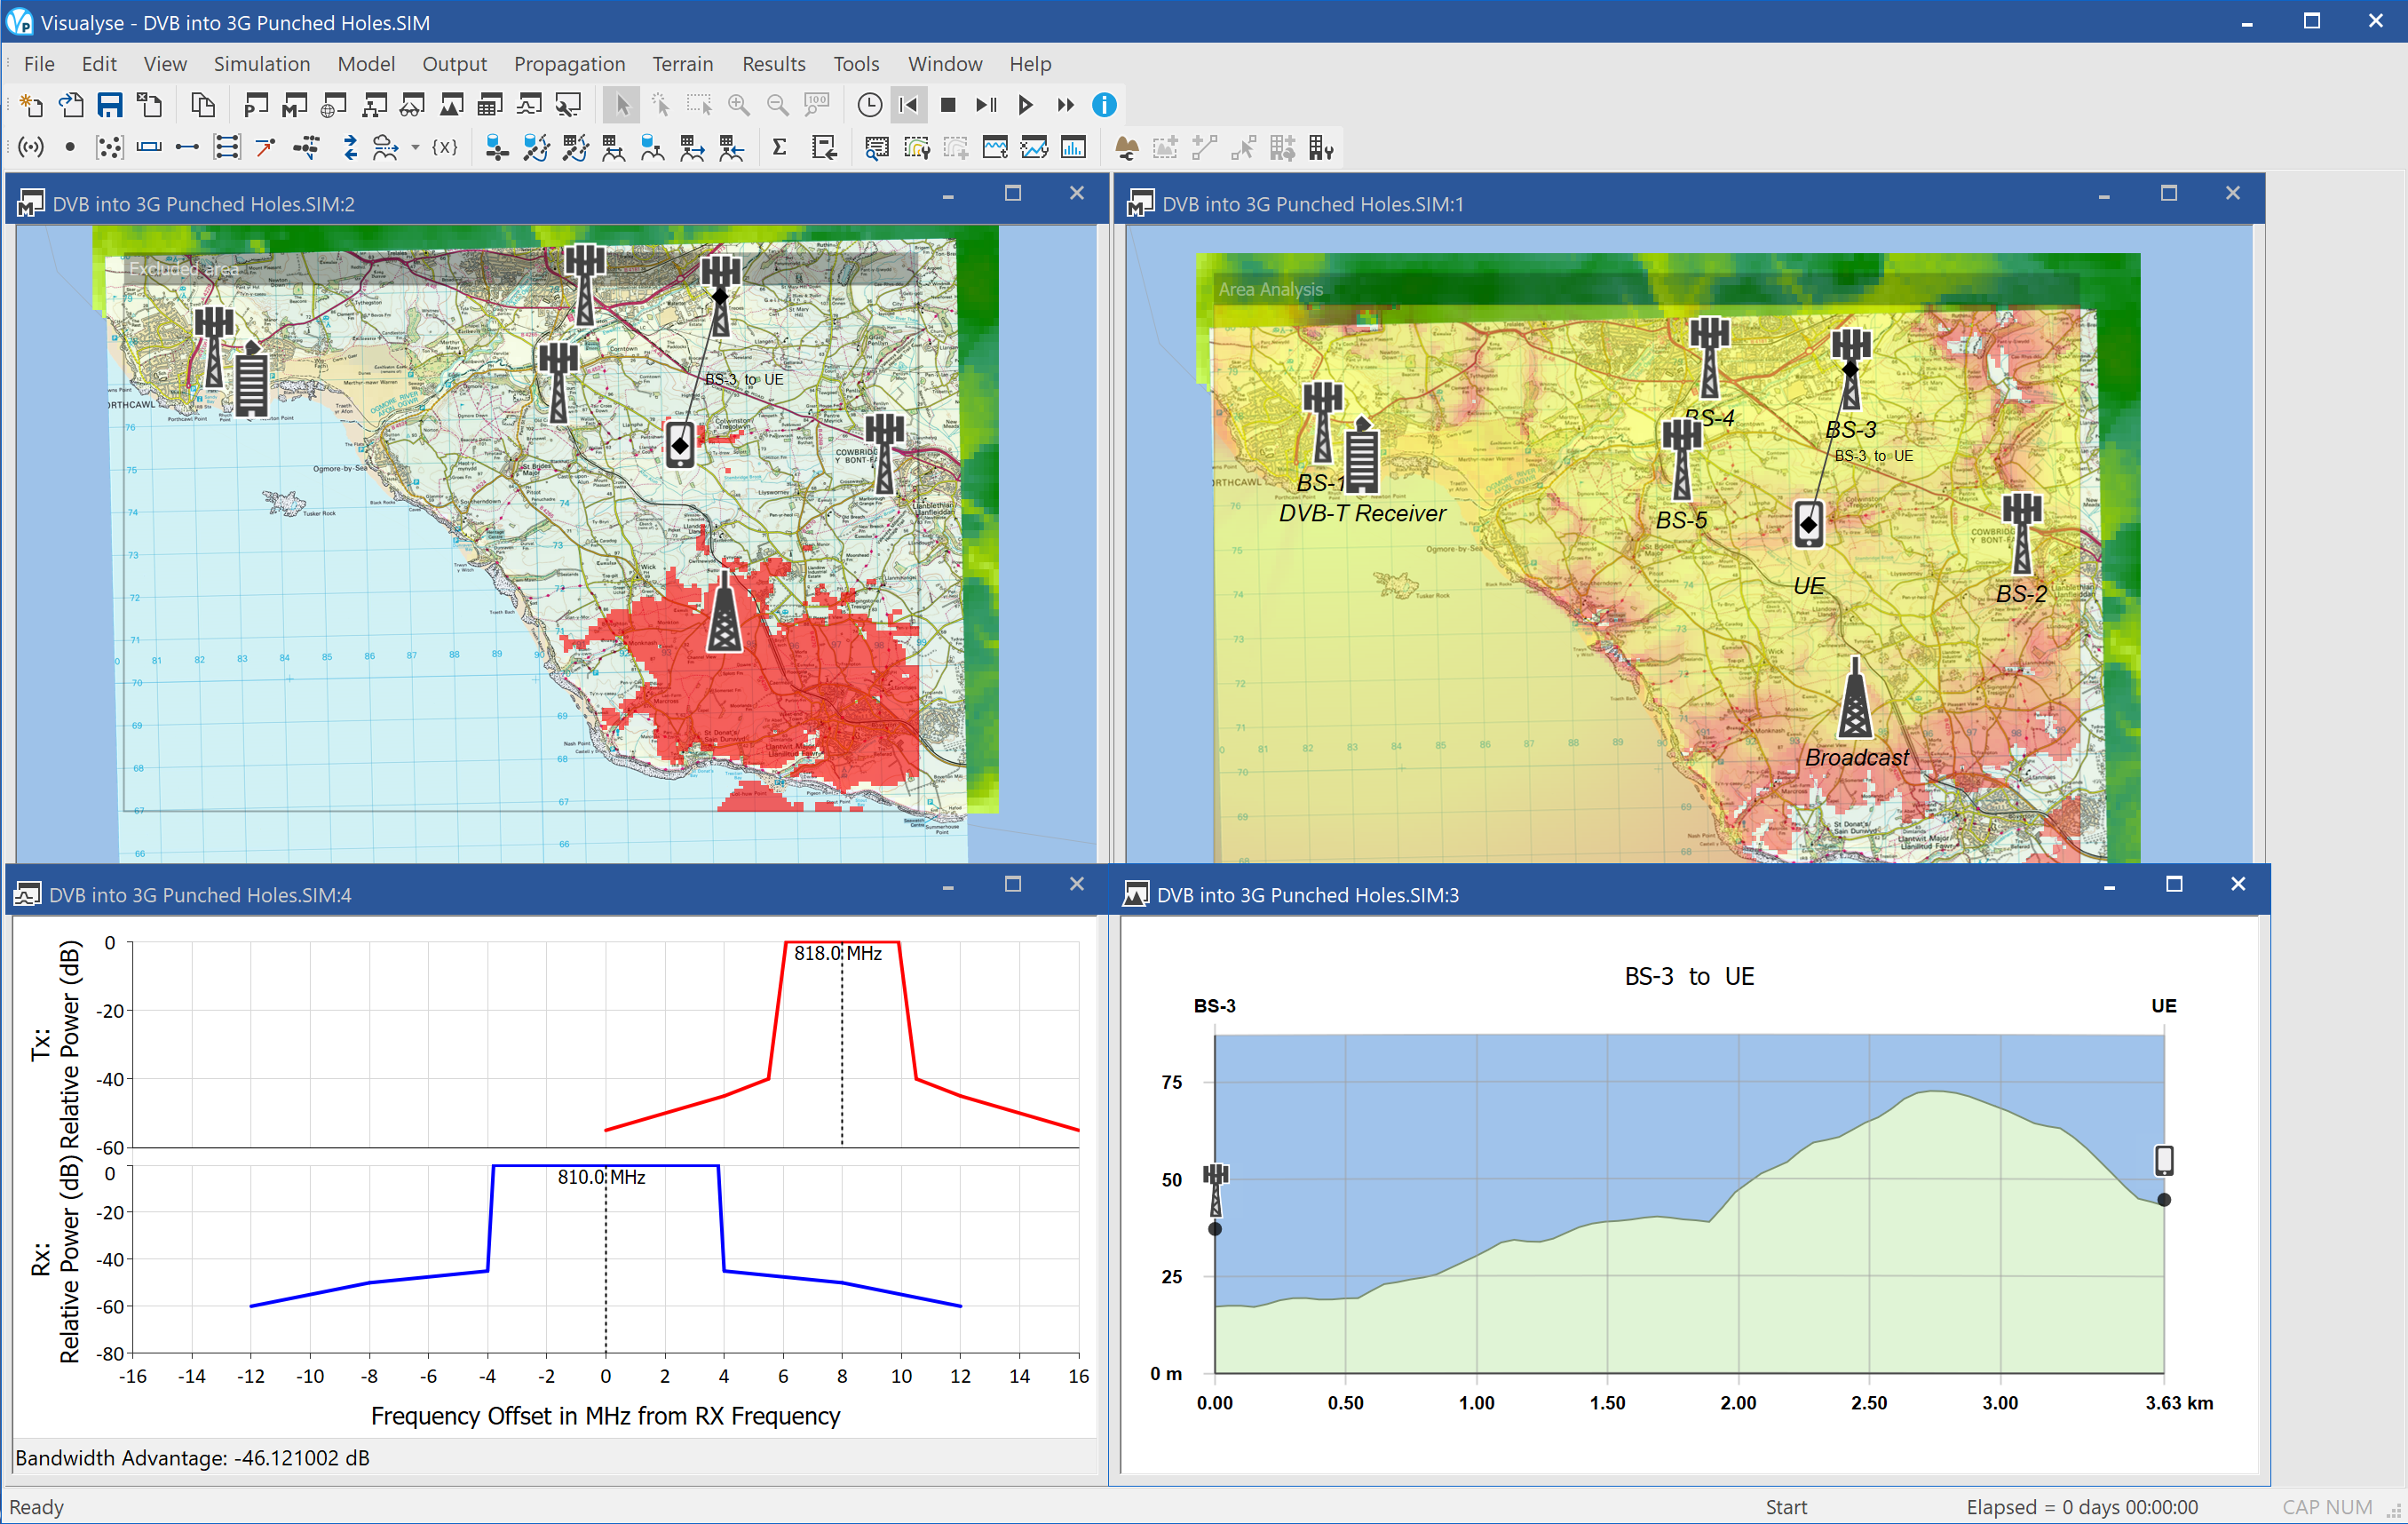
In the screen shot above you can see four windows:
- Mercator map view (top right) showing where the wanted signal of the mobile system is sufficient to provide a service, overlaid on a map and also showing the clutter database categories (where available)
- Mercator map view (top left) displays the C/I of interference from the broadcast transmitter into the mobile network, showing the “punched-hole” effect from the broadcast transmitter
- Frequency view (bottom left) showing the 3G receive mask assumed and the spectrum mask of the broadcast transmitter, and the NFD calculated, around 46 dB
- Path profile view (bottom right) showing the terrain between one of the base stations and the test point UE.
It can be seen that the higher power broadcast transmitter causes significant “punched-holes” into the mobile networks coverage. To maintain coverage the mobile operator would have to plan with increased number of base stations near each of the broadcaster’s transmitters. This in turn would increase interference into the broadcast network!
Monte Carlo Mobile into DTT Fixed Receive
| Action: | Run Simulation |
|---|---|
| Modules used: | Define Variable |
| Terrain regions: | None |
| Frequency band: | UHF |
| Station types: | Broadcasting, Mobile |
| Propagation models: | Rec.P.1546, Hata / COST 231 |
The previous two examples where based upon the premise of prediction of interference between real networks – i.e. using actual locations and powers to work out the resulting coverage that can be expected.
To undertake regulatory analysis it is often useful to consider generic scenarios with generic propagation models to identify lessons that are widely applicable.
This example considers one such simulation, using Monte Carlo methods to identify the impact of a mobile network on a fixed receiver using generic propagation models.
A test area has been configured with a grid of 20 base stations of a mobile network deployed in a hexagonal grid. Each cell is assumed to contain 10 mobile users simultaneously active and transmitting / receiving. The question this file addresses is if this network operating in the adjacent channel to a DTT broadcast to a fixed receiver, what would be the likelihood of interference?
Two sub-questions are actually being addressed in this simulation file:
- What would be interference into the fixed receiver if the adjacent band was used for a mobile network’s downlink?
- What would be interference into the fixed receiver if the adjacent band was used for a mobile network’s uplink?
To address this question a fixed receiver has been deployed, and its location randomised within the central mobile network cell. Simultaneously the location of each of the 200 mobiles has been randomised within its cell. Power control is used on both the uplink and downlink and the propagation models used are:
Hata / COST 231: base station to mobile / DTT receiver, mobile to base station / DTT receiver
ITU-R Rec.P.1546: broadcast transmitter to DTT receiver, assuming 95% location coverage and 50% of time
This form of Monte Carlo analysis produces results in the form of statistics, and in this case there are cumulative distribution functions (CDFs) of C/N, C/I, and C/(N+I) for the two cases above.
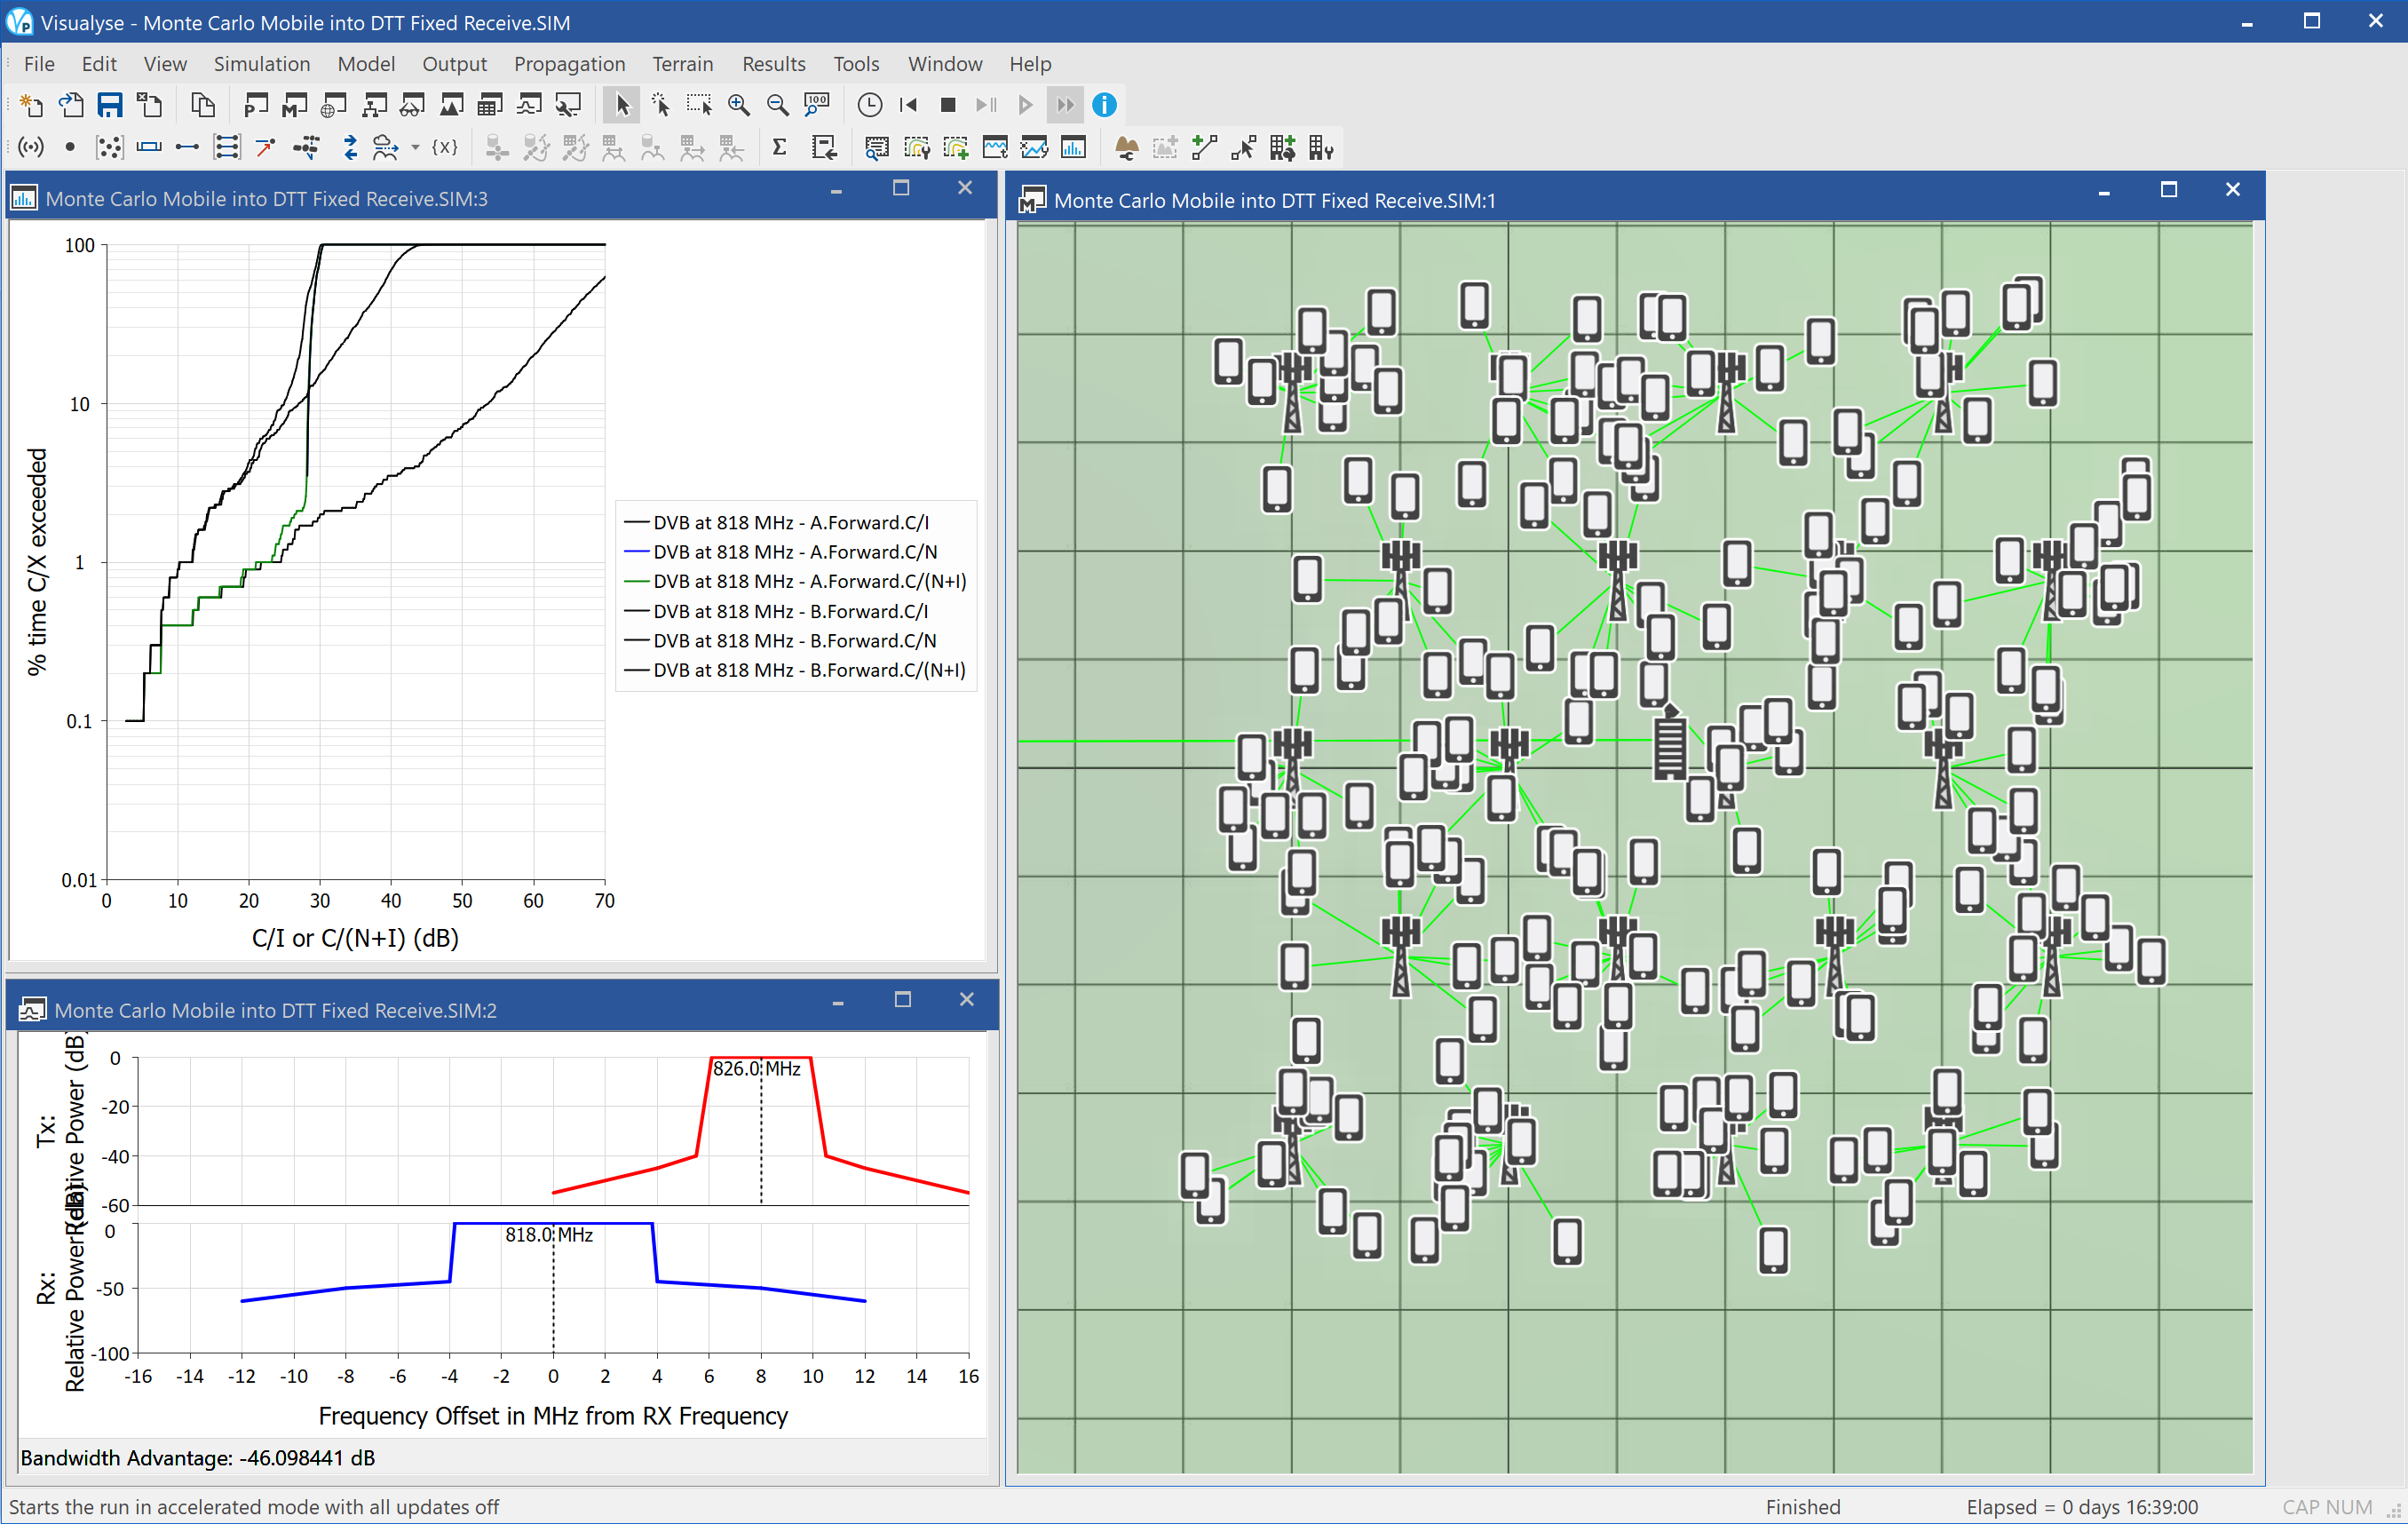
The screen shot above shows three windows open:
- Mercator view (right) showing the location of the base stations, the mobile, and the DTT receiver, and the links. A grid is overlaid with 1 km spacing.
- Statistics view (top left) showing the CDFs of C/N, C/I and C/(N+I) for each of the two cases above
- Frequency view (bottom left) showing the DVB and WCDMA carriers in adjacent channels
It can be seen that interference from the IMT-2000 downlink (BS TX) direction causes greater interference than the uplink (MS TX) direction, but both would reduce the likelihood of good reception.