Fixed planning and coordination
This section contains the following examples:
FS Import from IFIC
| Action: | None |
| Modules used: | None |
| Terrain regions: | None |
| Frequency band: | C |
| Station types: | Fixed Stations |
| Propagation models: | ITU-R Rec.P.452 |
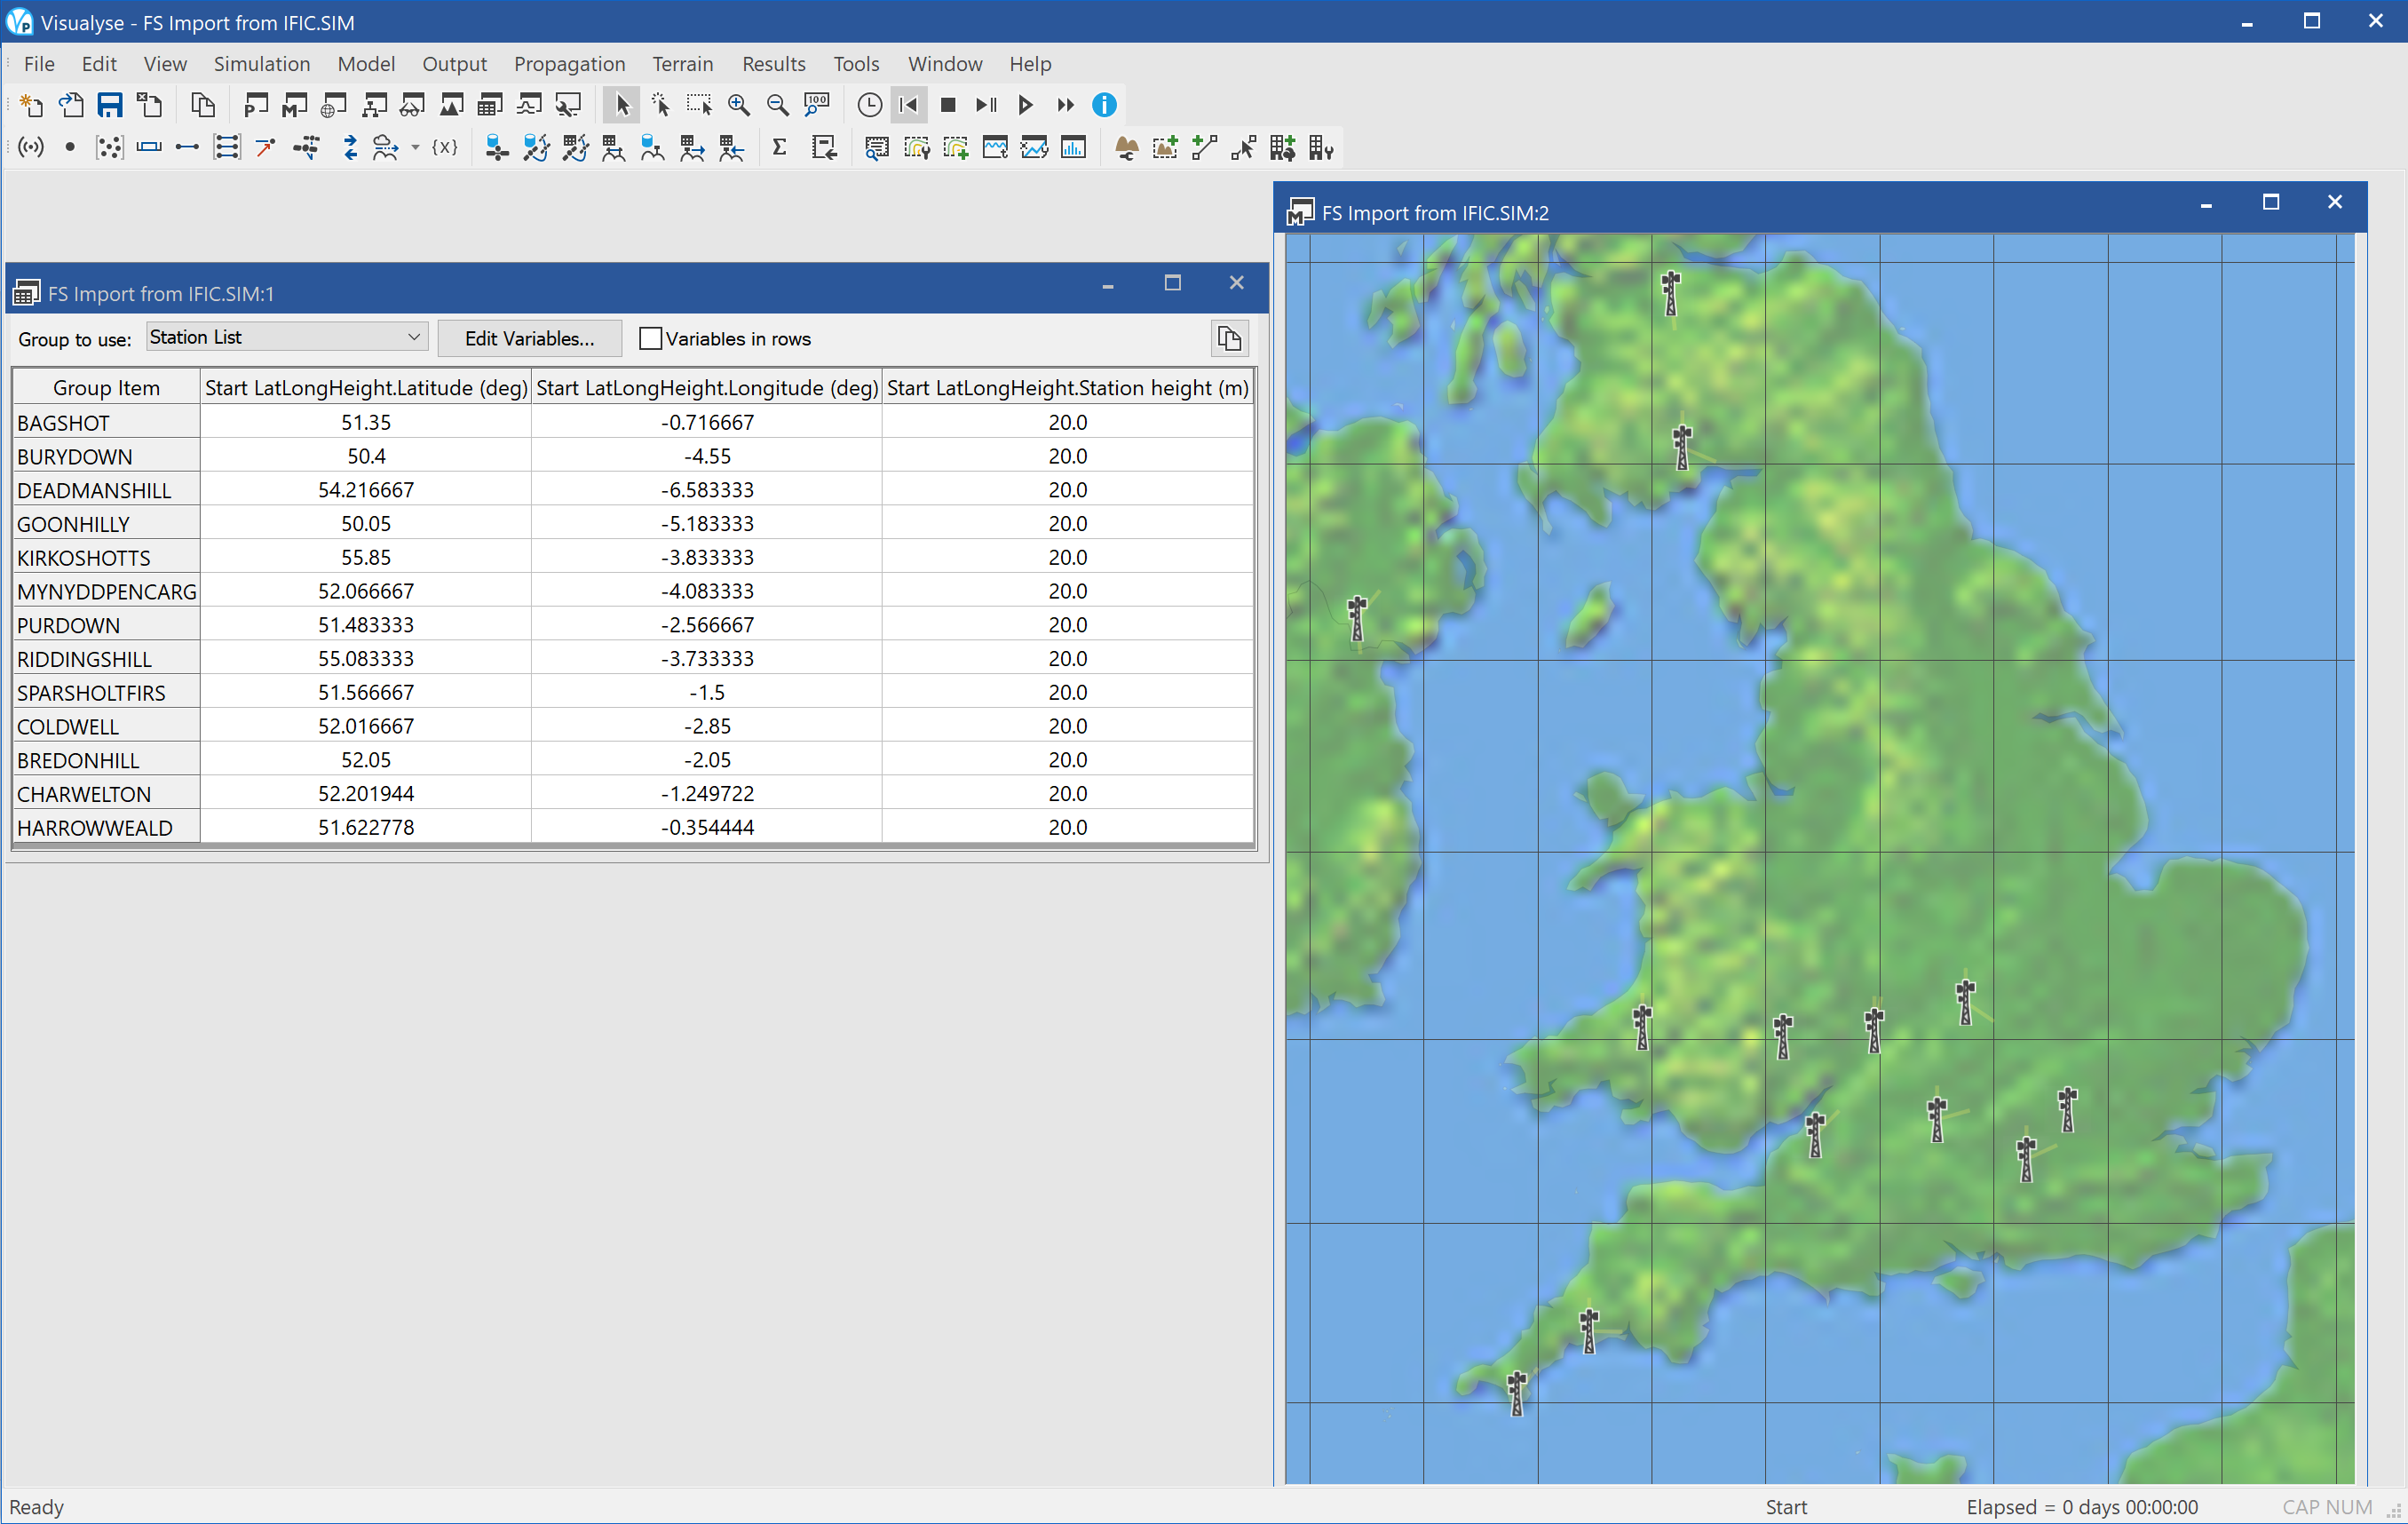
This example file shows the results of a search of the Terrestrial IFIC. The screen shot above shows the search which was of:
- Assignments in the UK (Administration code = “G”)
- Frequency between 7,000 MHz and 7,010 MHz
- Any receipt date, filing type or service
The query returned 13 FS transmitters, including their locations (latitude, longitudes), gain patterns, pointing angles, frequencies, bandwidths and EIRPs.
The screen shot above shows two windows and two dialogs:
- Terrestrial IFIC query dialog (top left) showing the options to search the database
- Terrestrial IFIC query response (middle) showing the return list of systems
- Table view (bottom left) showing the (lat, long, heights) of the returned systems
- Mercator map view (right) showing the locations of the stations and pointing angles of their antennas.
PtMP UT Deployment
| Action: | Run simulation |
| Modules used: | Terrain, IDWM, Define Variable |
| Terrain regions: | Northern Ireland |
| Frequency band: | C |
| Station types: | Earth Stations, Fixed Stations |
| Propagation models: | ITU-R Rec.P.452 |
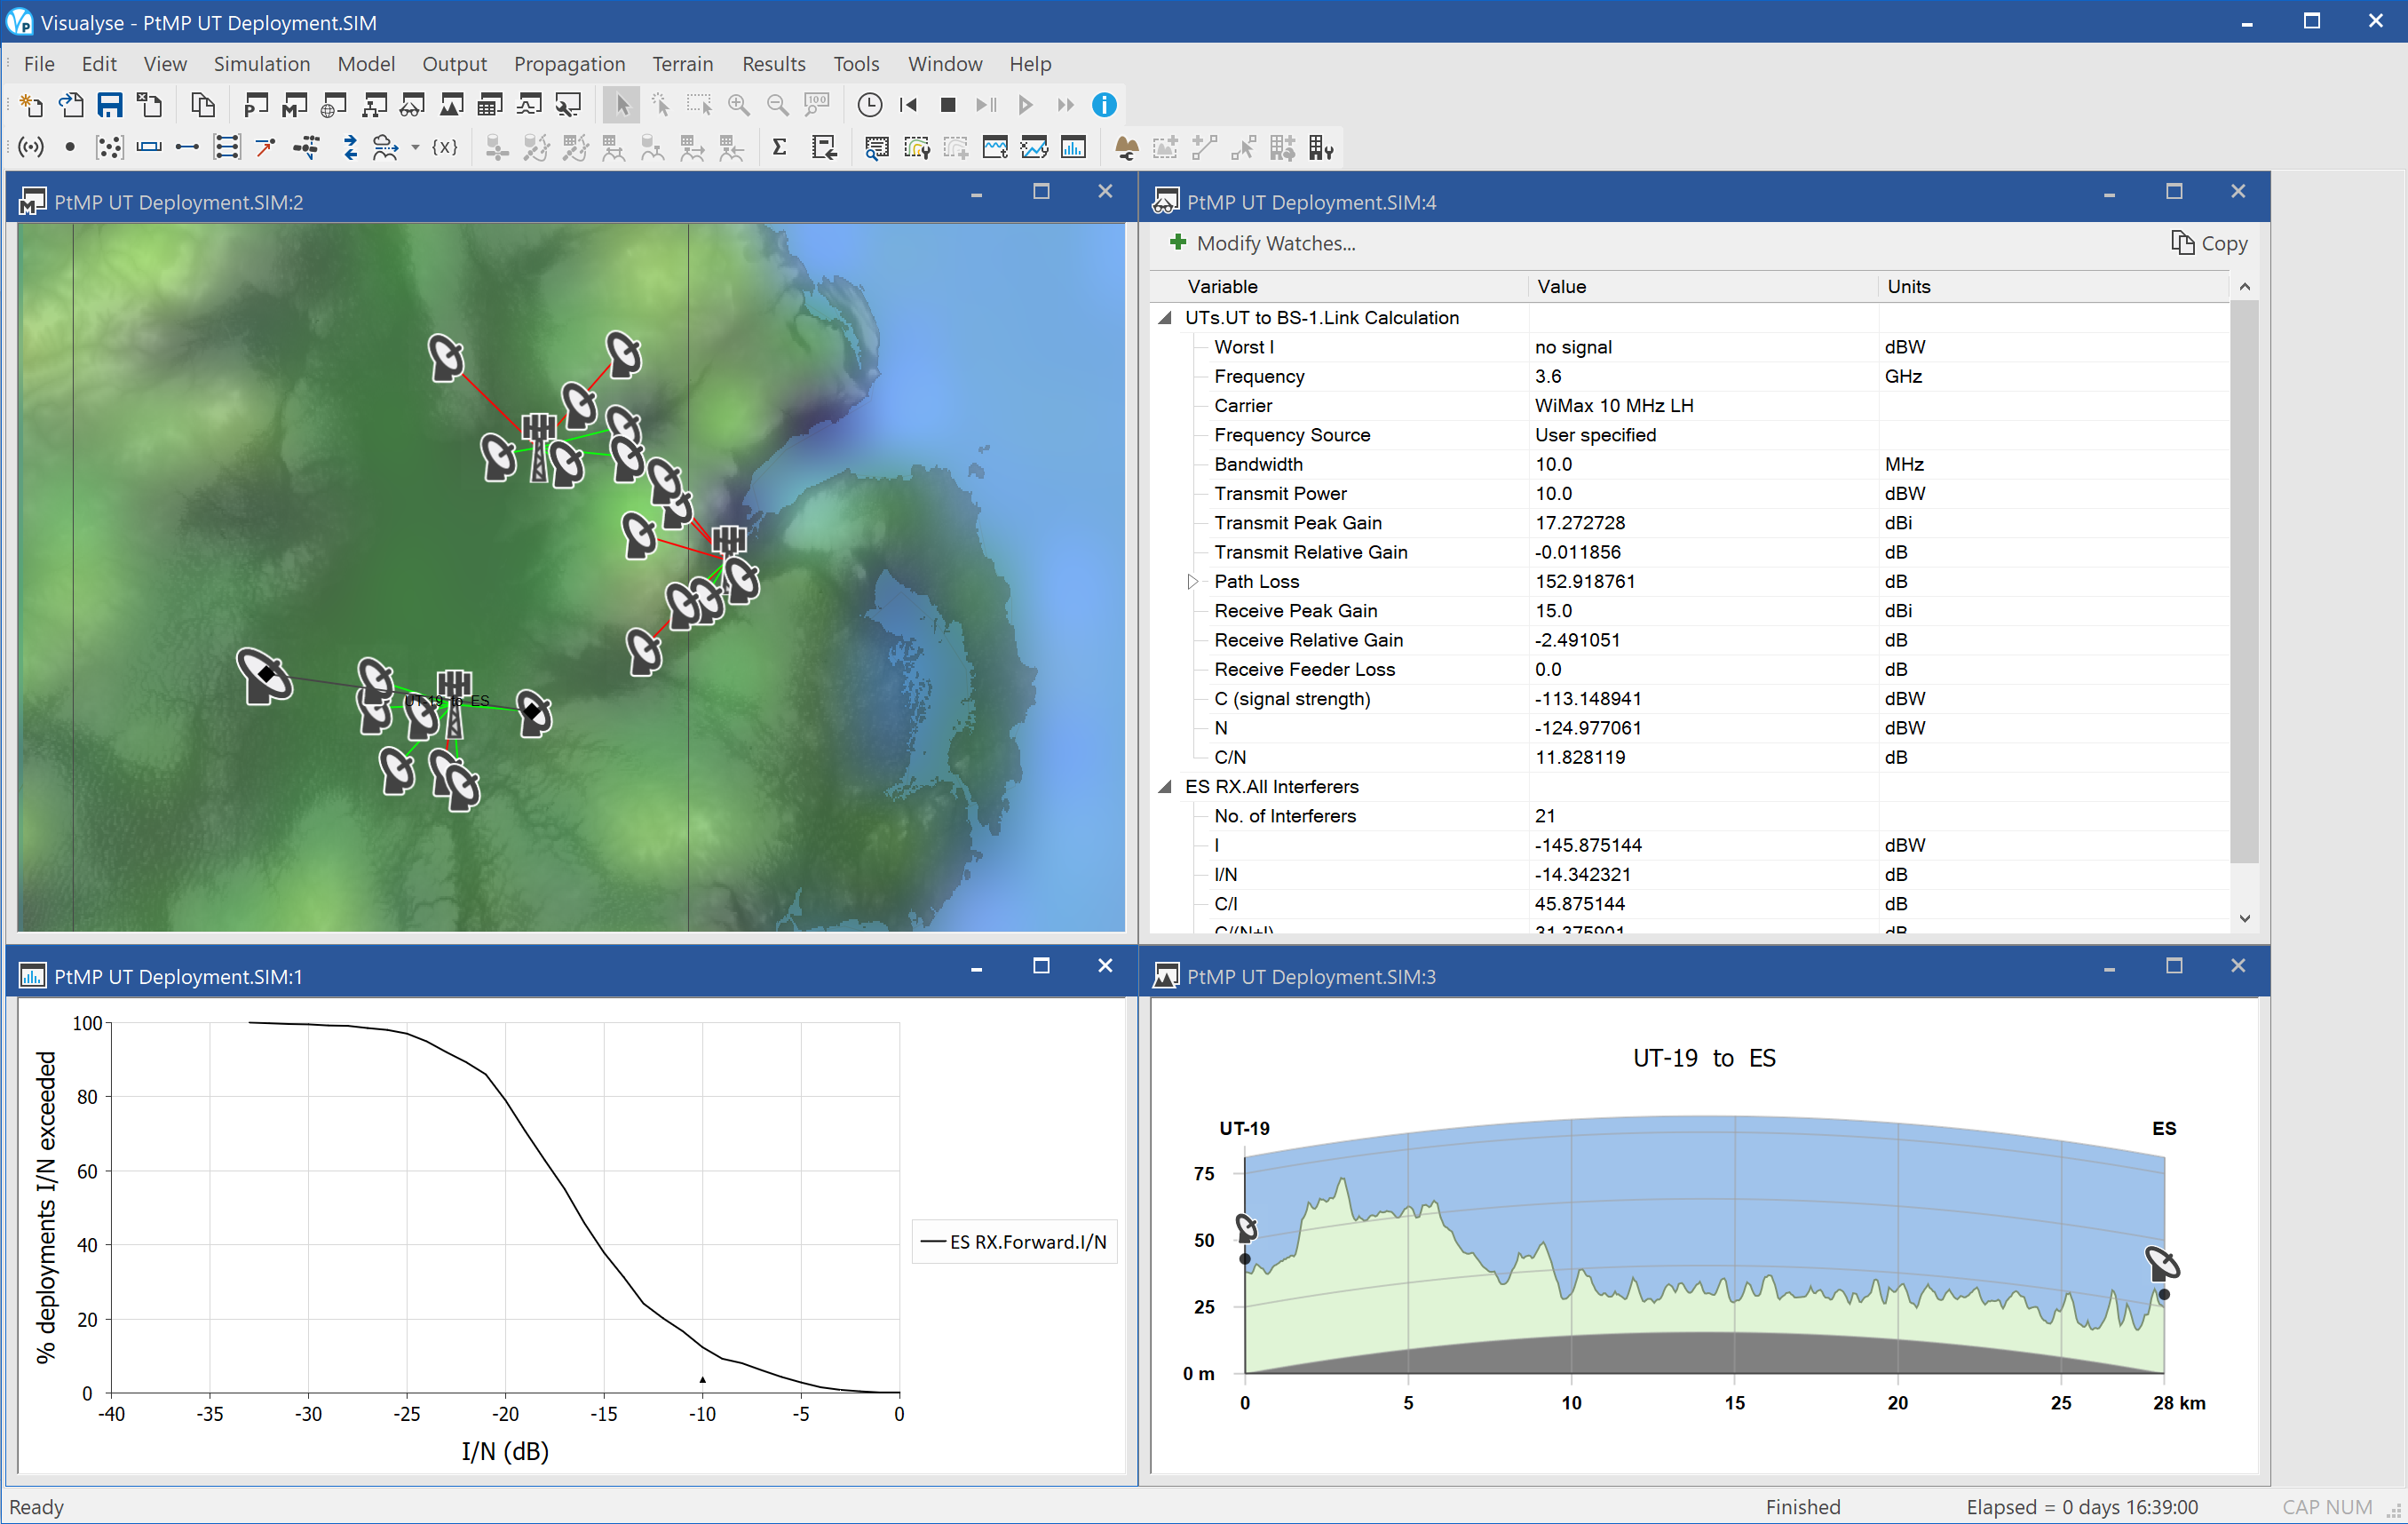
This example file shows an analysis of the impact of deployment probability on the interference that an Earth station would experience from a point to multi-point (PtMP) fixed service network.
In this scenario a PtMP operator intends to provide communication services to fixed terminals on a frequency that is also used by an Earth station to receive downlinks. The PtMP operator must ensure it protects the ES, but it does not know where it will have customers in the future.
One approach to determine the feasibility of deploying a base station at certain locations is to identify the probability that a deployment of user terminals (UTs) would cause interference.
This is done by undertaking a Monte Carlo modelling approach that randomises the locations of the UTs across the PtMP operator service area. Other factors that could vary, such as propagation, are fixed, as they would vary in the time domain and this simulation is looking at probabilities relating to deployments.
The screen shot above shows four windows open:
- Mercator view (top left) showing the locations of the base stations, the UTs, the links from each UT to its respective base station, the location of the Earth station, and the terrain overlay
- Statistics graph (bottom left) showing the cumulative distribution function of the aggregate I/N at the Earth station from each of the potential deployment configurations of UTs. Though the I/N at the ES exceeds the -10 dB threshold, the probability of a “bad” deployment is only about 10%
- Watch window (top right) showing the link budget for one of the PtMP terminal uplinks and also the aggregate interference at the ES
- Path Profile (bottom right) showing the path between the Earth station and its worst interferer
PtP link planning
| Action: | Change propagation parameters |
| Modules used: | Terrain |
| Terrain regions: | North West |
| Frequency band: | Ka |
| Station types: | Fixed Stations |
| Propagation models: | Free space, ITU-R Rec.P.530 (rain), ITU-R Rec.P.452, |
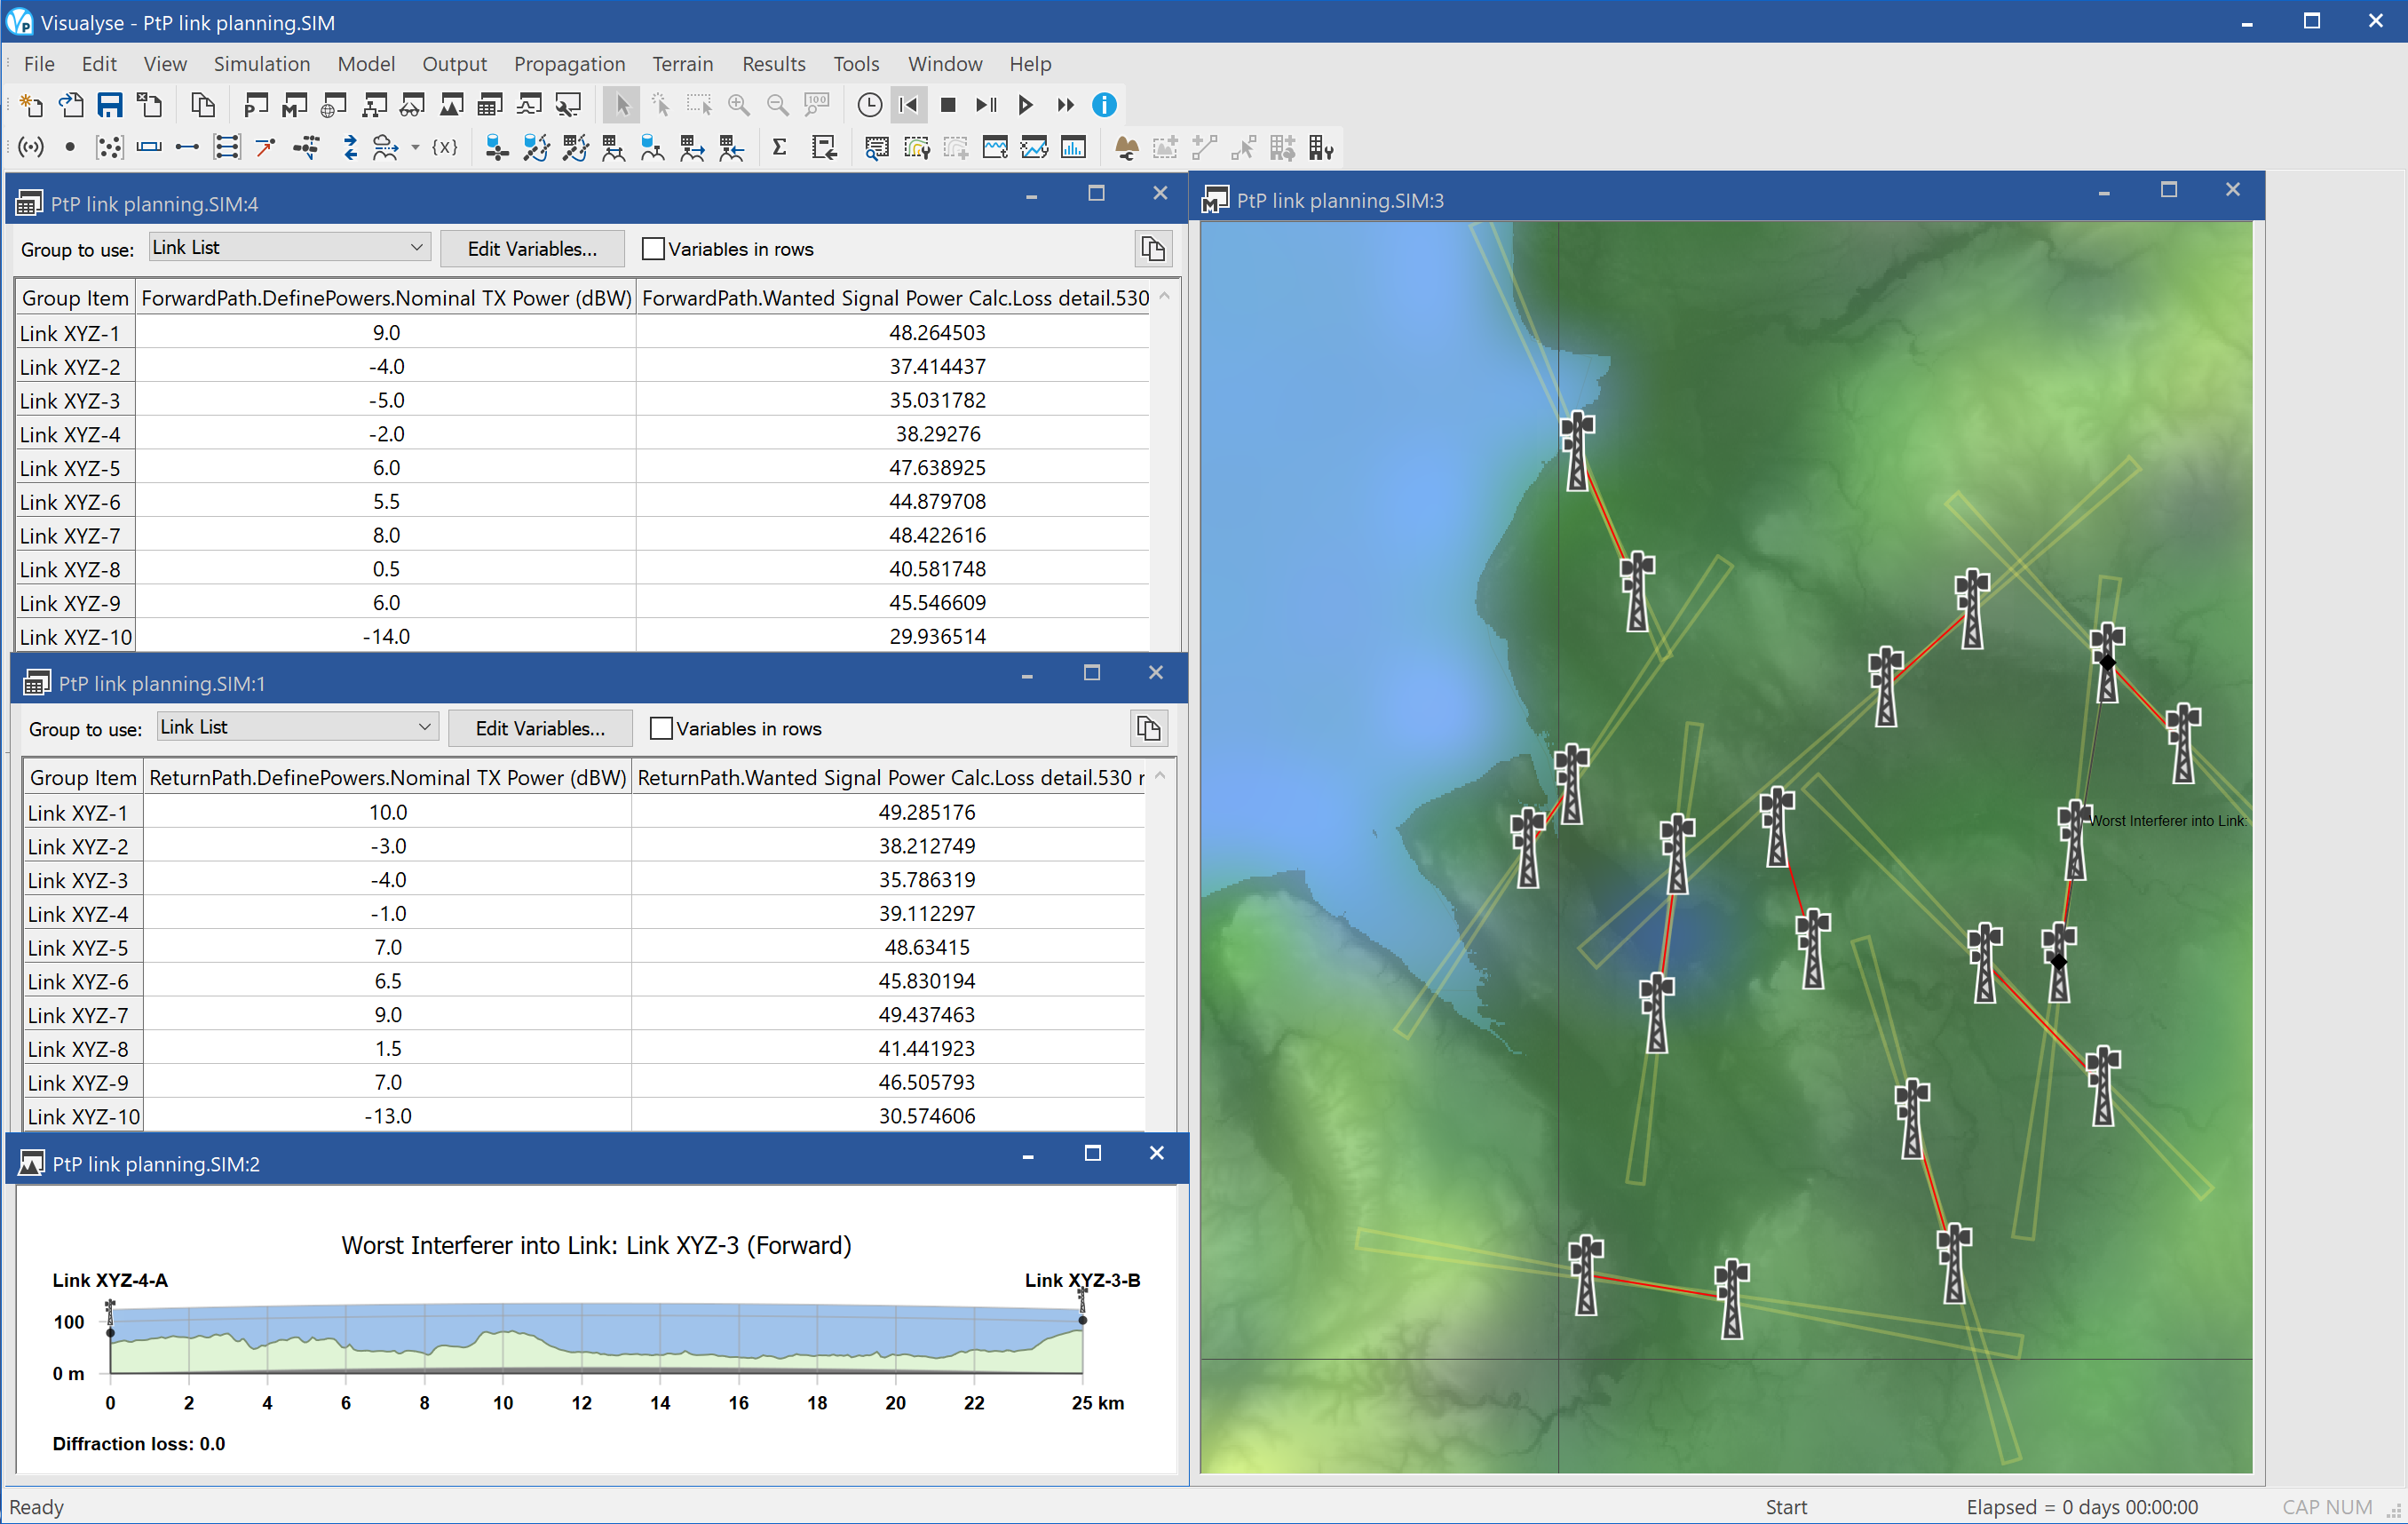
This example shows Visualyse Professional being used to support the planning of point to point (PtP) fixed links. A database of link positions has been entered – either directly or using one of:
- Fixed service import tool
- Station location import tool
All links are co-frequency within the 28 GHz band and are using a bandwidth of 14 MHz. The links have been planned using the rain fade model in ITU-R Rec.P.530-16 using the rain rates in ITU-R Rec.P.837 and a percentage level of 0.01% - i.e. an availability target of 99.99%.
The transmit power (and hence EIRP) have been selected so that the receive C/N is about 15 dB, which includes some interference and implementation margin against the target C/(N+I) of 13.5 dB. In this case we have assumed the implementation margin should be 1 dB so the target C/(N+I) is 14.5 dB.
Interference paths have been set up so that the aggregate interference from all other links into each other is calculated using ITU-R Rec.P.452 and a terrain database. As the wanted link is set to deep fade, the interfering signal is assumed to be a median 50% of time level.
The screen shot above shows four windows open:
- Mercator view (right) showing the locations of each of the FS links and with a terrain overlay
- Table view (top left) showing the TX power, rain fade, C/N and C/(N+I) for the forward direction for each of the links
- Table view (middle left) showing the TX power, rain fade, C/N and C/(N+I) for the return direction for each of the links
- Terrain path profile (bottom left) for the worst interfering path one of the fixed links
Select “Propagation | Terrestrial Fixed” and try the following the changes:
-
Analyse the median wanted signal level by changing the Rec.P.530 percentage time to 50% and the Rec.P.452 percentage time to 0.01% as in the figures below.
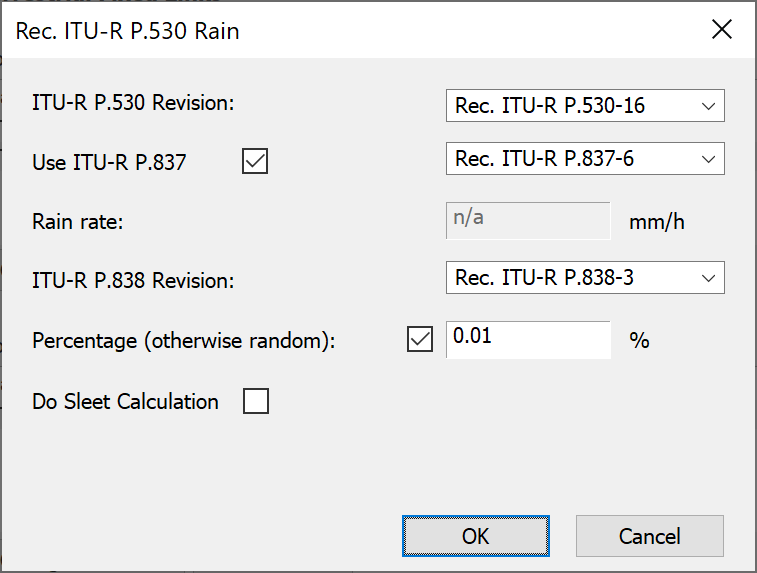
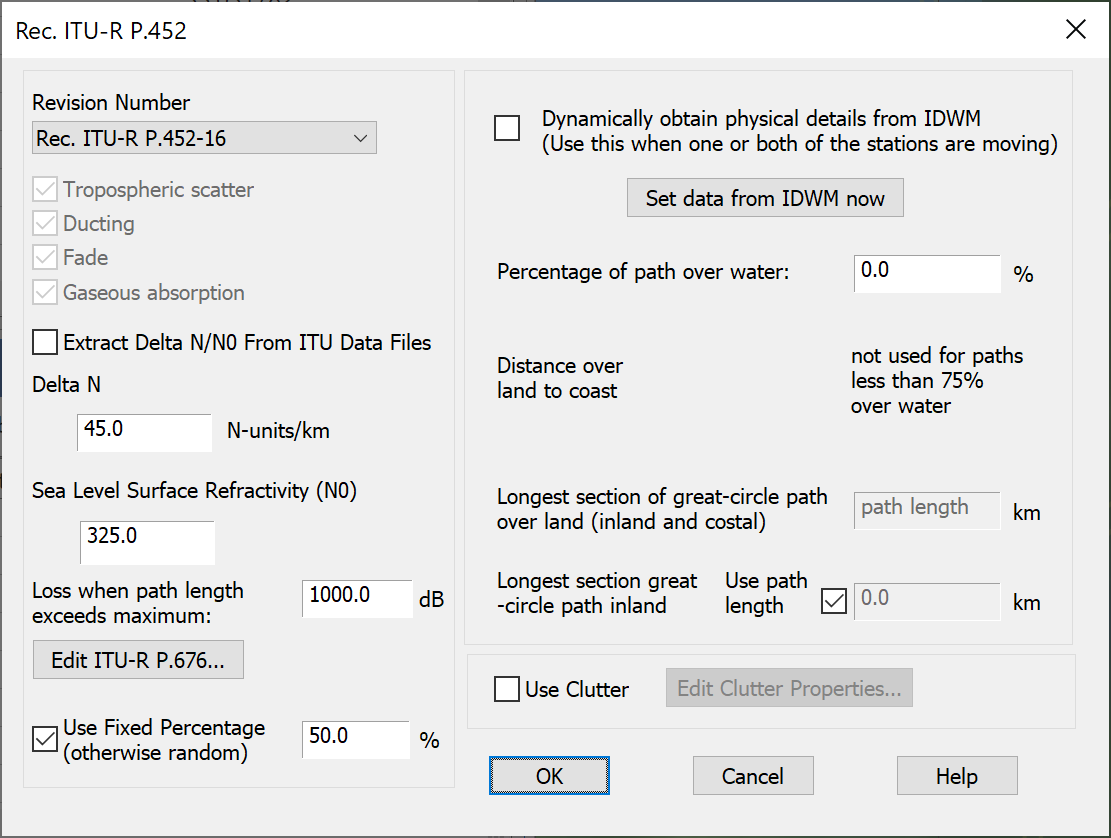
Propagation Model Changes -
Analyse the changes in ITU-R Rec.P.530-16 over P.530-11 by changing the version number – it should be quite significant! This is because the rain rates in the revised version of Rec.P.837 for these locations are much higher.