Traffic Module
Introduction
Communication links are not always active, but can switch on and off over a period of time. For example, in a terrestrial mobile system, the link between a mobile phone and the nearest base station is sometimes on and sometimes off. The state of the link depends on several factors:
-
Is the owner of the phone making a call?
-
Is the mobile phone located inside an exclusion zone where transmissions are prohibited?
-
Can the nearest base station handle the call or is it already serving the maximum number of users?
The transmit characteristics of a link can also change over time. For example, in a mobile satellite system, the transmissions from a particular satellite beam may vary in bandwidth and power. These parameters will change according to:
-
The number of handsets using the beam
-
The access method, which can be one of (CDMA, TDMA or FDMA)
-
The maximum operating bandwidth.
Variations in link activity will obviously have an effect on interference calculations. It is therefore useful to be able to model these variations. This is what the Traffic Module is all about.
What is traffic?
Traffic is just another way of saying the amount of activity on a link. This activity can, for example, be caused by:
- Fluctuations in the output from a station (e.g. data link transmissions using TDMA)
- Changes in the number of users of a stations resources (e.g. handsets using beams on an mobile satellite service network)
An example of traffic modelling can be found in the example file “Traffic and Exclusion Zones” which is in the “Others” directory. This shows a simulation where there is an exclusion zone of 5 km around a radio astronomy site and a mobile network base station operating just outside. The mobile’ locations are randomised using the Define Variable Module and the Traffic Module used to give each one an activity factor of 25%.
Modelling Link Activity
The Traffic Module allows you to model link activity at two levels.
At the basic level, you can take a Visualyse Professional link and switch it on and off. The switching process can be determined by several different methods (these are described later). The amount of traffic on the link is ignored. The link is either on or off, it’s as simple as that.
At the advanced level, links can also be switched on and off. However, when the links are on, the amount of traffic can be considered. This traffic level can vary according to time of day or a defined distribution.
Modelling at the basic level would be used for links where the traffic level does not vary or where the variations are insignificant enough to be ignored. For example, uplinks to a satellite in a fixed satellite service (FSS) system may switch on and off throughout the day. However, on these occasions the traffic will always be the same, and the link will transmit at the same power level.
Advanced level modelling would be used for links where the amount of traffic does vary. For example, in a mobile satellite service (MSS) system, the number of active handsets changes over time. This affects the power output from the server satellite and thus any interference that this may cause.
Traffic Objects and Load Links
The Traffic Module is based upon:
- Traffic object: can be used by any link to determine whether the link should be switched on or off. All you need to do is create a traffic object, configure it, and then assign it to your link.
- Load link: load links are used in conjunction with traffic objects to determine the amount of traffic on a link.
If you want to model variations in the level of traffic, you need to use a load link instead of one of the other types of link. In this case, the traffic object will also define the traffic level when the link is switched on.
Sections 6.2 and 6.3 describe these two types of objects in detail.
Traffic Objects
Managing Traffic Objects
Traffic objects are part of the simulation, stored in the .sim file, and managed via a list where they can be created, deleted, duplicated, and modified.
The traffic list can be accessed via the “Model” menu option “Traffic” or by the toolbar icon ![]()
Selecting any of these will open the traffic list, as shown below.
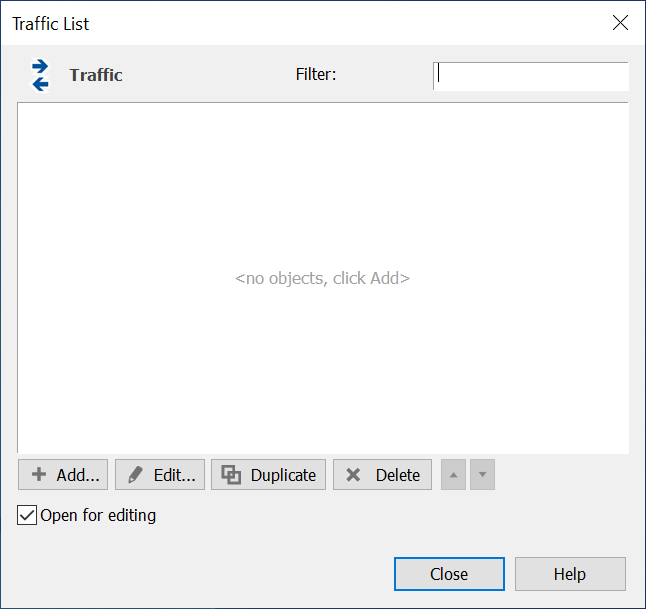
There are four methods for using a traffic object to switch links on/off and to determine traffic levels:
- On
- State Machine
- TDD
- Trigger level
The ability to set the maximum number of active links that can use a single traffic object is available via the option at the top of the Traffic dialog.
In addition, traffic objects can be used to define exclusion zones. These options are described further in the following sections.
Traffic Method On
The On method simply switches the link on permanently. If your link is a load link, then the traffic level used will always be 100%.
The edit dialog for a traffic object is shown below.
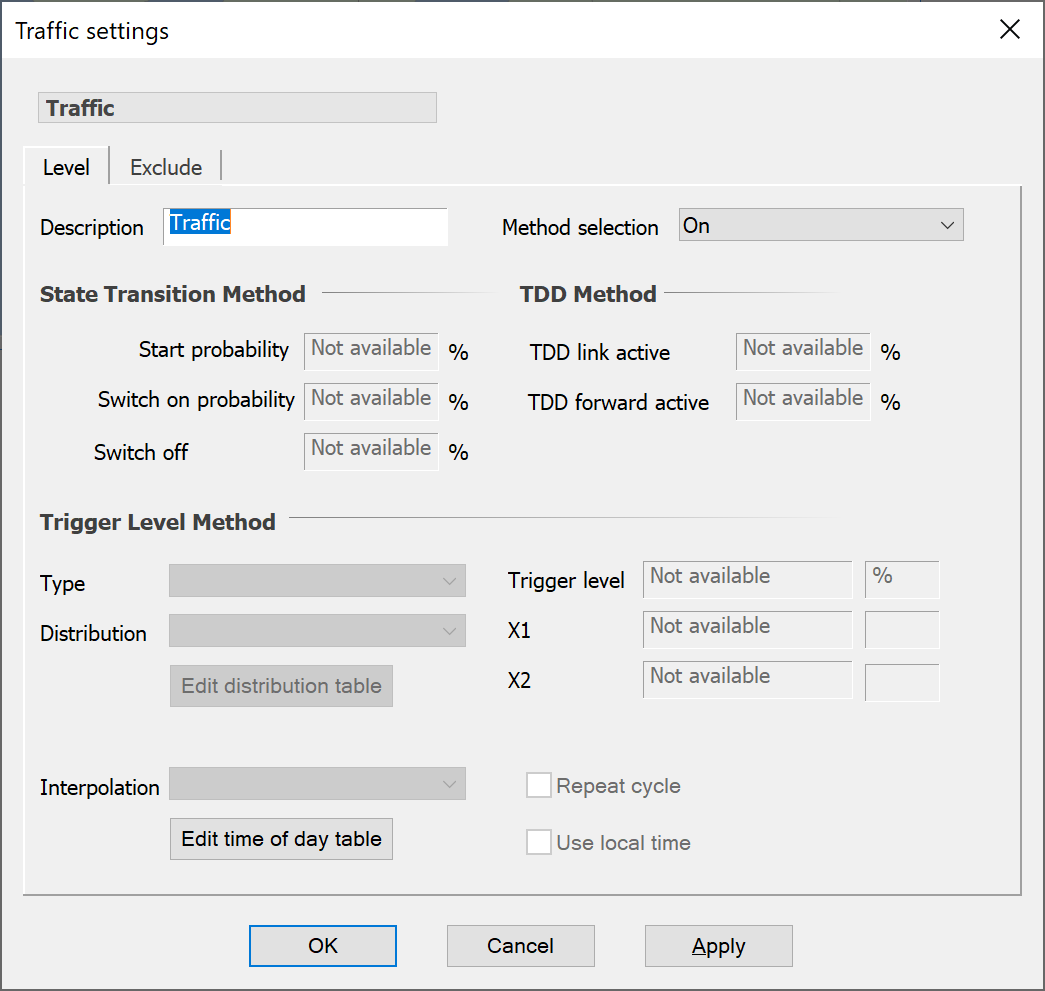
To use the “On” method, simply click on the method list in the method selection area and choose On.
Traffic Method State Machine
A link has two states. It can either be on or off. This method uses probabilities to determine when a link moves from one state to another.
There is a probability of moving from State = On to State = Off and a probability of moving from State = Off to State = On.At the start of a run, the link is in an undetermined state. Hence an additional probability, the probability that the link starts on, is required to determine the initial state of the link.
The state transition diagram is shown in the figure below.
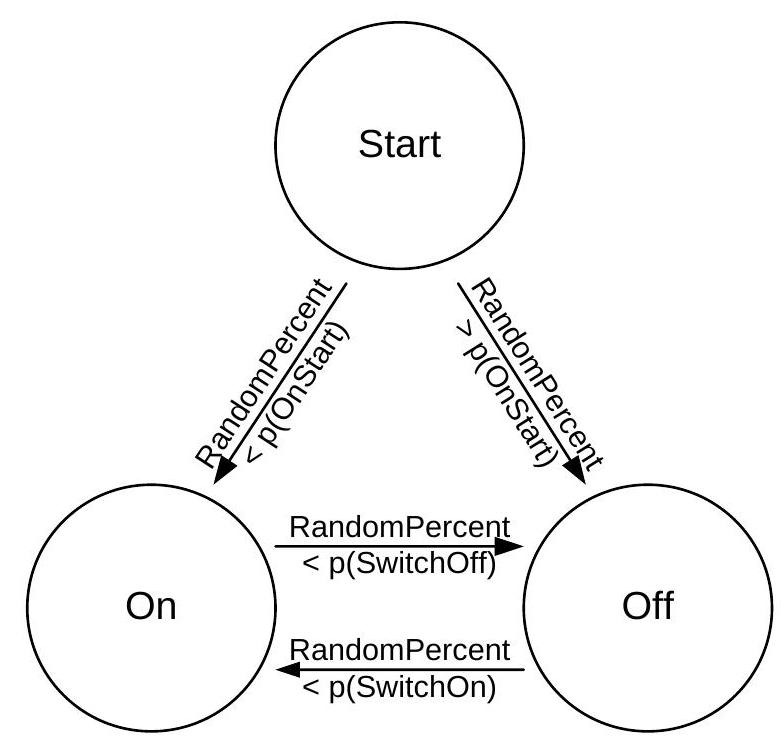
Note that all the probabilities are expressed as percentages.
For the state machine method, if you are using this object with a load link, the traffic level is always 100% when the link is switched on.
If you edit a traffic object, you will be able to see the controls that define this behaviour, as in the figure below:
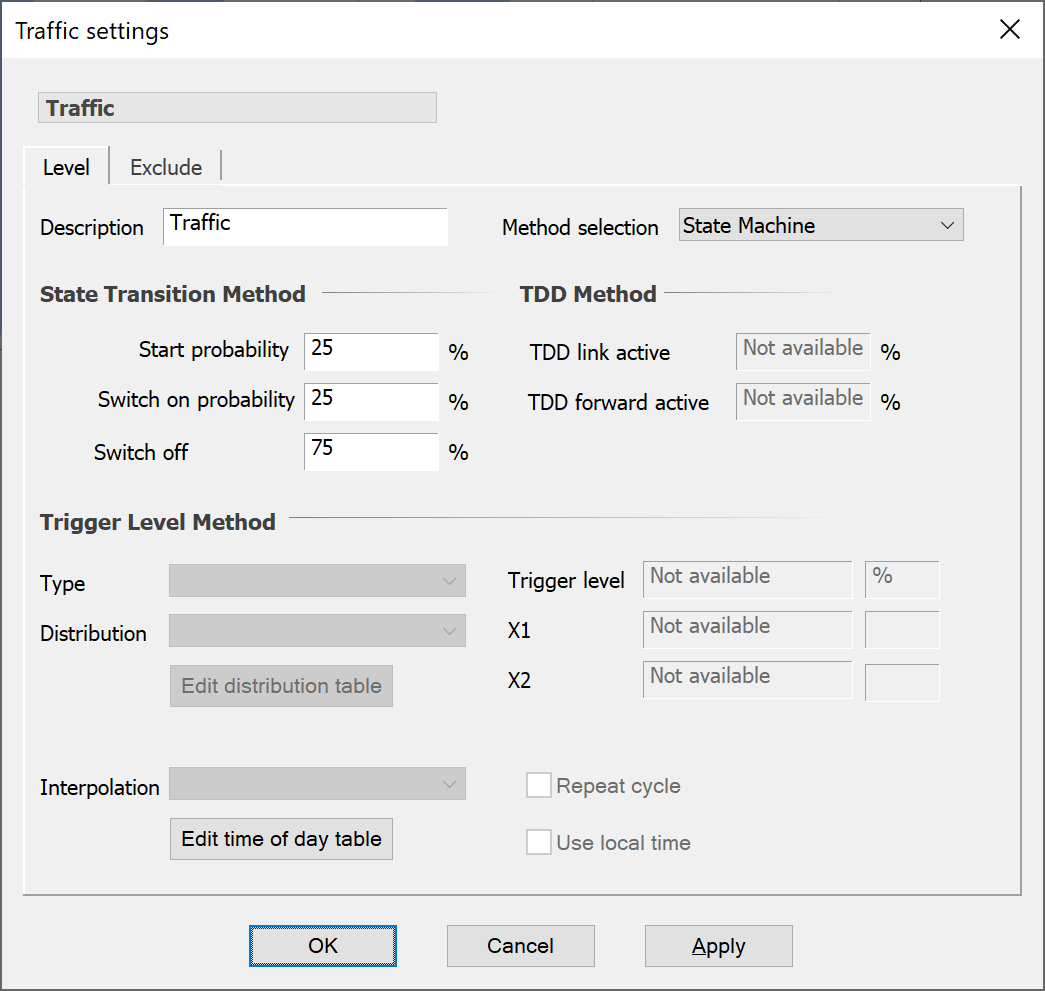
A number of possible methods can be used to select the values to use. The simplest is that if the probability that a link should be active is q (as a percentage), then the values should be set to:
Another possible approach to selecting the values to use is to include a call duration and average number of links required to be active using:
Both these approaches should give the same mean number of links active when applied to sufficiently large number: the principle difference is the average call duration.
Note that the state machine approach generates “calls” with duration having a binomial distribution, whereby the probability of length n-steps = p(Switch Off)^n.
Traffic Method TDD
Mobile networks require two communication directions, the downlink (from the BS to UE) and the uplink (from the UE to the BS). These two paths can either be:
- At different frequencies, typically using a paired block arrangement, potentially both transmitting at the same time
- In the same frequency block but at different times.
These two arrangements, frequency division duplex (FDD) and time division duplex (TDD) are shown diagrammatically in the figure below:
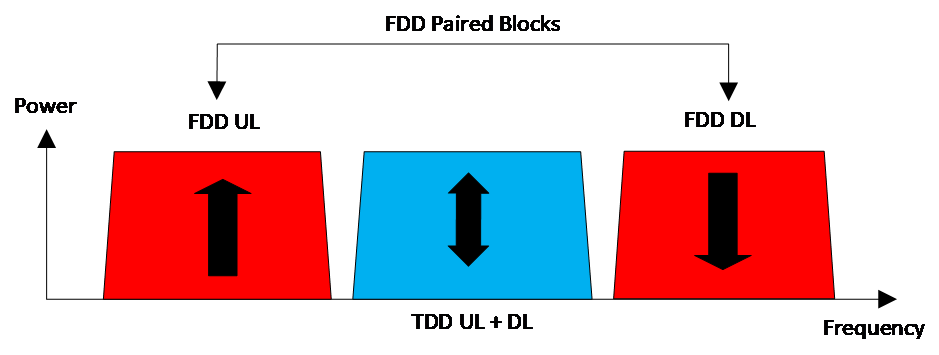
In Visualyse Professional, the frequencies can be entered on a fixed and dynamic links on the startend (forward) and endstart directions (return), and these can be either different (for FDD) or the same (for TDD).
However, a key difference between FDD and TDD is that FDD allows both the UE and BS to transmit simultaneously while typically TDD operation only permits one of these stations to be active at the same time.
A new feature in the Traffic Module allows this TDD behaviour to be modelled. The user interface (shown below) allows the following to be defined:
- Likelihood as a percentage that the link is active in any direction (whether forward or return)
- Likelihood as a percentage that the link, if active, is active in the forward or startend direction
- When activated the TDD Synchronised options enable, at each time step, all links that use this Traffic object to have the same state in terms of Active and or Direction.
The likelihood that the link is active in each direction is then:
Forward TDD link active TDD forward active
Return TDD link active TDD forward active
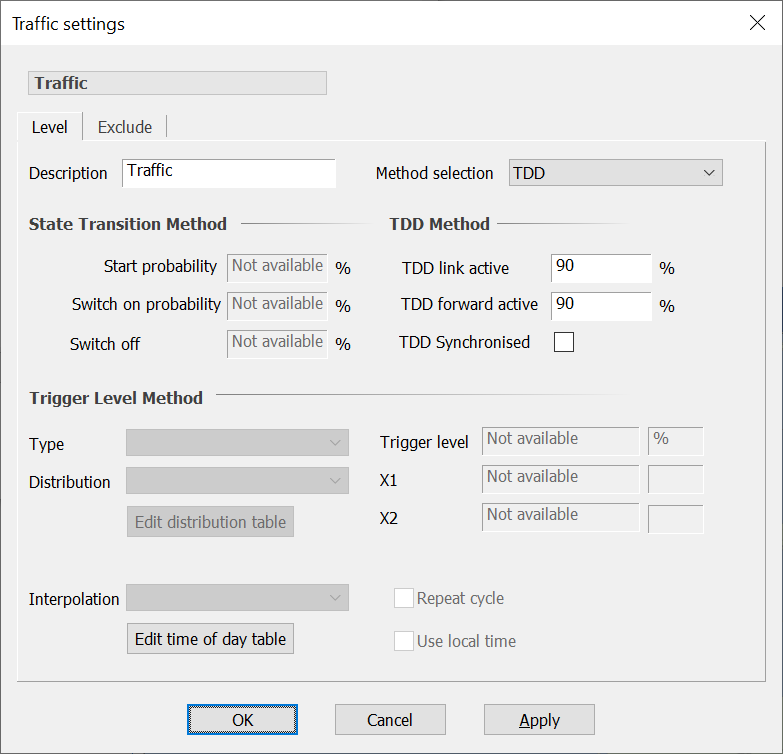
This traffic object can then be selected on the fixed or dynamic links traffic tab:

For other link types:
- Transmit links and TDD traffic models: the link will be active if the forward direction is active
- Receive links and TDD traffic models: the link will be active if the forward direction is active
- Load links: the TDD model will not have an impact
Note that if one direction is active then the tx/rx stations will be configured (i.e. antennas pointed) in both directions but the signal only calculated in the direction that is active.
Traffic Method Trigger Level
This method uses either a time of day profile or a distribution to determine the level of traffic at each time step. The traffic level is then compared to a trigger level in order to determine whether the link is on or off.
If the traffic level exceeds the trigger level, a link using the traffic object will be switched on. If the traffic level falls below the trigger level, a link using the traffic will be switched off.
Note that if the traffic object is used by many links, switching is determined for each link individually.
There are three trigger level methods:
- Time of day: a threshold is set and at each time step compared against the level in a time of day table: if the table is above the threshold then the link is considered active else the link is idle
- Distribution vs. Time of day: at each time step a random number is generated according to a pre-defined distribution and compared against the level in a time of day table. If the random number is above the table the link is considered active else the link is idle
- Distribution vs. Fixed: a threshold is set and at each time step a random number is generated according to a pre-defined distribution. If the random number is above the threshold the link is considered active else the link is idle
Each of these options is described in more detail below.
Time of Day
This method uses a table that defines the traffic level at various times throughout the day.
The key stages are:
-
In the traffic object, select “Trigger level” from “Method selection”
-
Select in “Type” the option “Time of Day”
-
Enter the threshold as a percentage
-
Enter a time of day table, with time in minutes since midnight and level as a percentage, as in the figure below
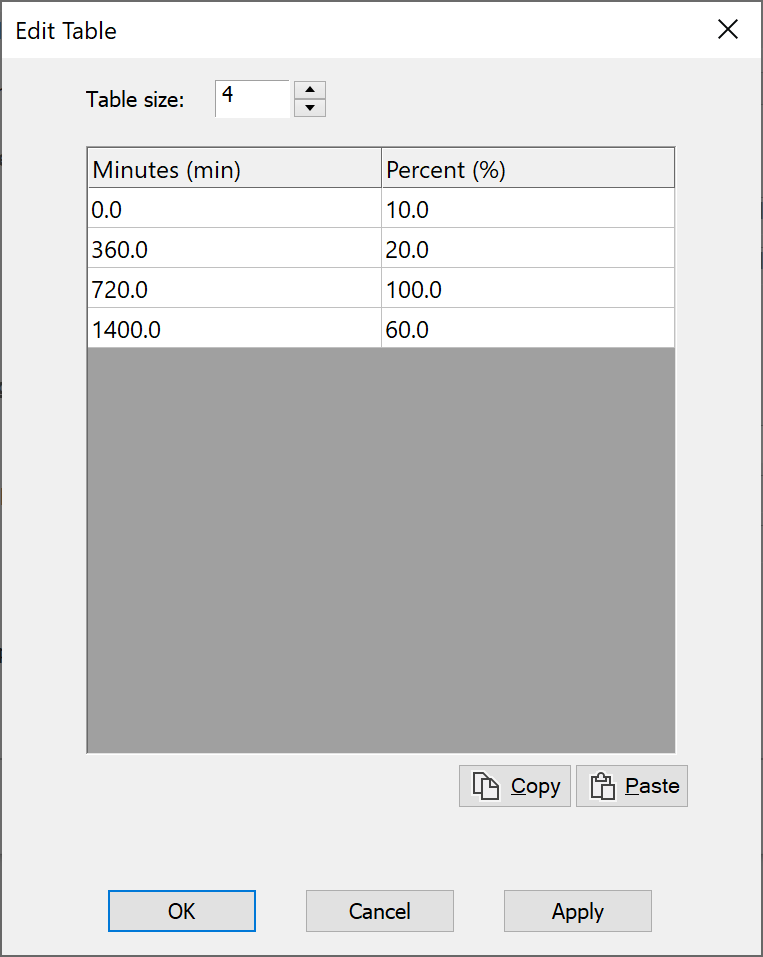
-
Select what to do when reach the last time in the table using the “Repeat cycle option”
-
Select whether to use simulation time (UTC) or the transmit station’s local time
Because the table represents traffic levels for a discrete set of times, you need specify how the level is calculated in between these times. This is done using an interpolation method, selected from the Interpolation list.
Visualyse Professional provides the following interpolation methods:
- Linear: this is standard linear interpolation. If the required value does not lie in between two entries in the table, the value for the nearest entry is used.
- Linear Extrapolate: this is the same as Linear, except that when the required value does not lie in between two entries in the table, extrapolation outside the bounds of the table is allowed.
- Linear Check Equal: this is the same as Linear. However, if the required value falls between two entries which have the same value then the two previous and two following entries are used to generate two lines which are then used to determine the required value.
- Linear Check Equal Extrapolate: this is a combination of Linear Check Equal and Linear Extrapolate.
- Polynomial: a polynomial is computed from the entries in the table. The interpolated value is then calculated from the polynomial.
- Cubic Spline: a cubic spline is computed from the entries in the table and the interpolated value is calculated from this.
- Largest: when the required value falls between two entries, then the largest value of the two entries is used.
- Smallest: when the required value falls between two entries, then the smallest value of the two entries is used.
If you want the traffic level to change only when a time in the table is reached, choose largest or smallest. However, if you want the traffic level to change steadily from one time in the table to the next, choose one of the other interpolation methods.
After the last time in the table has been reached, the process can be repeated, starting at the first time again. To do this, make sure that the “Repeat Cycle” box is checked.
The times in the table are just numbers of minutes and therefore need to be referred to some specific time. This time can either be the start of the simulation or midnight on the start day. To use the start of the simulation as the reference time, make sure that the “Use Local Time” box is checked. To use midnight on the start day as the reference time, make sure that the “Use Local Time” box is not checked.
To define when a link is switched on and off, all you need to do is provide a trigger level. The default value is zero, which means that any link that uses this traffic will always be switched on with a traffic level defined by the time of day profile.
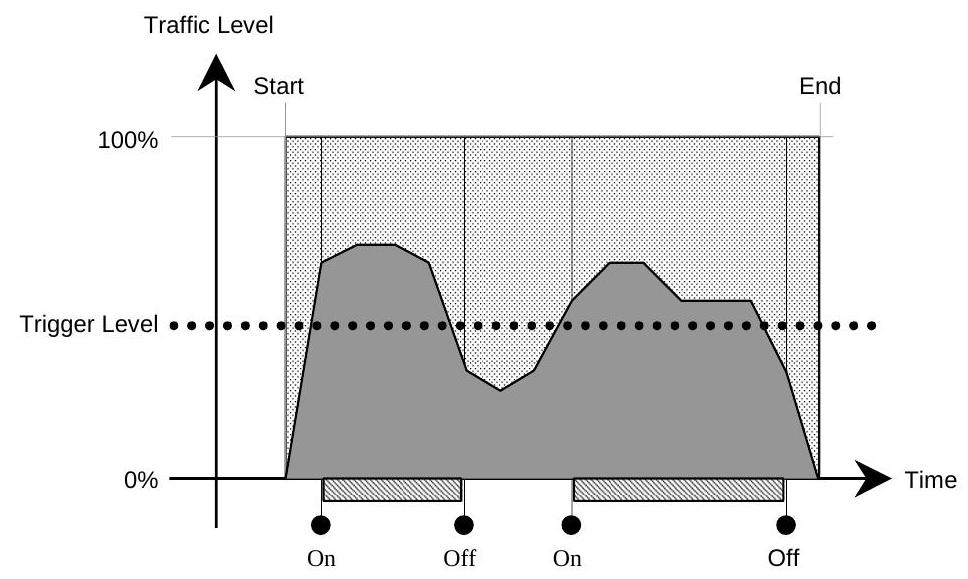
By increasing the trigger level, you restrict the activity of the link to periods when the traffic level exceeds the trigger level.
If you are using this method to provide a traffic level for a load link, then you can effectively ignore the trigger level by setting it to zero. The state of the link would then be determined solely by the time of day profile; the link would be off during periods when the traffic level is zero.
If you are using this method simply to switch a link on and off, then you can choose any traffic levels you wish for your time of day profile. The state of the link is determined by comparing the traffic level to the trigger level, so the actual value does not matter.
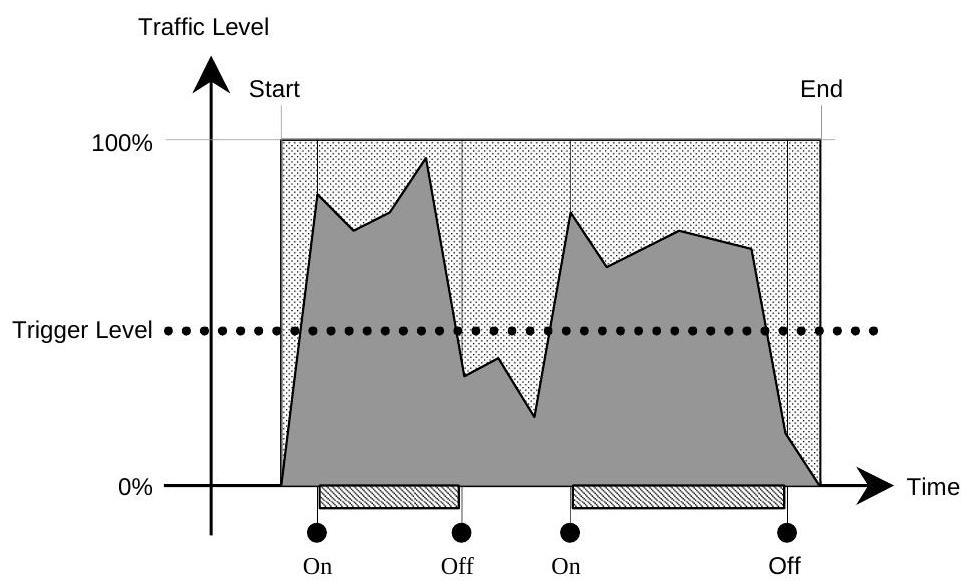
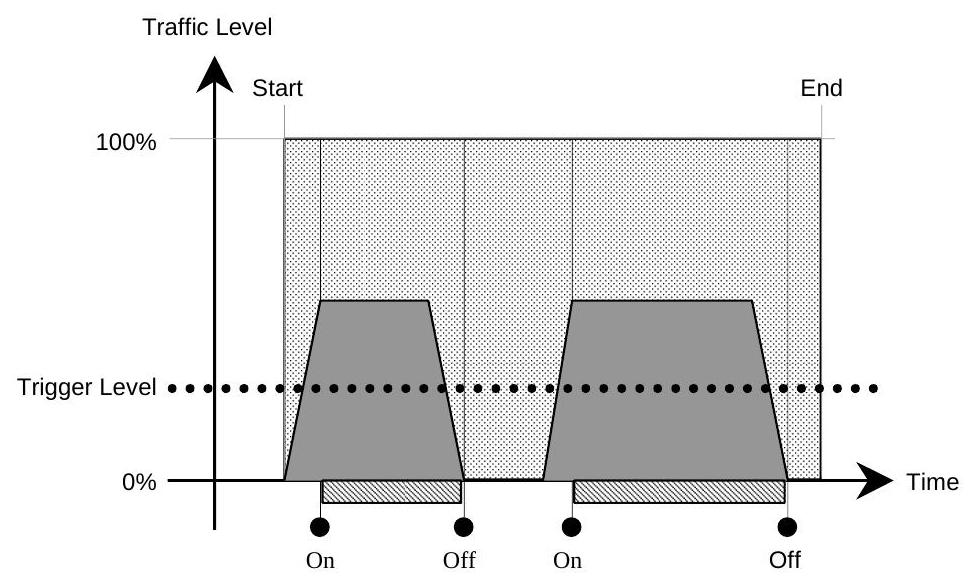
For example, the two diagrams below illustrate two different time of day profiles, each with a different trigger level. Both provide the same behaviour when they are used to switch a link on and off.
Distribution vs. Time of Day
This method is very similar to the Time of Day method described above. It uses the exactly the same Time of Day table to define variations in traffic levels.
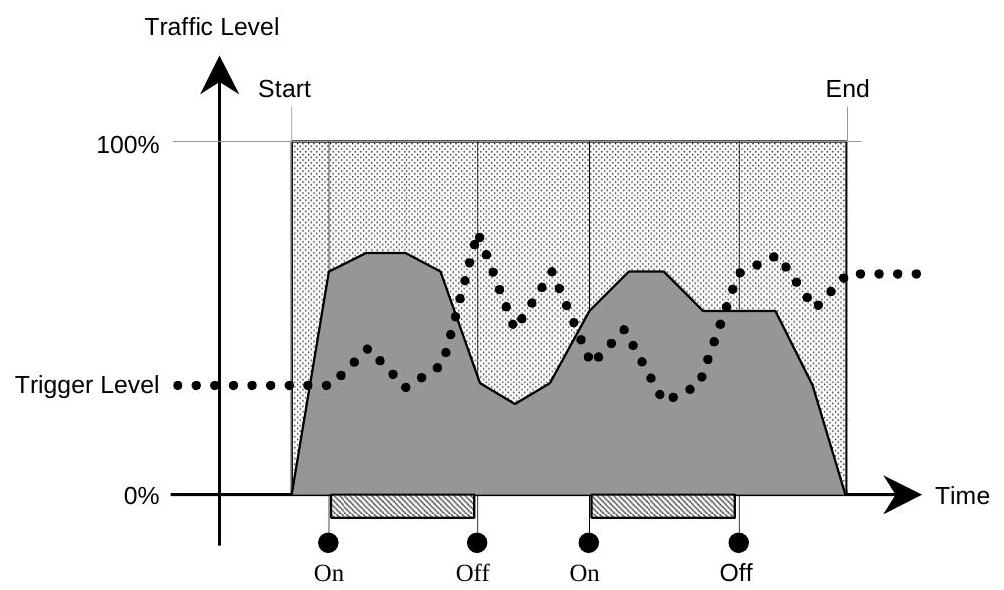
The difference is in the way that the trigger level is specified. Instead of using a fixed value, the value is sampled from a distribution. Hence rather than the link being deterministic, always being active / idle at the same times, the process is more randomised, with the threshold altering the probability that the link is active.
The key stages are:
- In the traffic object, select “Trigger level” from “Method selection”
- Select in “Type” the option “Distribution vs. Time of Day”
- Select a distribution from one of the options as described below
- Enter parameters for the distribution (i.e. mean & standard deviation, or as required)
- Enter a time of day table, with time in minutes since midnight and level as a percentage, as in the previous example
- Select what to do when reach the last time in the table using the “Repeat cycle option”
- Select whether to use simulation time (UTC) or the transmit station’s local time
The trigger level distribution is based on one of 10 different types of distribution. These are:
- Linear
- Normal
- Triangular
- Poisson
- Log Normal - Erlang
- Exponential
- Gamma
- Rayleigh
- Table
Once you have chosen the type of distribution, you then need to define it. The two fields below the “Trigger Level” field will change to reflect the information that is required.
Almost all of the distribution types require a mean value and most of these require a variance as well. For Erlang distributions you will have to provide a k value and for gamma distributions, alpha and beta will be required.
The operation of this method is illustrated in the diagram below.
Distribution vs. Fixed
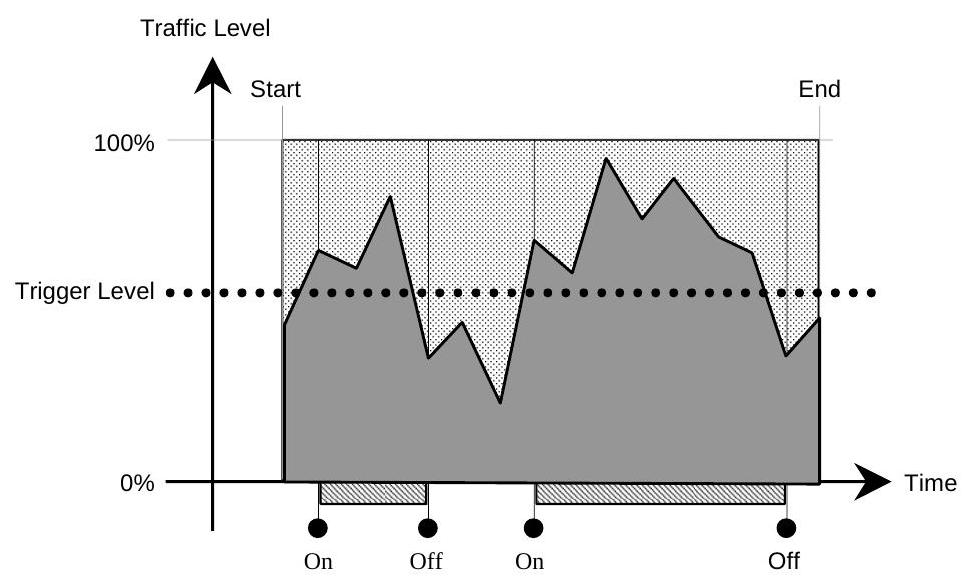
This method samples the traffic level from a distribution. Activation of links is the same as for previous methods: the traffic level must be above a fixed trigger level in order for a link to be switched on.
The key stages are:
- In the traffic object, select “Trigger level” from “Method selection”
- Select in “Type” the option “Distribution vs. Fixed”
- Enter the threshold as a percentage
- Select a distribution and parameters from the list as for the previous example
The diagram below shows an example of how this method works.
While this effectively is just a convoluted way of defining the probability that the link is active, when combined with load links it can be used to build statistical models of traffic levels using the various distributions.
Exclusion Zones
A traffic object can also be used to prevent transmissions in certain defined areas. These areas are called exclusion zones.
An exclusion zone is defined by a radial distance and a group of stations. If you imagine a sphere of the specified radius, around each station in the group, then the exclusion zone is the volume of space occupied by all the spheres.
Any link that uses the traffic will be switched off if the start or end station lies within the exclusion zone.
To use an exclusion zone:
-
Create a group of stations around which you want to prevent transmissions. These can be marker stations or stations which are used in your interference scenario
-
Edit the traffic object you want to use an exclusion zone with
-
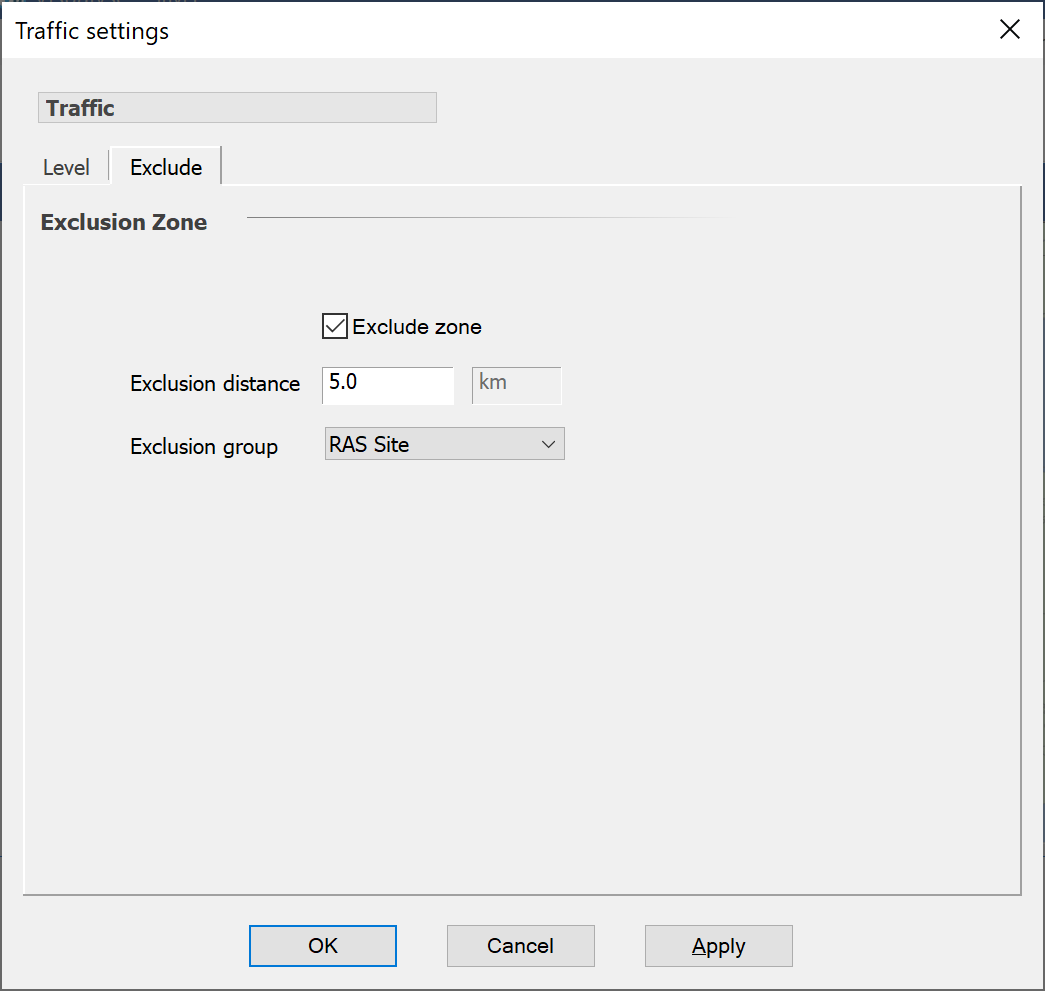
Click the exclude tab (shown below)
-
Make sure that the Exclusion method has selected one of the following: “< Min”, “> Max”, “< Min or > Max” or “> Min and < Max”
-
Type the radius for the spheres in the appropriate Distance min / Distance max box
-
In the exclusion group list, select the group of stations you want to use.
You can switch the exclusion zone off by editing the traffic object and making sure that the Exclusion method has “Any” selected.
You can use the exclusion zone on its own without the traffic object switching the link on / off by using the traffic method = on.
Associating Traffic Objects with Links
To use traffic on a link, whether to switch it on/off or impose and exclusion zone, select the “Traffic” tab, enable traffic, and then select the appropriate model, as in the figure below.
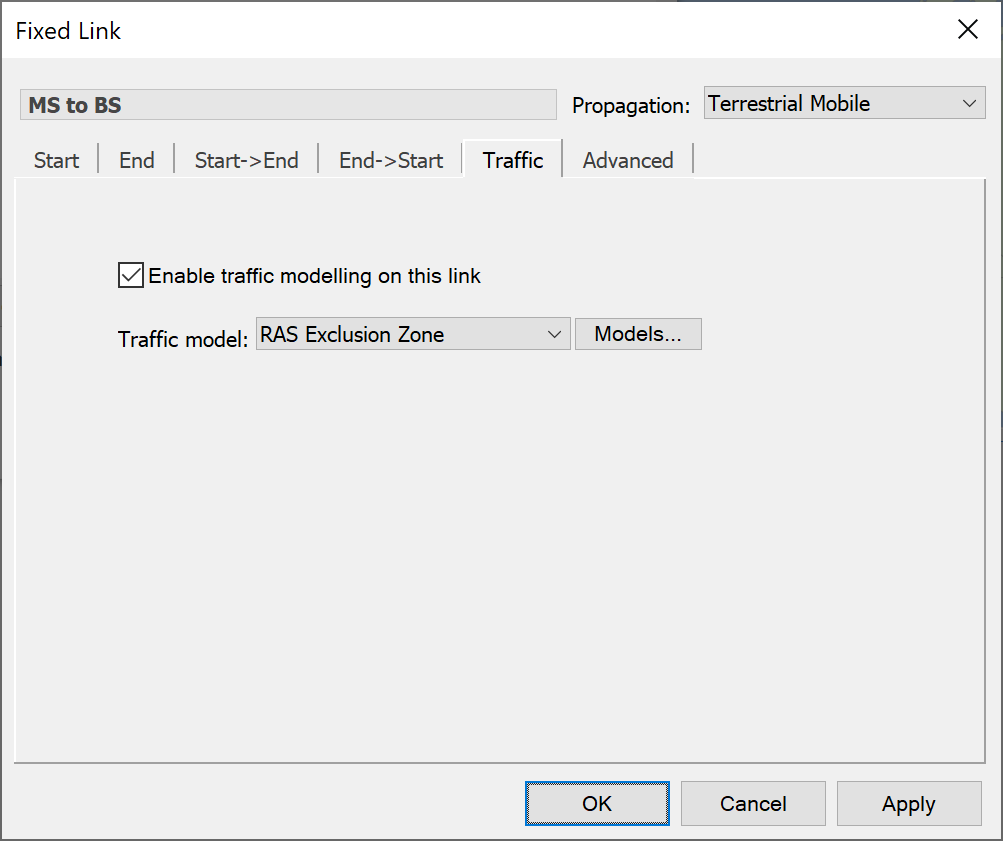
Once associated with a link, a traffic object serves two purposes:
- It determines whether a link is on or off
- If the link is a load link, it determines the traffic level for the link
Any number of links can be associated with a single traffic object.
If a number of links share a traffic object, the state and traffic level is determined individually for each link; one link could be off, another could be on. If the links are load links, the traffic levels for the ones that are switched on could all be different.
There are additional parameters when using traffic objects with transmit links: this is discussed further in Using Traffic Load below.
Load Links
Advanced level modelling of traffic is achieved by using load links. Load links are used to model systems whose link characteristics vary according to traffic levels.
This section describes how to create and use load links. The process of traffic loading is explained in detail.
Overview
Before going into the detail of how load links work, it is useful to have a high level picture of what load links are and what their purpose is.
A load link is similar to a dynamic link in that:
- It has a start and an end station,
- The start station can be named or it can be the end station of another link,
- The end station can be named or it can be selected from a group of stations using a tracking strategy.
However, load links have no transmitting or receiving capabilities. They have no carrier, no powers and no propagation characteristics.
Their purpose is not to provide a signal, but to determine the amount of traffic flow or throughput between the start station and end station. This is achieved by a process called traffic loading: the subject of the next section.
Traffic loading is done in two stages:
- Generation of traffic: determines the potential throughput from the start station
- Traffic Allocation: tries to load this throughput onto the end station
The end result of traffic loading is a load value for each station. This value can be used in its own right as a metric of network loading, or by a transmit link to change transmit characteristics such as bandwidths and powers.
The idea is that you create load links to manage the traffic flow and then create transmit links for all the stations you are interested in. The transmit link provides the signal that can be used in interference calculations.
Example of Traffic Loading
The figure below shows an example where a base station with two antennas is serving four users.
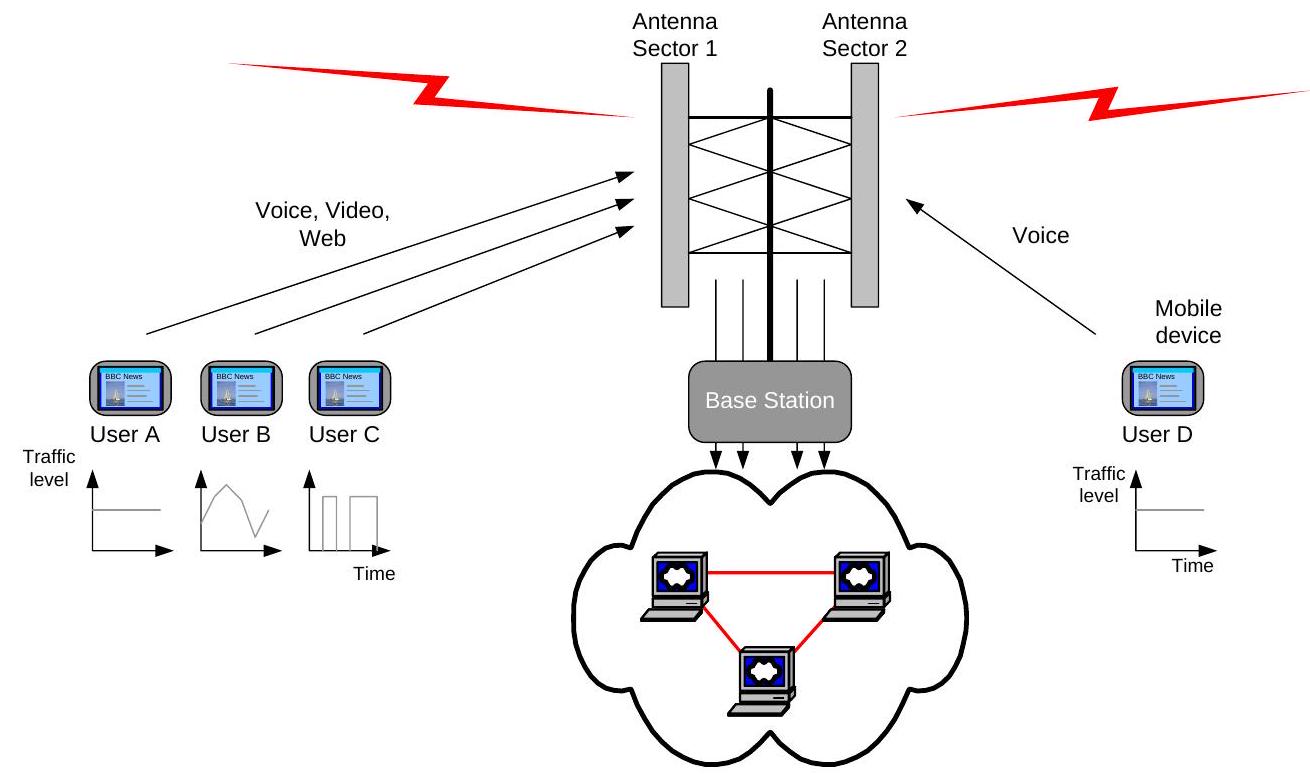
The amount of traffic generated per user varies in time and will depend upon the service type (e.g. voice, data etc.). The traffic level at each time step can be derived from:
- If no traffic object is selected: the station maximum throughput level: in this case it is fixed for the duration of the run, i.e. constant traffic
- If a traffic object is selected: the station maximum throughput level times the percentage of maximum loading specified by the traffic object. In this case the traffic level can vary during the simulation depending upon the model used.
This traffic level is thus associated with the station and can be varied during the simulation using the traffic object.
The load link is then used to manage how this traffic is routed between stations: the start/end pages are used to define the topology – i.e. where traffic flows. This can be to a specific station or assumed to be split between more than one, depending upon whether the load link is configured to use “Multiple Allocation” method.
Multiple load links can be used to accumulate traffic from many stations, which could have different traffic levels and time of day variations. In the example above for example “Antenna Sector 1” receives traffic from three stations - Users A, B, and C - while Antenna Sector 2 receives traffic from just one station, namely User D.
This aggregation must take account of constraints within the network that will limit the maximum that can be handled. These constraints can be at the station level (for example due to limited backhaul) or on an antenna by antenna basis (maximum codes, EIRP etc. within that sector).
Hence it is possible to define in Visualyse Professional the maximum traffic that can be handled by each antenna and station. The aggregation of the load link respects both those limits, and if exceeded there will be traffic unallocated – i.e. from the user’s viewpoint this represents degradation in the quality of service available.
The places to find the key traffic loading parameters are:
- Generation of traffic key parameters:
- Load link’s start station object’s “Maximum throughput”
- Load link’s traffic object (if specified) percentage level
- Allocation of traffic key parameters:
- Load link’s end station selection algorithm
- Multiple allocation algorithm (if specified)
- Maximum “Load” of start station and its antenna’s “Maximum load”
- Maximum “Load” of end station and its antenna’s “Maximum load”
The currently traffic levels can be viewed in the watch window under station and antenna. Any traffic that could not be allocated can be identified in the watch window under the load link.
The outputs from the load links can be twofold:
- Determination of the quality of service using the “load left” to identify if the current network is insufficiently sized to handle the requirements of its users
- The level of interference specified using transmit links can take account of the load level on the associated stations and antennas.
The figure below shows the overall process: note that not all stages are required – for example it is possible to use load links without a traffic object.

The various stages are:
- The traffic level for this time step for this start station is calculated as a percentage of maximum using a traffic object
- This percentage is used with the maximum throughput of the start station to calculate the throughput for this time step for this start station
- The load link’s tracking strategy is used to work out a set of possible stations to assign this load to
- The load link’s assignment algorithm is used to allocate the throughput for this time step for this start station to one or more of the end stations and their antennas & beams
- A transmit link uses its carrier parameters to convert the loading on each of the beams of the stations within the station group into blocks of spectrum with defined (EIRP, bandwidth)
- These blocks of (EIRP, bandwidth) are then used to calculate the interference into a victim, which will therefore take into account the traffic and loading algorithms in the previous steps
Managing Load Link Objects
Load link objects are part of the simulation, stored in the .sim file, and managed via a list where they can be created, deleted, duplicated, and modified.
The load link list can be accessed via the “Model” menu option “Traffic. This will open the load link list, as shown below.
As with all Visualyse Professional objects the name is used to identify it and must be unique for that type of object.
There are four parts to the definition of a load link:
- Start station definition
- End station definition
- Traffic
- Allocation
The start and end stations are specified in the same way as for dynamic links. If you want to know how to do this, you should refer to the user guide for the main program or look in the on-line help system.
You can also choose whether to use a traffic object with the load link using the tab as in the figure below.
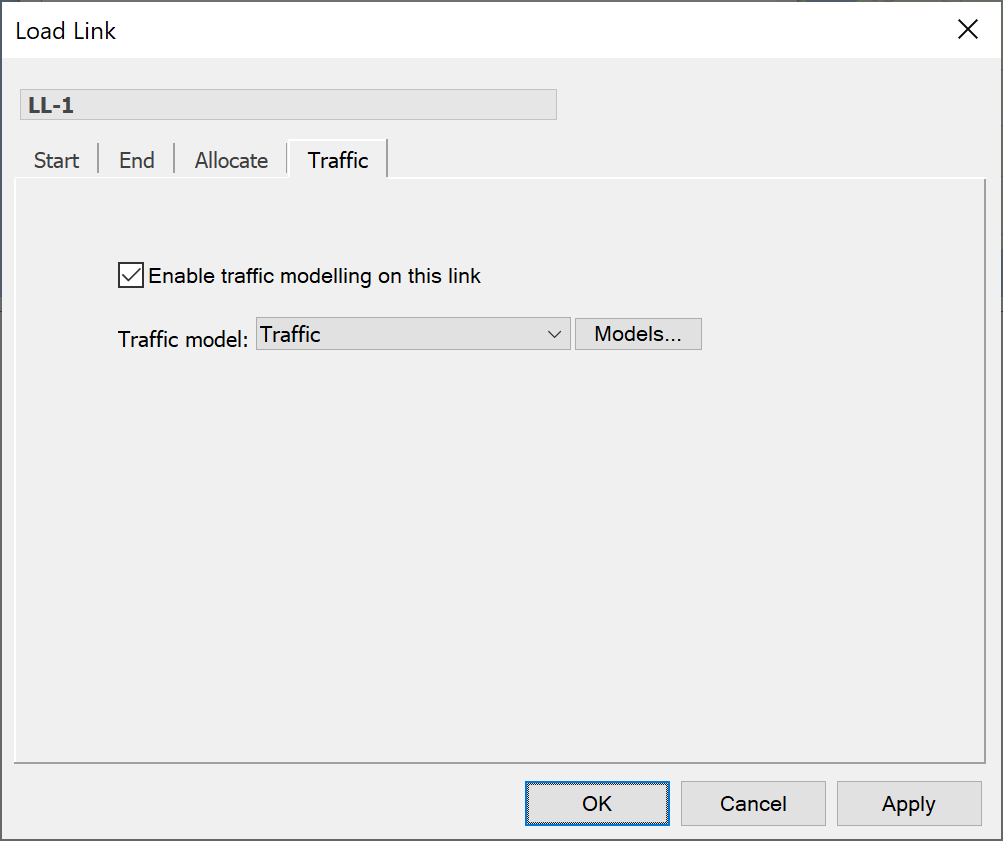
For now we’ll ignore the traffic allocation method. This is an advanced option and will be explained in a later section.
Traffic Loading
Traffic loading is done in two stages:
- Stage 1 determines the potential throughput from the start station
- Stage 2 tries to load this throughput onto the end station
Stage 1
Every station has a maximum throughput. This throughput value can be used to represent data or users depending on the type of system you are modelling.
To change the maximum throughput for a station, simply edit the station and click the “Traffic” tab (shown below).
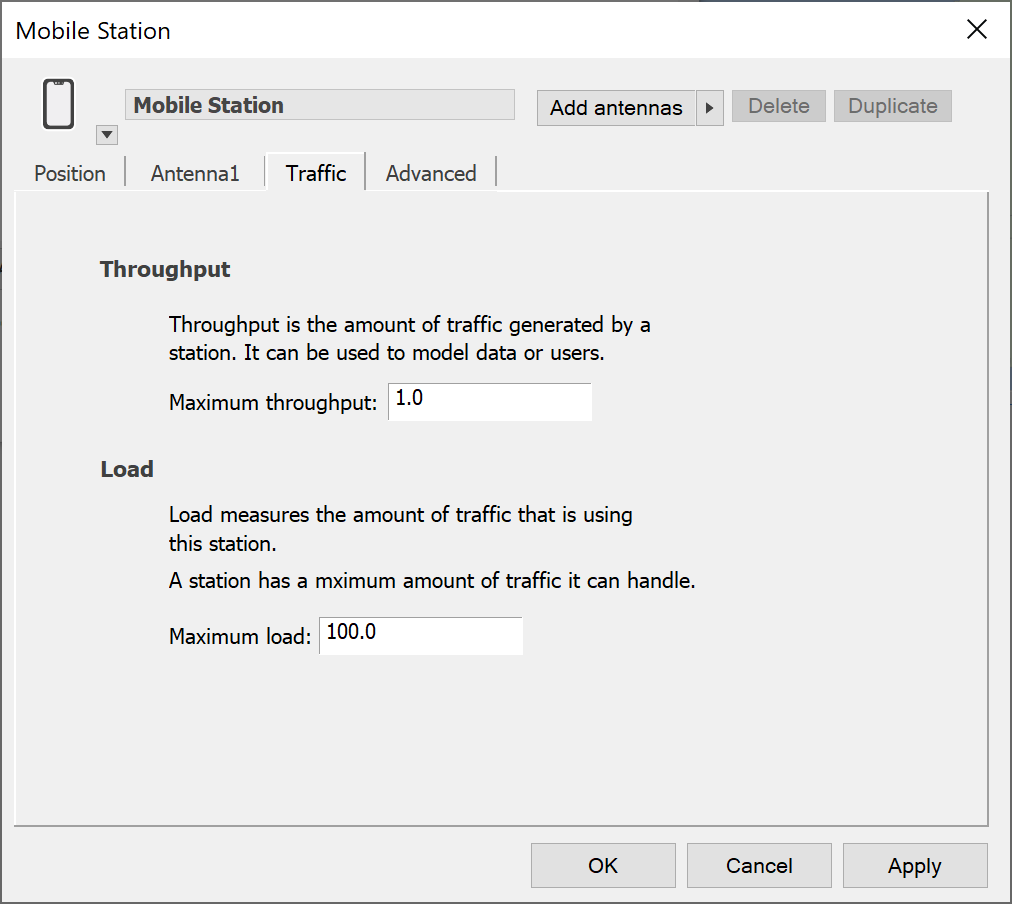
In the “Max Throughput” box, type a value for the throughput.
The load link now needs to determine the throughput from the start station that could potentially be loaded onto the end station. The word potentially is used here because sometimes not all the throughput can be loaded onto the end station. The factors that govern this are explained fully when Stage 2 is discussed.
If the load link uses a traffic object, the potential throughput is calculated as follows:
- The traffic object provides a percentage traffic level based on the traffic method that has been specified.
- The traffic level is then multiplied by the maximum throughput for the start station to obtain the potential throughput.
If the load link doesn’t use a traffic object, the maximum throughput is used.
Stage 2
Once the potential throughput has been established, the load link tries to ‘load’ the throughput onto the end station beam.
The load link can load the beams on multiple end stations (see Loading Multiple Beams). However, to keep things simple let’s assume that the load link has a single named end station.
There are four factors that govern how much throughput can be loaded onto the end station beam. These are:
- the spare load capacity at the start station
- the spare load capacity at the start station antenna / beam
- the spare load capacity at the end station antenna / beam
- the spare load capacity at the end station
We’ll deal with the beams first.
The spare capacity of the beam of an antenna is determined by two properties: maximum load and current load. The beam determines maximum load. This is a restriction on the amount of throughput that can be loaded onto a beam.
To change the maximum load for a beam, edit the relevant antenna, select the beam in question, and then select “Advanced” value in the “Maximum Load” field (shown below for an equation type antenna).
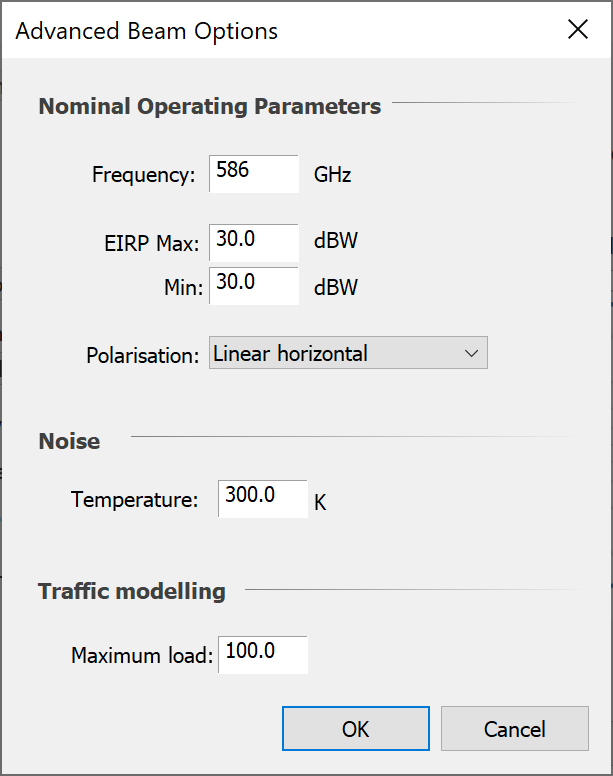
Current load only becomes an issue when multiple load links are loading the same beam of the same antenna. The spare capacity of an antenna’s beam is then the difference between the maximum load and the current load.
The spare capacity for a station is calculated in the same way as it is calculated for a beam. Stations have a maximum load: to view or change this value, simply edit the station and click the traffic tab.
The current load for a station can be displayed by opening a watch window and selecting the stations’ traffic sub-object. The station load is just the sum of the loads on each of its antennas and their beams.
Once a load link has determined the spare capacities of the start and end stations and their beams, it can then attempt the loading process.
The amount of throughput that becomes load is the minimum of all four capacities. This throughput is added to the load values for the start station and the end station beams.
The process is best clarified with an example. The following table shows a possible loading scenario. Load values are quoted for each stage of the loading process.
| Start Station | Start Beam | End Beam | End Station | |
|---|---|---|---|---|
| Stage 1 | ||||
| Max Throughput | 10 | |||
| Traffic Level | 40% | |||
| Potential Throughput | 4 | |||
| Max Load | 8 | 6 | 3 | 4 |
| Load (from previous links) | 4 | 3 | 0 | 2 |
| Spare Capacity | 4 | 3 | 3 | 2 |
| Stage 2 | ||||
| Actual throughput | 2 | |||
| Load (after adding this link) | 6 | 5 | 2 | 4 |
You can see that although the potential throughput is 4, the amount that can be loaded onto the end beam is limited by the spare load capacity of the end station.
Using Traffic Load
The previous section described how variations in traffic levels are modelled by loading stations and beams. This section describes how to use the load on a beam to determine the characteristics of a signal
You will recall from the overview section that once you have a set of load links which load stations and beams with traffic, you then need to create transmit links for all the stations you are interested in. The transmit link provides the signal and there are several ways that the signal may change according to load.
You should already be familiar with transmit links: they have a start station, but no end station. This is specified on the transmit station tab (shown below).
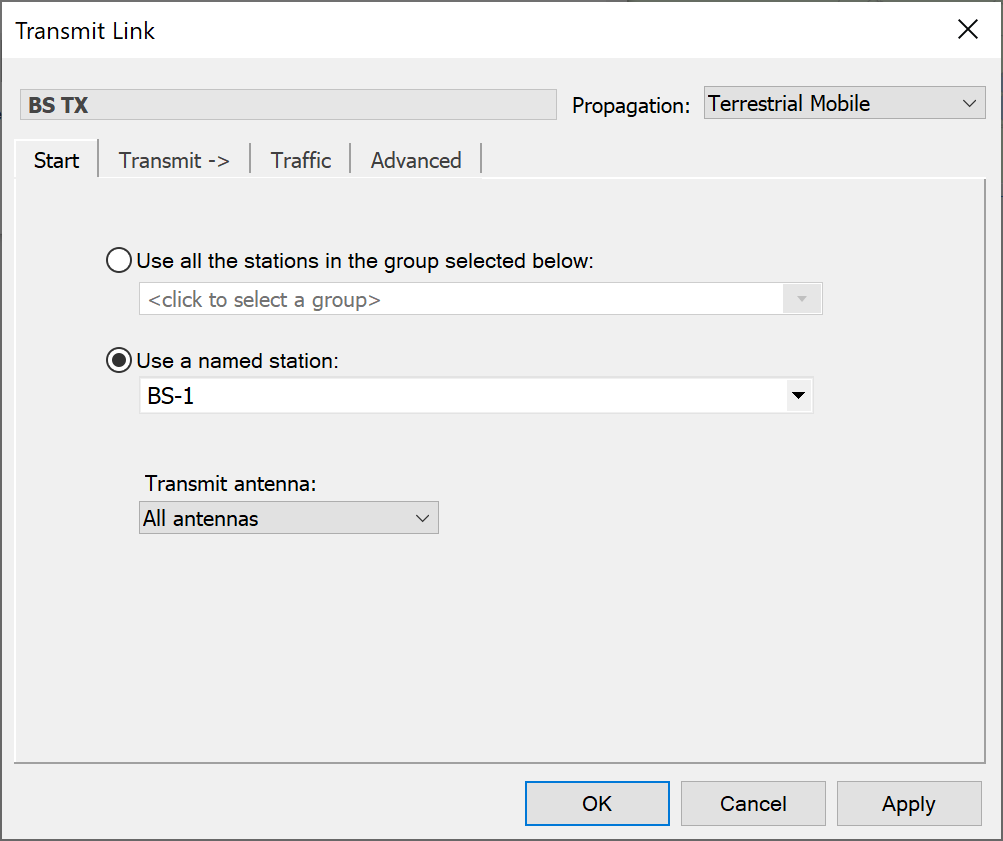
For more information on specifying these parts of a transmit link, see the links and interference paths section of the main user guide.
In order to change the way a transmit link responds to load, you need to click the traffic tab (shown below).
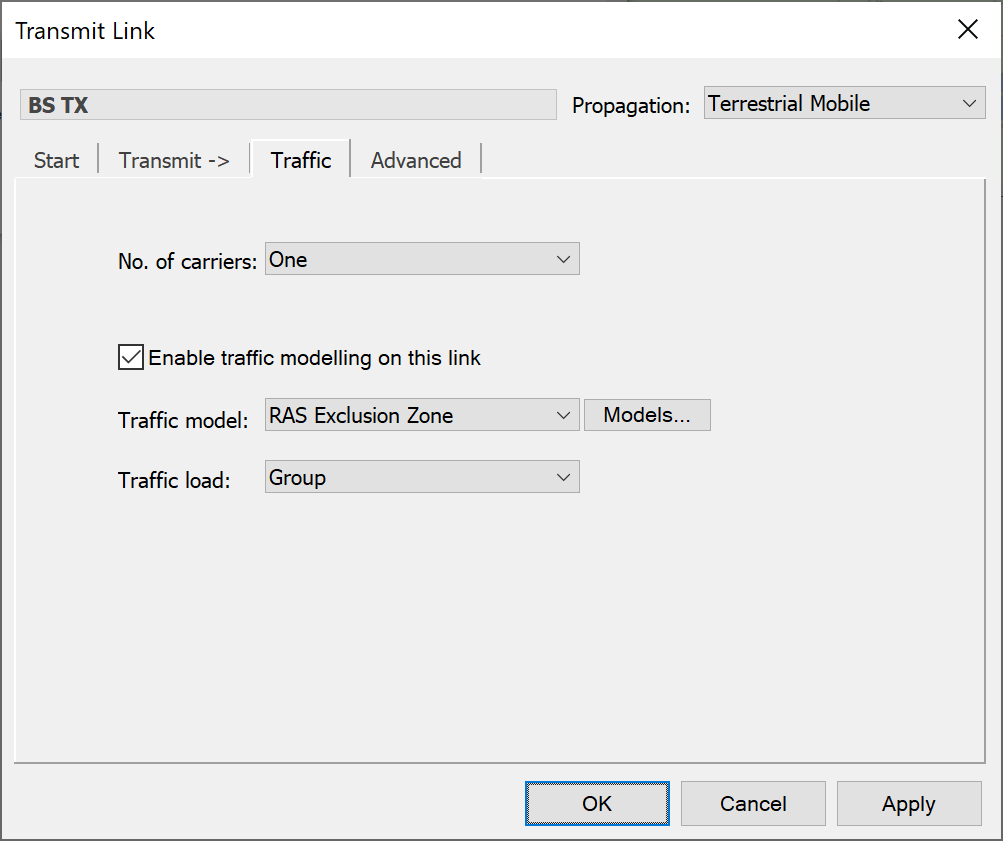
There are four ways of specifying whether and how to use the load on the transmit beam. These are selected from the “No. of Carriers” list.
Single Carrier is the default option. This does not take load into account.
Beam Load uses the load on the transmit beam as calculated by any load links.
Maximum uses the “Max Load” value for the transmit antenna’s beam instead of the its current load
Traffic is similar to maximum, but the load is multiplied by the traffic level from a given traffic object.
Station Users: this uses the Station’s “Maximum Load” field to determine the transmit power. For more information, please see the White Paper on using Population Data in Visualyse Professional.
If you choose the traffic option, you need to specify a traffic object.
To do this, first make sure that the “Enable traffic modelling on this link” box is checked. In the traffic model list, select one of the traffic objects. Finally, in the Traffic load box, choose the level at which the traffic level should be applied.
Remember that a transmit link can apply to anything from a whole group of stations, antennas and beams right down to a single beam on one station.
The “Traffic load” option defines the position in the group-station-antenna-beam hierarchy at which individual traffic levels should be applied.
For example, if you choose “Group”, the same traffic level will be applied to the maximum load for every beam on every antenna for all stations in the transmit group.
If you choose “Antenna”, the same traffic level will be applied to the maximum load for all beams in a given antenna. However, each antenna will use a different traffic level.
The Effect of Load on a Signal
The two properties of a transmit signal that are affected by variations in load are the bandwidth and the EIRP.
The way that the load affects these properties depends mainly on the link’s carrier.
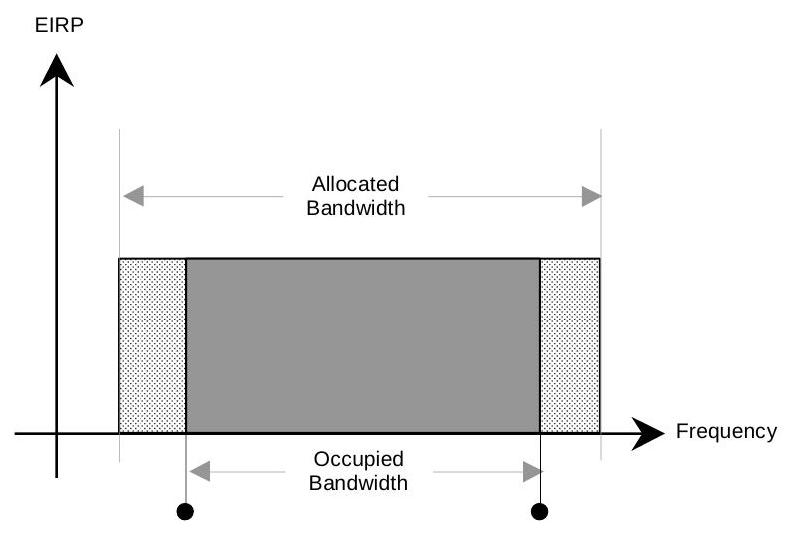
Remember that carriers are blocks of allocated and occupied bandwidth, which have a defined polarisation type. The occupied bandwidth is where most of the signal is transmitted. However, the signal tails off at the edge of this range and can interfere with other signals.
The carrier therefore has an allocated bandwidth that encloses the emissions at the edge of the occupied bandwidth. This relationship is shown in the diagram below.
The carrier defines the access method for the link. This is the most significant factor in determining how the signal responds to changes in load.
To change the access method for a carrier:
-
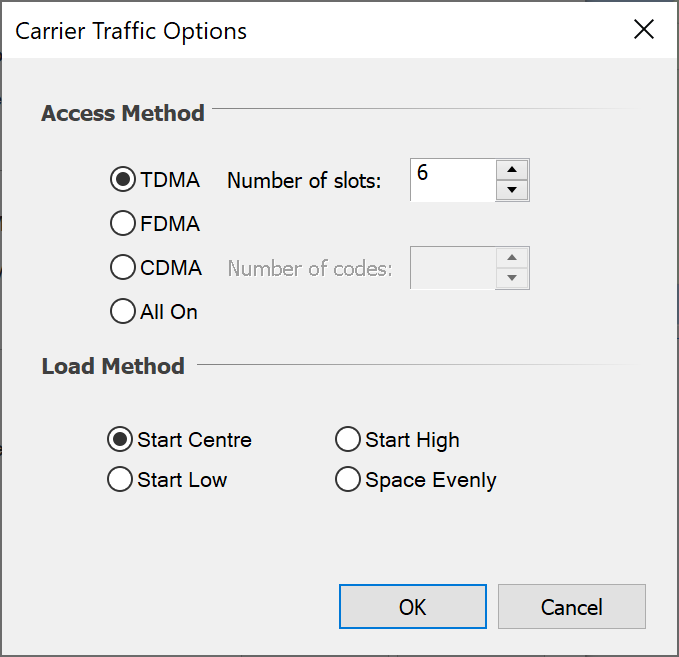
Edit the carrier and select “Traffic”. The following dialog is displayed.
-
Select an access method from TDMA, FDMA, and CDMA
-
If selected TDMA, then enter number of slots
-
If selected CDMA, then enter number of codes
-
Select a loading method
There are three access methods: TDMA, CDMA and FDMA. The next three sections look at how the signal changes for each access mode, and also the implications of the loading methods.
TDMA
TDMA stands for Time Division Multiple Access. It allows several separate digital transmission channels to be used within the same carrier bandwidth. The time over which a signal is transmitted is split up into equal length frames. Each frame is then split into a fixed number of slots.
The individual channels are allocated a slot for each time frame. No two messages are actually being transmitted at the same time. Instead the channels share the bandwidth by transmitting at different times.
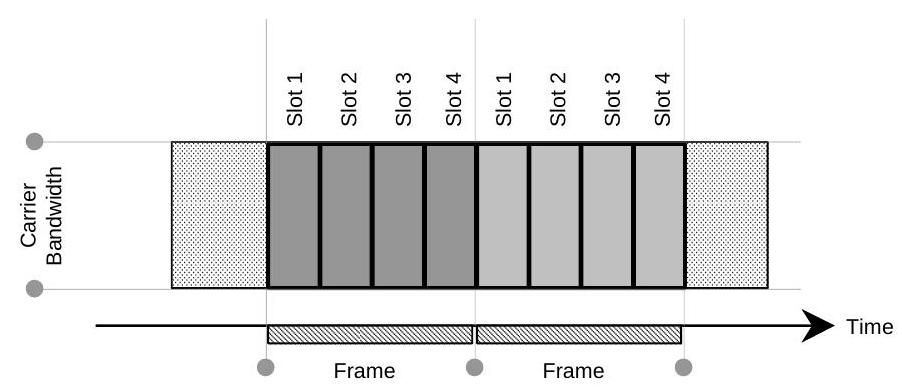
The total bandwidth of a TDMA transmission is determined by the number of carriers. Each carrier can handle one time frame worth of slots and each slot or can accommodate 1 unit of load. The number of carriers required to handle a particular load is therefore:
The central frequency for these carriers is determined by the load method for the carrier, the transmit antenna’s beam’ maximum load and the central frequency for the link.
The maximum number of carriers can be calculated by substituting the transmit antenna maximum load into the formula above.
You will recall from the section on traffic loading that an antenna has a maximum load and that this is used to limit the load on any associated beams.
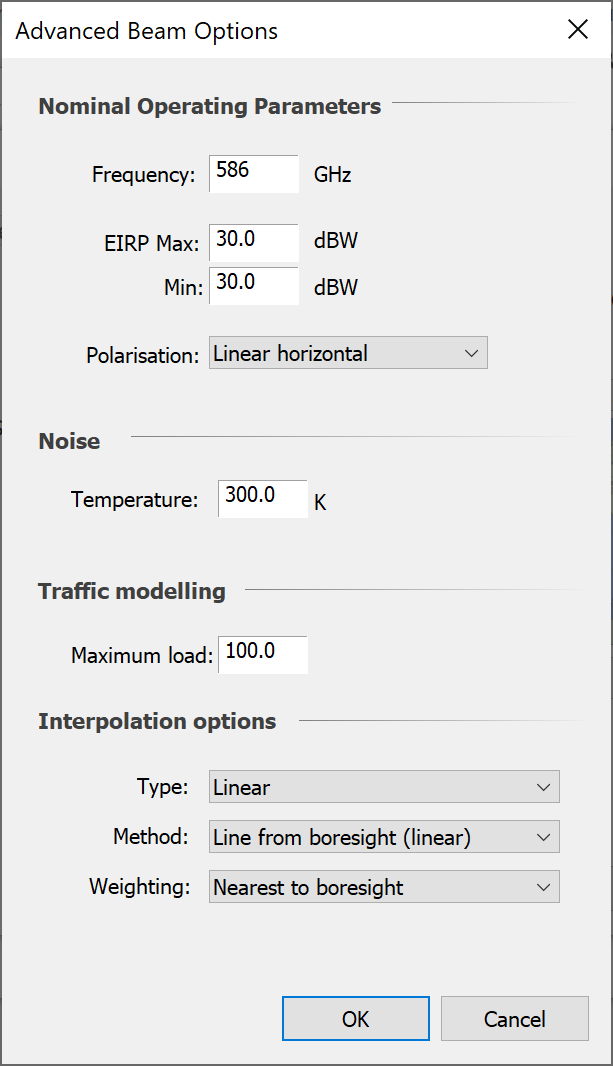
You can view or edit the maximum load for a beam by editing the corresponding antenna and looking at the “Maximum Load” field under the “Advanced” options. This is shown below for a single beam antenna defined via contours.
The total bandwidth for the maximum number of carriers gives the maximum bandwidth for the link. This is shown in the diagram below.

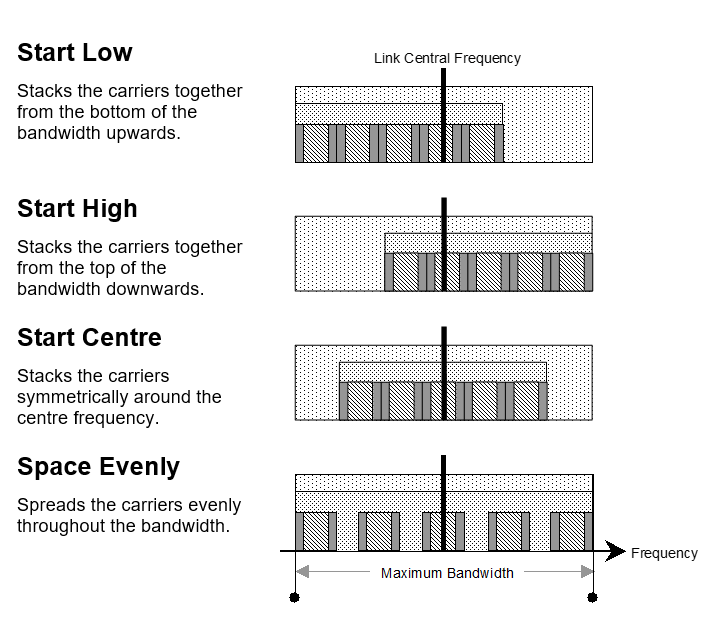
The load method for the carrier then provides four methods for stacking the carriers within the maximum bandwidth.
To change the load method for a carrier:
-
Edit the carrier for the link and click on “Traffic”. The following options are displayed:
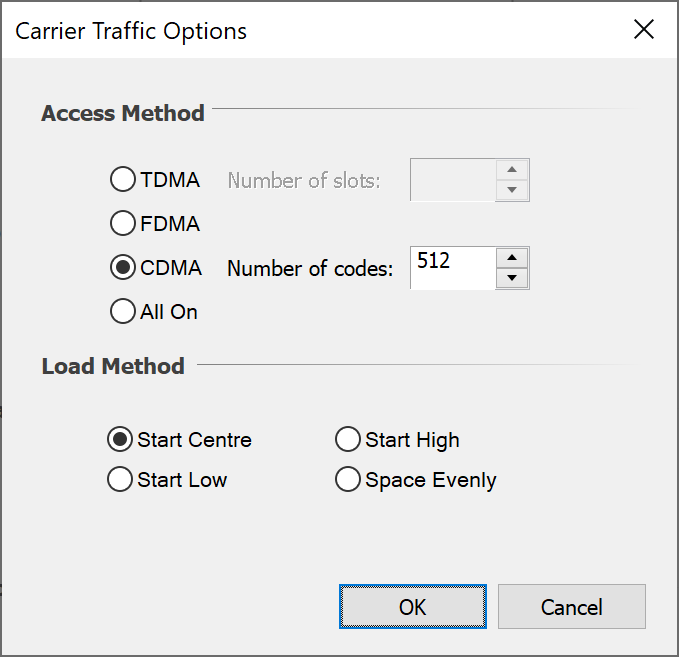
-
In the Load Method list, select one of the four methods. These are described below.
EIRP varies according to the number of carriers and not the load at the transmit beam. This is because a TDMA signal always uses the spare slots in a time frame if there are fewer messages than slots.
The variation of EIRP with load is as shown in the graph below.
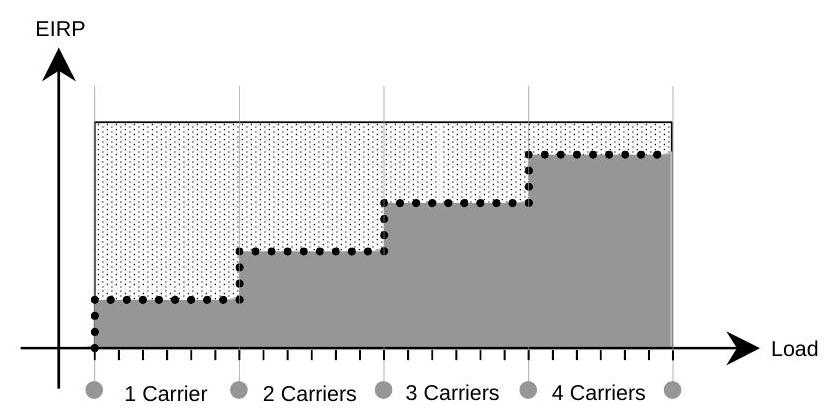
You will notice that the EIRP only increases when an additional carrier is required.
CDMA
CDMA stands for Code Division Multiple Access. The method uses unique code sequences to produce a set of orthogonal signals that provide distinct digital transmission channels within the same carrier bandwidth.
These signals are distinguishable even though they share the same frequency bands and the same time intervals.
The number of codes for a CDMA signal is defined by the carrier of the link.
A single carrier can support a maximum number of codes. When the demand for channels exceeds the maximum number of codes, additional carriers are required. This determines the total bandwidth of the CDMA signal.
The number of carriers required to handle a particular load is therefore:
The central frequency for these carriers is determined in exactly the same way as for TDMA carriers. The result is a set of carriers stacked within the maximum bandwidth of the link as determined by the maximum load for the transmit antenna’s beam.
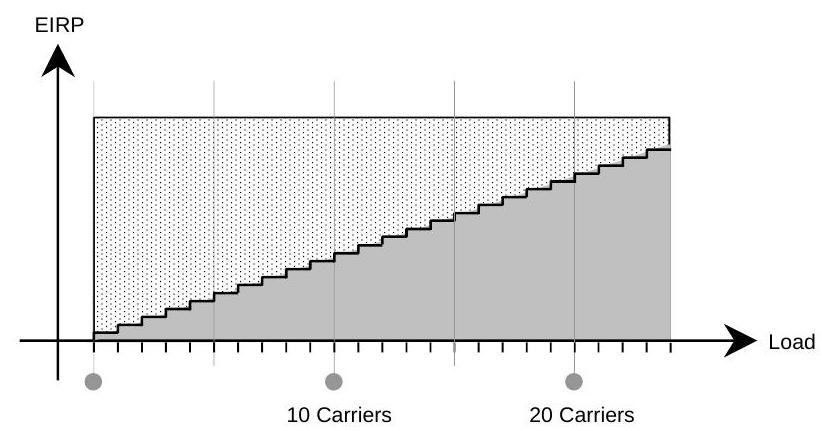
The main difference between TDMA and CDMA transmissions is the way that EIRP varies with load.
The orthogonal signals produced by a CDMA transmitter are noise-like in their appearance. The EIRP therefore needs to be increased for each additional channel.
The variation of EIRP with load is as shown in the graph below. The variation for an equivalent TDMA signal has been superimposed in order to make a comparison.

FDMA Signals
FDMA stands for Frequency Division Multiple Access. This allows a large number of channels to share access to a group of frequency bands without interference by assigning specific frequencies within the group of frequencies to each channel.
The shared frequency bandwidth is the maximum load of the transmit Beam Type multiplied by the bandwidth of the carrier for the link. The central frequency is the central frequency for the link.
Each channel uses a single carrier and these can appear randomly within the share frequency band as shown below.

Instead of simulating all these carriers individually, Visualyse Professional models the whole FDMA transmission as a wide band signal with a power level that is proportional to the number of carriers.
The graph of EIRP against load is therefore a similar shape to the graph for CDMA.
Loading Multiple Beams
Traffic Loading described how a load link can be used to load the throughput from a station onto a single beam on another station. In this case as much of the throughput as possible is used to load the end station beam.
However, sometimes you may wish to spread the load among individual beams on a number of end stations.
For example, an Earth Station with a maximum throughput of 10 could be used to model handsets transmitting from a particular area on the ground. The maximum throughput represents the maximum number of handsets that are expected to be transmitting at any one time.
The handsets communicate with a constellation of non-geostationary satellites. Each satellite can service a maximum of 5 handsets at a time.
The usage of satellites by handsets can be modelled by creating a load link from the Earth Station to the constellation of satellites. A tracking strategy would be used to select the highest elevation satellite.
However, if more than 8 handsets are transmitting, only five of them can use the highest elevation satellite. The other 3 handsets would have to use the next satellite that meets the conditions of the tracking strategy.
The load link can model this behaviour by loading the beams on more than one station. The next section explains how this behaviour is defined.
The first point to note is that a load link can only load a single beam on any one station. Multiple beam loading is therefore achieved by spreading the load across a number of stations. For each station, a single beam is used.
To do this, the load link must select its end station from a group. In addition, the end station must be selected using a tracking strategy object and not one of the predefined tracking strategies.
The reason for this is that the tracking strategy object compiles a list of candidate stations by applying its reduction criteria. It is the beams on these stations that receive the load.
To use a tracking strategy object to select the end station:
-
Edit the load link.
-
Click the “End” tab.
-
Click on “Add or Edit…” and then create a user defined tracking strategy
-
Under “Tracking strategy” select the newly created one
The picture below shows an example of how the dialog should look.
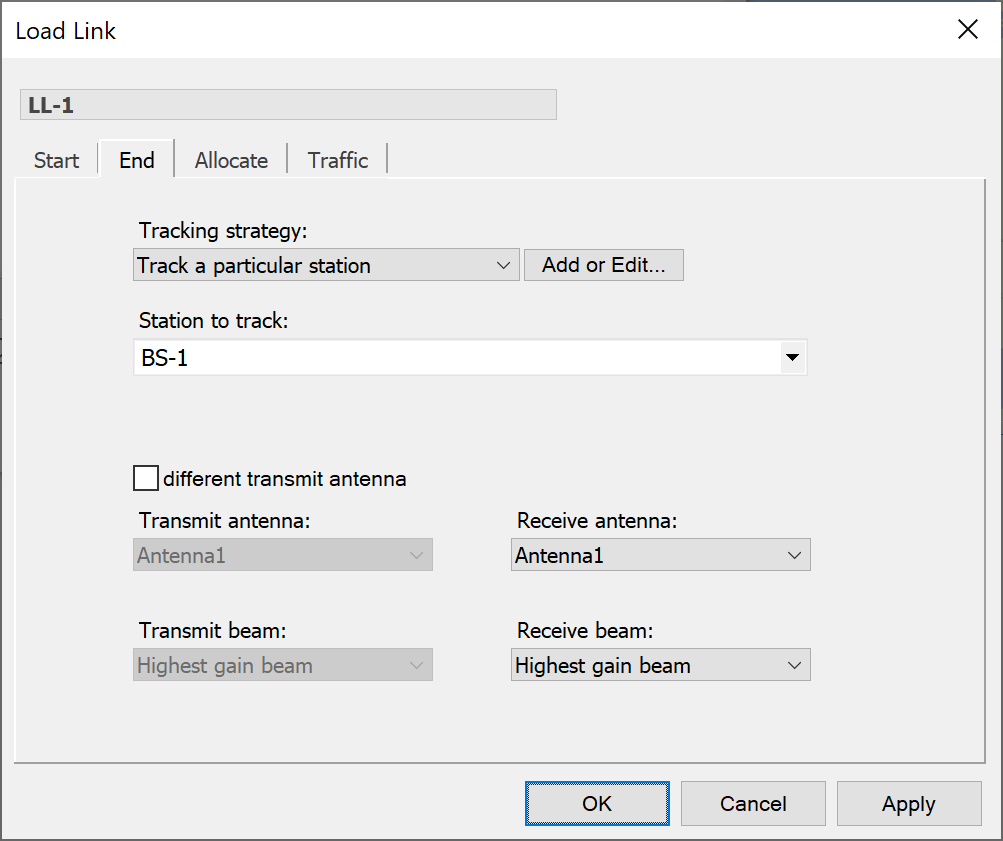
Finally, in the group list, select a group from which to select an end station together with the antenna / beam selection methods.
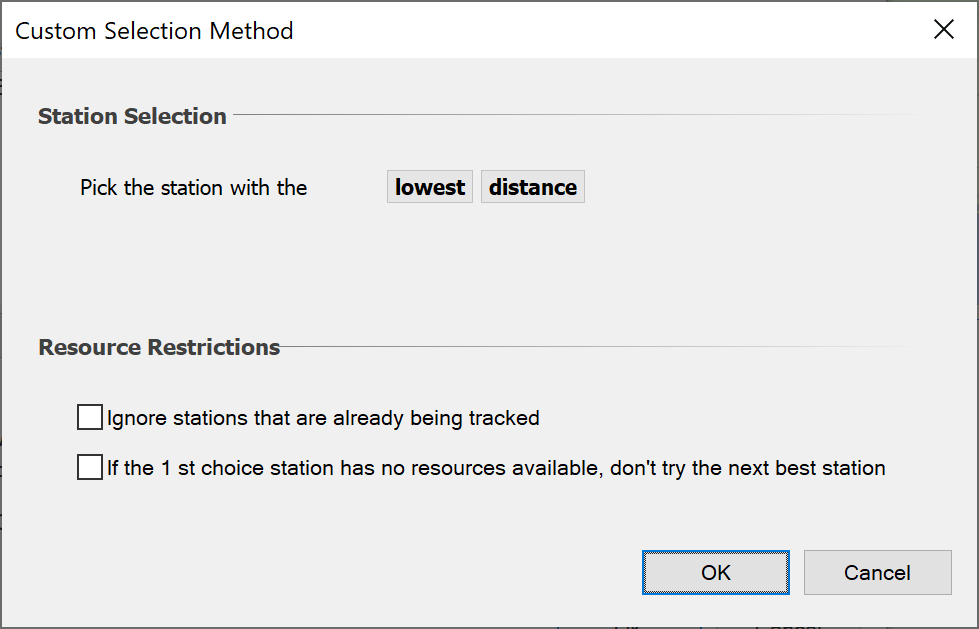
You must make sure that your tracking strategy object does not reduce the candidate list to just one station. If this happens, the throughput will be allocated to just one station.
To ensure that a tracking strategy uses the entire candidate list:
-
Edit the tracking strategy
-
Under selection method, select “Advanced” and then click on “Edit…”
-
Make sure that the check boxes are not checked (as shown below).
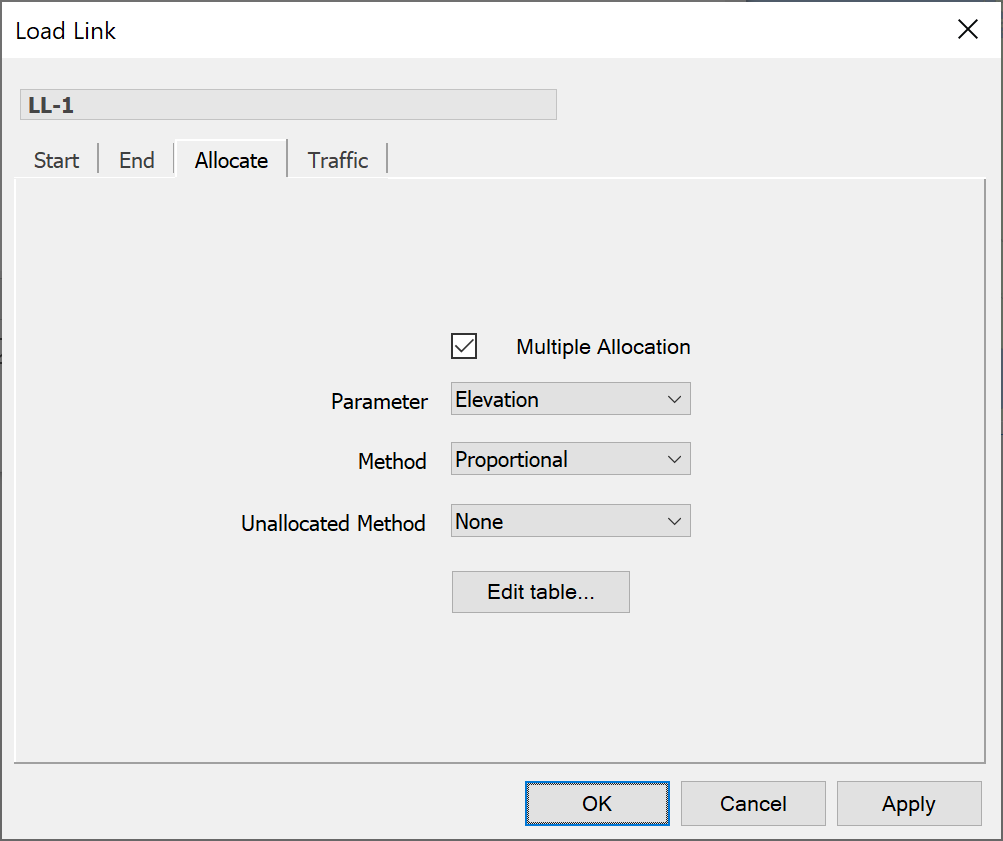
Having set up the tracking strategy and end station selection for your load link, the final step is to decide how load is allocated to multiple beams.
To enable allocation of load to multiple beams:
-
Edit the load link
-
Click the “Allocate” tab.
-
Make sure that the Multiple Allocation box is checked (as shown below).
Before we go any further, let’s just recap on the process of throughput allocation to multiple beams:
- The load link is configured so that the end stations are selected from a group of stations according to a tracking strategy.
- The tracking strategy compiles a list of candidate stations.
- The load link selects which antenna and beam to use.
- The throughput from the start station is then divided into parts that are then allocated to the specified beam on each candidate station.
There are a number of ways of dividing up the load from the start station and sharing it amongst the candidate stations. This is determined by the parameter, method and unallocated method controls (these are visible in the picture above).
The method list provides four ways of sharing the load amongst the candidate stations.
| Method | Description | |
|---|---|---|
| Equal | - | allocates traffic equally amongst the stations |
| Proportional | - | shares the traffic load according to distance or elevation |
| Biased | - | shares the traffic such that there is a bias towards the highest elevation or nearest station |
| Table | - | uses tabulated data to define the sharing of traffic load between stations |
If you choose the proportional, biased or table methods, you need to decide whether you want to use distance or elevation. This is specified in the parameter list.
The load for the station is totalload factor .
For each method, factor is calculated as follows:
| Method | Weighting | Factor |
|---|---|---|
| Equal | number of stations | factor |
| Proportional | factor | |
| Biased | factor | |
| Table | factor |
The unallocated method list determines what happens to throughput, which cannot be loaded onto a particular beam. This can occur if the current load plus the additional load exceeds the maximum for the beam.
The excess load can either be discarded or it can be diverted to a beam on another candidate station that has available loading. To discard the unallocated load, choose “None” from the unallocated method list. To divert the load to a beam on another candidate station, choose “Available loading” from the unallocated method list.
You can look at the discarded load for a load link using the watch window. To do this, select the load link from the “Add watch” options.
You can also collect statistics for the load left attribute. You can plot it on a graph or log it to a file just like any other object attribute.
Load Links on Watch Windows
The principle way to see output from the load link calculations is via the watch window. In addition the watch window can also be used to show the inputs into the algorithm for reporting process.
The key locations to look are:
Under station, for each beam of each antenna:
Load: current load on that beam
Under station, under the traffic:
Maximum throughput: throughput if traffic object is 100%
Maximum load: capacity of this station
Load: current traffic through this station
Under each load link:
Load left: traffic that could not be allocated
Load Links Tutorial
Introduction
This section gives a worked example that shows how load links can be used and combined with traffic objects.
The simulation considers a scenario involving a base station being loaded by traffic from mobile users, using constraints within traffic and load link objects. This is used in traffic modelling and also to calculate interference into a sensitive radio astronomy receiver in an adjacent band.
The simulation will be built in stages as follows:
- Base station, mobiles and carriers
- Load link, traffic and watch window
- TX link, RX link, and interference path
Note that familiarity with Visualyse Professional is assumed to the extent that users are confident in the steps required to create key elements. When parameters are not mentioned they can be assumed to be left as the default values.
Stage 1: Basic Simulation
Open a blank simulation to work with. The first stage involves building the mobile network – i.e. the base station and its mobile users, in the follow steps:
- Create the antennas
- Create the stations, together with their groups and define variables
- Add the carriers
- Configure a view
Antennas
The simulation should already have a single zero gain isotropic antenna which will be used for the mobiles and radio astronomy service. It is therefore only necessary to create an antenna for the base station as follows:
Type: Multiple Identical Beams
Arrangement:
Name: BS 3 sector
Number beams: 3
Azimuths: (0, 120, -120)
Elevations: (-1, -1, -1)
All beams:
Beam type: elliptical
Beam pattern: parabolic
Peak gain: 15 dBi
Semi-major axis: 120°
Semi-minor axis: 5°
Use gain floor: yes
Gain floor: -20 dB
Advanced:
Maximum load: 2
Station Groups:
For convenience all stations are contained within a group. Create three empty groups and add stations as follows:
Group 1:
Name: Base Stations
Add a terrestrial fixed station and configure as follows:
Name: BS-1
Lat/Long/Height: (51.0°, 0.0°, 20m)
Antenna: BS 3 sector
Group 2:
Name: Mobiles
Add a mobile station and configure as follows:
Name: MS-1
Height: 1.5 m
Antenna: Zero gain antenna
Duplicate MS-1 five times to make six mobiles
Create a new define variable to Monte Carlo the position of a terrestrial station over a service area.
Group: Mobiles
Central station: BS-1
Service area radius: 5 km
Service area type: hexagons
Group 3:
Name: RAS
Add a terrestrial fixed station and configure as follows:
Name: RAS
Lat/Long/Height: (51.05°, 0.0°, 20m)
Antenna: Zero gain antenna
Carriers
The simulation should already have a standard 1 MHz carrier defined. Create another with parameters:
Name: WCDMA
Bandwidth: 5 MHz
Traffic:
Access method: CDMA
Number codes: 512
Views:
Open a Mercator view and jump to the UK. On the properties disable show beams and on the overlay tab, active the “20 km square grid at 51N 0E” user defined overlay while switching off all others. Zoom in so the window shows the stations and the grid.
Running the simulation:
The result should be a view similar to this:
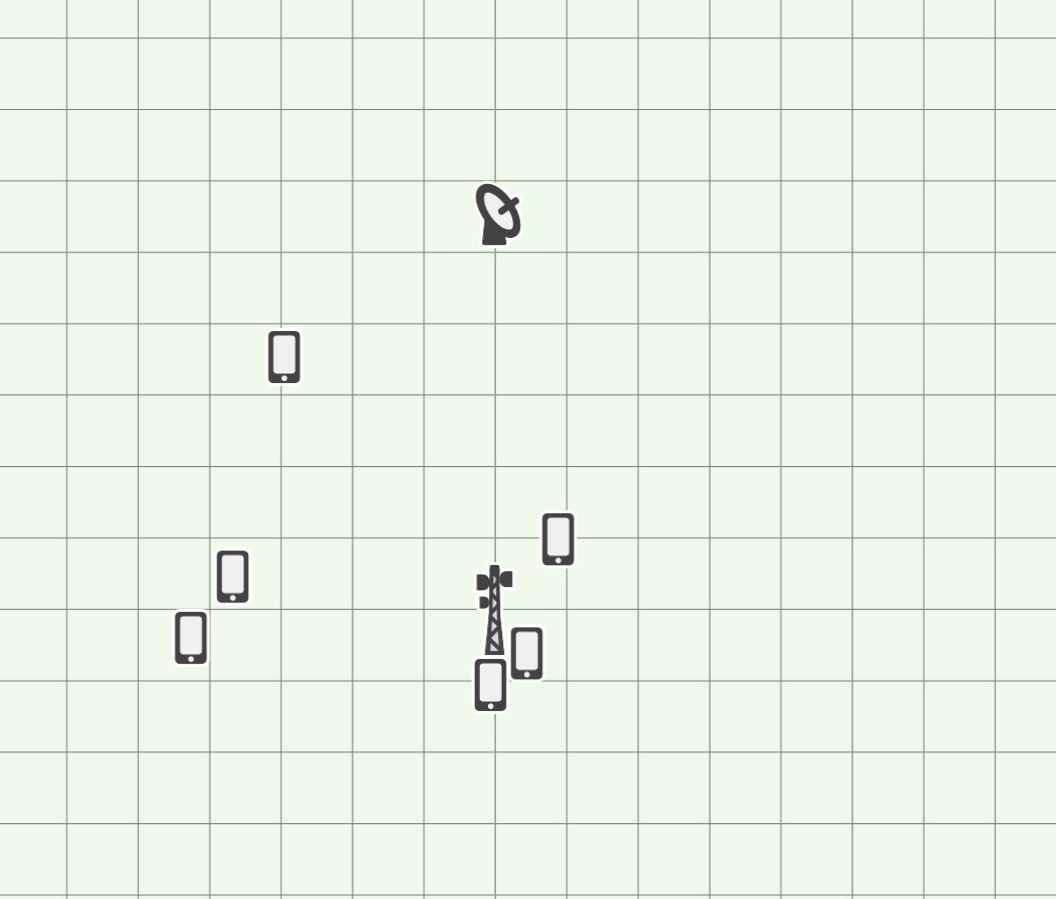
If you run the simulation you should see the locations of the six mobiles change from time step to time step.
This models a single cell mobile network with six users that can be located anywhere in its hexagonal service area. With three sectors there will be on average 2 users per sector, and but as the locations are randomised there could be times where there are more or less users within each sector.
Save this file as “Traffic tutorial.sim”.
Stage 2: Traffic and Load Links
The next stage involves loading the base station with traffic from the users in the following steps:
- Create the traffic object
- Create the load links
- Open and configure a watch window and data vs. time graph
Traffic:
Create a traffic object which will by default be simply on: this will be changed at a later stage.
Load Links:
Open up the load link list and create a load link with following parameters:
Name: LL-1
Start:
Named station: MS-1
End:
Tracking strategy: Named
Station: BS-1
Antenna: Antenna-1
Beam: Highest gain beam
Traffic:
Enable traffic: True
Traffic model: Traffic
Having done this, duplicate the load link five times and change the start station to be (MS-2 to MS-6).
Watch window and Data vs. Time Graph:
Open up a watch window and add the following:
- BS.BS-1.Traffic.Load
- LL-1.Load Left
- LL-2.Load Left
- LL-3.Load Left
- LL-4.Load Left
- LL-5.Load Left
- LL-6.Load Left
Open a Data vs. time graph and select the variable “BS.BS-1.Traffic.Load”.
Running the simulation:
The load left field shows if there is traffic that could not be allocated due to constraints within the model. In most cases the maximum load on the antenna and stations is the default value of 100, apart from the maximum load on each of the sectors of the base station antenna which is set to 2.
Hence in many cases the randomisation of the locations of the mobiles means there is more than 2 within that sector and hence the 3rd mobile will be unable to allocate its traffic. Therefore as you run the simulation you will see non-zero values for the “Load left” – in particular for those at the bottom of the list which are allocated last.
The aggregate traffic can be seen in the base station “Load”: if all user’s traffic is allocated this would be six, but often it is less than this, as can be seen in the plot below of traffic at BS-1 vs. time.
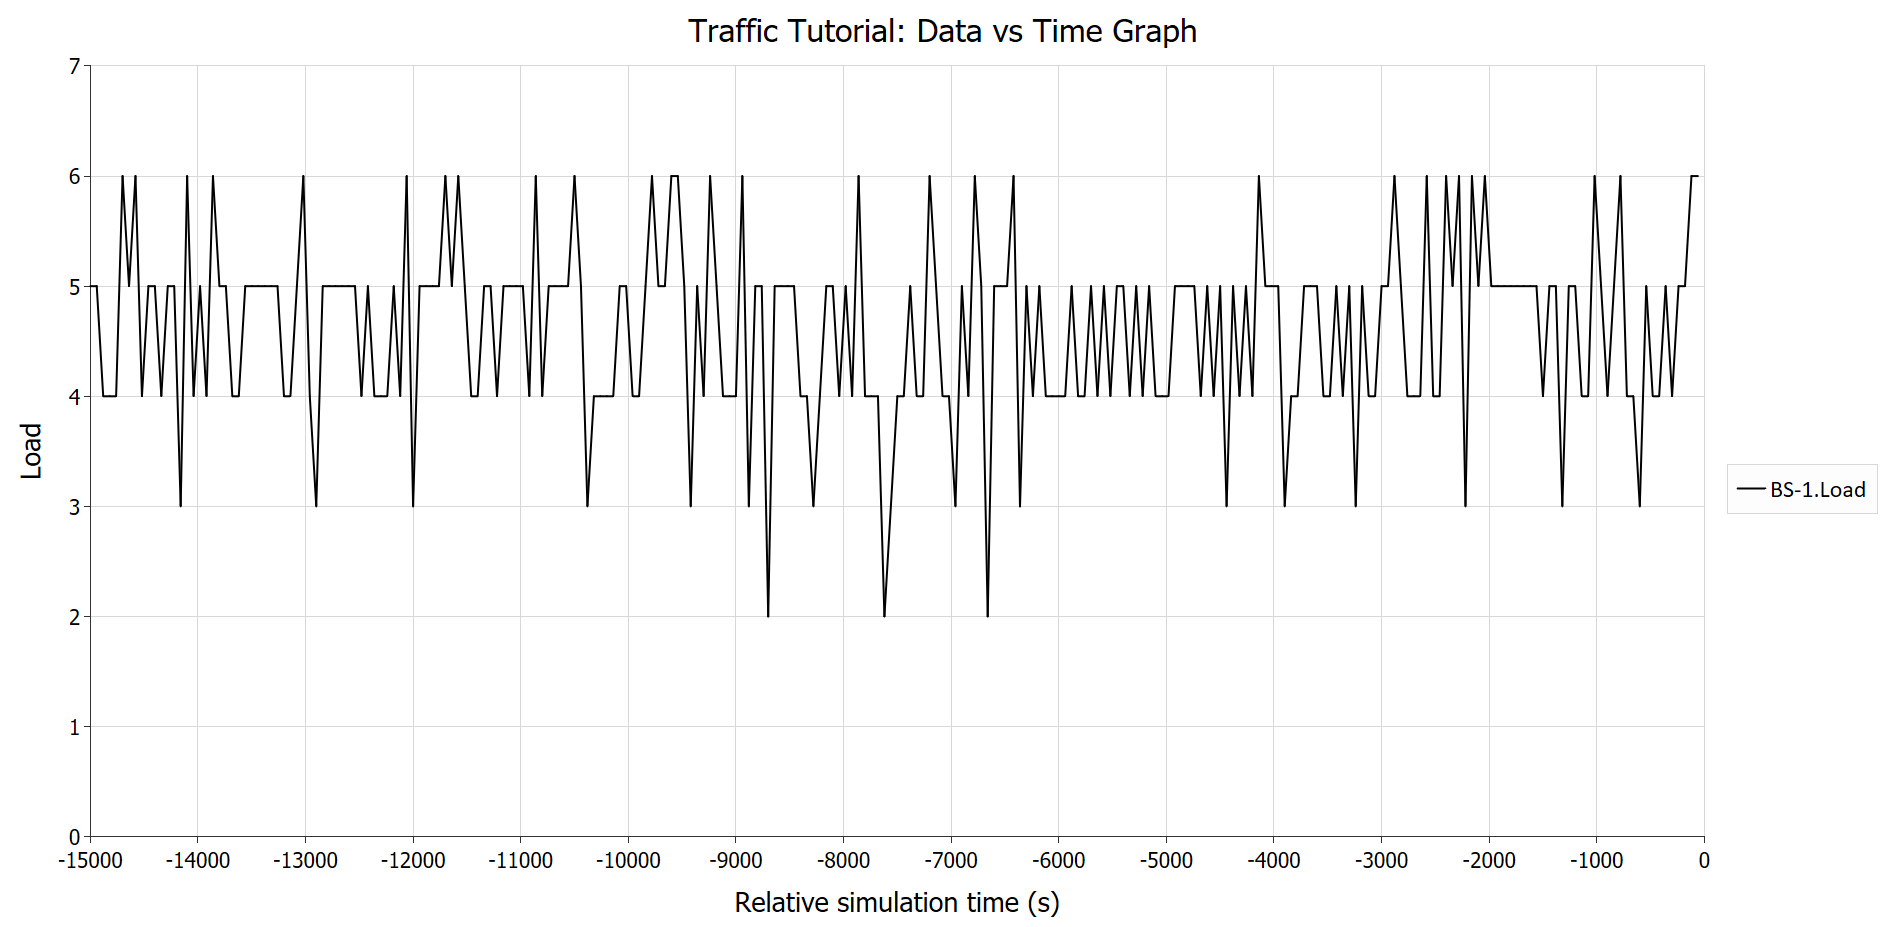
This can be used to analyse quality of service requirements – for example by calculating statistics of failed call requests.
Stage 3: Interference Path
The final stage involves creating the links and interference paths:
- Create the links
- Create the interference path with statistics
- Update the watch window and open a statistics view
Links:
To model the radio astronomy site, open up the link list and create a receive link with following parameters:
Name: RAS RX
Type: Space <-> Earth
End:
Station: RAS
Receive:
Frequency: 611 MHz
Then create the following transmit link to model emissions from the base station in an adjacent band:
Name: BS TX
Type: Terrestrial mobile
Start:
Named station: BS-1
Antennas: All antennas
Transmit:
Carrier: WCDMA
Frequency: 617 MHz
Power: -10 dBW
Traffic:
Number of carriers: Beam load
The traffic field “Number of carriers” = “Beam load” means the transmit power in each sector will depend upon the loading for that antenna. Each user’s downlink is assumed to transmit at -10 dBW1 and because the carrier is defined as using CDMA as the access method, the power from each user will aggregate. Hence if there are two users per sector the transmit power will be -7 dBW.
Finally configure the “Terrestrial Mobile” propagation model to use Hata / COST 231 for interfering paths, setting the environment to be open.
Interference Path and Statistics:
Create an interference path with following options:
Wanted link: RAS RX
Interfering link: BS TX
Advanced:
Check overlap: false
Other adjustments: 45 dB
Bandwidth adjustment: none
This sets up the interference path for an adjacent band scenario with 45 dB of attenuation compared to the systems operating co-frequency.
Under statistics, select threshold type = “I”, level -143 dBW2, and activate collect histogram with 1 dB bins.
Watch Window and Statistics Graph:
Add the following to the existing watch window:
- RAS RX.All Interferers.No. of Interferers
- RAS RX.All Interferers.I
- RAS RX.Statistics.I statistics.Percentage bad steps
- RAS RX.Statistics.I statistics.Worst value
- RAS RX.Worst Interferer.Interfering Power
- RAS RX.Worst Interferer.Interfering Relative Gain
Then open a new distribution chart and show a histogram of the interference.
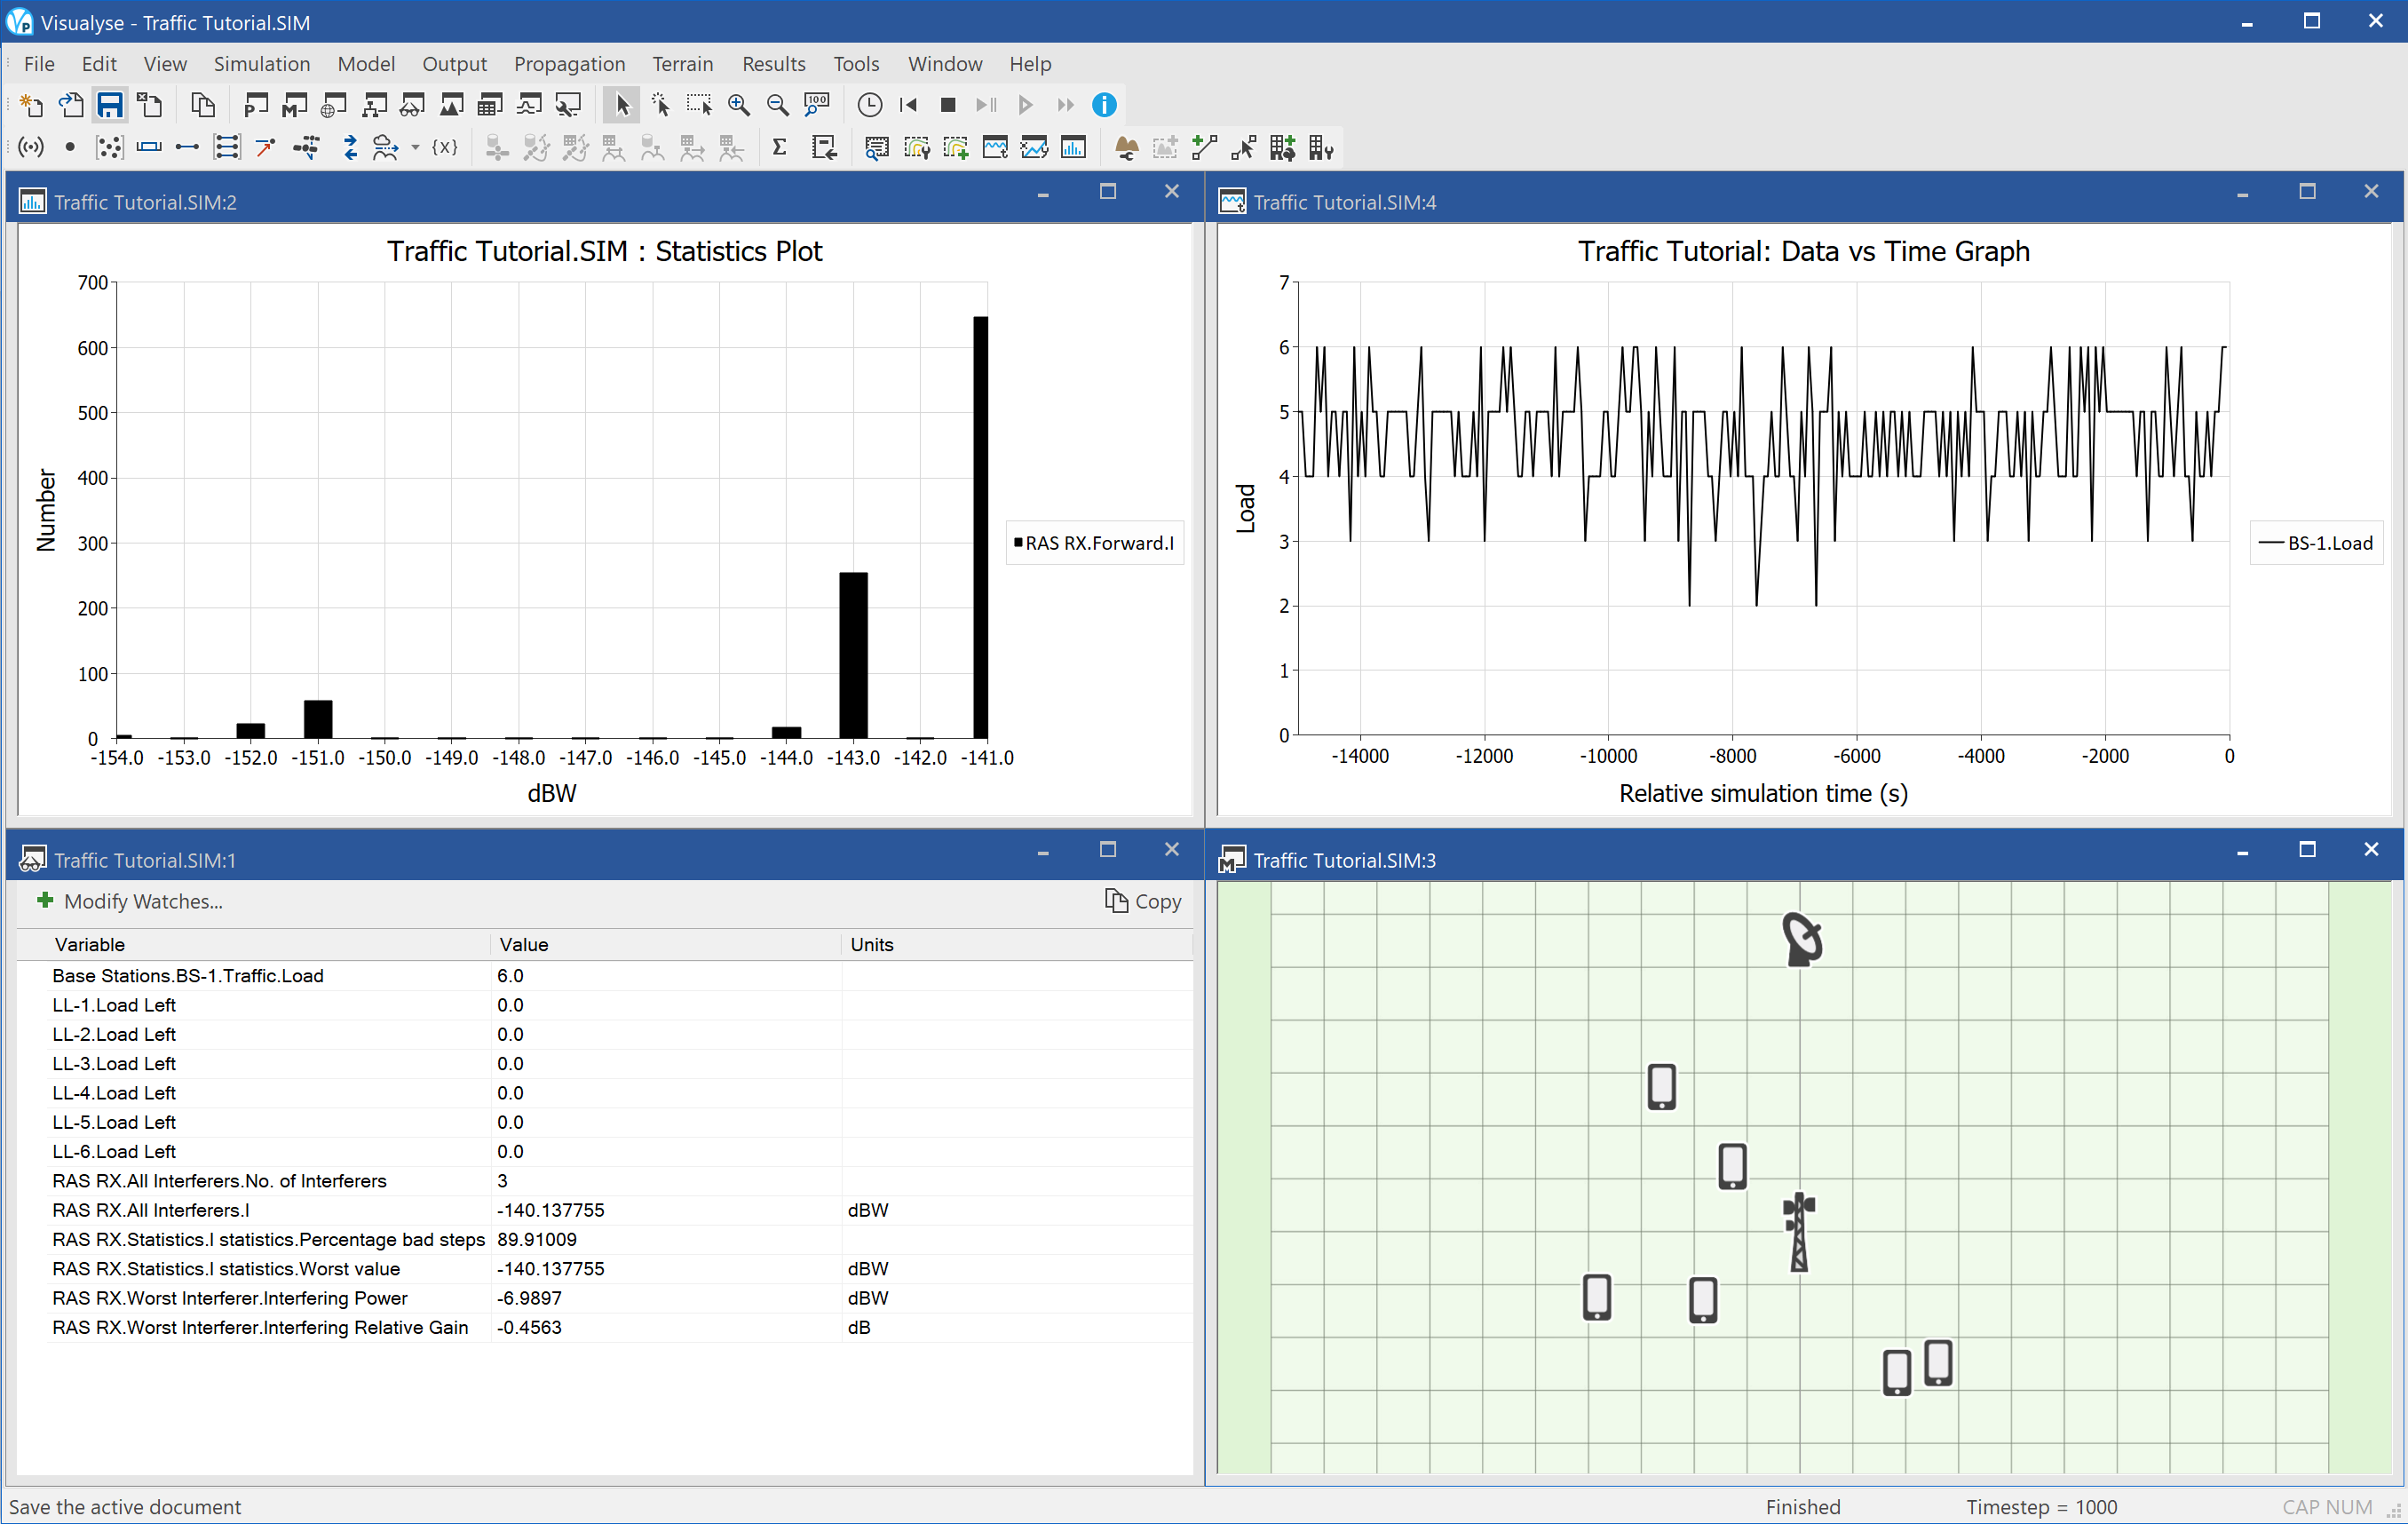
The resulting simulation should look something like this at the end of the run:
Running the Simulation
Having created the basic simulation it is possible to undertake some analysis.
Notice that as the location of each of the mobiles is randomised the number in each sector varies from none to up to six. As the limit of loading per beam is two, this means that in situations where there is three or more mobiles within a sector there will be traffic that cannot be allocated
Hence the load link’s “Load left” is often non-zero – in particular for the last few load links to be allocated. The first two load links should always be able to allocate their traffic.
The traffic at the base station will therefore vary, depending on whether the sector limit is met. The traffic will only reach 6 units if there are exactly 2 users in each sector.
As the traffic per sector varies in the range (0 – 2) the interference at the radio astronomy site varies. The field “No. of interferers” refers to number of sectors i.e. antenna beams that are causing interference. As at times some sectors will be empty the number can drop below 3. It will never reach zero as the users should at all times be in one of the three sectors!
The number of users per sector will impact the EIRP of that sector: look at the transmit power of the worst interfering link budget and it will be either -10 dBW (one user) or -6.9 dBW (two users)
If there are no users in the sector pointing towards the radio astronomy site then interference will come from the side lobes of the other two sectors – typically 12 dB lower.
Over the 1,000 time step run the probability of interference should calculated to be about 90% with worst value -140 dBW (actual numbers could be slightly different depending upon random number seed).
Variations on the Simulation
The basic simulation can be varied in a number of ways. Try re-setting the simulation to its start and then carrying out the following changes one by one:
Remove the sector load limit
Change the “BS 3 sector” antenna maximum load to 100 and re-run: all load links will be able to allocate all their traffic and hence the base station traffic will always be six. The highest interfering level increases to 137.7 dBW to reflect situations where the sector pointing towards the radio astronomy site has more than 2 mobiles.
Set a base station sector limit
Set the maximum traffic to the base station as being 4: in this case the last two load links will always have traffic unallocated as the previous ones will fully use up the total for the station. Both the percentage of steps bad and worst interfering level will decrease due to this additional constraint.
Add a high traffic user
Set the maximum through-put for mobile “MS-1” to be 10 (e.g. representing high speed data rather than voice): this is greater traffic than the base station can manage, and so this mobile will have 6 units unallocated and all other load links will be unable to allocate any traffic. The histogram will show two bars – one when MS-1 is in the sector pointing towards the radio astronomy site and another twice as frequent for the other two sectors.
Add traffic modelling
Set the maximum load for the base station to 12 so not all load links can be active at once. However also change the traffic object to use a state machine model with probability active/on/off as 50%. This will increase the variation in users active and result in probability of interference reduced to around 30%.
Include exclusion zone
In the traffic object include a 3 km exclusion zone around the radio astronomy site where mobiles must switch off. This reduces the probability of interference to around 18 %
Modify mobile network
To reduce the interference even further, increase the downtilt on the base station’s antenna to 3° and reduce the power per user to -14 dBW and re-run the simulation. The probability of interference should in this case be under 1%: this could be an acceptable level.
Summary
This tutorial has shown how the load links can be used to model traffic within a network and how that in turn can be used to model interference into other systems.
This basic simulation could be extended in many other ways. For example there could be a larger deployment with more base stations and mobiles. In these situations there could be alternative routes for the traffic – not just the nearest base station but also the 2nd nearest could be considered. Hence the traffic identified in this simulation as “Load left” could be routed to another base station. This can be included by using the load link’s “Allocate” functions.
By including these additional factors a more detailed model of complex networks can be generated, improving the ability for communication systems to share the radio spectrum.