Building the Simulation Files
Plan of Action
Now we will build a simulation from scratch. The following steps outline the approach needed:
-
Create the WiMAX Network
- Make a sectored antenna
- Create single base station
- Create and configure a transmit link
-
Define the FSS earth station:
- Make a single beam antenna
- Create a single station
- Create and configure a receive link
-
Set up the interference calculation from WiMAX into the Earth Station (ES)
The resulting file is useful in its own right as it gives an example of the sort of simulation that can be used to coordinate a single specific base station with an earth station.
-
Set-up an area analysis showing the exclusion zone around the WiMAX base station:
- Define the threshold criterion
- Use the area analysis to show points below the threshold in a different colour from points above the threshold.
Once the simulation is set up there are several things that you can do with it – for example use mitigation to reduce the exclusion zone.
In addition, it can be useful to consider the effect of multiple base stations and so the final stage is to set up a hexagonal grid of base stations to determine the coverage of the network.
Finding Your Way Around
The basic simulation will comprise two systems, the satellite Earth station and a WiMAX base station.
In Visualyse Professional systems and scenarios are built from the basic building blocks including Antennas, Stations, Station Groups, Carriers, Links, Link Groups, Propagation Environments, Interference Paths, plus other more specialised ones. Note you do not always need all of these blocks!
In this case, you will need to make:
Antennas: Two: one for the Earth station and one for the base station
Stations: Three: the Earth station, the GSO satellite it is pointing at, and the base station
Carriers: Two: one for the satellite downlink and another for the WiMAX downlink
Links: Two: a transmit link to define emissions from the WiMAX base station and a receive link for the satellite Earth station
Interference Paths: One: from the WiMAX Transmit link to the Earth station receive link
All these can be found on Visualyse Professional’s Model menu, which brings you to list managers that can be used to add, delete, modify, and duplicate items of that type.
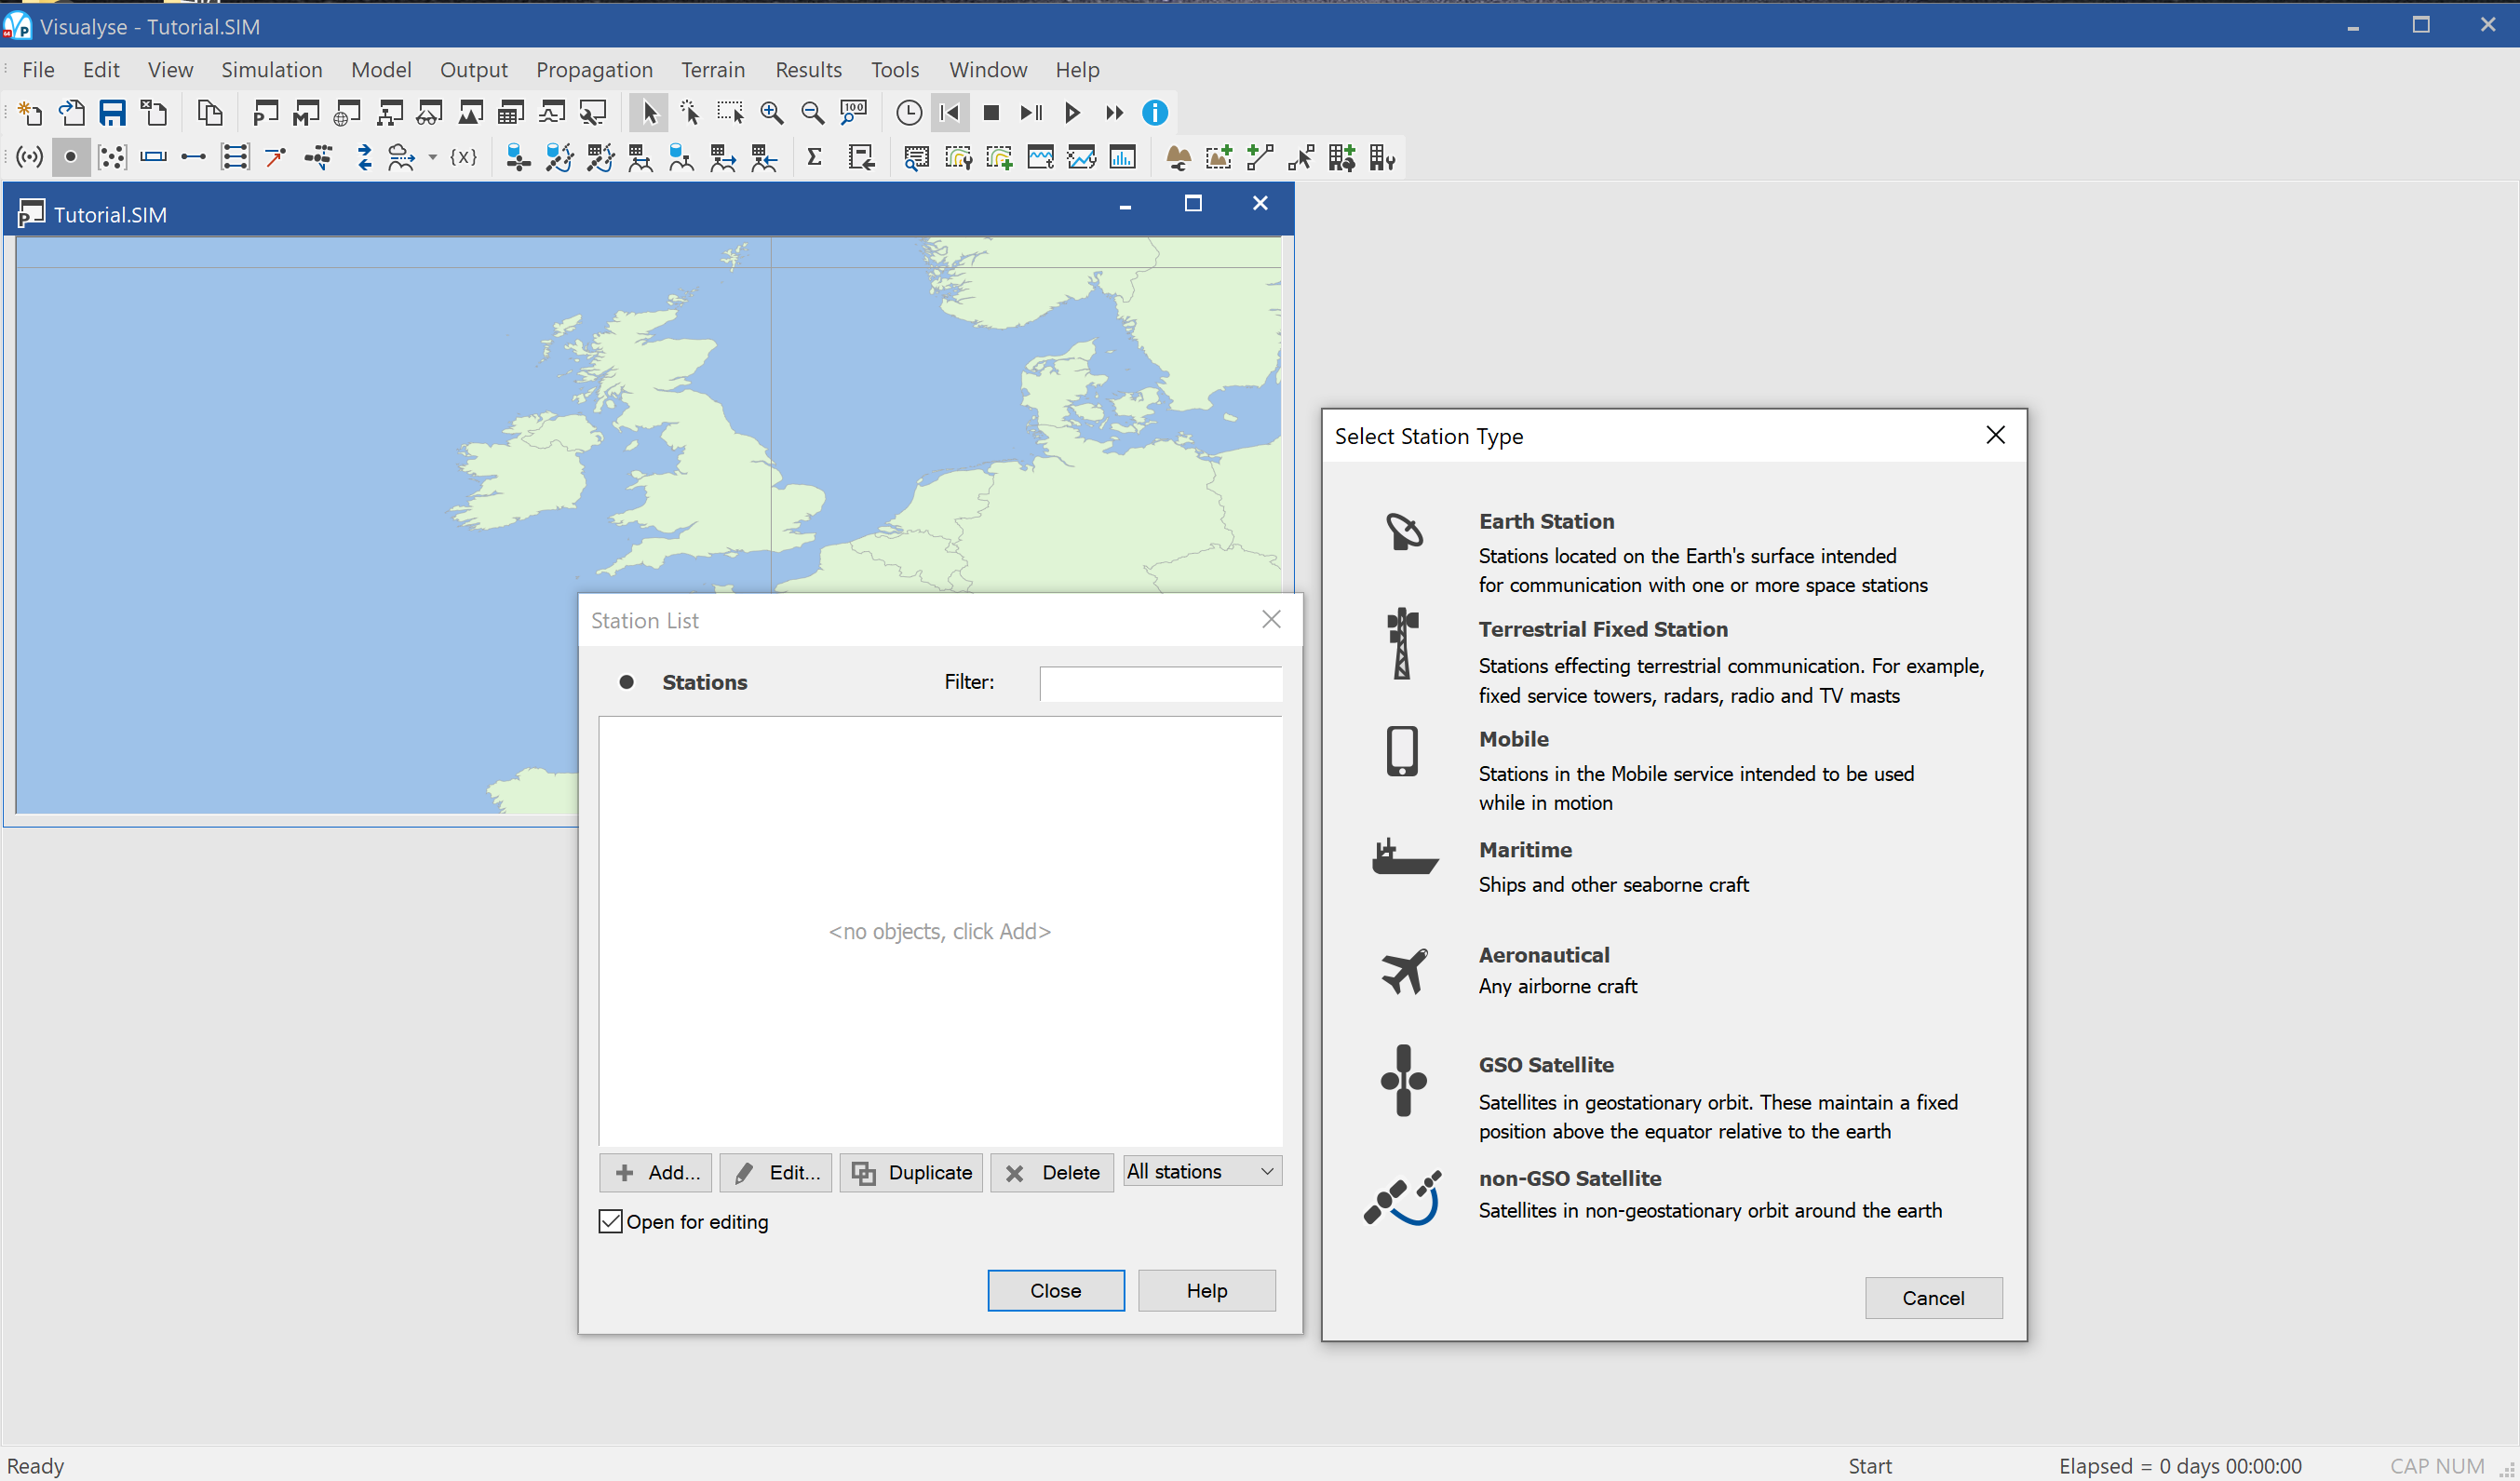
Often if you click on “Add” you will be given the option to specify what sort of object you want to configure – for example the screen shot below shows the list to manage stations and what happens if you click “Add”.
You will also need to configure:
Propagation Environments: Configure the propagation models for Terrestrial Fixed links such as from the WiMAX base station to Earth station path
These can be found under the “Propagation” menu.
Input Parameters
WiMAX Parameters
For this exercise, we will use the following document as a reference for our WiMAX system.
Reference 1: Mobile WiMAX – Part I: A Technical Overview and Performance Evaluation, prepared on Behalf of the WiMAX Forum February 21, 2006
In the first instance, we want to extract the essential features of a WiMAX network needed to make Visualyse Professional models of the sharing scenario.
We start with the base station network. As noted above we are going to model two WiMAX scenarios:
- Single entry interference from a single base station
- Aggregate interference from a deployment of multiple base stations
A key fact for the aggregate cases comes from Reference 1 (p28) relates to frequency re-use.
The sub-channel reuse planning can be dynamically optimized across sectors or cells based on network load and interference conditions on a frame by frame basis. All the cells and sectors therefore, can operate on the same frequency channel without the need for frequency planning.
Hence when we consider the possible aggregate interference from multiple base stations we can assume all co-frequency, and therefore we need to have a representative deployment.
It can be time consuming to fully engineer a network with good coverage with the minimum of base stations, so it is often the case that simplifying assumptions are used.
One such assumption is that the base stations are regularly spaced on a grid – Visualyse Professional can do this so it’s a good starting point.
Alternatively, we can do a rough engineering job by moving stations by hand to optimise the network coverage.
A final option is to import station locations from an excel spreadsheet – perhaps sourced from an assignment databases.
We can try all three in different groups. Using different approaches, each valid to some degree, is a good way to check the sensitivity of the conclusions from the analysis.
Reference 1 gives us a starting point for the base station to base station distance of 2.8 km – that and other parameters are given in the table below.
| Parameter | Value |
|---|---|
| Number of 3-Sector Cells | 19 |
| Operating Frequency | 2500 MHz |
| Duplex | TDD |
| Channel Bandwidth | 10 MHz |
| BS-to-BS Distance | 2.8 kilometres |
| Minimum Mobile-to-BS Distance | 36 meters |
| Antenna Pattern | 70° (-3 dB) with 20 dB front-to-back ratio |
| BS Height | 32 meters |
| Mobile Terminal Height | 1.5 meters |
| BS Antenna Gain | 15 dBi |
| MS Antenna Gain | -1 dBi |
| BS Maximum Power Amplifier Power | 43 dBm |
| Mobile Terminal Maximum PA Power | 23 dBm |
| # of BS Tx/Rx Antenna | Tx: 2 or 4; Rx: 2 or 4 |
| # of MS Tx/Rx Antenna | Tx: 1; Rx: 2 |
| BS Noise Figure | 4 dB |
| MS Noise Figure | 7 dB |
Note use of dBm for the transmit power rather than dBW as entered into Visualyse Professional.
Satellite ES Parameters
Several satellite operators provide services in C band. The parameters used below are generic not specific to one network.
Building a Basic Simulation
The first stage is to create a simulation that models interference at a single point.
Stage 1 - Defining a Single Base Station
The following bullet points outline the steps you need to take and the parameters you need to input
- You need to create a single antenna with three identical beams. So, you need to add an antenna and select ‘Multiple Identical Beams’.
- Reference 1 is quite sketchy about the details of the beam performance – a fairly normal situation for future planned systems standards that need to cover a wide group of implementation.
- The information we have is that the gain is 12 dB, the beamwidth 140 and the front-back ratio is 20 dB.
- We have used the parameters below
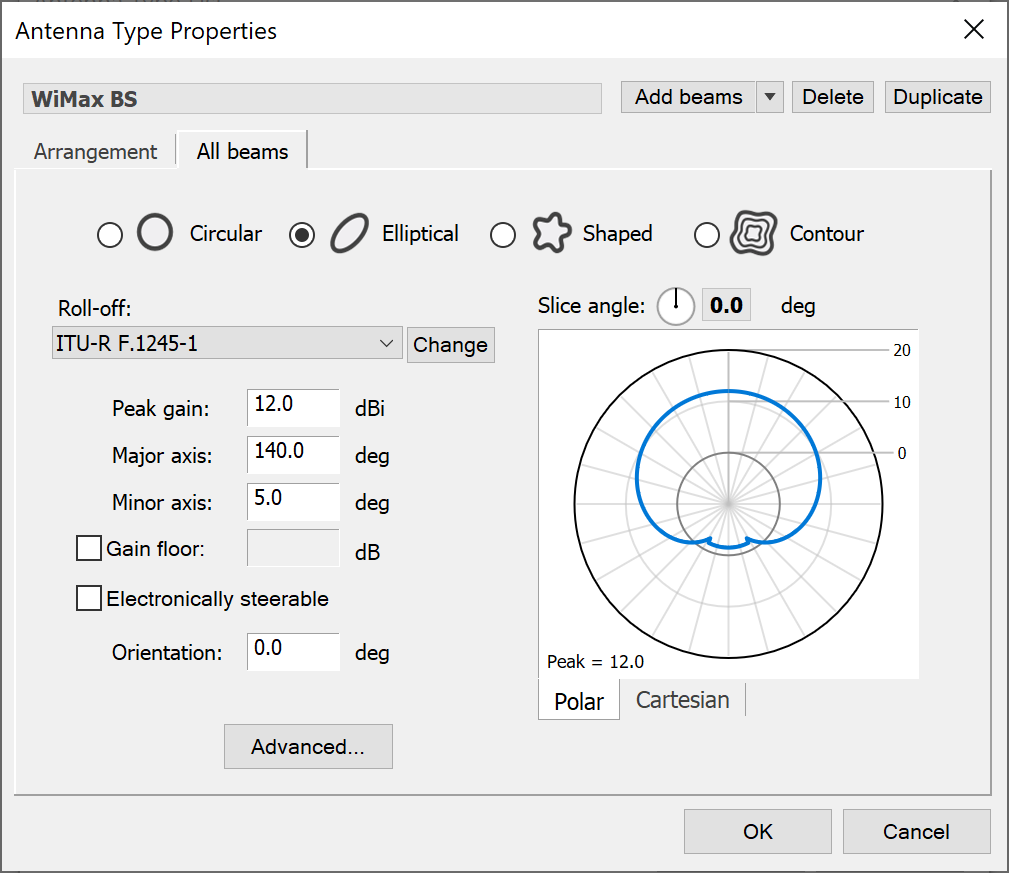
- Note use of elliptical pattern with beamwidth 140 horizontal and 5 vertical
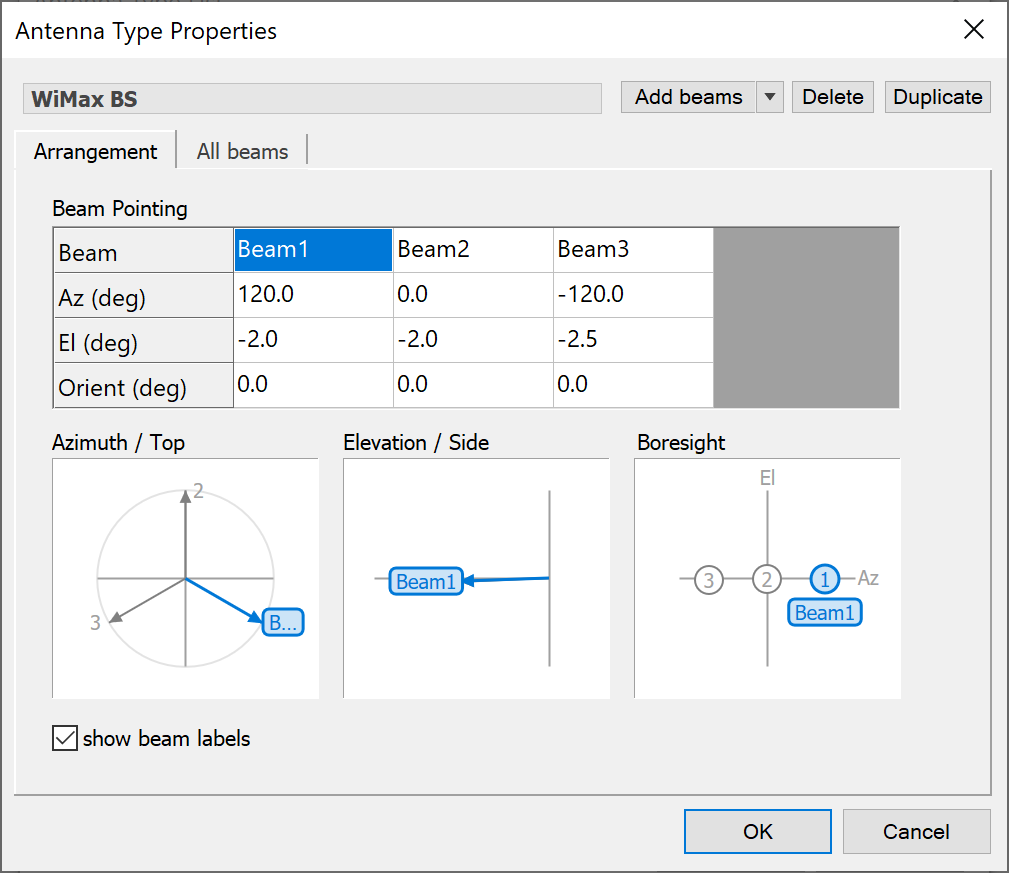
- The beam arrangement is such that there are three equally spaced sectors – this is achieved by setting the pointing angles as shown below (note that each beam has a 2.5 downtilt).
-
Once the antenna is created, make a terrestrial station at the following location:
- Latitude = -33.88
- Longitude = 151.21
- Height = 32 m as per Table 7 of Ref 1.
-
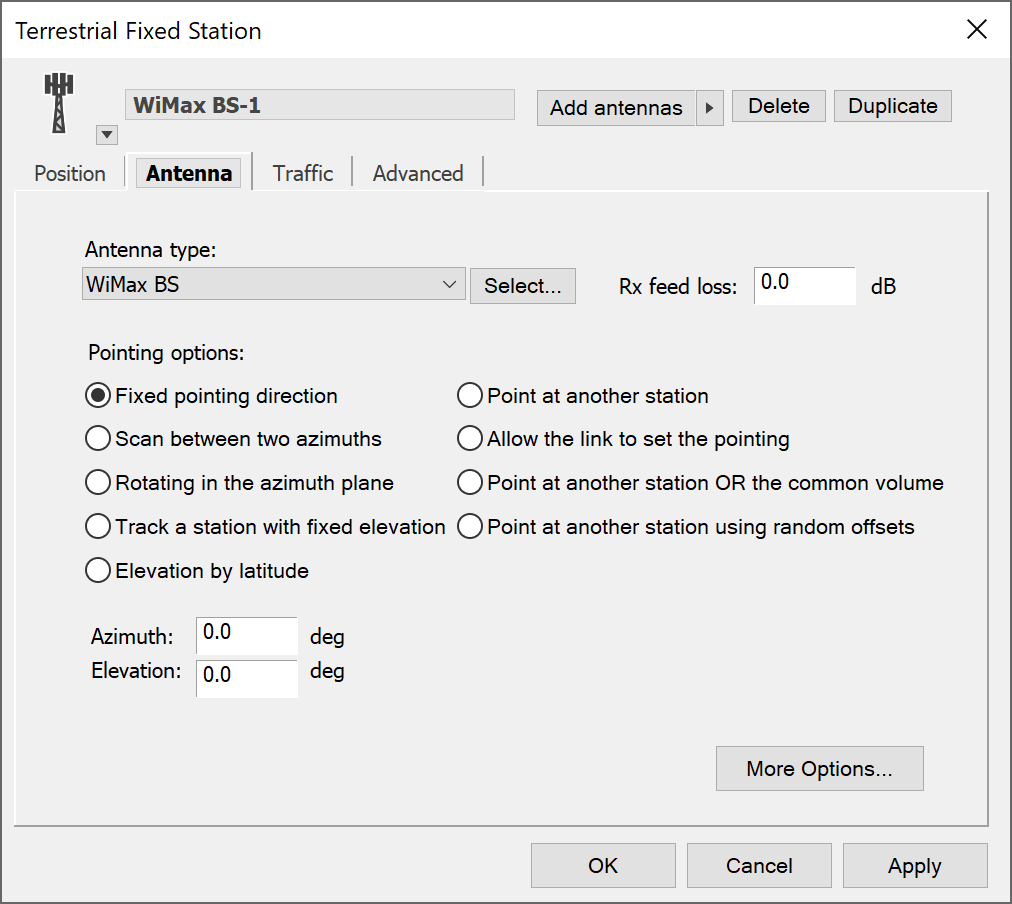
Add the antenna to it – the key parameter is in pointing the antenna. The antenna tab should look like this
- Open a Mercator view, right click and select properties to open the view configuration and make sure:
- Features tab: Beams and Station icons are enabled
- Adornments: a grid resolution of 1° is selected
- Overlays tab: The Mercator Earth Medium overlay is enabled
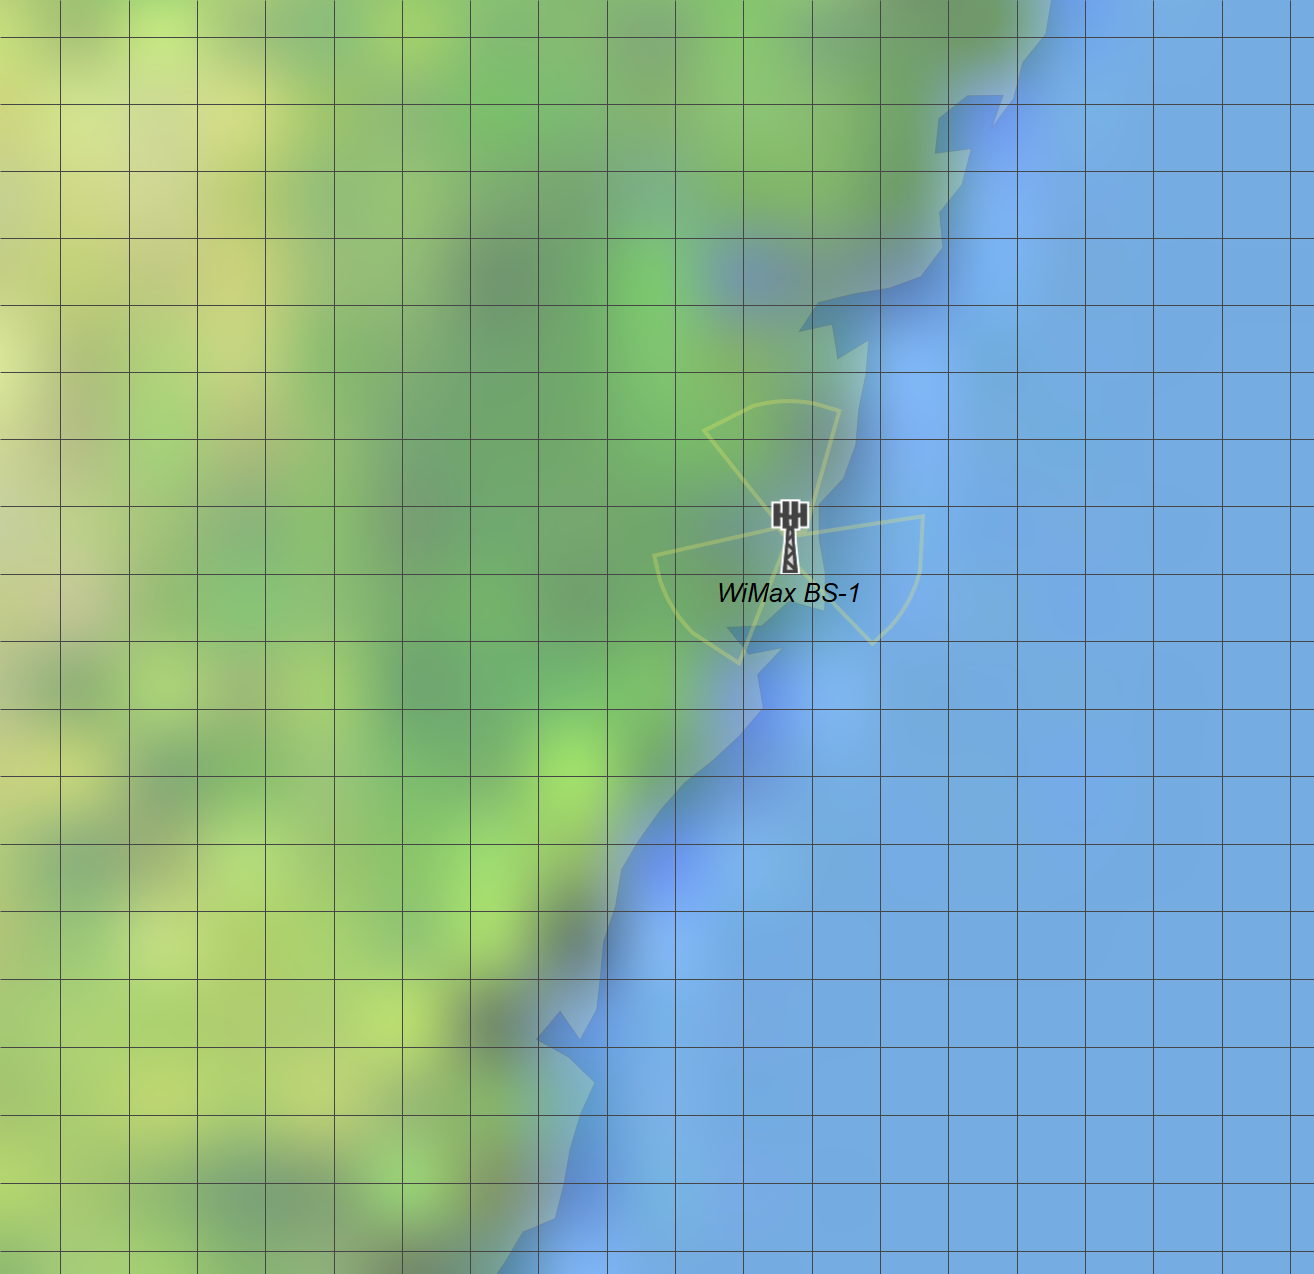
- Then centre the map on the stations and zoom in using the mouse wheel until the view looks a bit like this:
Now the question is how to define the emissions from base station and which propagation models and parameters to use.
- First create a carrier for the WiMAX with bandwidth 10 MHz and using linear polarisation
- Set up a transmit link as follows:
- Transmit all beams of the WiMAX station
- Select the 10 MHz carrier
- Set the frequency to 3.6 GHz
- Set the transmit power to 13 dBW (43 dBm)
- Set propagation environment to terrestrial mobile
We must then configure the terrestrial mobile propagation models.
The propagation model and parameters can have a huge impact as discussed above. In this case leave the model as Rec.P.452, but configure to set a fixed percentage time as in the figure below.
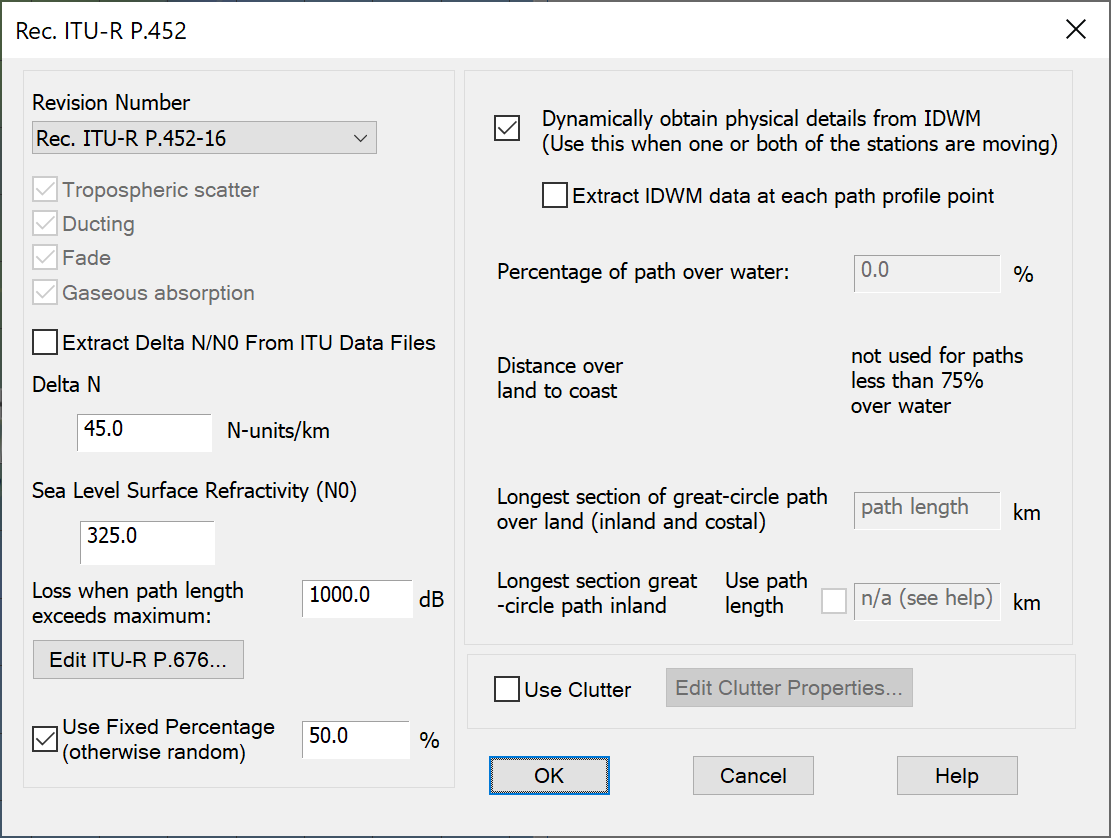
Note: We are using IDWM to tell ITU-R Rec.P.452 which paths are over sea and which over land, and hence need the IDWM Module. If you do not have this Module the simulation will still work, but with slightly different propagation over water.
Essentially this stage is now complete – you have defined a template base station. Save this work as Stage 1.
Stage 2 - Defining the Earth Station
Create a satellite ES with parameters such as:
Antenna: single circular beam antenna defined by dish size and efficiency,
- Antenna dish size = 3 m
- Antenna efficiency = 0.6
- Antenna gain pattern = Rec.S.465
GSO Satellite (to point the ES at)
- Position = 150E (this gives an elevation angle of about 17 degrees at the ES)
Earth Station:
- Position = (-33.94, 150.87)
- Height above terrain = 5m
- Add an antenna with pointing = at GSO satellite
Carrier – we will use a reference 1 MHz carrier to do the I/N calculations, hence:
- Bandwidth = 1 MHz
- Polarisation = Linear Horizontal
Having done that, create a receive link at the ES with the following:
- Frequency = 3.6 GHz
- RX Temp = 250K
- 1 MHz reference bandwidth (BW) carrier
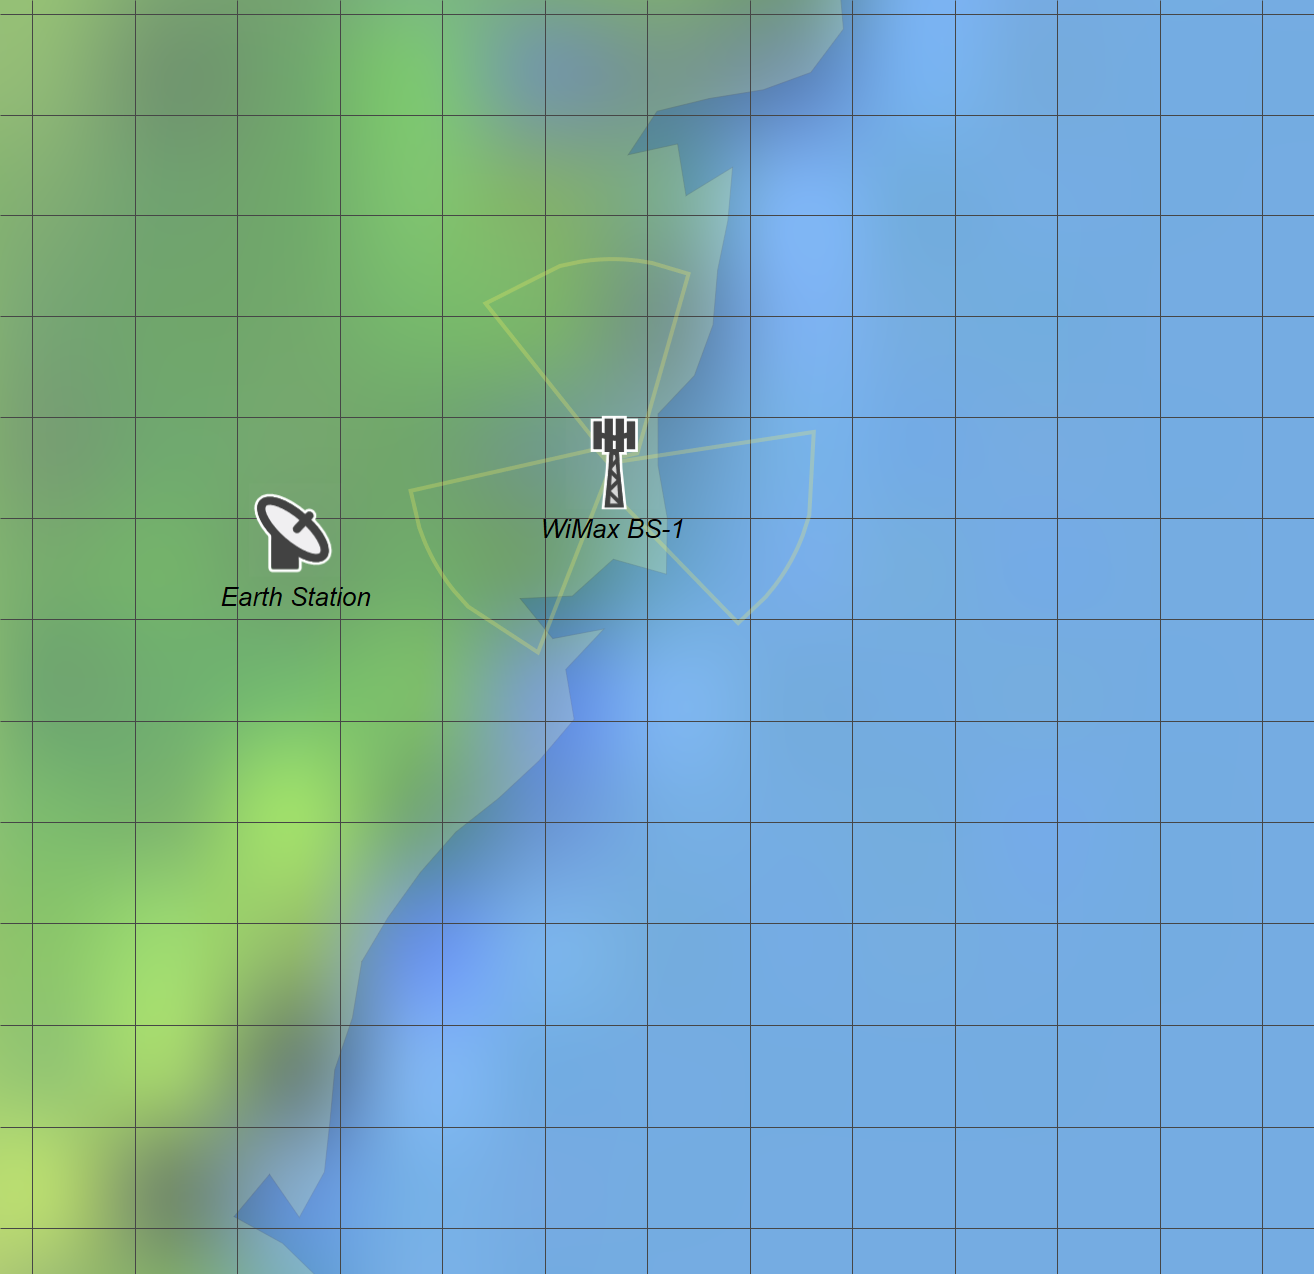
Having done this there should be two stations as in the figure below:
Stage 3 - Defining the Simulation
Having created the TX and RX links it is necessary to configure the rest of the simulation, and create:
Interference Path:
- Victim = ES RX link
- Interferer = WiMAX TX link
- Options = leave at default
Statistics:
- Activate I/N statistics with threshold -10 dB
Then option a watch window to look at the interfering worst single entry link budget into the ES and a terrain path profile to measure the distance between the two. The result should look at bit like this:
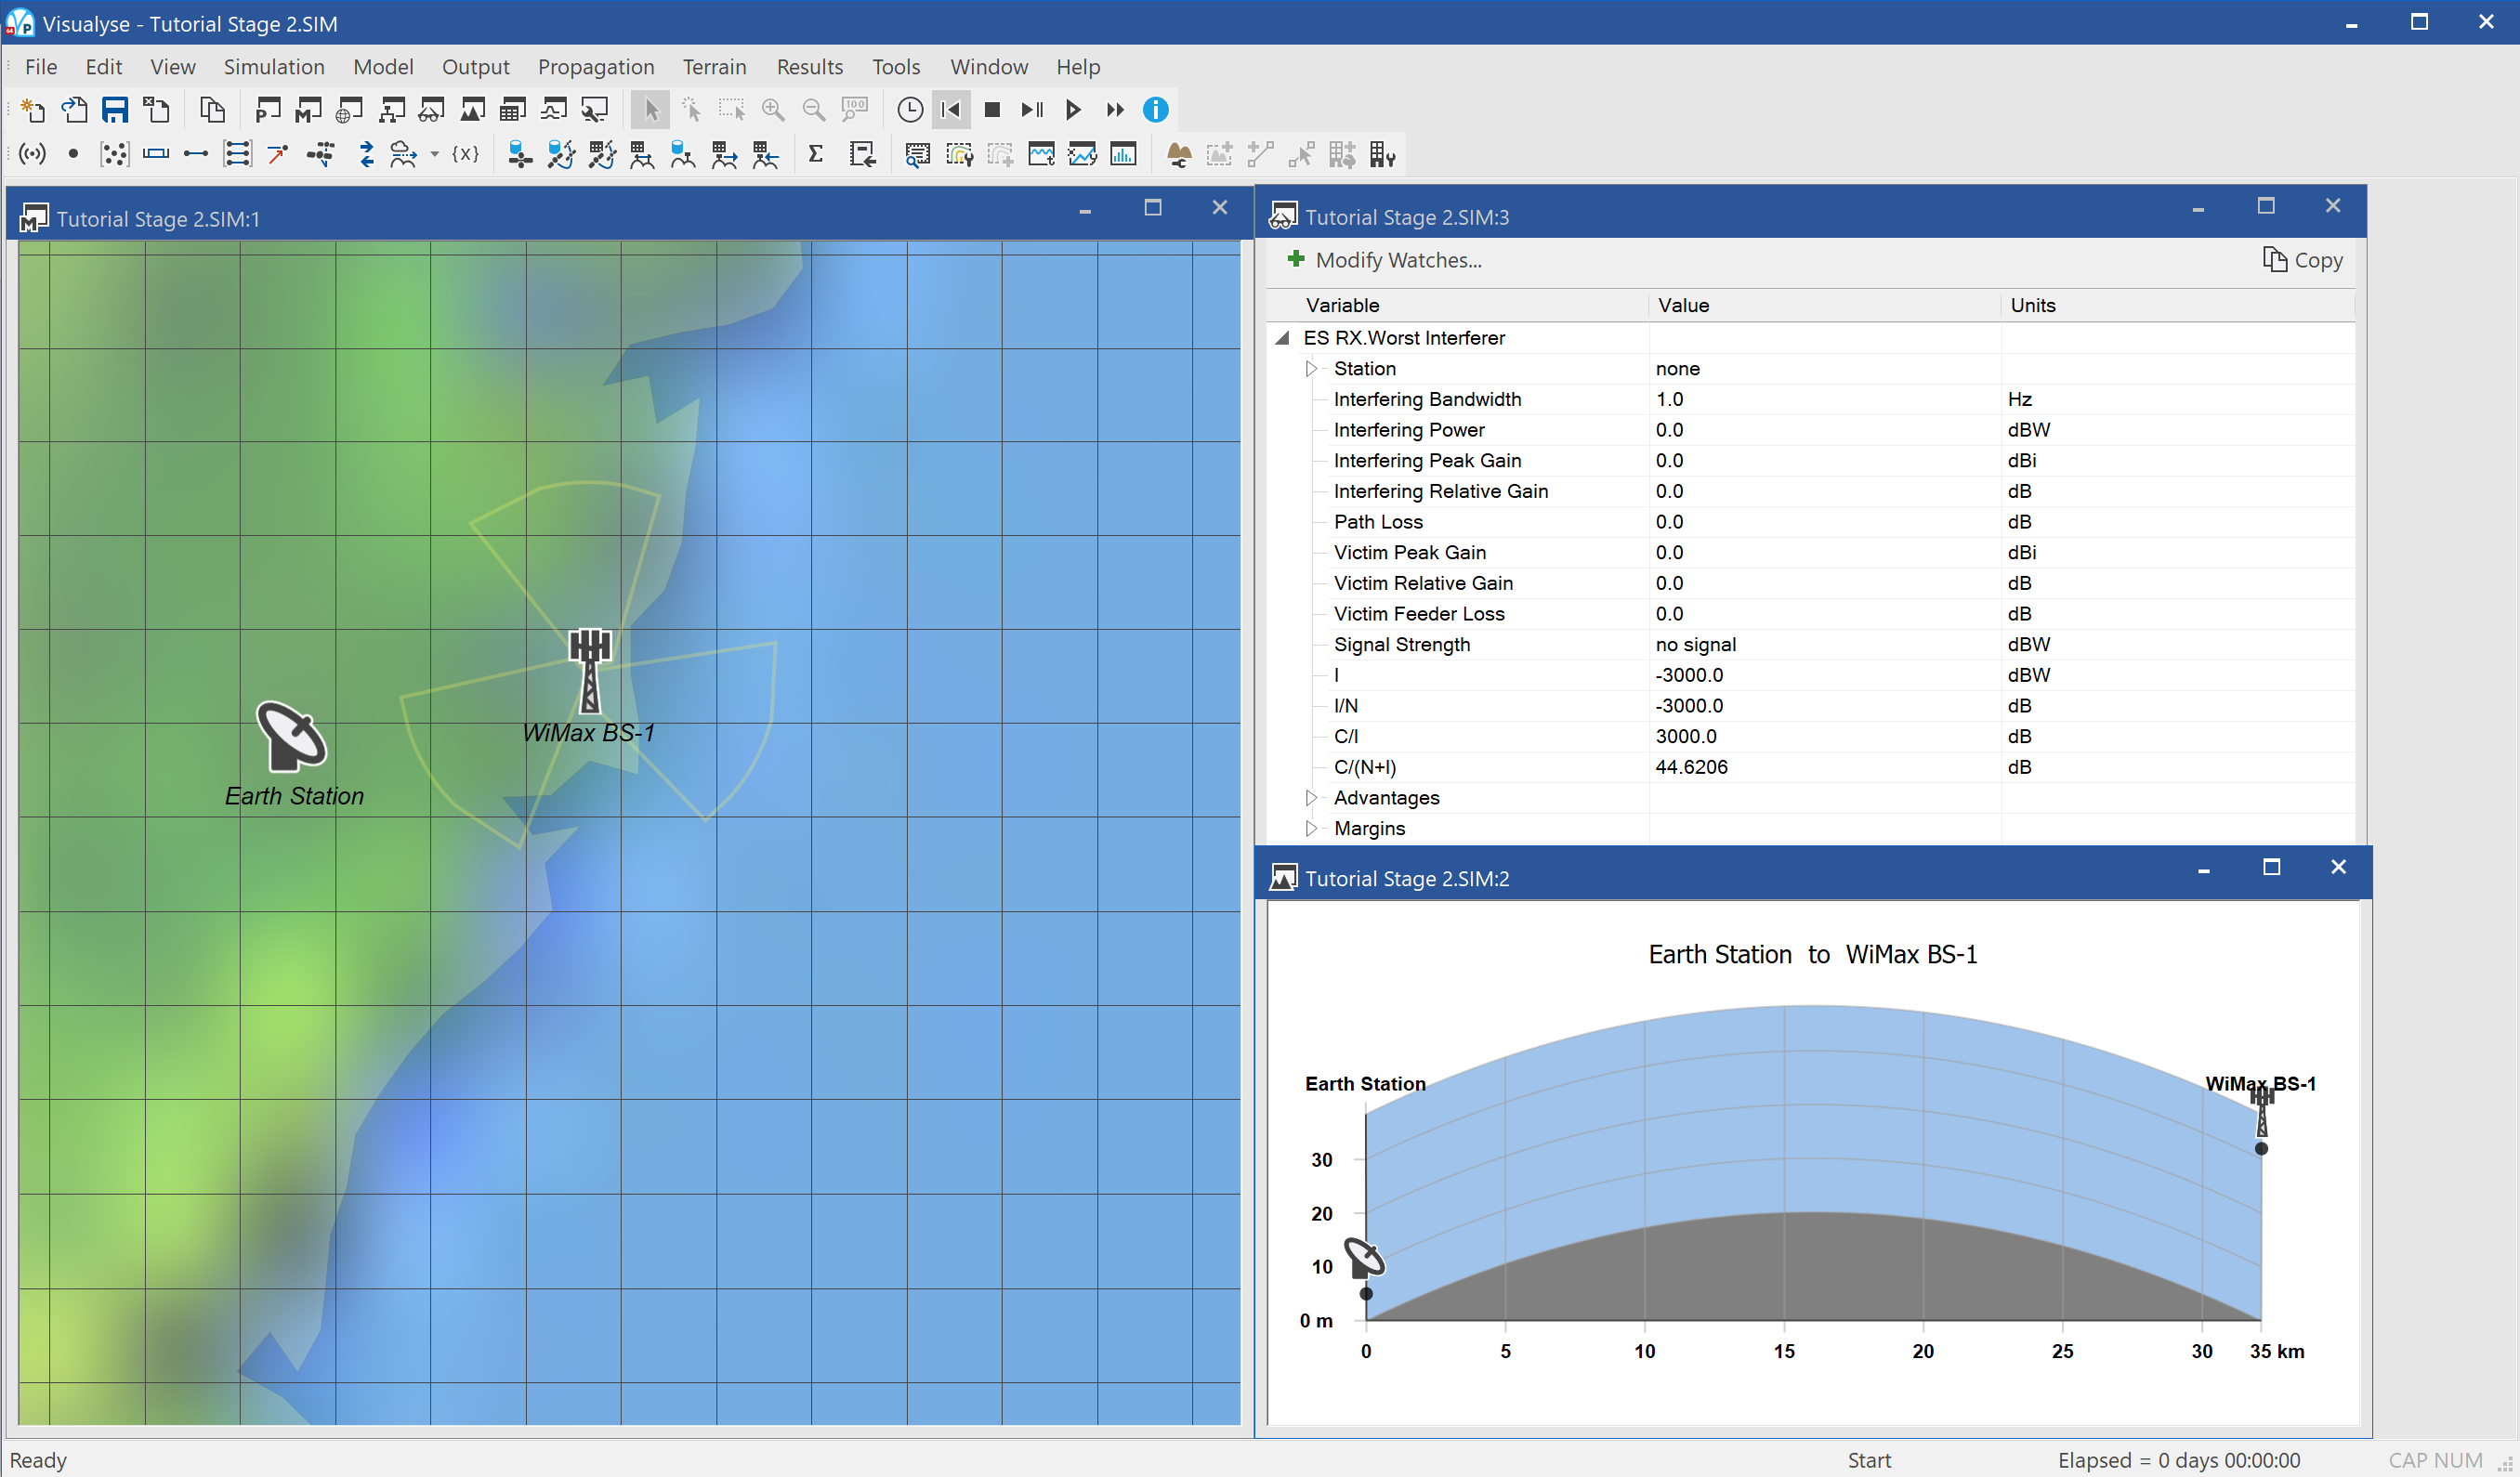
Note that the I/N exceeds the threshold even though the stations are separated by about 32 km.
This file can be saved as Stage 3.
This simulation file could be the basis of a study to coordinate the deployment of a single base station against an Earth Station. Having created the baseline file, you could vary the:
WiMAX Network:
- Antenna downtilt
- Antenna pattern (e.g. use measured data)
- Antenna azimuths
- Number of antennas
- Transmit power
Earth Station:
- Dish size
- Interference threshold
- Availability requirement (and hence % used in Rec.P.452)
Area Analysis
The next phase is to repeat the analysis undertaken at a single point (above) over an area and showing how it varies. This is done using the Visualyse Professional Area Analysis tool.
There are many ways in which the Area Analysis can be used – two of interest are to:
- Vary the location of the WiMAX base station to see how the interference at the Earth station would vary depending upon its location and define exclusion zones around the Earth station where WiMAX could not be deployed
- Vary the location of the Earth station to see how the interference it receives would vary depending upon its location, and hence define exclusion zones where an Earth station could not be deployed because of a WiMAX base station
In this case, we are going to do the second of these and vary the location of the Earth station.
To create the Area Analysis, select map view, click on the icon from the toolbar, then click in the top left of the map and drag across to the bottom right.
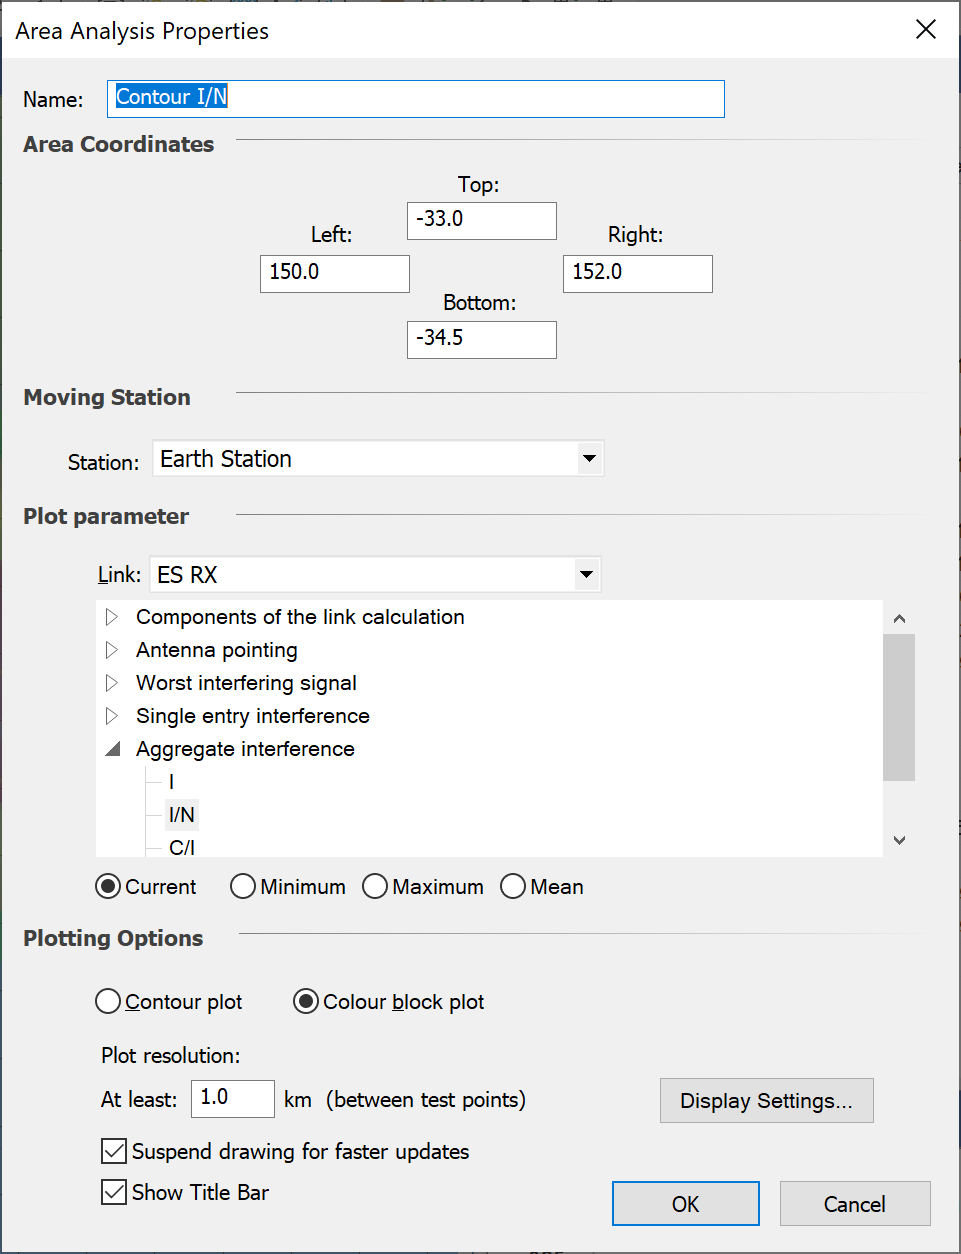
Within the properties select:
- Station to move = Earth Station
- Victim Link = ES Link
- Attribute to plot = the aggregate interference I/N
- Display type = colour block plots
- Plot resolution = 1 km
The completed dialog should look something like this:
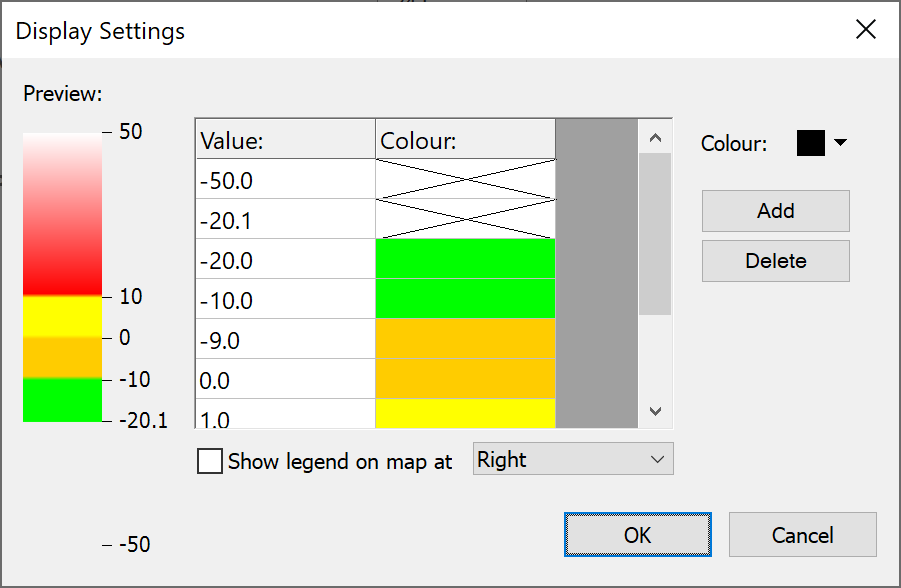
Then click on the display settings so that:
- I/N less than -20 show is not shown
- I/N between -20 and -10 is shown as green
- I/N between -10 and 0 show as orange
- I/N between 0 and 10 dB show as yellow
- I/N above 10 dB show as red
To do this, configure the control as follows:
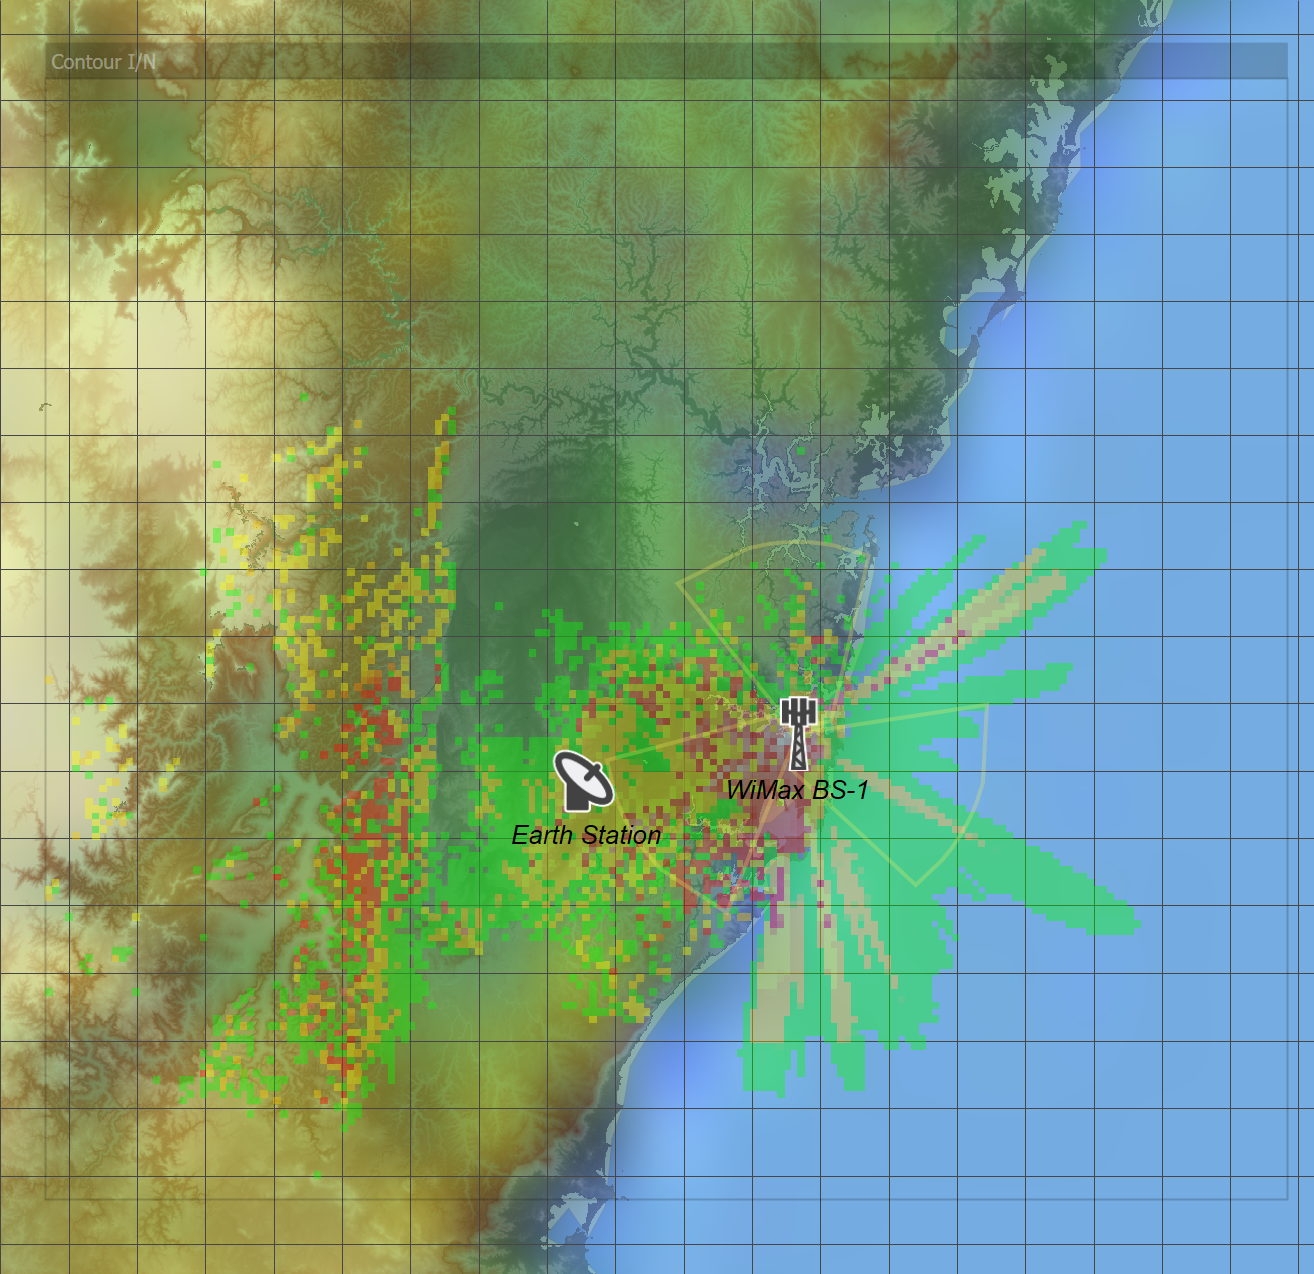
Having done this, you should see an area analysis that plots and colour codes the I/N from the WiMAX into the ES as in the figure below.
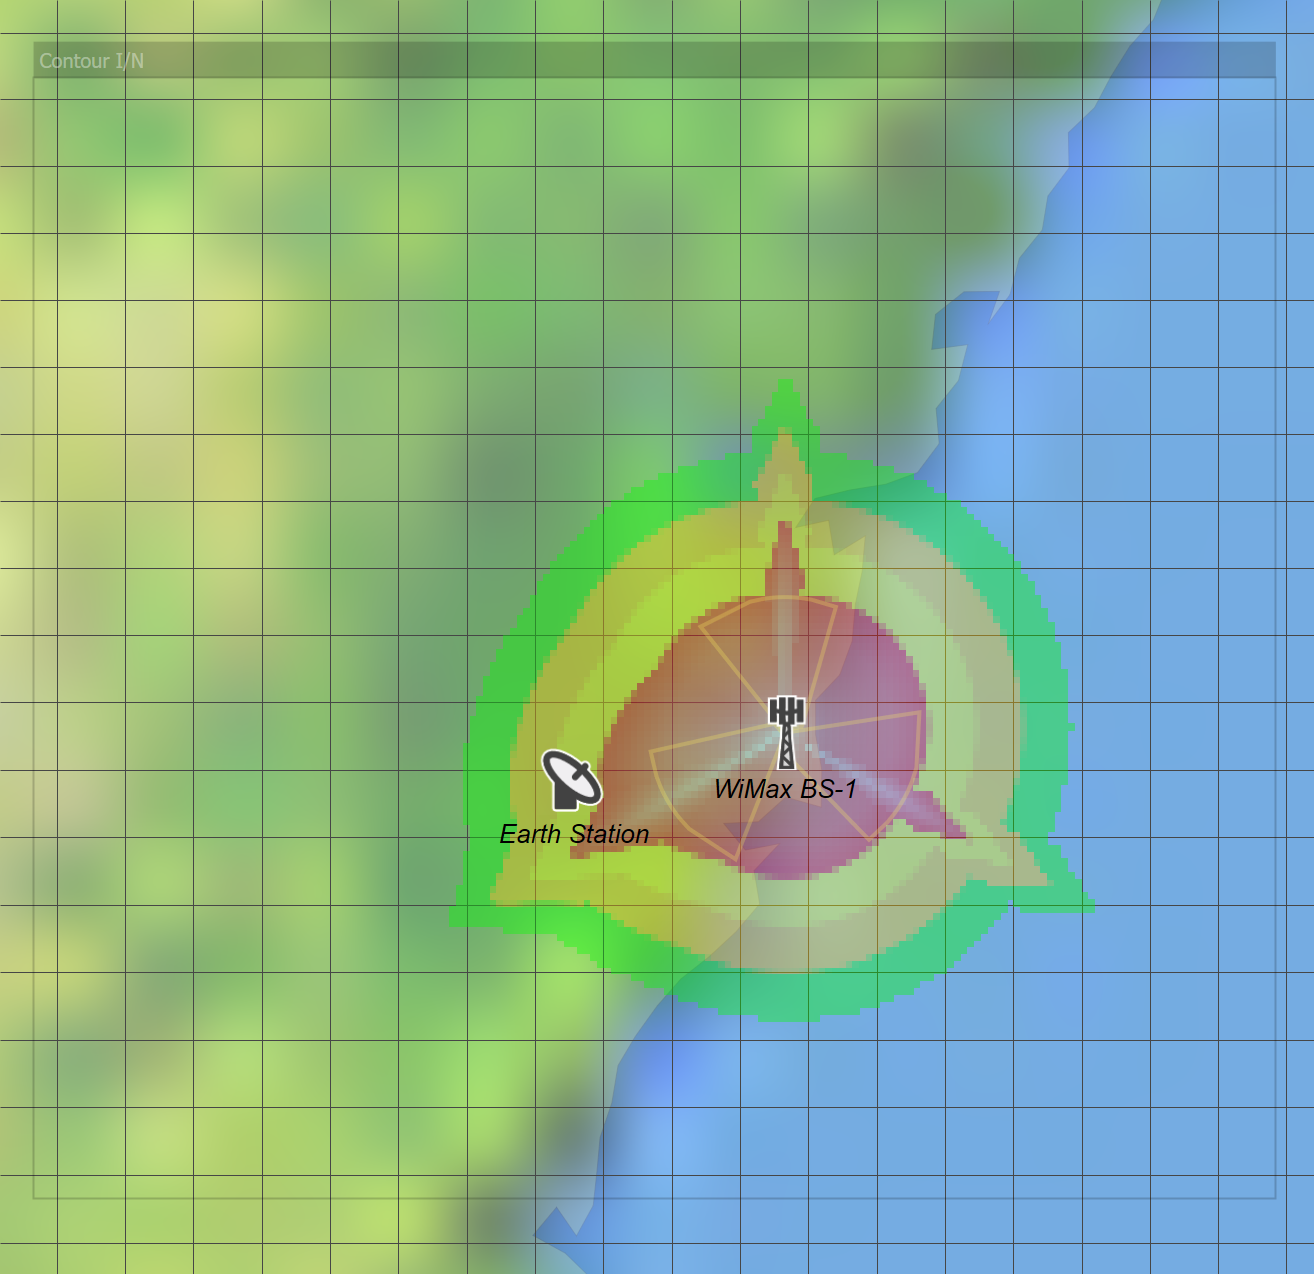
It can be seen that a large area is excluded.
A scale has been created via a grid about 10 km x 10 km by making the latitude/longitude resolution 0.09 degrees in latitude and 0.11 in longitude.
The Area Analysis has been moved to the top of the list of overlays and set semi-transparent so the underlying map can still be seen.
Note that the pattern is not symmetric! This is because the ES is pointing at the satellite at longitude 150 which is towards the North East: hence when it is to the South West it has slightly higher gain towards the WiMAX base station.
Save this simulation as Stage 4.
Consider making some, or all, of the variations on this simulation as in the table below:
| Parameter | Baseline | Variation |
|---|---|---|
| WiMAX antenna downtilt | -2.5 | 0 or 5 |
| WiMAX antenna azimuths | -120, 0, 120 | 60, 180, -60 |
| WiMAX antenna gain pattern | Rec.1245 | Table |
| WiMAX station height | 35m | 20m |
| Earth Station dish size | 3m | 1.5m or 4.5m |
| GSO satellite longitude | 94.2 | 149 |
| Rec.P.452 % time (1) | 50 % | 0.1 or 0.01% |
| Additional losses (clutter) | None | 20 dB |
| Terrain | Smooth Earth | Terrain |
| Polarisation advantage | None | Include |
Notes:
- When using other percentages of time remember that the I/N threshold will also change
Spot which increases or decreases the interfered area!
For comparison, the figure below shows a similar plot with terrain
It can be seen that interference in most directions has decreased though it has increased at a minority of points.
It is noticeable how the direction of increased interference is consistent with the azimuth of the GSO satellite as seen by earth station.
Note: This file is given in the example files together with test terrain data. So, if you do not have the Terrain Module you can still see the impact of terrain by removing your dongle and loading this file in demonstration mode.
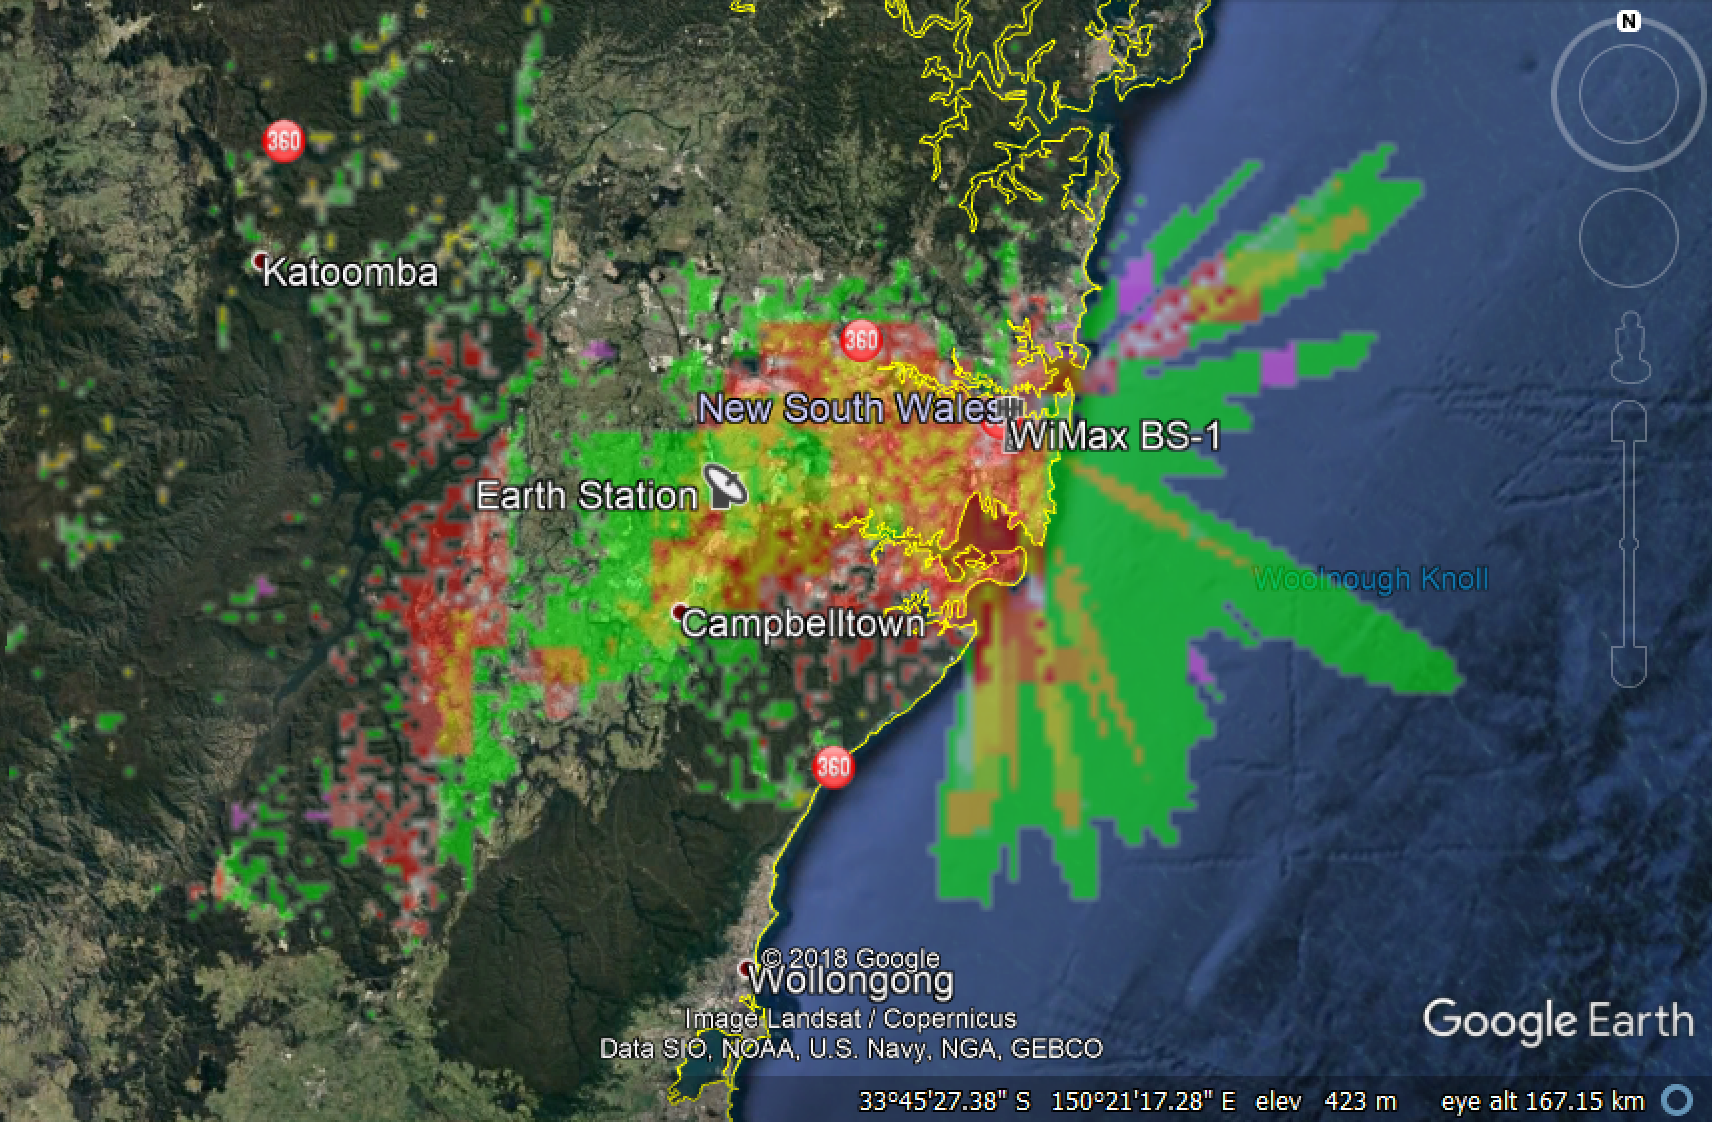
Other overlays can be displayed on the map view – such as any map data you have access to. If you have no map data, you can also export the Area Analysis into Google Earth as in the figure below.