Site Analysis Display Properties
Site analysis properties for display options can be set by pressing the  icon.
icon.
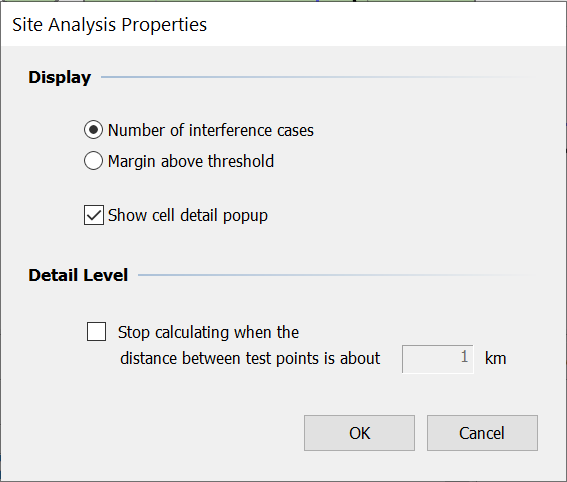
The properties dialog is shown below.

The pixelated map produced during site analysis can show either the number of coordination cases at each point or the worst margin at each point. To switch between the two, select the appropriate radio button.
You can also switch on and off the option to show a popup when the mouse pointer is passes over a site analysis pixel in the map view.