PCS/AWS
On the 18th September 2006, the FCC’s Auction 66 completed, releasing the 1710-1755 MHz and 2110-2155 MHz bands for Advanced Wireless Services (AWS). This opened up new swaths of spectrum for advanced PCS applications, ranging from web browsing to TV, direct to any suitable handset.
However, these bands have a significant number of incumbents, including government (typically military) and private wireless services – in particular fixed links. These existing services have rights that are protected under Title 47 Part 24 of the Code of Federal Regulations, in which the FCC requires that new entrants do not cause them harmful interference. Furthermore the new entrants must accept interference into their networks from existing licensed systems.
In order to be able to provide a widespread high quality network it is important to be able to analyse this sharing scenario accurately, in order to:
- Identify scenarios where interference between PCS and incumbents would be acceptable
- Identify scenarios where interference between PCS and incumbents would not be acceptable
- Identify strategies that could be used to facilitate sharing in problem cases
- Support the migration of existing services to other bands if necessary
- Potentially offer ability to automate technical coordination via on-line web service
This section describes how Visualyse Professional could be used to support such analysis and contains the following examples:
Note that this sort of analysis could be used in other bands and in other geographic regions.
Analysis of FS into mobile RX
| Action: | None |
| Modules used: | Terrain |
| Terrain regions: | Virginia terrain |
| Frequency band: | L / S |
| Station types: | Fixed, Mobile |
| Propagation models: | ITU-R Rec. P.452 |

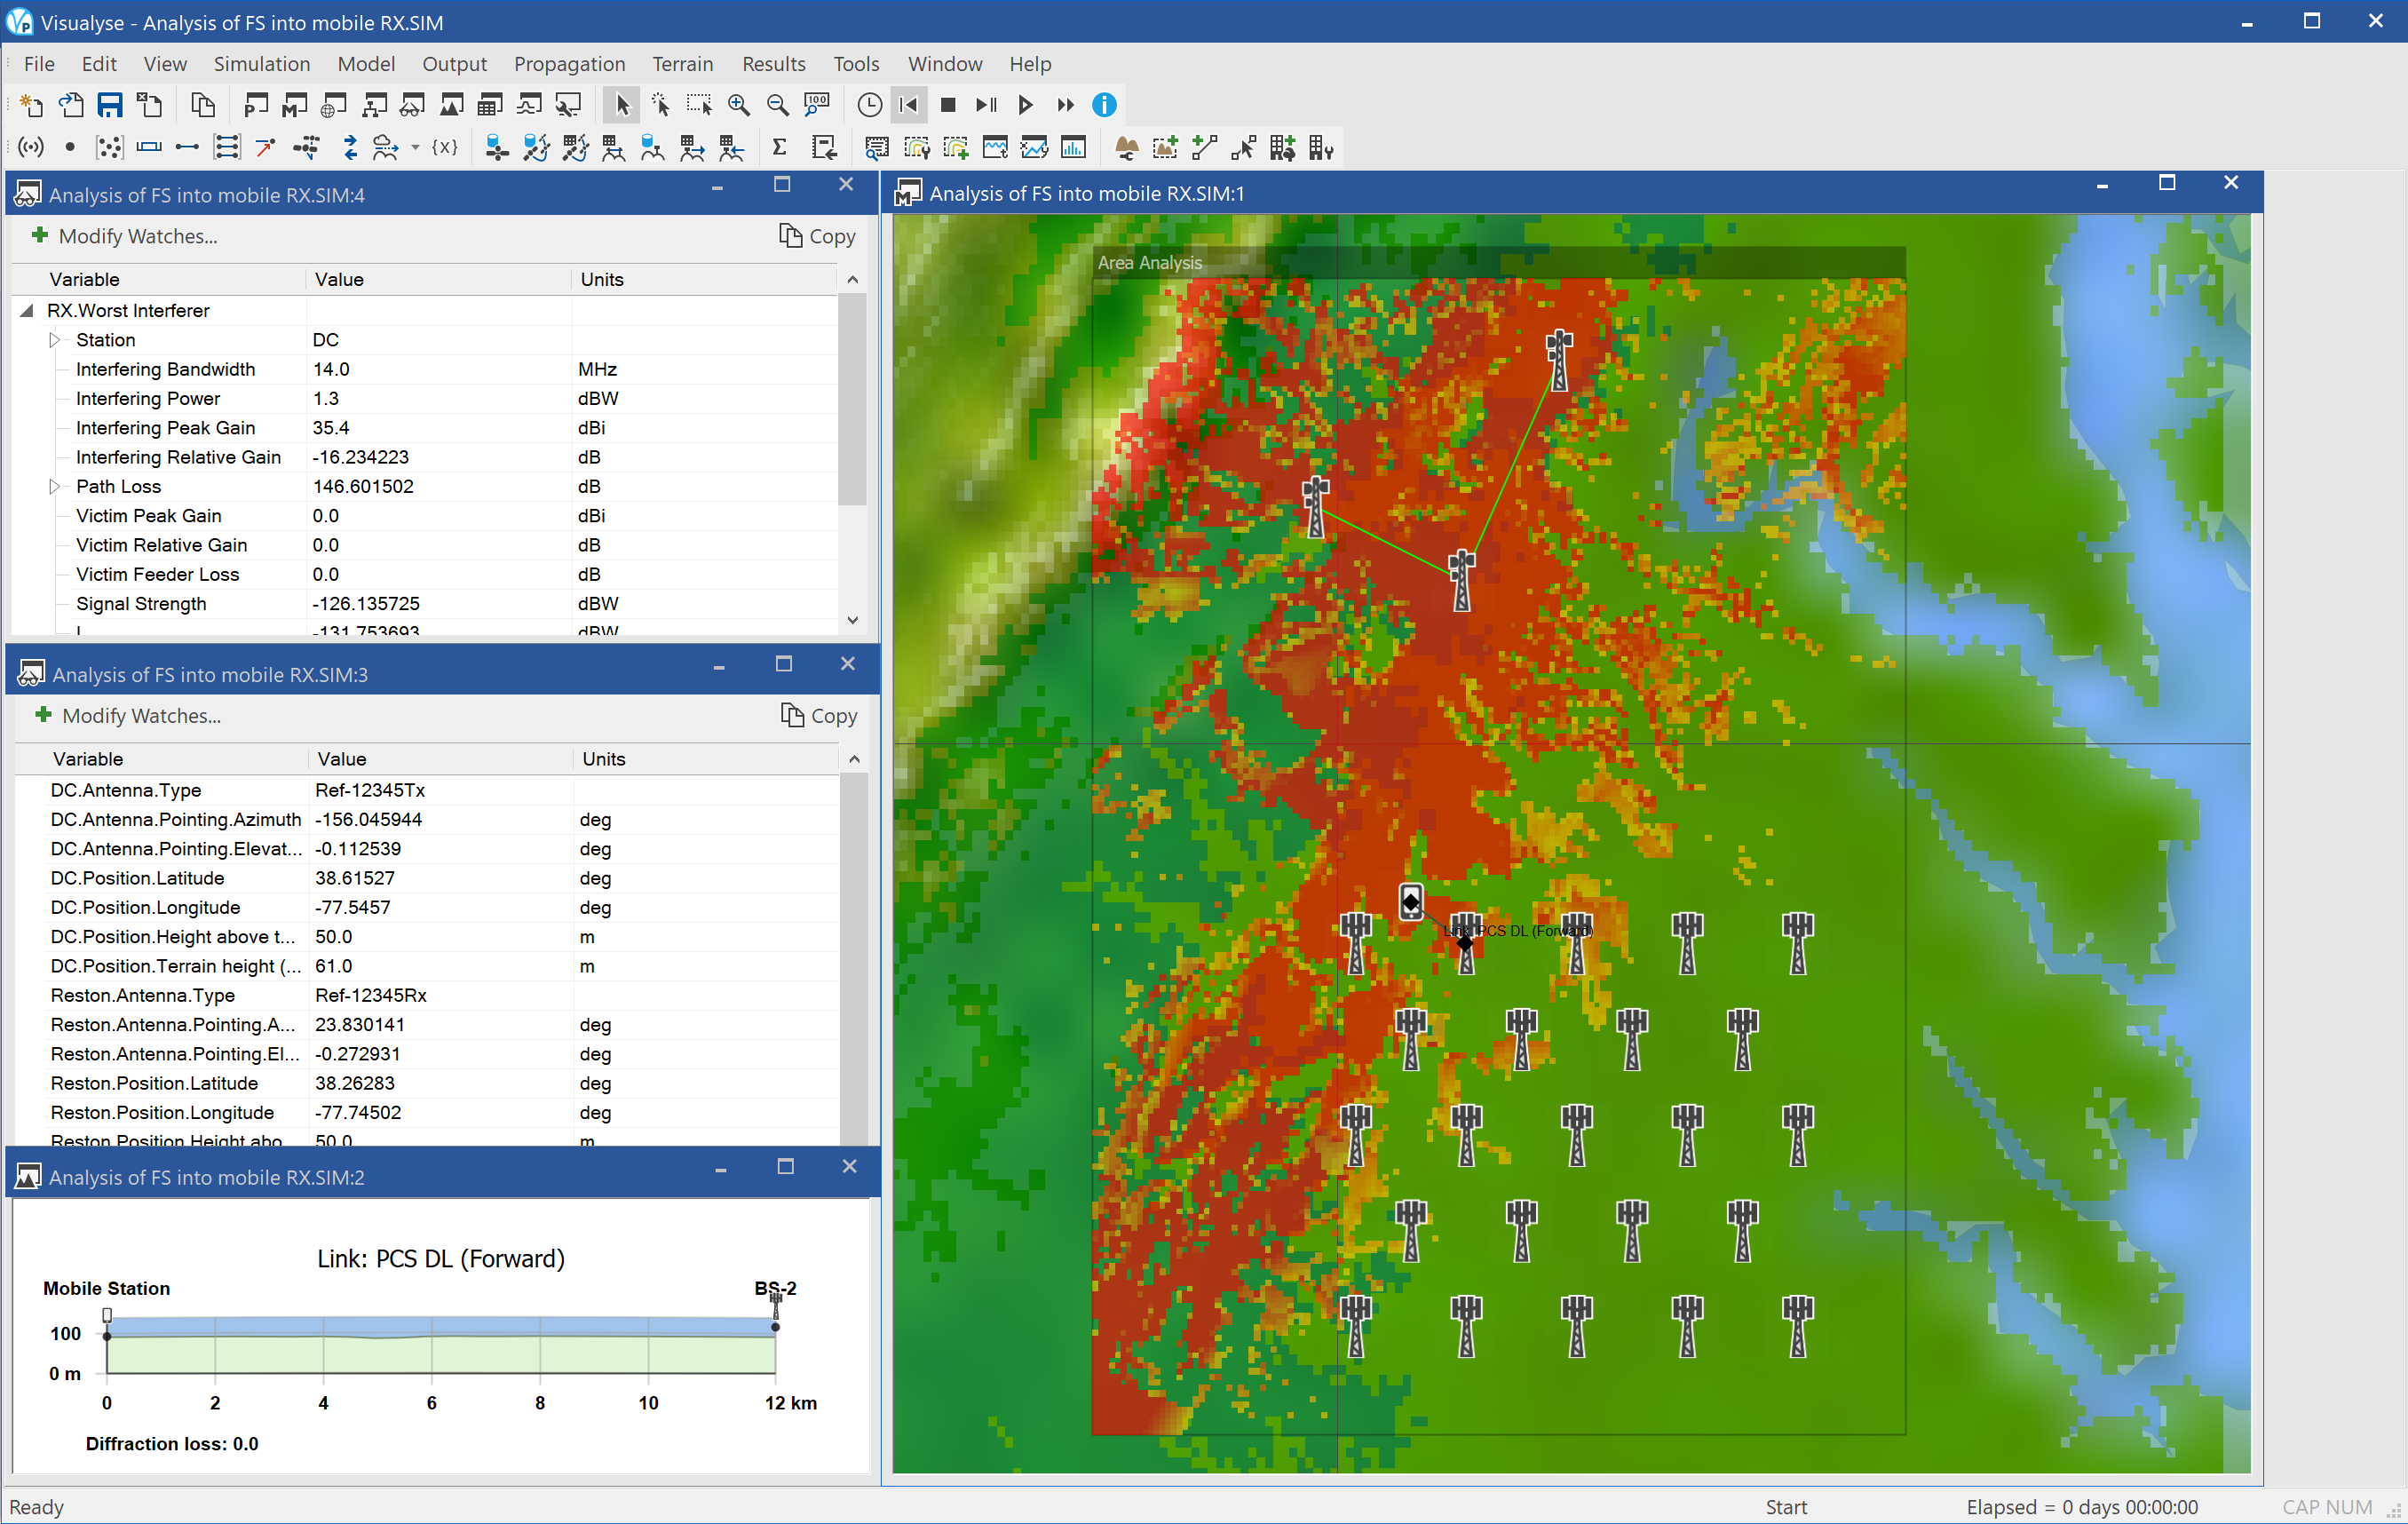
This example shows Visualyse Professional identifying the area where the downlink of a mobile network would suffer interference from a fixed service link.
The simulation contains two connected point to point fixed links in the area South-East of Washington DC. Around Richmond the PCS licence holder has deployed a grid of base stations and would like to identify those areas that could be affected by the fixed link.
The fixed link can be included in the simulation either by entering the parameters by hand, using the spreadsheet based FS import tool, or using the terrestrial IFIC interface (if the data is available).
An Area Analysis has been created that shows locations where the I/N would exceed -6 dB, i.e. increase the noise figure by 1 dB. At each pixel the interfering signal is calculated using the propagation model in ITU-R Rec.P.452 using a terrain database to derive path profiles.
The screen show above shows four windows open:
- Mercator view (right) showing a map1 of region South East of Washington, colour-tint of the terrain height, Area Analysis showing in red where I/N > - 6 dB, locations of stations
- Watch window (top left) showing some of the key simulation parameters
- Watch window (middle left) showing the link budget to a mobile located at the test point
- Path profile (bottom left) showing a slice through the terrain from one of the FS transmitters to the test point.
PCS-FS Demo - BS TX
| Action: | None |
| Modules used: | Terrain |
| Terrain regions: | Virginia terrain |
| Frequency band: | L / S |
| Station types: | Fixed, Mobile |
| Propagation models: | ITU-R Rec. P.452 |

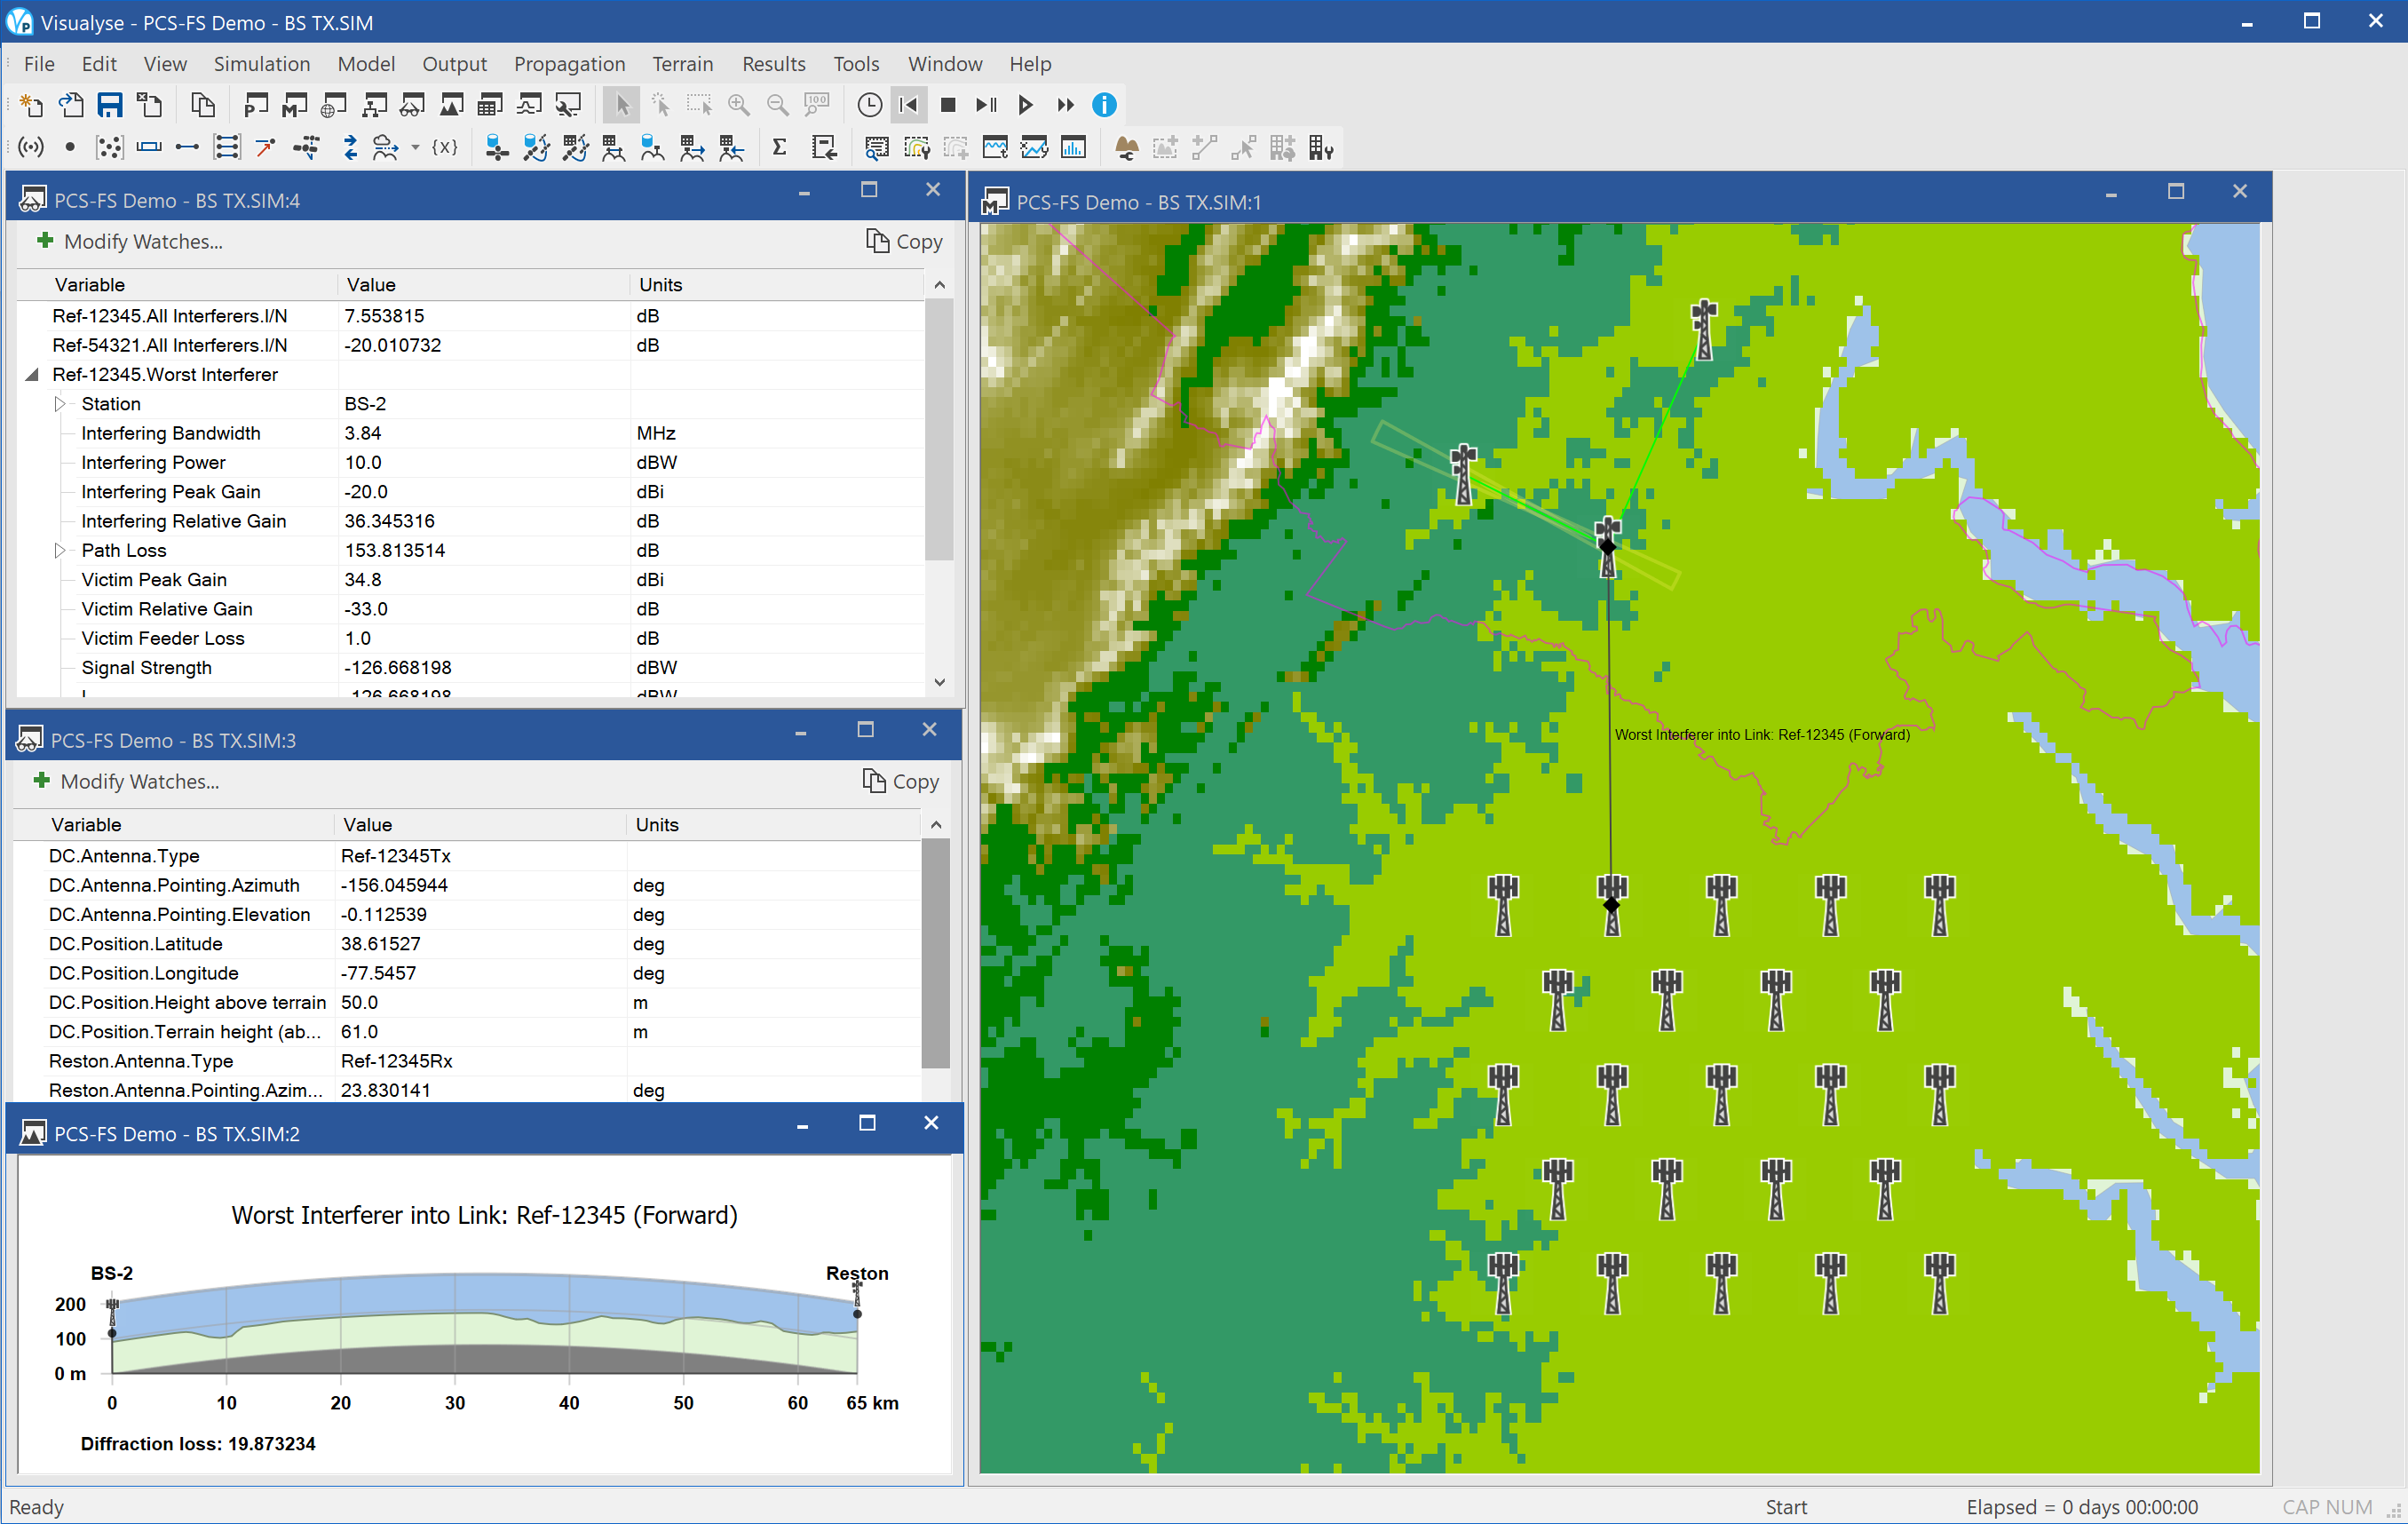
This example shows a scenario considering interference in the other direction – from the new entrant PCS/AWS network into an incumbent FS network, in particular from the downlink, Base Station (BS) transmit case.
The mobile operator has deployed a network of base stations in the area of Richmond South East of Washington DC and needs to identify the interference it would cause into the FS receivers.
There a number of ways in which the BS locations could be entered – either manually, using the hexagonal service area wizard, or if locations are known, using a CSV file containing (latitude, longitudes).
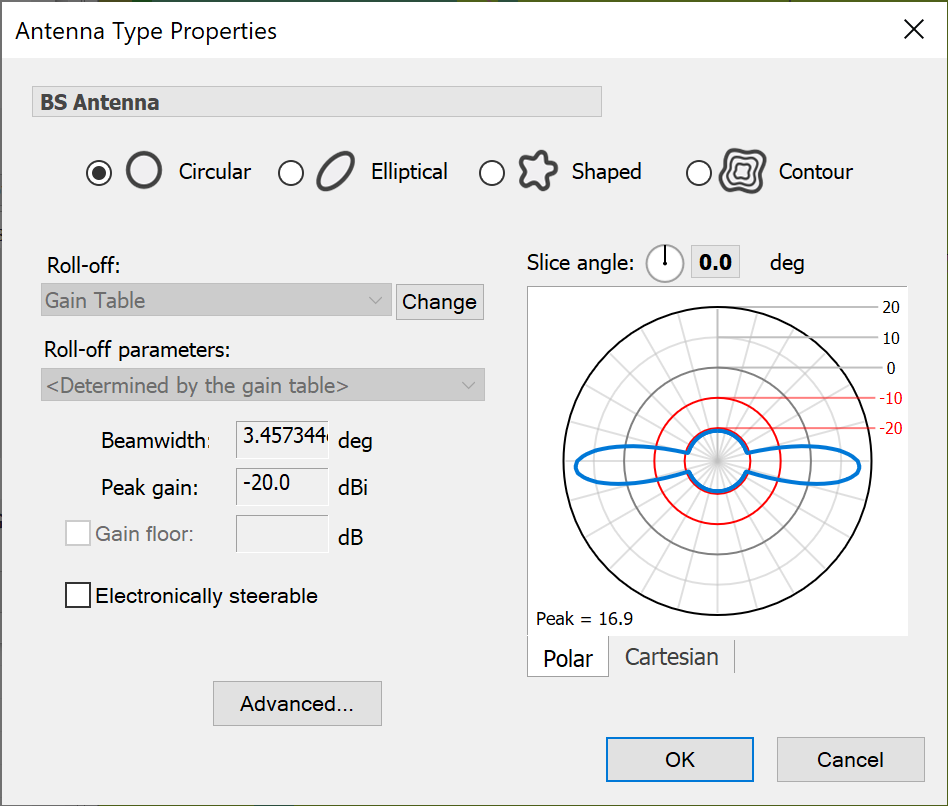
The base station antennas could be defined using standard patterns such as ITU-R Rec.F.1336 or in tables if available from the manufacturer such as in the figure below that shows the elevation slice of a pattern that uses downtilt.

The fixed links have been modelled using the fade model in ITU-R Rec.P.530, but Visualyse Professional also includes the TIA Bulletin 10F fade model.
The screen show above shows four windows open:
- Mercator view (right) showing a map of region South East of Washington, colour-tint of the terrain height, locations of stations.
- Watch window (top left) showing some of the key simulation parameters
- Watch window (middle left) showing the link budget to one of the fixed service receivers
- Path profile (bottom left) showing a slice through the terrain to one of the FS receivers
As the simulation is static there is no need to run the simulation – the results are given directly in the watch windows. The simulation could be extended to do C/I analysis using Monte Carlo methods to convolve fading on the fixed link with variations in interfering signal due to propagation and traffic variation.
PCS-FS Demo - MS TX
| Action: | Run simulation |
| Modules used: | Terrain, Define Variable |
| Terrain regions: | Virginia terrain |
| Frequency band: | L / S |
| Station types: | Fixed, Mobile |
| Propagation models: | ITU-R Rec. P.452 |

This example considers interference from the mobile uplink direction into a point to point fixed link. This requires Monte Carlo modelling methods, as there can be significant variation in interference due to variations in:
- Mobile traffic level
- Mobile location altering the gain at the FS receiver
- Mobile location varying the distance and path profile between mobile and FS receiver
- Mobile location impacting the EIRP when using power control
- Propagation conditions
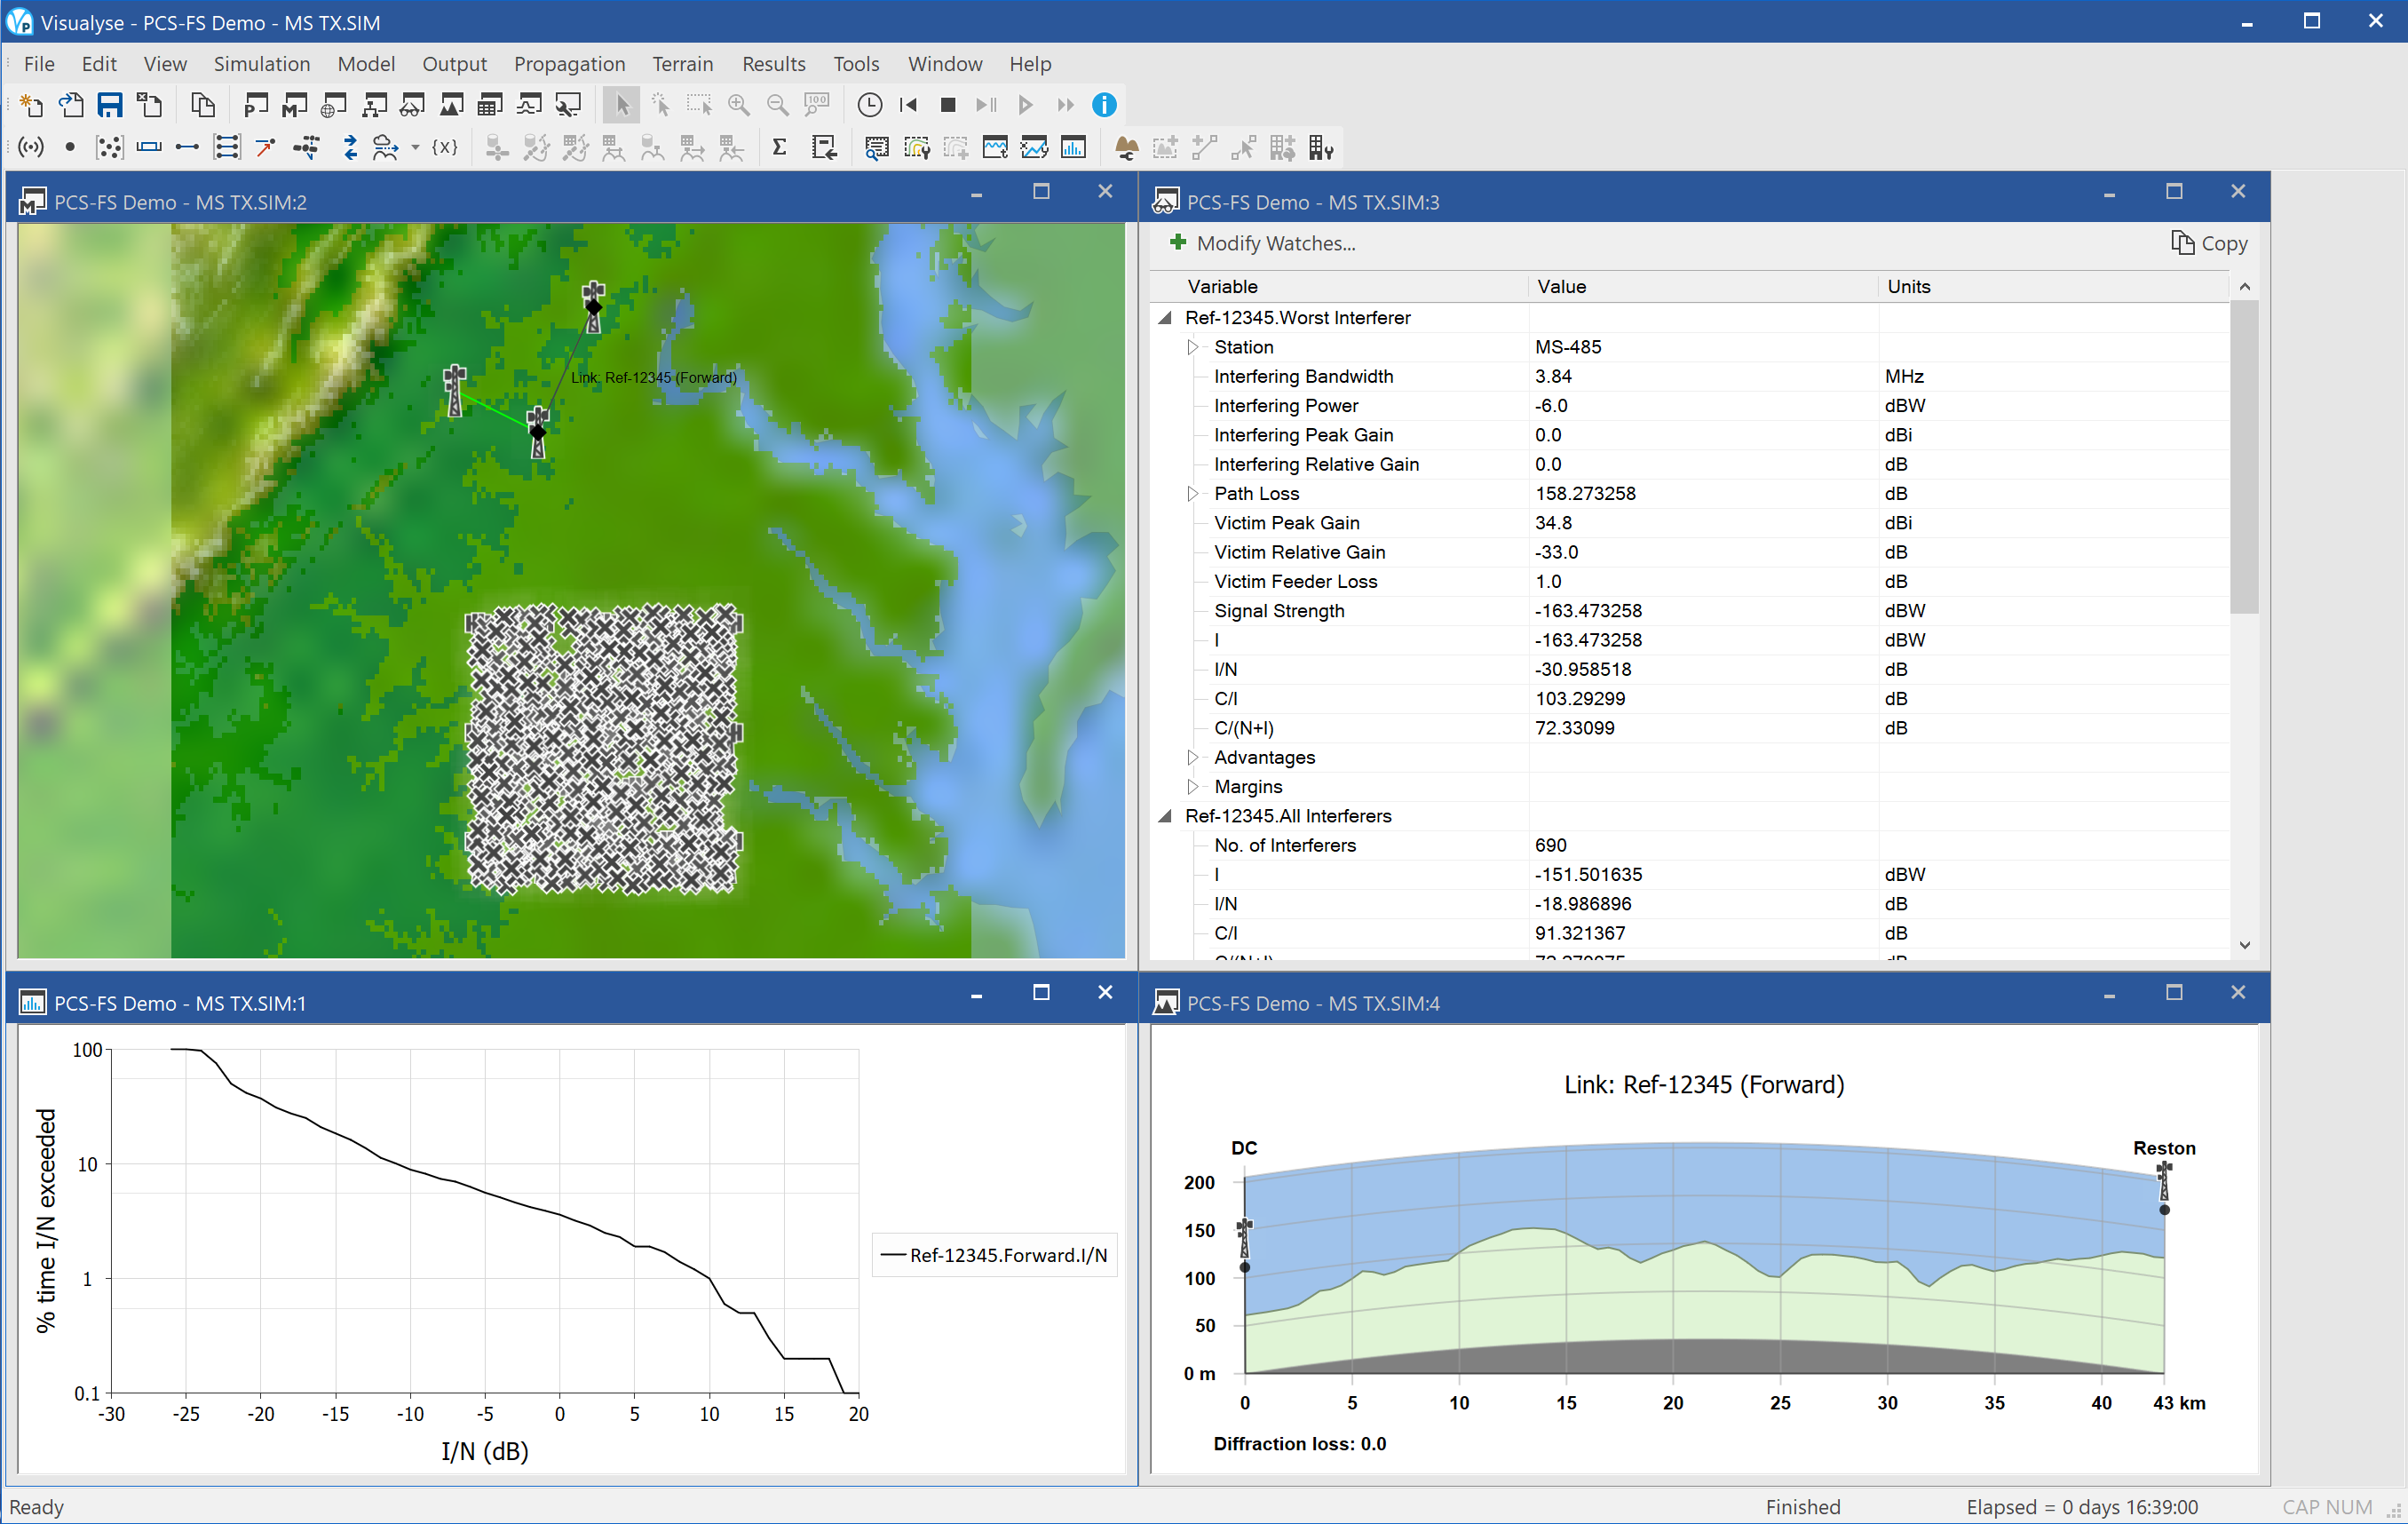
This type of modelling can be easily done in Visualyse Professional using the Define Variable module to randomise various input parameters. The simulation has been created with a hexagonal grid of 23 base stations. Each base station is assumed to support 30 mobiles, making a total of 690 across the service area.
The location of each mobile has been randomised as has the percentage of time used in the propagation model in ITU-R Rec.P.452, which takes account of the terrain database. In this case the EIRP has been fixed at -6 dBW, i.e. -24 dBm, but more advanced simulations could use power control to meet the required quality of service.
In Monte Carlo modelling the interfering level will vary from time step to time step – from sample to sample. Hence the simulation must be run for a number of samples and statistics generated. In this case the key output is the cumulative distribution function (CDF) of the I/N at the FS receiver.
The simulation has been configured to run for 999 time steps to generate 1,000 samples, but it can be run for longer to get statistics for the smaller percentages of time.
The resulting I/N statistics can be used to determine whether the probabilistic interference thresholds have been met. These are typically of the form:
- Long term: I/N > -20 dB for no more than 20% of the time
- Short time: I/N > 18 dB for no more than 0.01% of the time
The screen shot above shows the simulation with four windows open:
- Mercator view (top left), showing a map colour-tinted with terrain, the location of the FS stations, the base stations, and each of the 690 mobiles (as crosses). The map also shows the boundary of the Washington BEA licence.
- Statistics graph (bottom left), showing the cumulative distribution function of I/N at one of the FS receivers
- Watch window (top right), showing the link budget for this sample at one of the FS receivers
- Path profile (bottom right), showing the terrain along one of the FS links
-
Note this map might not be available due to copyright restrictions ↩