Visualyse EPFD User Guide

Documentation Control
| Date: | Software Version: |
|---|---|
| April 2024 | 3.9.0.0 |
Contact Information
You can contact us at:
Address Transfinite Systems Ltd, Suite 24 (5th Floor), AMP House, Dingwall Road, Croydon, CR0 2LX U.K
Phone +44 20 3904 3220
Fax +44 20 3904 3211
Email info@transfinite.com
Web www.transfinite.com
Transfinite Systems reserves the right to change features and screen layouts without notice.
©Transfinite Systems Ltd
Introduction
Article 22 of the Radio Regulations identifies Equivalent Power Flux Density (EPFD) levels to protect satellites in geostationary orbit (GSO) from unacceptable interference from non-GSO satellite systems.
EPFD is defined as follows:

Each of the terms is specified in 22.5C.1 of the Radio Regulations but essentially the equation specifies how to calculate a power flux density adjusted (hence the “equivalent”) to take into account the discrimination at the receiver antenna in the direction of the interferer.
As a non-GSO satellite moves in time the EPFD level calculated will vary and over time it will be possible to create a cumulative distribution function (CDF) of EPFD level against probability that the EPFD level is exceeded. These CDFs vary depending upon factors such as the gain pattern at the victim.
A non-GSO satellite system can cause interference into both a GSO satellite’s uplink and downlink, and there could be up to three directions to consider:
- EPFD (down): from the nonGSO satellites into a GSO Earth Station
- EPFD (up): from the nonGSO Earth stations into a GSO satellite
- EPFD (IS): inter-satellite (IS) path from the nonGSO satellites into a GSO satellite
The CDFs of EPFD for these three directions can then be compared against the limits in the tables referenced in 22.5C. These are generally described as hard limits in that if the non-GSO satellite system meets the values in these tables it is considered to have met its obligations under Article 22. The tables specify different thresholds depending upon whether the victim is operating under the fixed satellite service (FSS) or broadcasting satellite service (BSS)
The limits in Article 22 may be exceeded in any country whose administration has so agreed: however this is outside the scope of Visualyse EPFD.
Note that in some bands where there could be both GSO and non-GSO networks operating there are no EPFD limits specified in Article 22 and instead coordination is undertaken as described in Article 9.
In addition, Appendix 5 of the Radio Regulations (RR) identifies the triggers for coordination for the case of large earth stations (LES) for which:
- The earth station antenna gain is above 64 dBi for Ku band and 68 dBi for Ka band
- The earth station’s G/T is 44 dB/K or greater
- The emission bandwidth is 250 MHz or greater for Ku band or 800 MHz or greater in Ka band
If these criteria are met then there is a need for coordination under articles 9.7A and 9.7B of the RR with those non-GSO networks that are co-frequency.
The methodology to determine the EPFD levels generated by a non-GSO satellite system is documented in Recommendation ITU-R S.1503-2:
“Functional description to be used in developing software tools for determining conformity of non-geostationary-satellite orbit fixed-satellite system networks with limits contained in Article 22 of the Radio Regulations”
This methodology has been implemented in Visualyse EPFD. As the algorithm, and hence implementation, is complex, another version of the software was developed independently by Agenium and then compared under the aegis of the ITU. The differences between the results from each tool were below 0.1 dB in most cases.
Each tool interfaces to a range of ITU supplied databases, DLLs and data files as shown in the figure below.
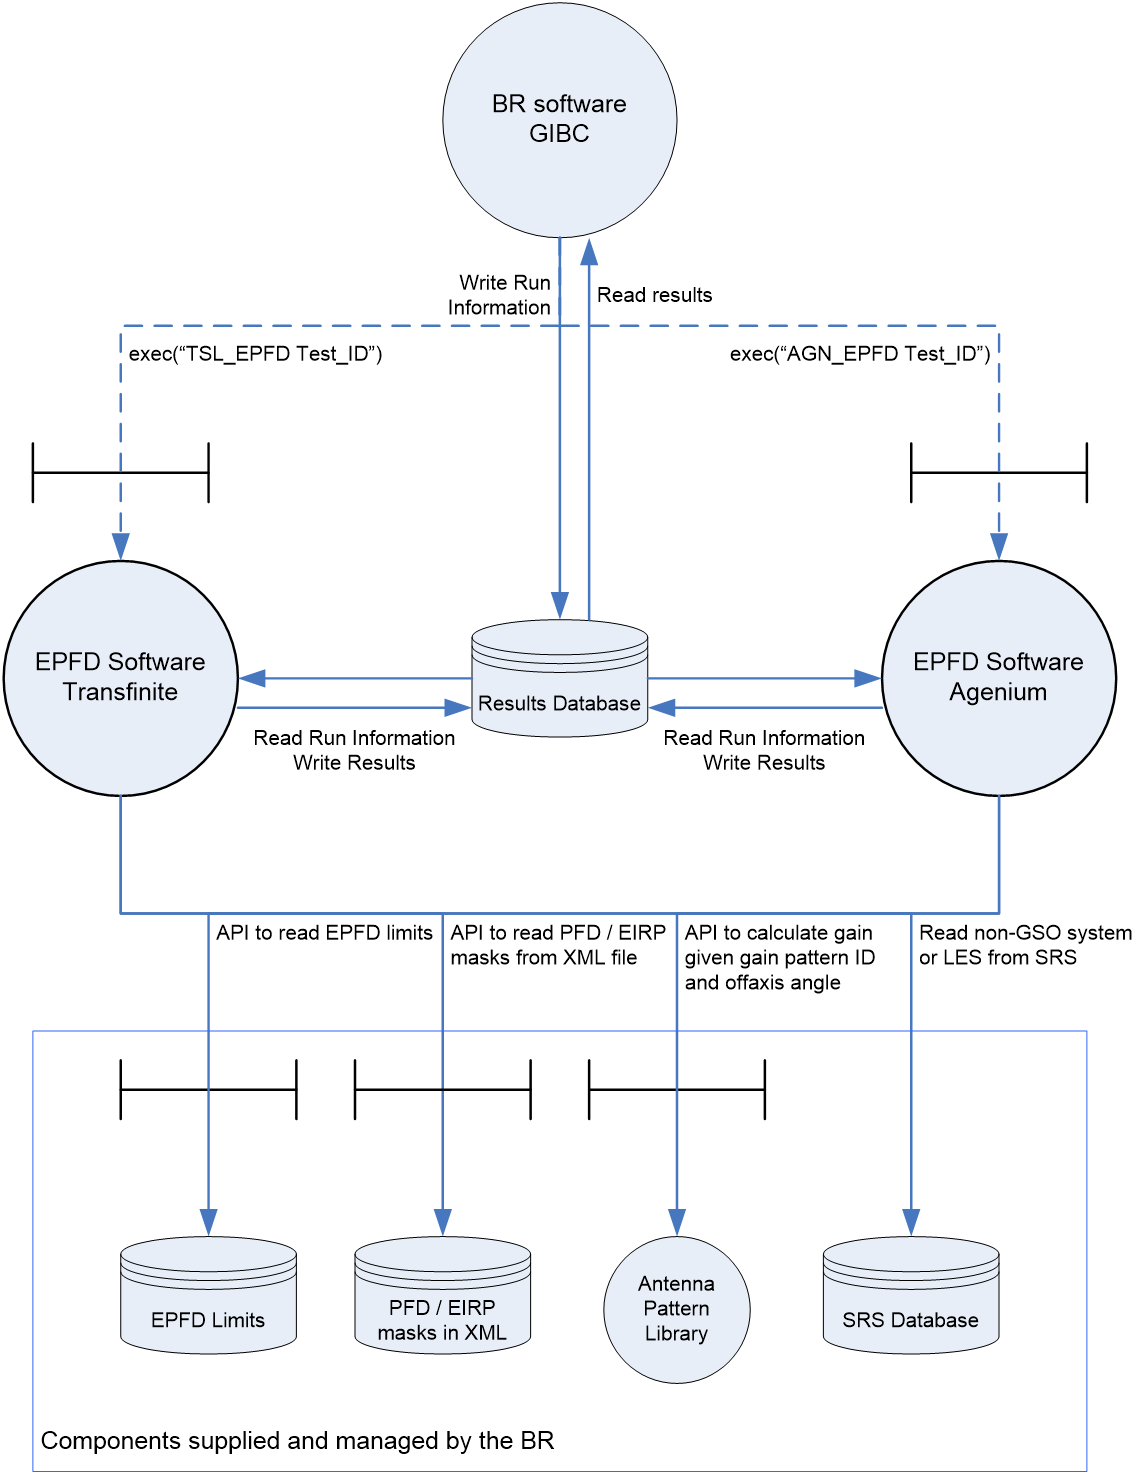
In each case the output from the software is either a “pass” or “fail” depending upon whether the EPFD CDF calculated was below or above the threshold values given in the RR.
There are two versions of Visualyse EPFD:
- GIBC driven black box that provides a simple dialog to select the case to analyse and reports progress
- Graphical User Interface (GUI) version that provides feedback as to the run status and checks on intermediate values in the calculation
This User Guide covers the GUI version of Visualyse EPFD.
There are three types of analysis:
- Article 22 check: a non-GSO FSS network is selected from the SRS and checked against the hard limits in Article 22
- Article 9.7A check: a LES is selected from the SRS and run against those non-GSO FSS networks in the database that have bandwidth overlap in the relevant frequency bands
- Article 9.7B check: a non-GSO FSS network is selected from the SRS and run against those LES networks in the database that have bandwidth overlap in the relevant frequency bands
Note that a “fail” against the limits in Article 22 is sufficient for a non-favourable finding by the BR. On the other hand a “fail” in the case of a 9.7A or 9.7B check is the trigger for coordination between the operators involved and does not necessarily mean a non-favourable finding.
In each case the first step is to identify how many cases or “runs” must be analysed where a runs involves:
- One non-GSO network
- One victim (either GSO Earth Station or GSO satellite)
- One set of EPFD limits (e.g. for FSS service in 19.7 – 20.2 GHz with ES 2.5m)
For Article 9.7A and 9.7B the runs are always EPFD(down) cases and the locations of the ES are explicitly given in the SRS. For Article 22 runs the location of the victim ES or satellite are calculated using the “worst case geometry” (WCG) algorithm part of Rec. ITU-R S.1503-2.
Note that Article 22 also includes other types of EPFD, in particular “operational EPFD limits” and “additional operational EPFD limits”: these relate to measurement and are outside the scope of Visualyse EPFD.
Basic Operation
The top-level operation of the software involves just three steps:
1. Select the Scenario to be Analysed
Within the three steps above there are a limited number of user options and these are described below.
Select the Scenario to Analyse
The software is provided with a test database containing two hypothetical systems. This test data is sufficient to assess the functionality of Visualyse EPFD. Additional data can be added to the SRS using the data format in section 6.
When you run the software for the first time, the New Run Definition dialog will appear as shown below.
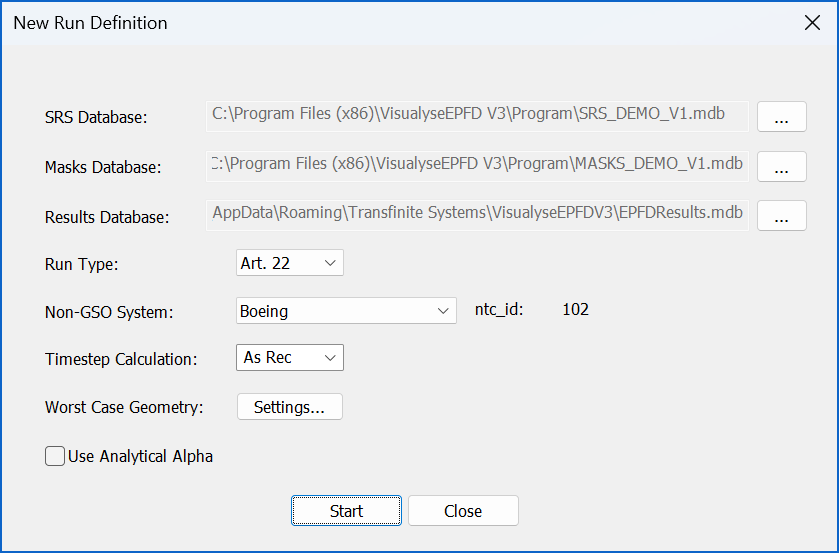
The first step is to select the database to use that contains the non-GSO FSS systems and/or the LES. By default, this is set to be the one that contains the test systems such as Boeing but other databases including the full SRS could be selected by clicking on the “…” button.
The next step is to select the database that contains the mask information. By default, this initially is the one that contains the test system such as Boeing but other databases can be selected by clicking on the “…” button.
Having selected the right input databases, the next stage is to select location for the Results Database. By default the results are stored in a pre-defined location but the user can select a new database by clicking the … button and selecting a directory and filename.
Having selected the Results Database, the next stage is to select the run type required, i.e. one of Article 22, 9.7A or 9.7B:
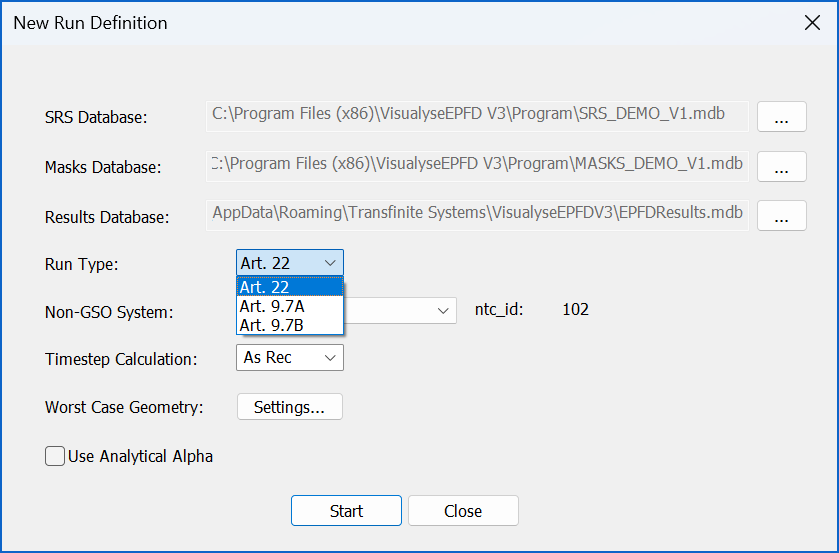
Having done that you can then select which system to consider which will be:
| Run type | System type |
|---|---|
| Article 22 | Non-GSO |
| Article 9.7A | Large Earth Station |
| Article 9.7B | Non-GSO |
Next step is to select a system from the SRS Database:
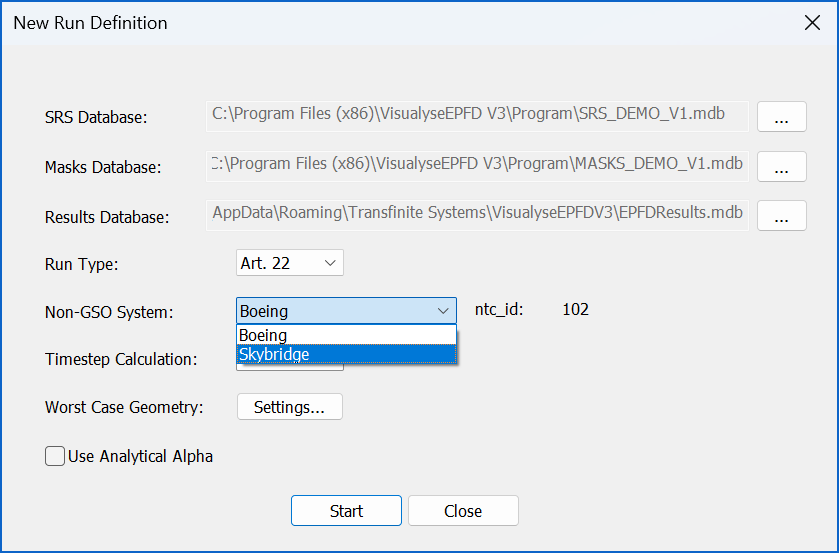
When the system have been selected the ntc_id field is updated accordingly as in the figure below:
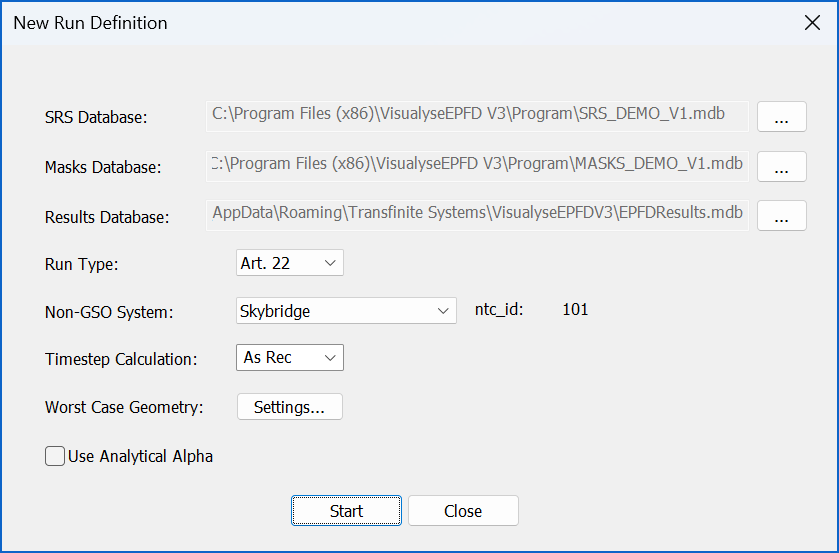
The next step is to select how the timestep is calculated:
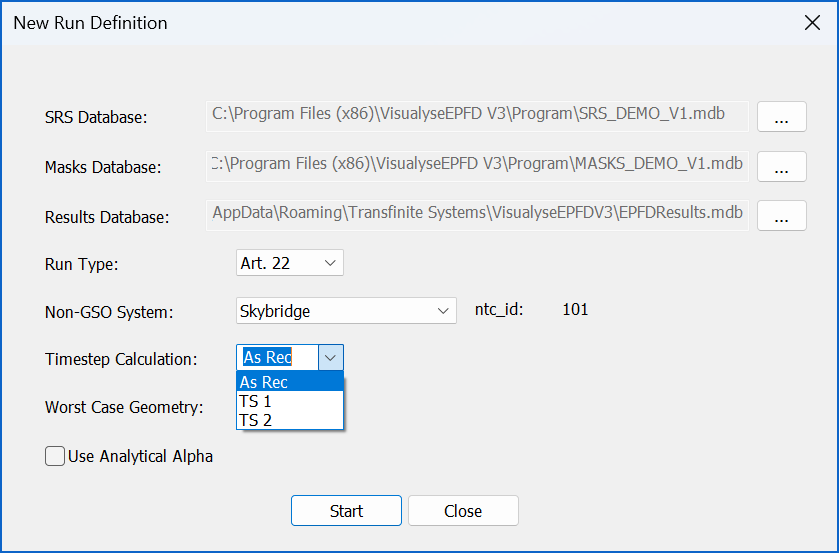
The options to select from are:
As Rec.: run with the full time step calculation as per the Recommendation
TS 1: adjust the Nhit term to take account of the number of satellites
TS 2: adjust both the Nhit and Ntrack terms to take account of the number of satellites
TS 2 will result if quicker runs than TS 1 but with potentially increased deltas from a run executed as per the Recommendation.
Note: further information on Timestep calculation is in section 6.4.3.
It is possible to fix the Worst Case Geometry parameters used in a simulation by clicking the “Settings…” button. This will display the Worst Case Settings dialog. Where the user can input fixed locations per Run Type as desired. Further information is in section 6.4.1 and 6.4.2.
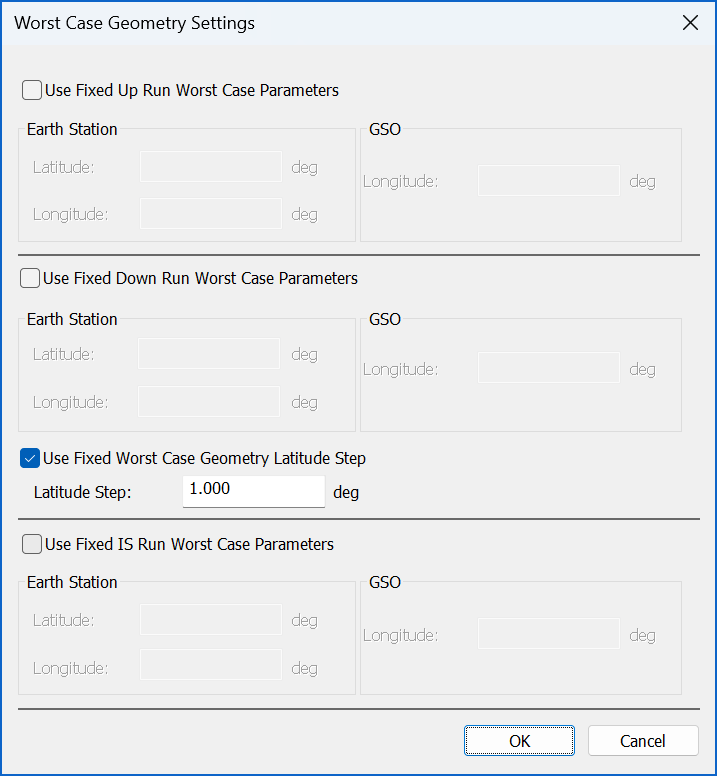
The final option is to select whether to use Analytical Alpha calculation (as opposed to Iterative Alpha).
At this point a run can be started.
Note that:
- No part of the nonGSO system configuration can be edited in Visualyse EPFD
- The run definition is similar to the non-interactive “black box” approach used with the ITU version selected via GIBC.
Running the Simulation
For each nonGSO system there will be a number of possible runs, depending on:
- Type of simulation
- The operating frequencies of the nonGSO system
- For Article 9.7A and 9.7B runs, other systems in the SRS database.
The resulting set of runs is called the run schedule.
It can take some time to derive the run schedule for Article 22 cases as it involves derivation of the WCG. This algorithm is in some ways the most complex part of Rec. ITU-R S.1503-2. While the runs are being generated a status message will be displayed as in the figure below:
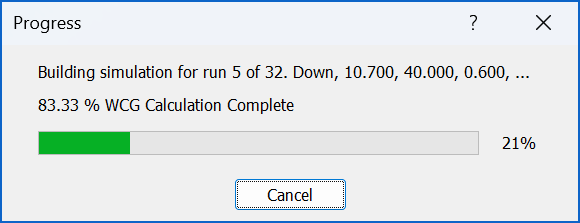
Note that one of the application settings, the WCG latitude step size, can improve performance, though this can result in analysis that is not fully compliant with > the algorithm in S.1503-2. This is discussed further in Section 6.3.
In addition to calculating the WCG, the run creation stage also determines the time step size and number of time steps required using the algorithm in S.1503-2. This ensures that:
-
The time step is sufficiently small that there will be a statistically significant number of samples of the in-line geometry case. In particular:
- For EPFD (down), when the non-GSO satellite is in the main beam of the GSO ES
- For EPFD (up), when the non-GSO ES is pointing towards the GSO satellite
-
The run duration covers the complete repeat cycle of the constellation, ensuring the results are statistically consistent.
The Run Schedule is shown in the window on the left hand side of the application window. It is a list of all the runs that need to be completed for the EPFD assessment.
Each run is uniquely identified by the following parameters:
-
Calculation type (up, down, IS)
-
Frequency
-
Reference bandwidth
-
Antenna (ES dish size for EPFD(down) or satellite beam width for EPFD(up) and EPFD(IS))
These parameters are displayed in the Run Schedule window for each run (as shown below).
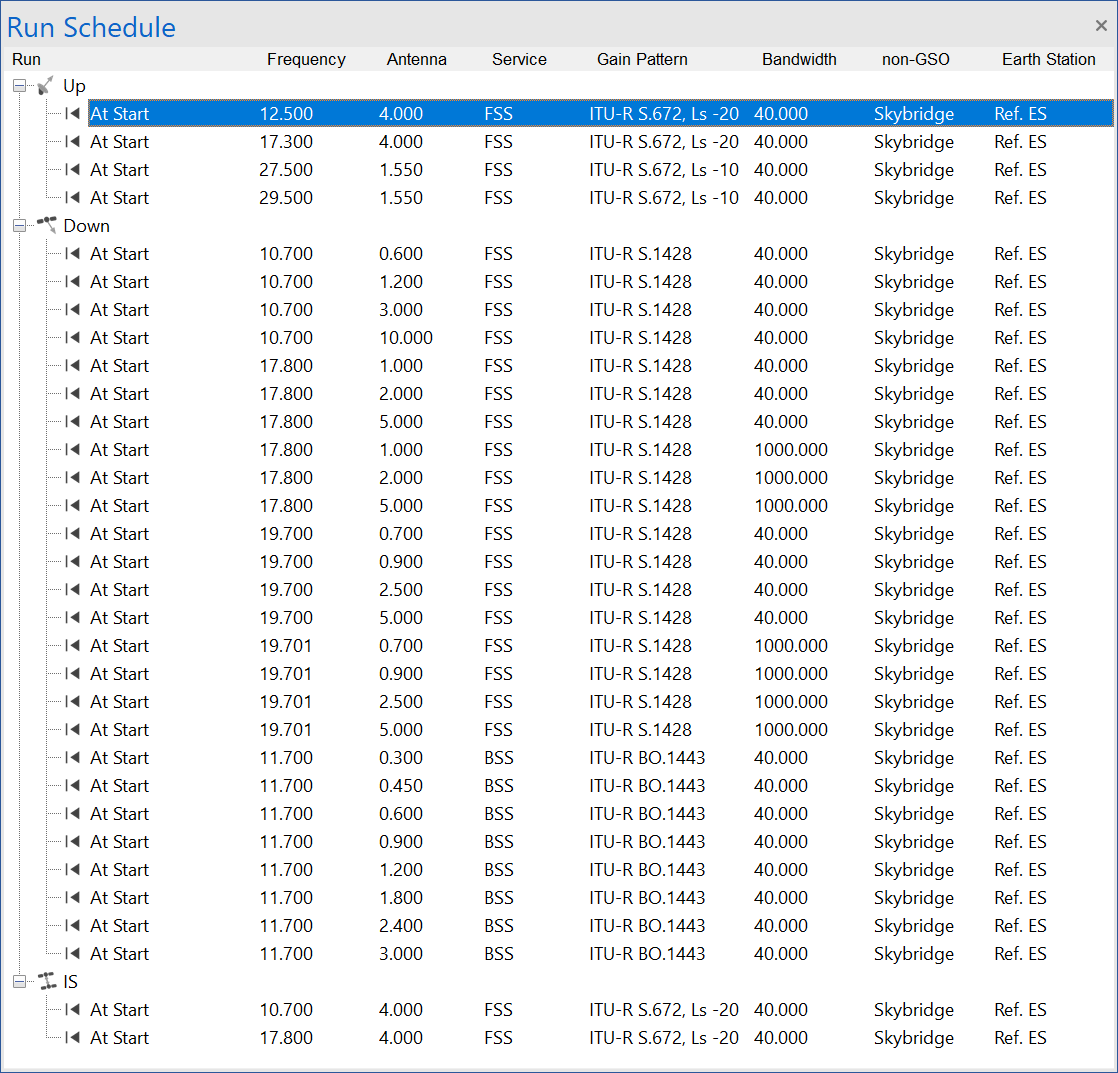
The GSO service type is also displayed for each run. The GSO service type determines the antenna pattern that will be used for the run. This pattern is displayed as well.
To begin working with one of the runs, select it by clicking on it. When selected, the run becomes highlighted.
All the windows and user definable options available apply to the selected run.
Changing the state of a run
Runs are controlled using the Run toolbar. With the exception of the Start All Runs and Stop All Runs buttons (see below), the tools on this tool bar apply to the selected run in the run schedule.

Start the Selected Run
There are two running modes in Visualyse EPFD: Play and Fast Forward.


In Play mode, simulation views are updated after each time step. This allows you to look at the scenario and the CDF graph as they change over time. You can clearly see the dual timestep operation and watch a number of parameters as they evolve (see next sections on the Scenario Window and the CDF Graph Window).
Fast Forward does not update any of the views until the run ends. Fast Forward is much quicker than Play mode and should be used when monitoring of run parameters is not needed.
Single Step Advance
You can advance the selected run by a single time step by clicking the Single Step Advance button on the run toolbar or by pressing the Space Bar.

Start all Runs
All the runs can be started at once and run in parallel by pressing the green start button on the toolbar. This will start all the runs in Fast Forward mode.

Note that running in parallel will result in very long run times for some systems. It is expected that future versions of Visualyse EPFD will include more sophisticated run management, allowing runs to be co-ordinated between different processors.
Stop all Runs
To complement the Start All Runs button, a Stop All Runs button is provided.

Clicking this button will stop each run at its current timestep.
Stopping a Run
To stop the selected run at its current time step, click the stop button on the Run toolbar.

Resetting a Run
A run can be reset to its start position by clicking the Reset button on the Run toolbar. Resetting a run will delete all the statistics collected so far. You should therefore be careful when using this option.

Status Information
The first column on the left of the Run Schedule Window indicates the Run Status.
Possible run states and the icons that are displayed are described in the following table.
| State | Icon | Description |
|---|---|---|
| At Start |  | A run in this state has not been started. There will be no results data and no indication of progress. |
| In Progress |   | This state indicates that the run is currently progressing. The icon will be accompanied by text of the form X% Complete. More than one run can be In Progress at a time. There are two In Progress states. These reflect the two run modes. The single triangle indicates Play mode. In this mode you will see the satellites moving in the Scenario window and the CDF graph will be updated. The double triangle indicates Fast Forward mode where view updates are switched off to increase performance. |
| Halted |  | Any run can be halted part way through. A run in this state is partially complete. The user can re-start a halted run from the point where it last left off. |
| Complete |   | There are two possible outcomes for a run that is complete. Either the EPFD limits were met, or they were not. The icon for each of these two outcomes is obvious. The text accompanying them reads either Pass or Fail. |
When all runs have been completed, the calculation is complete. If all the runs have passed, the overall result is a pass. If even just one run fails, the nonGSO system fails the test.
At the end each run will be given a Pass or Fail status, leaving the run schedule looking like the picture below.
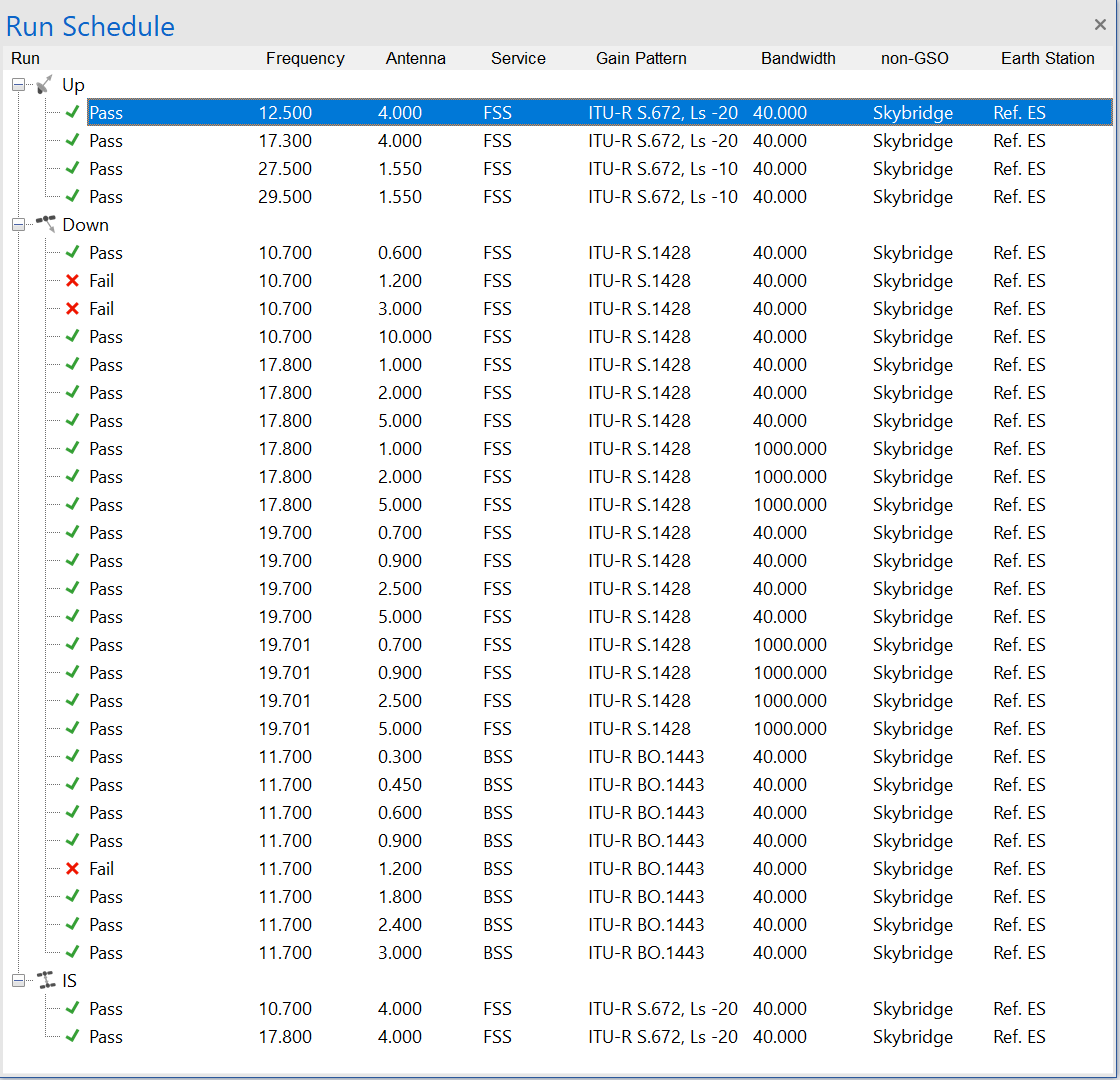
In this case three runs failed, but that was enough to fail the overall assessment.
Run Duration
An indication of the time required to complete all the runs which are in progress is given on the status bar. This is only an estimate, but the estimate will increase in accuracy as the runs progress.
Run Time
The current time for the selected run is also displayed on the status bar. This is not displayed when the run is in fast forward mode so that performance is maximised.

Reporting Results
At any time you can obtain a textual report of the status of all the runs. To do this, click the report button on the toolbar.

The report window will appear.
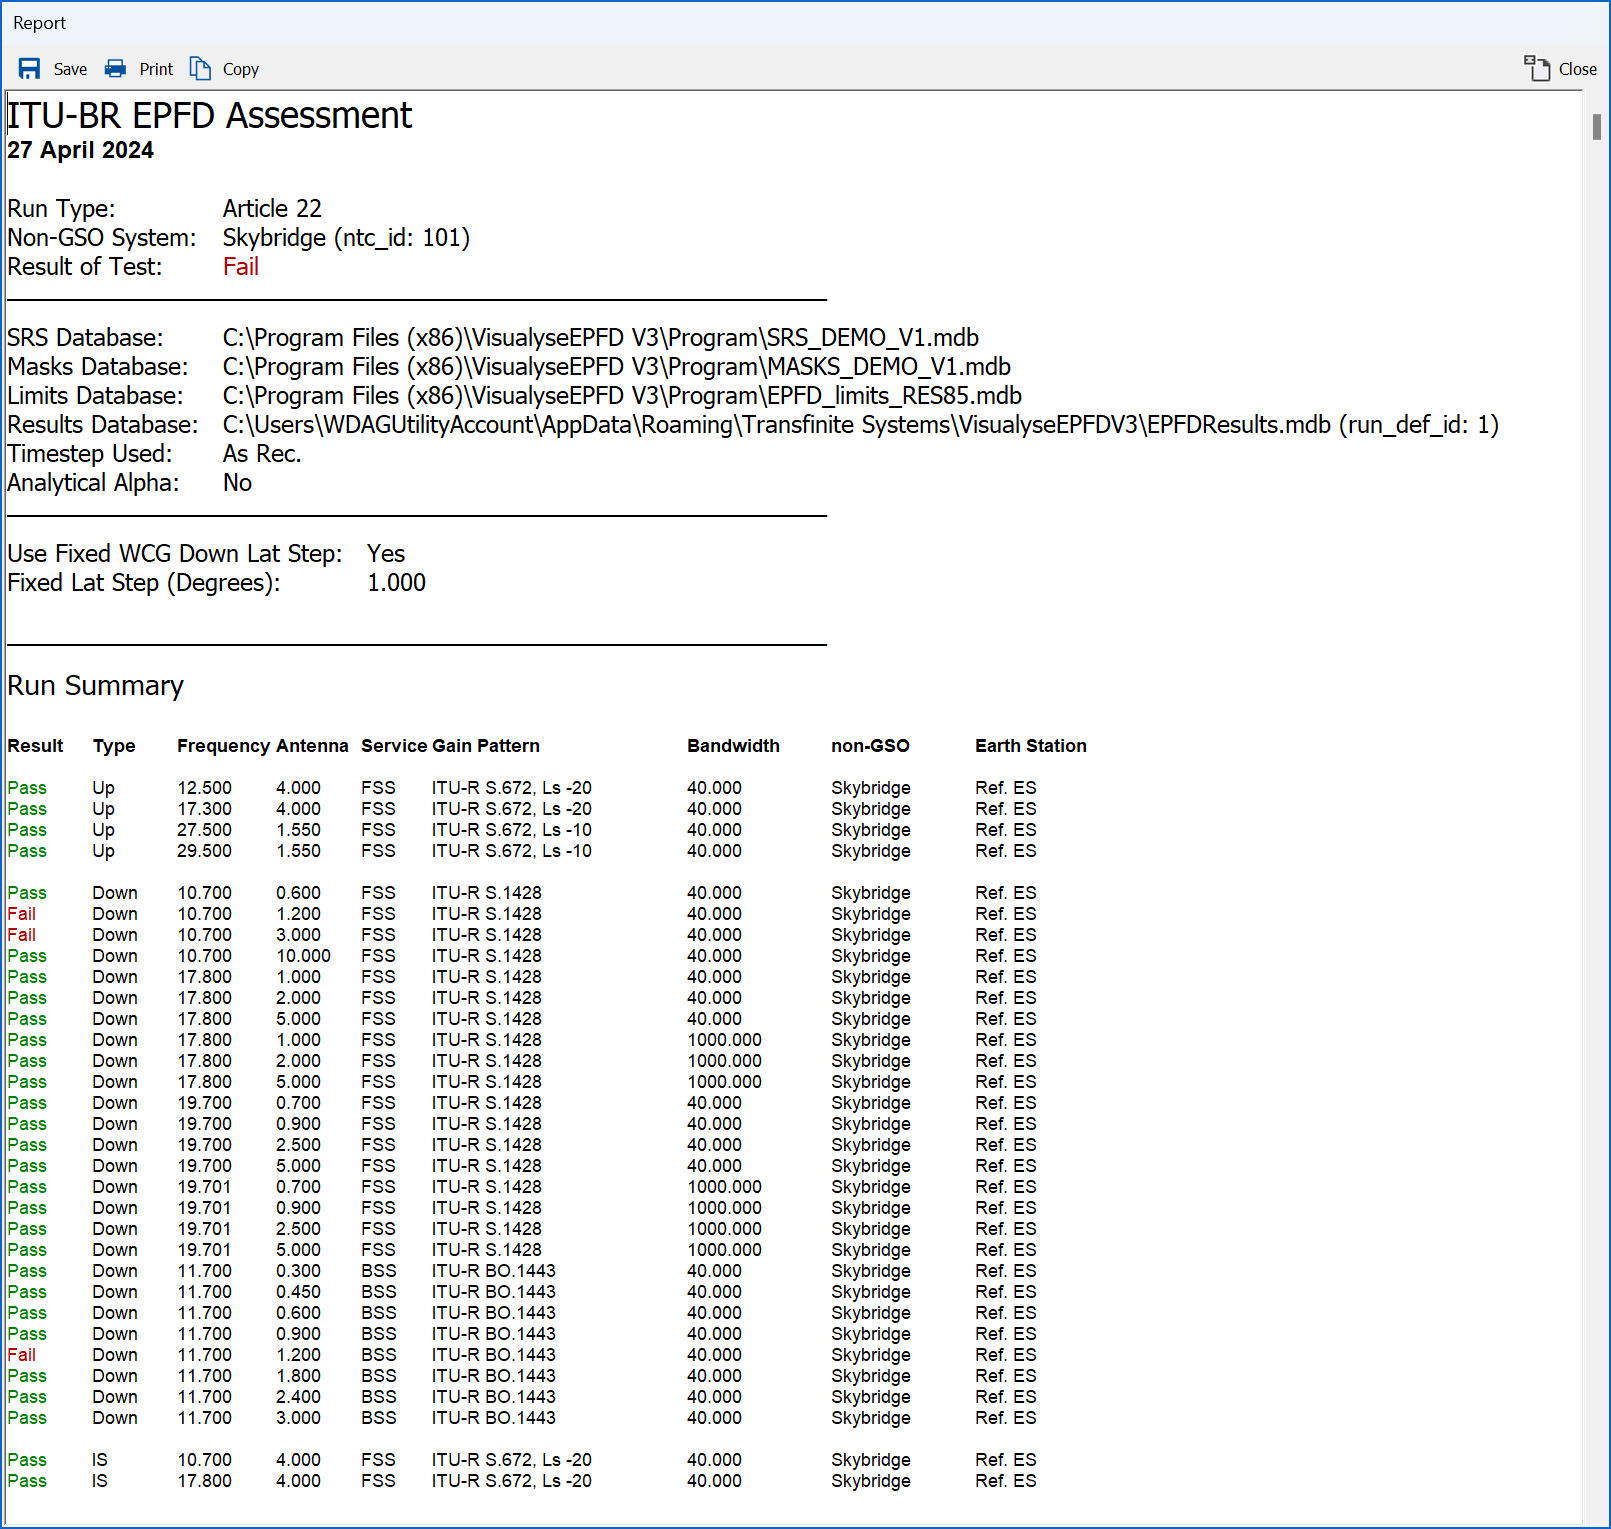
The report is in five sections. The first section is a statement of the result of the test. This includes the date non-GSO system under test and the overall result (pass or fail).
The second section details the databases used, the timestep selected and if method for calculating Alpha.
The third section shows any WCG settings selected for the run.
The fourth section is a summary of the runs performed. This shows the result for each run.
The final section is a detailed breakdown of the results for each run. This contains the CDF distribution and its comparison with the limits.
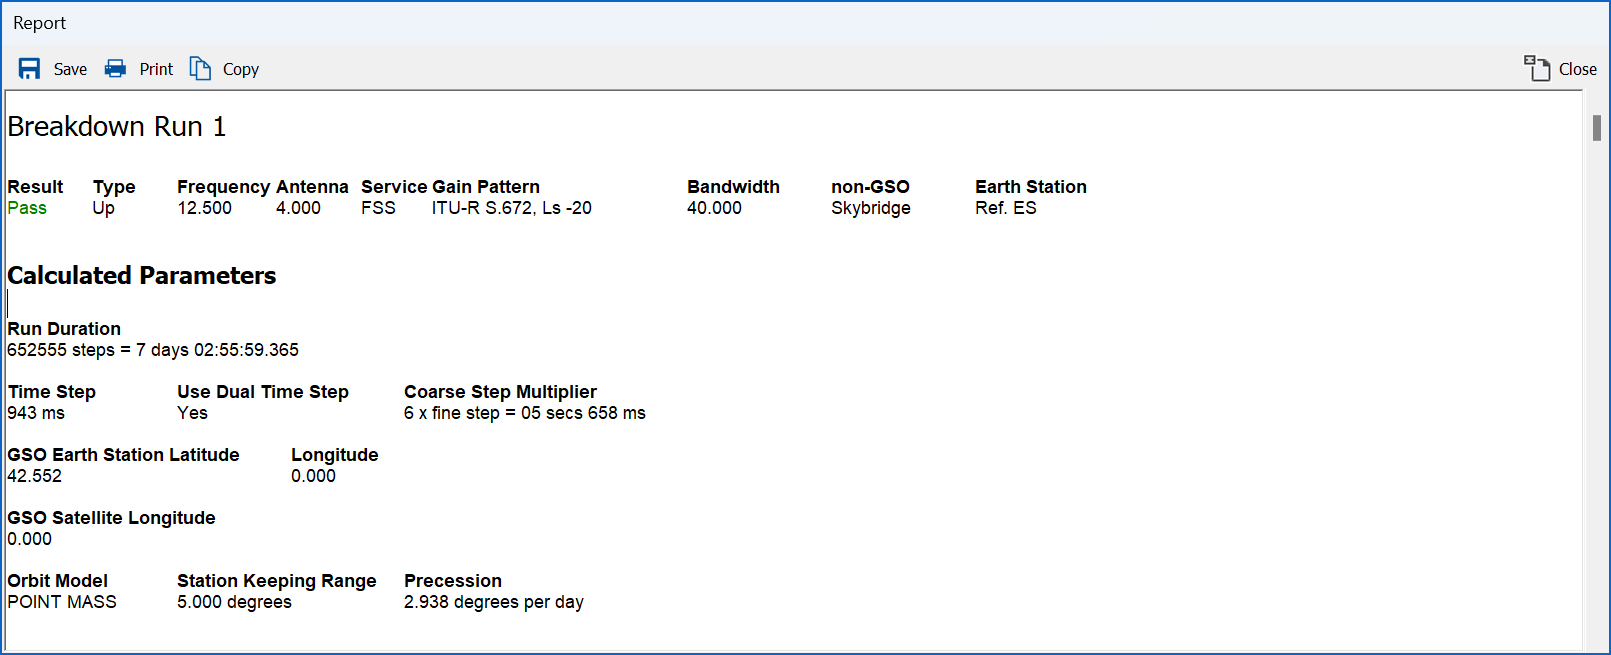
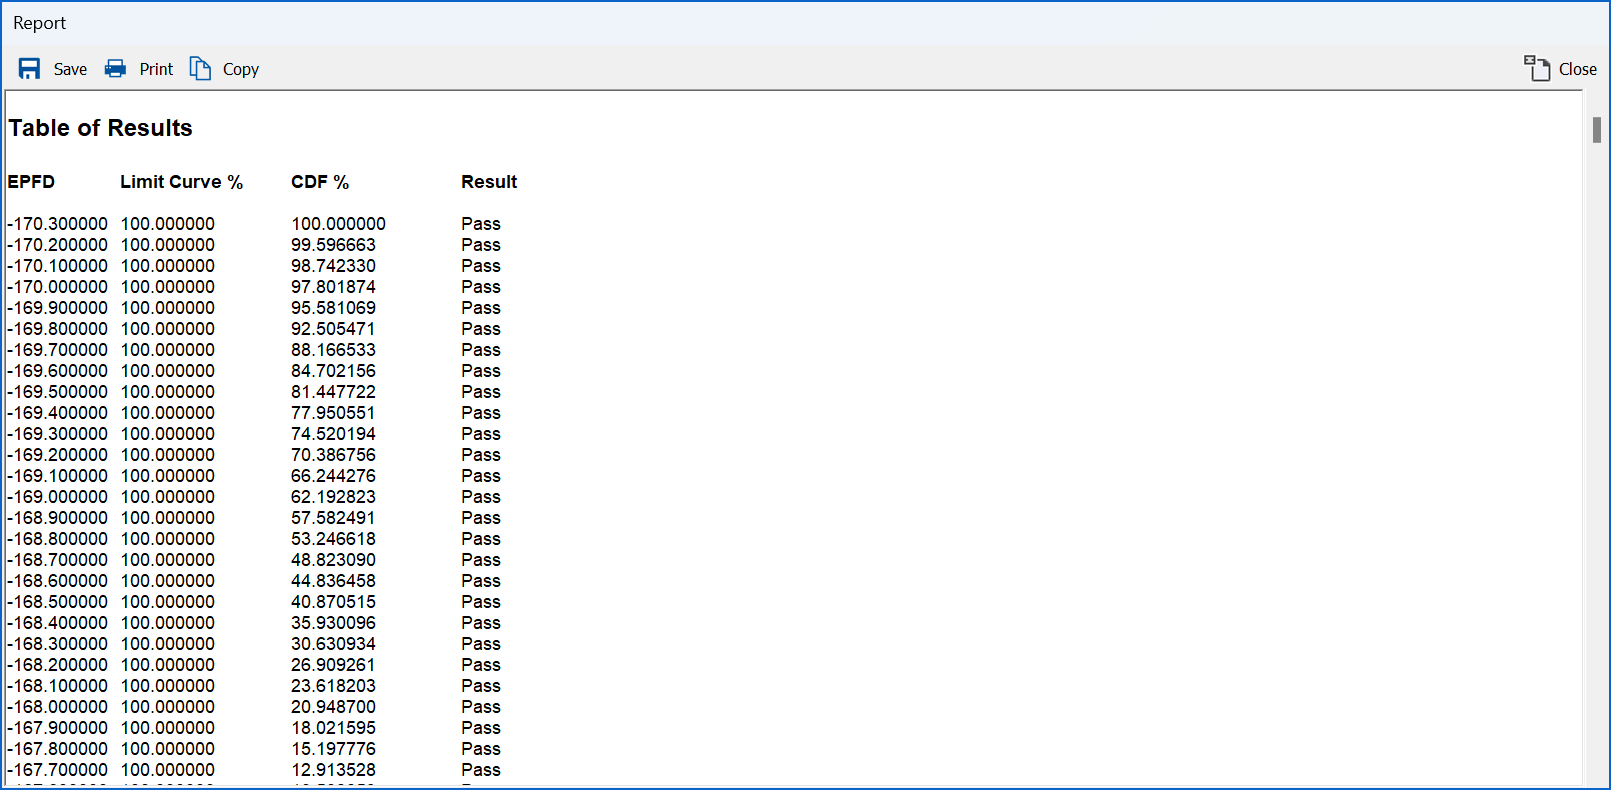
To print the report, click the print button. If you want to save the report to a file, click the Save button. The report is saved in Rich Text Format (RTF), so it can easily be read by word processors such as Microsoft Word.
You can copy the whole report to the clipboard by clicking the Copy button. Alternatively, you can select a part of the report and click copy to copy just that selection to the clipboard. The copied text can then be pasted into another application.
Scenario Window
Overview
The Scenario window displays a 2D-map view of the scenario for the selected run. The purpose of this window is to give a visual representation of the GSO and nonGSO systems that are being simulated.
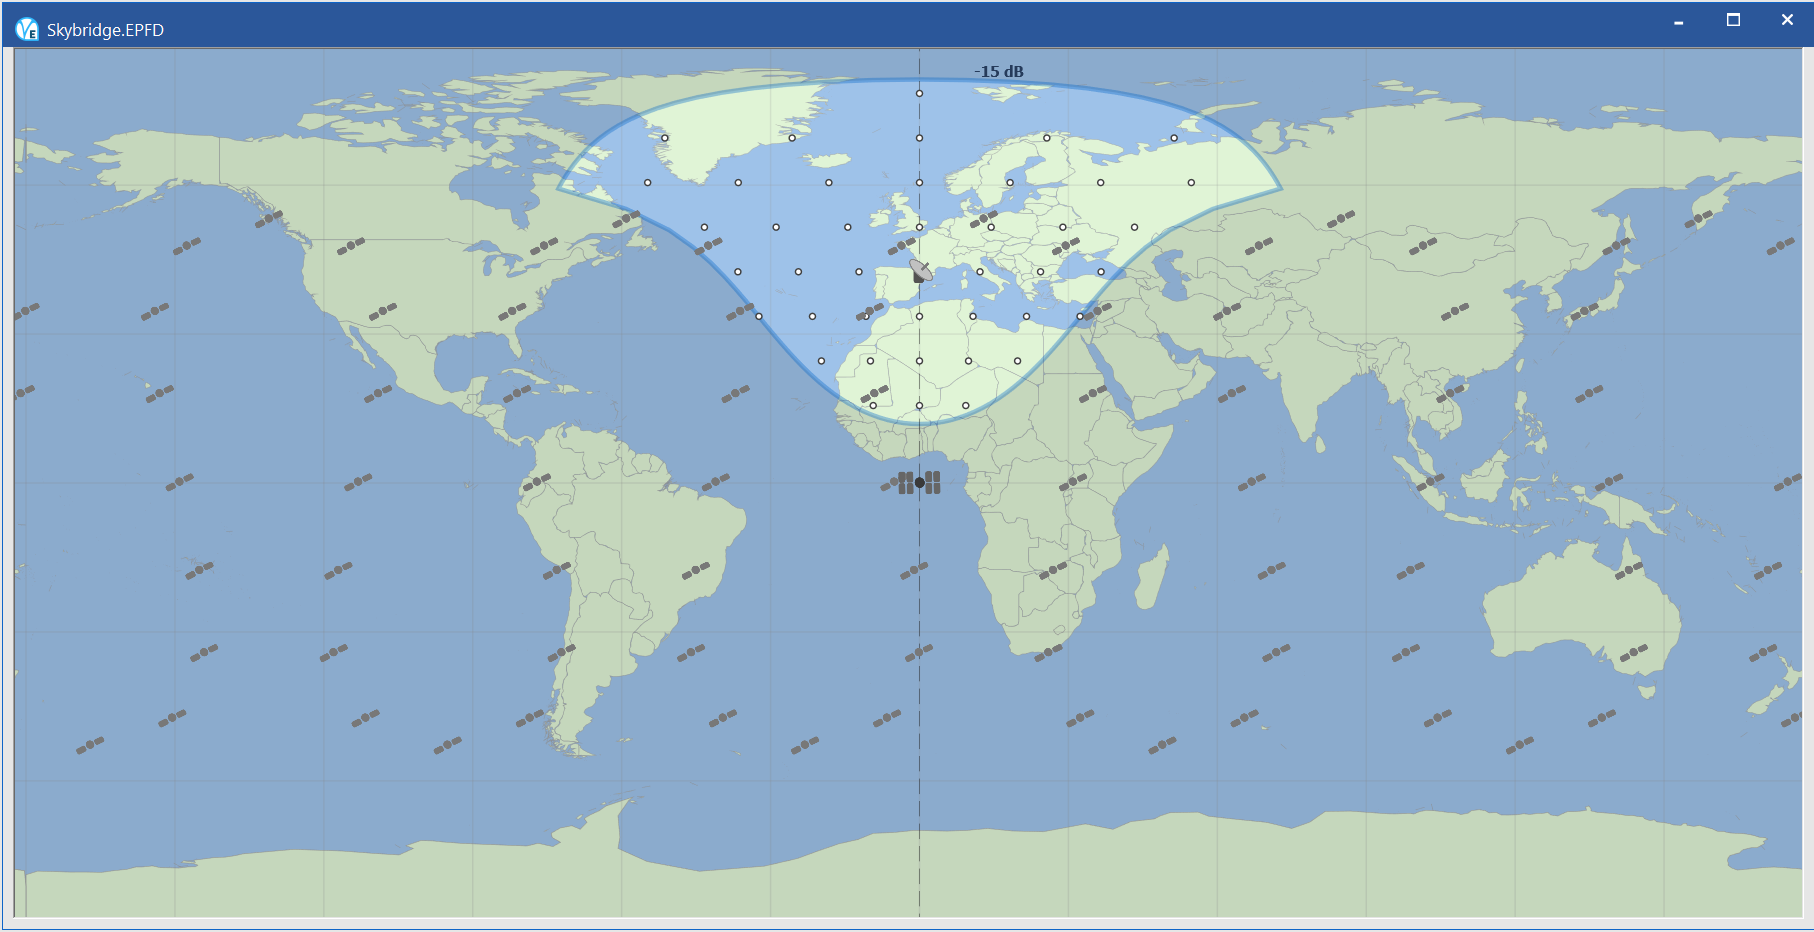
Figure 13: Scenario Window showing an EPFD(up) run
To Show or Hide the Scenario Window
Select Scenario window from the View menu or click the Scenario window button on the tool bar.

To Zoom the Scenario Window
Click the appropriate Zoom (magnifying glass) buttons on the tool bar on zoom the map in/out.

When a run is in Play mode, you will see the nonGSO satellites moving in the Scenario window.
A number of calculated parameters can be displayed for each non-GSO satellite and for the GSO associated Earth station. These calculations are updated at each time step.
Displaying Calculations
3.2.1 Selecting Parameters to Display
3.2.2 Selecting Elements to Display
3.2.3 Displaying Calculations for a Station
3.2.5 Display parameters for EPFD(up)
3.2.6 Display parameters for EPFD(down)
3.2.7 Display parameters for EPFD(IS)
Selecting Parameters to Display
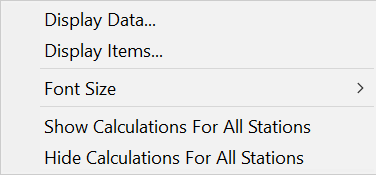
Right click in the Scenario window and click Display Data to bring up a list of calculation parameters that can be displayed.
The parameters are dependent on the type of run currently selected. The dialog below shows the display properties for an EPFD(up) run.
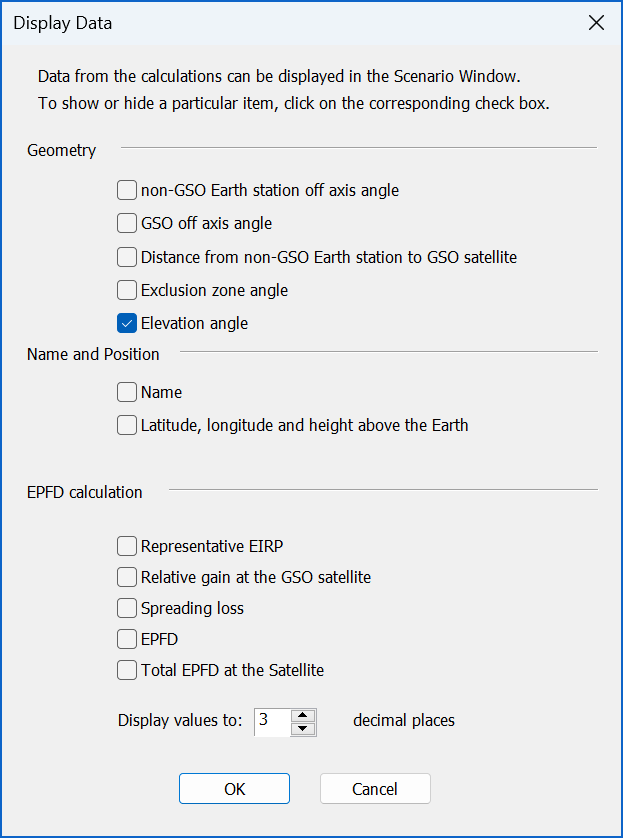
To display a parameter, check the box to the left of the parameter name.
Note that calculations cannot be displayed for runs that have not started.
Selecting Elements to Display
It is also possible to select which elements are shown in the view in order to avoid information over-load. The following dialog can be activated by right clicking in the Scenario window and then selecting Display Items.
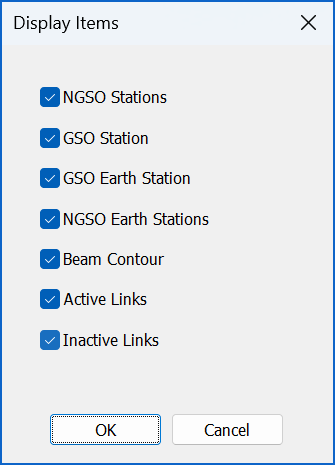
For example, it can be useful in the EPFD(up) runs to hide inactive links to reduce the information displayed on the screen.
Displaying Calculations for a Station
The display parameters will only be shown for stations that have had their calculations switched on. You can switch the calculations on or off for any station in a run by right clicking on the station icon and clicking the Show Calculations option.


Switching the Show Calculations option on does not necessarily show the information instantly. The display parameters are only displayed when it makes sense to do so. For example, in an EPFD(down) run no EPFD calculation information is shown for satellites that are not visible to the GSO Earth station.
To make it clear which stations have the Show Calculations option switched on, the icon of the station will be shown in a white circle. If there is no white circle for a station, Show Calculations is switched off.


If a station has its calculations switched off then you can hover the mouse cursor above the station icon to temporarily display the calculations.
To turn the calculations on or off for all the stations in a run, right-click in a part of the Scenario window where there are no stations, then either click “Show Calculations For All Stations”, or “Hide Calculations For All Stations”.
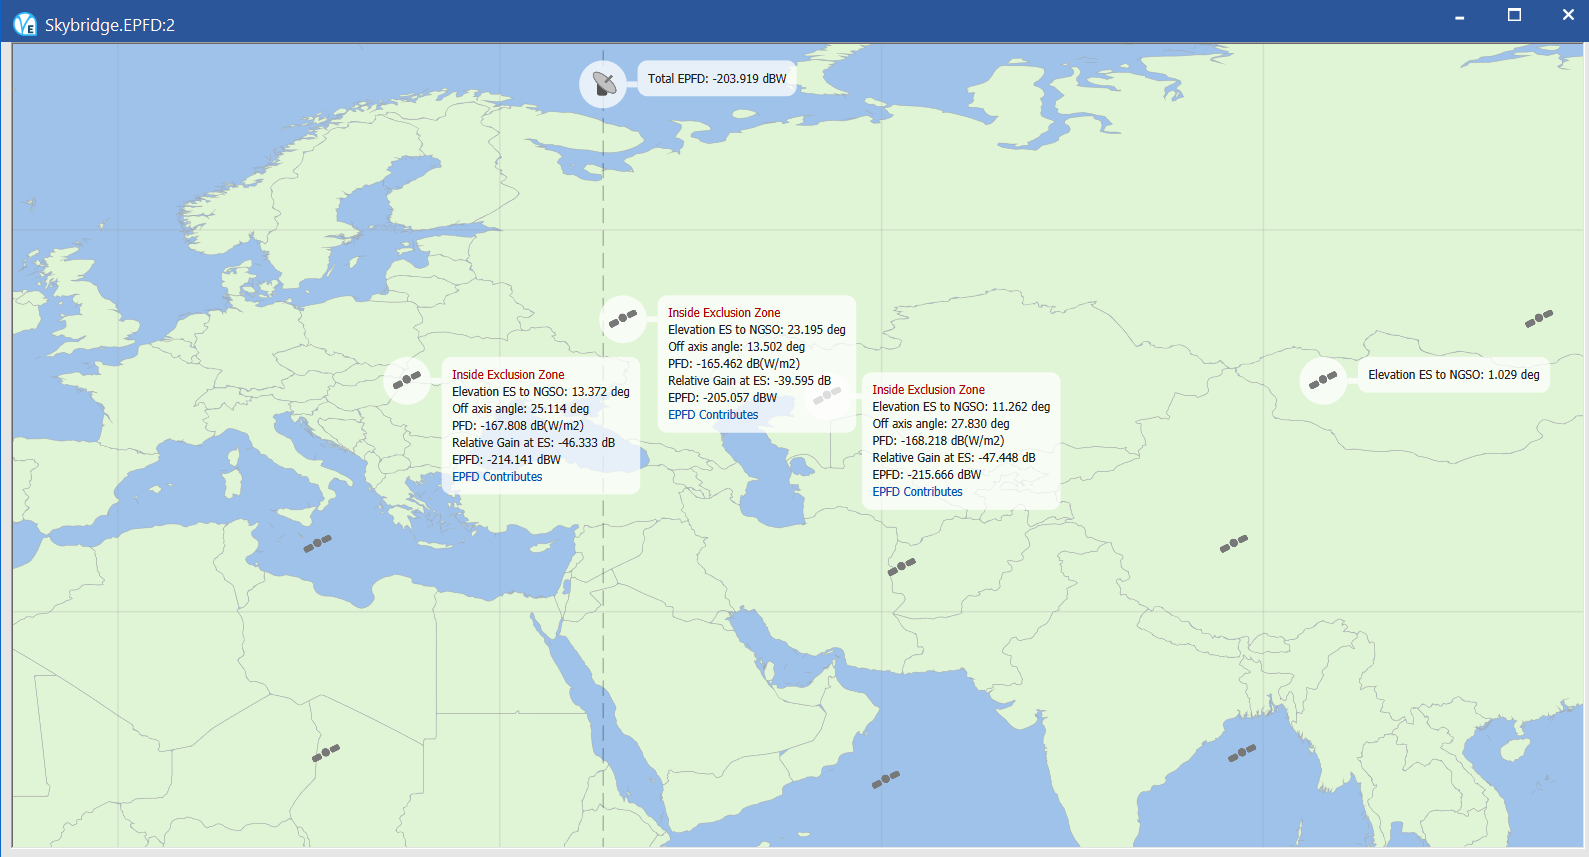
The picture below shows an example of the Scenario View with a number of display options switched on.
Display Clarity
The displayed data is sometimes difficult to pick out from the background map. To improve the clarity of this data, you can increase or decrease the brightness of the underlying map. This is done using the brightness buttons on the Settings toolbar.


To achieve the best conditions for reading the displayed data, simply decrease the brightness.
You can also change the size of the text used for displayed parameters. To do this, right-click in the Scenario window, then point to Font Size.
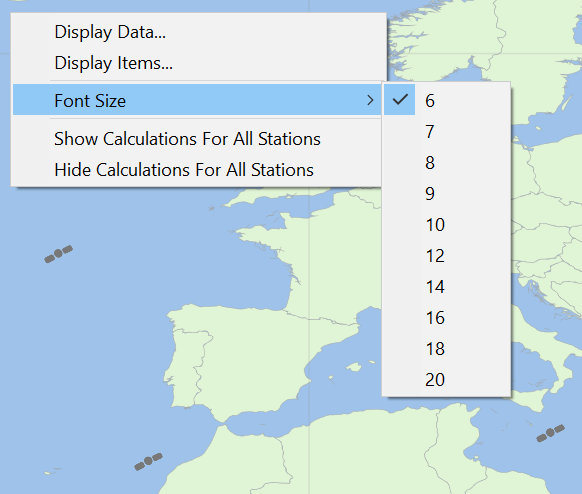
Click the font size you want to use (the sizes are in Point units).
Display parameters for EPFD(up)
The parameters that can be displayed for EPFD(up) runs are as follows:
| Parameter | Description |
|---|---|
| non-GSO Earth station off axis angle | The angle between the line from the non-GSO service area Earth station to the tracked non-GSO satellite and the line from the non-GSO service area Earth station to the GSO satellite. |
| GSO off axis angle | The angle between the pointing direction of the GSO satellite and the line between the GSO satellite and an Earth station in the non-GSO service area. |
| Distance from nonGSO Earth station to GSO satellite | The distance from an Earth station in the non-GSO service area to the GSO satellite. |
| Exclusion Zone angle | The angle between the GSO arc, an Earth station in the non-GSO service area and the non-GSO satellite it is tracking. This angle could be an X or Alpha angle, depending on which of these is defined as the exclusion zone parameter for the run. |
| Elevation Angle | The elevation angle of a tracked nonGSO satellite from the Earth station which is tracking it. |
| Name | The name of each satellite and Earth station. |
| Latitude, Longitude and Height above the Earth | The latitude, longitude and height above the Earth of each satellite and Earth station. |
| Representative EIRP | The EIRP of an Earth station from the non-GSO service area, in the direction of the GSO satellite. This is based on the EIRP from the mask and the density of Earth stations in the non-GSO service area. |
| Relative Gain at the GSO satellite | The relative gain at the GSO satellite. |
| Spreading loss | The loss in the direction of the GSO satellite from each Earth station in the non-GSO service area. |
| EPFD | The EPFD contribution for each Earth station in the non-GSO service area. |
| Total EPFD at the Satellite | Total calculated EPFD at the GSO satellite for the current time step. |
The location parameters (Latitude, Longitude and Height above the Earth and x, y, z coordinates) are shown for each station, including the nonGSO service area stations.
The Total EPFD at the Satellite is obviously only displayed for the GSO satellite.
All the other parameters apply to the link between a nonGSO satellite and an Earth station in the non-GSO service area.
The input parameters define the maximum number of nonGSO satellites that can be tracked by an Earth station. The Earth station will track the satellites which are closest to the GSO arc, but outside the GSO exclusion zone and above the minimum elevation angle.
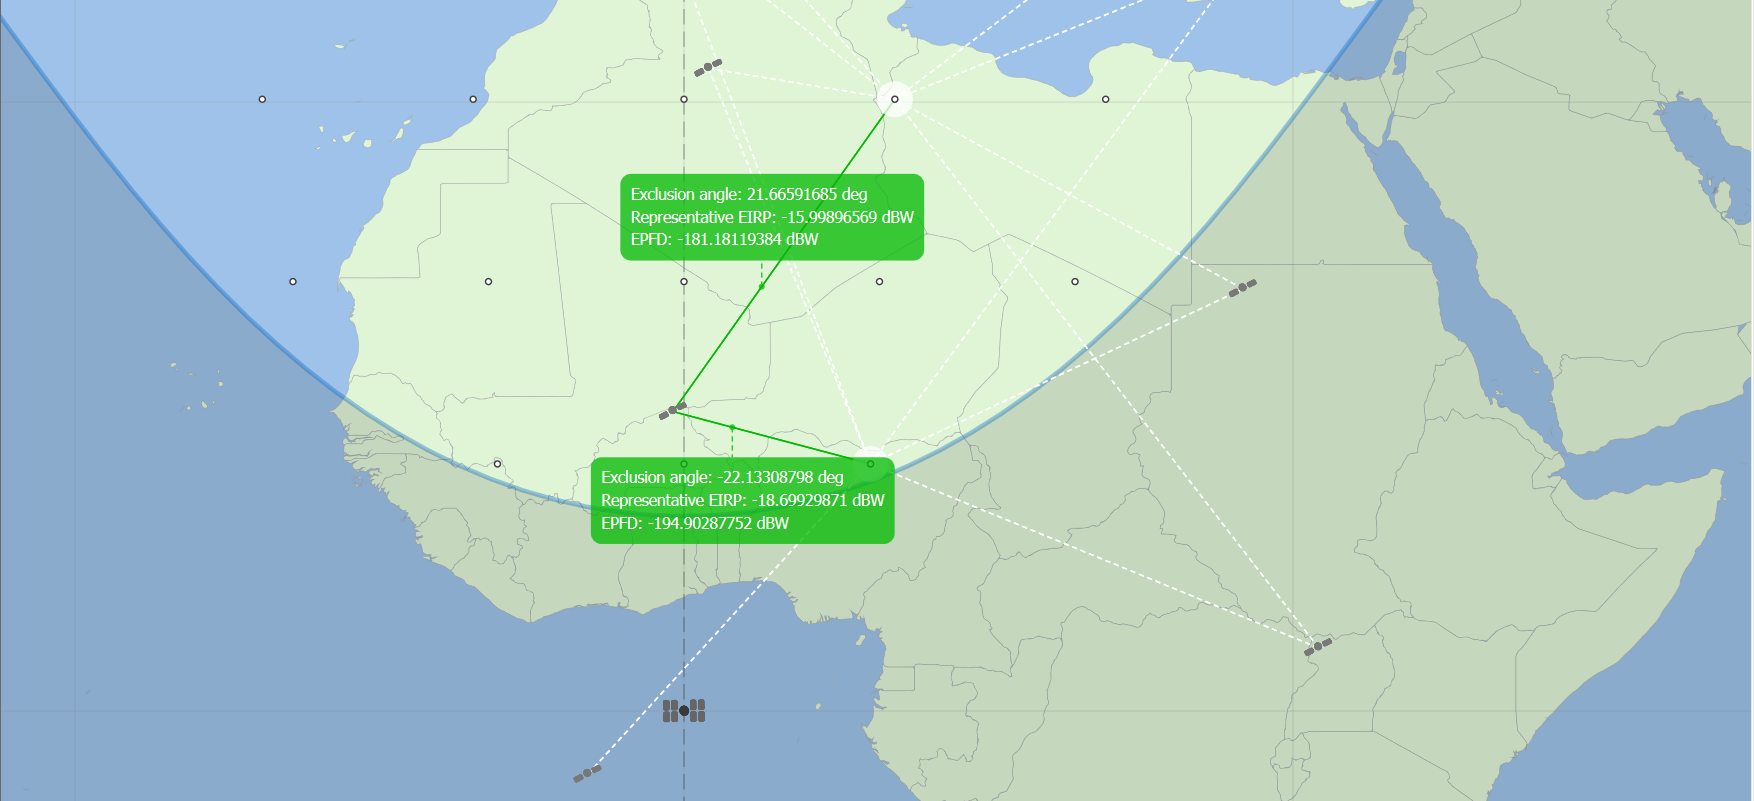
Links between Earth stations and the nonGSO satellites they are tracking are displayed as green lines in the Scenario window.
Dotted grey and white lines are displayed between Earth stations and nonGSO satellites that are visible, but cannot be tracked. This may occur if the satellite is below the minimum elevation angle or inside the GSO exclusion zone for example.
Display parameters for EPFD(down)
The parameters that can be displayed for EPFD(down) runs are shown below. Note that, with the exception of the location information, these parameters are displayed for each nonGSO satellite that is visible to the GSO Earth station.
| Parameter | Description |
|---|---|
| Elevation angle | The elevation angle of a non-GSO satellite from the GSO associated Earth station. |
| Alpha angle | The GSO angle Alpha between a nonGSO satellite, the GSO associated Earth station and the GSO arc. |
| X angle | The GSO angle X between the GSO associated Earth station, a non-GSO satellite and the GSO arc. |
| Off axis angle | The angle between the line from the GSO Earth station to the GSO satellite and the line from the GSO Earth station to a nonGSO satellite. |
| Delta longitude | The difference in longitude between the nonGSO sub-satellite point and the point on the GSO arc which gives the minimum X or Alpha angle. |
| Elevation of ES from nonGSO | The elevation angle of the GSO associated Earth station from a nonGSO satellite. |
| Azimuth of ES from nonGSO | The azimuth angle of the GSO associated Earth station from a nonGSO satellite. |
| Planar angle | The angle used in combination with the Off axis angle to determine the gain at the GSO associated Earth station in the direction of the nonGSO satellite for the BSS antenna pattern. (only applies to BSS runs) |
| Name | The name of each satellite and Earth station. |
| Latitude, Longitude and Height above the Earth | The latitude, longitude and height above the Earth of each satellite and the GSO associated Earth station. |
| Indicate when the nonGSO is in the exclusion zone | Provides an indication of whether a nonGSO satellite is inside the GSO exclusion zone. The words "Inside Exclusion Zone" are printed in red next to a non-GSO satellite when inside the zone. |
| Relative Gain at the Earth Station | The relative gain at the GSO associated Earth station in the direction of a nonGSO satellite. |
| PFD | The PFD from a nonGSO satellite. |
| EPFD | The EPFD contribution from a nonGSO satellite as a result of adding the PFD to the receive gain at the GSO associated Earth Station. |
| Indicate if an EPFD contribution is included in the calculation | Displays "EPFD Contributes" in blue for each non-GSO satellite whose EPFD is included in the calculation. Only a certain number of EPFDs are included in the total. This is determined by the maximum number of non-GSO satellites which service a point on the ground at any one time (a characteristic of the non-GSO system) |
| Total EPFD at the Earth Station | Total calculated EPFD at the GSO associated Earth station for the current time step. |
Display parameters for EPFD(IS)
The parameters that can be displayed for EPFD(IS) runs are shown below. Note that, with the exception of the location information, these parameters are displayed for each nonGSO satellite that is visible to the GSO satellite.
| Parameter | Description |
|---|---|
| non-GSO off axis angle | The angle between the line from the non-GSO satellite to its sub-satellite point and the line from the non-GSO satellite to the GSO satellite. This is used to calculate the EIRP from the mask. |
| GSO off axis angle | The angle between the line from the GSO satellite to the GSO associated Earth station and the line from the GSO satellite to a non-GSO satellite. |
| Distance from nonGSO to GSO | The distance between a non-GSO satellite and the GSO satellite. This is used to calculate pathloss. |
| Name | The name of each satellite and Earth station. |
| x, y, z coordinates | The x, y, z coordinates of each satellite and the GSO associated Earth station. |
| Latitude, Longitude and Height above the Earth | The latitude, longitude and height above the Earth of each satellite and the GSO associated Earth station. |
| non-GSO EIRP | The EIRP from a nonGSO satellite. |
| Spreading loss | The loss in the direction of the GSO satellite from a nonGSO satellite. |
| Relative Gain at the GSO satellite | The relative gain calculated at the GSO satellite in the direction of a nonGSO satellite. |
| EPFD contributions | The EPFD contribution from a nonGSO satellite. |
| Total EPFD at the GSO satellite | The total EPFD at the GSO satellite for the current time step. |
CDF Graph Window
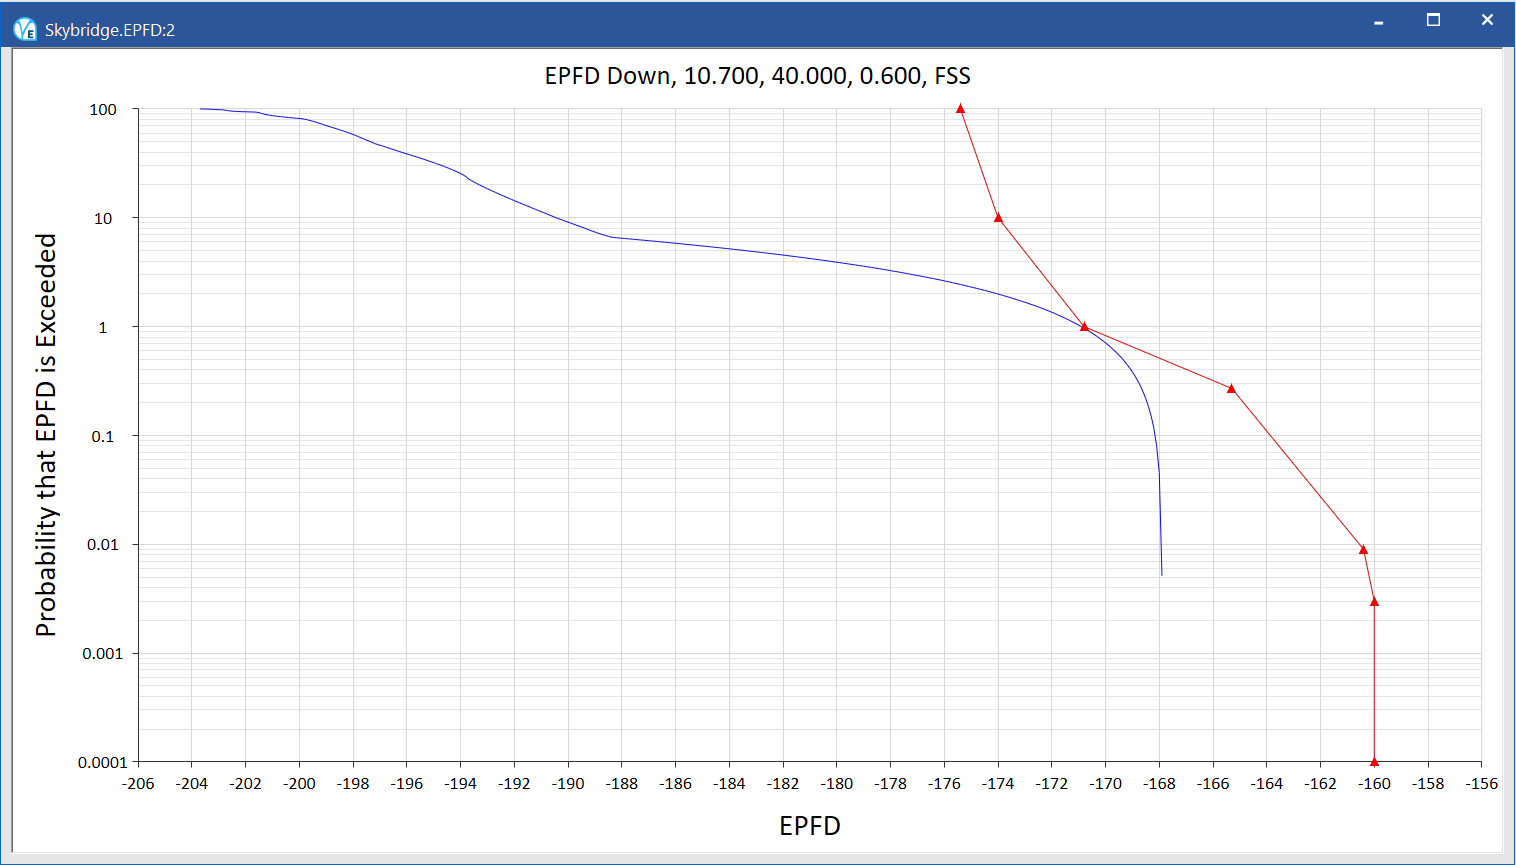
The CDF graph shows the cumulative probability distribution of EPFD for the selected run. This is shown in graphical form with the EPFD limit curve superimposed.
To Show or Hide the CDF Graph Window
Select CDF Graph from the View menu or click the CDF Graph button on the tool bar.

A system whose CDF lies to the left of the EPFD limit curve at all points, passes the test. If any part of the CDF lies to the right of the EPFD limit curve, the nonGSO system fails the test. The further the CDF is to the right of the EPFD limit curve, the larger the margin of the failure.
Accessing CDF Data
You can access the raw data for the CDF by right clicking in the CDF window, and clicking Graph Data.
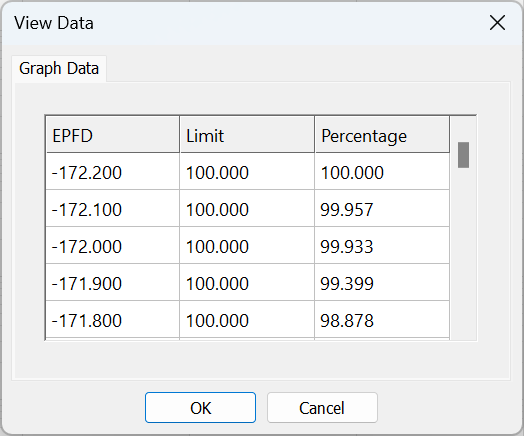
The EPFD column shows the EPFD bin. The Limit column shows the point on the limit curve for the given EPFD and the Percentage column shows the point on the CDF curve for the given EPFD.
The rows in bold type represent limit points which define the limit curve as listed in the relevant articles of the RR.
Copying data to other applications
If you want to copy any data to another application, simply select the data you want, hold down the Control key on the keyboard the press the C key. This will copy the data to the clipboard so that it can be pasted into other applications.
To select all the data in a column, click on the column title. To select multiple columns, click and hold on the first column title then drag to include other columns in the selection.
Editing Runs
5.2 Changing GSO System Parameters
Background
For most non-GSO systems, all the necessary EPFD runs and their associated parameters are generated by the software. In particular:
- The worst-case geometry (WCG) algorithm calculates the positions for the reference GSO satellite and its Earth station by determining the geometry that would result in the highest single entry EPFD with the largest likelihood
- The run time calculation determines the step size and run duration to ensure statistically significant results.
The algorithms to calculate the WCG and run time and step are given in detail in Recommendation ITU-R S.1503-2.
However there are times when it can be useful to consider alternatives, for example to look at geometries that where there could be high long-term EPFD. This can be achieved by changing the run parameters, as described in this section.
Changing GSO System Parameters
You can view or change the GSO system geometry. Usually, the Earth station and satellite locations are calculated following the algorithms for worst case, defined in the Software Specification.
To examine the GSO satellite and earth station location:
Select GSO Settings from the Run Menu, or click the GSO Settings tool on the tool bar.

The GSO System Settings dialog will be displayed (as shown below). This shows the locations of the GSO satellite and Earth station.
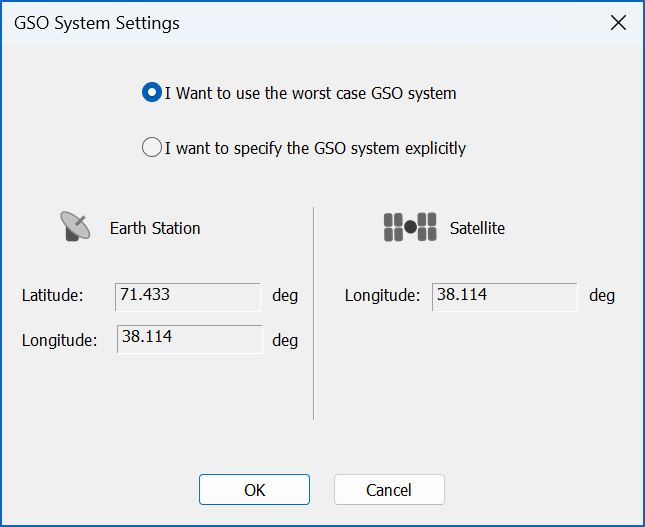
At the top of the dialog are two option buttons. By default, ‘I want to use the worst case GSO system’ is selected but it is possible to specify the GSO system geometry yourself.
To change the GSO satellite and earth station locations:
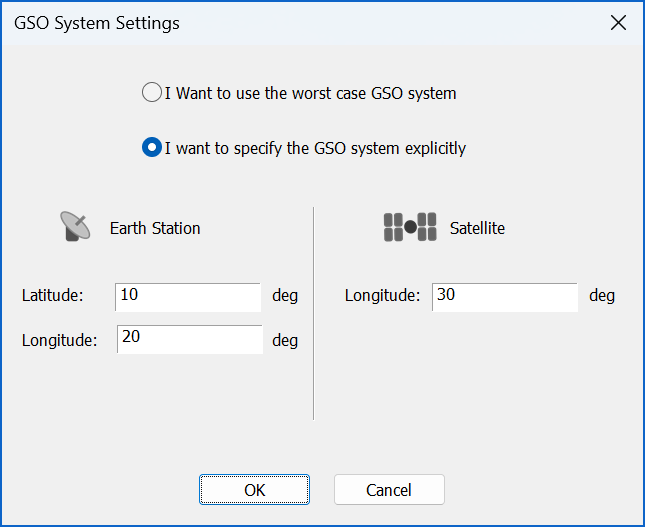
Click the ‘I want to specify the GSO system location explicitly’ button.
This will allow you to edit the locations of the GSO stations in the dialog (as shown below).
Click OK to confirm your changes.
The changes will only apply to the currently selected Run but it is possible to set these as application level defaults, as described in Section 6.3.
Changing Time Settings
The Software Specification gives algorithms for calculation of the required time step and the total number of time steps. There is also reference to a ‘coarse time step’ that can be used whenever the nonGSO is sufficiently far away from either the GSO main beam or the exclusion zone (see D.3.3.1 of the Software Specification)
The use of coarse and fine time steps (dual time step mode) is optional in Rec. ITU-R S.1503.
The time settings can also be changed from the default, calculated values if required.
To change the time settings:
Select Time Settings from the Run menu or click the Time Settings button on the toolbar.

The total number of time steps can be changed. The fine time step size in minutes, seconds and milliseconds can be defined. Dual time step mode can be switched on and off and the coarse time step can be defined as a multiple of the fine time step.
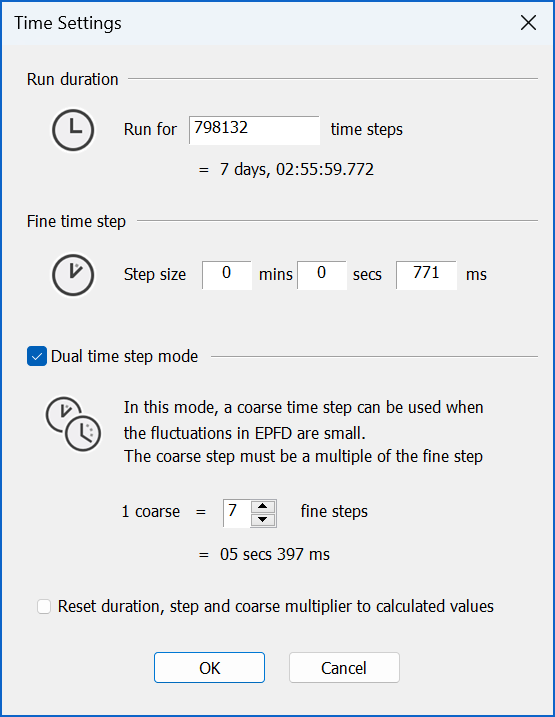
For the EPFD validation, the time step size and number must be left at the default values.
File and Database Management
File Management
In Visualyse EPFD the resulting statistics and EPFD run progress can be stored in a proprietary binary file format.
The standard file menu options are:
- New: create a new file
- Open: open a previously saved file
- Save: save the currently open file with its existing file name. If it hasn’t be saved yet you will be asked for a filename
- Save As: allows you to select a filename and then save it
One way to access these options can be accessed via the file menu:
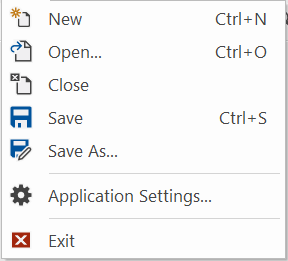
Alternatively the toolbar options can be used as shown below:

In addition the following standard shortcuts maybe used:
- Ctrl+N = New
- Ctrl+O = Open
- Ctrl+S = Save
Note that runs can be saved and re-loaded at any stage, including part way through a run.
Database Format
The non-GSO network and LES information is stored with the SRS database as defined in ITU documentation.
More information is available on request.
Application Settings
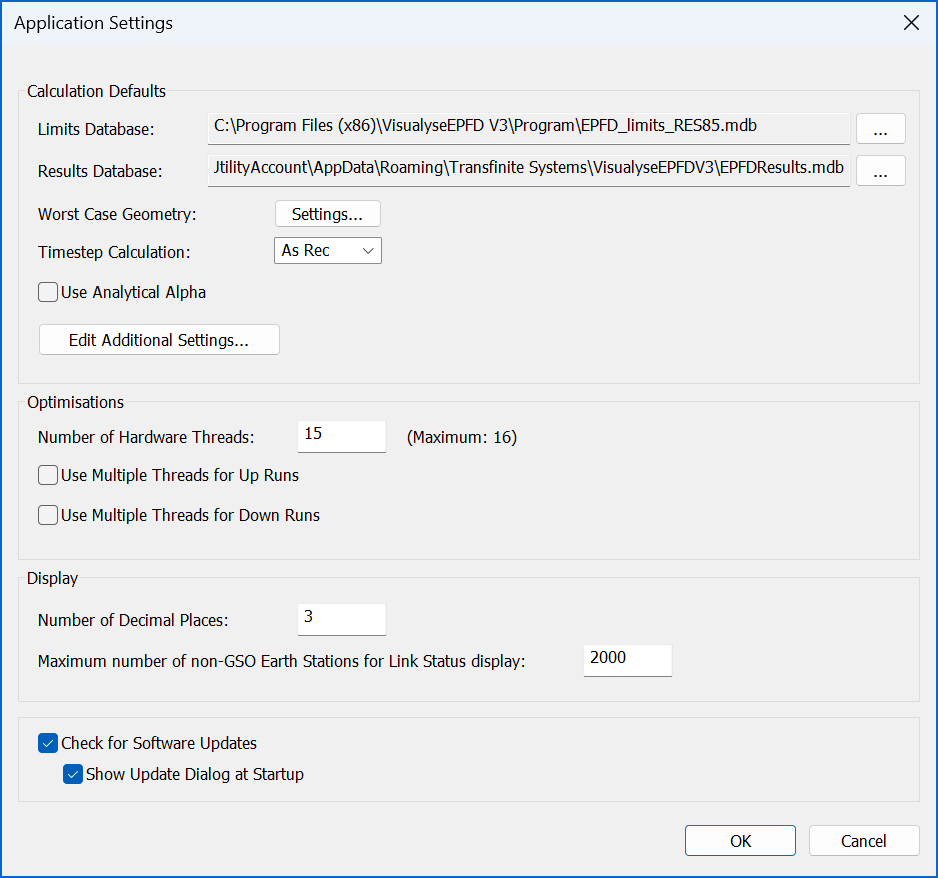
Calculation Defaults
Limits Database
This field specifies where Visualyse EPFD should look for the Limits database. It is unlikely the user will want to modify this setting from the default.
Results Database
This field specifies the default name and location of the Results database.
WCG Geometry
It is possible to fix the Worst Case Geometry parameters used in a simulation by clicking “Settings…”

WCG(down) Latitude Step Size
In addition, if the WCG algorithm is being used it is possible to improve the performance by increasing the step size. The algorithm searches for the highest single entry EPFD(down) value by iterating over:
- PFD mask
- Non-GSO satellite latitude
- or theta angle
- or phi angle
The theta and phi angles are shown in the figure below taken from Recommendation ITU-R S.1503-2 (Figure 12):
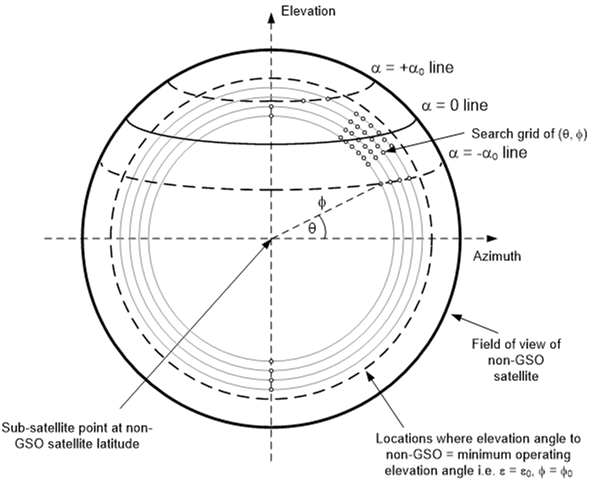
The WCG algorithm uses a very fine step size that can lead to long calculations. Analysis has suggested it is possible to increase the step size without significant loss of accuracy for many cases and this can be used to generate runs more quickly.
Timestep Calculation
The time step size was derived in S.1503-2 to ensure that there are sufficient samples in the main beam to ensure statistical significance and capture low likelihood but high EPFD events. With large numbers of satellites in a constellation and very narrow main beam antennas of large dish GSO ES antennas, this can lead to very long run times. For such large constellations there is a significant degree of repetition as multiple satellites for each of the planes traverses the GSO ES main beam. This can be used to calculate a larger time step and hence reduce overall run-time.
As this method is not in Recommendation ITU-R S.1503-2 a number of options are provided:
As Rec.: run with the full time step calculation as per the Recommendation
TS 1: adjust the Nhit term to take account of the number of satellites
TS 2: adjust both the Nhit and Ntrack terms to take account of the number of satellites
TS 2 will result if quicker runs than TS 1 but with potentially increased deltas from a run executed as per the Recommendation.
Use Analytical Alpha
This option is to select whether to use Analytical Alpha calculation (as opposed to Iterative Alpha).
Additional Settings
Clicking the Edit Additional Settings button will show the Additional Settings dialog. This allows users to enable/disable some additional (experimental) features:
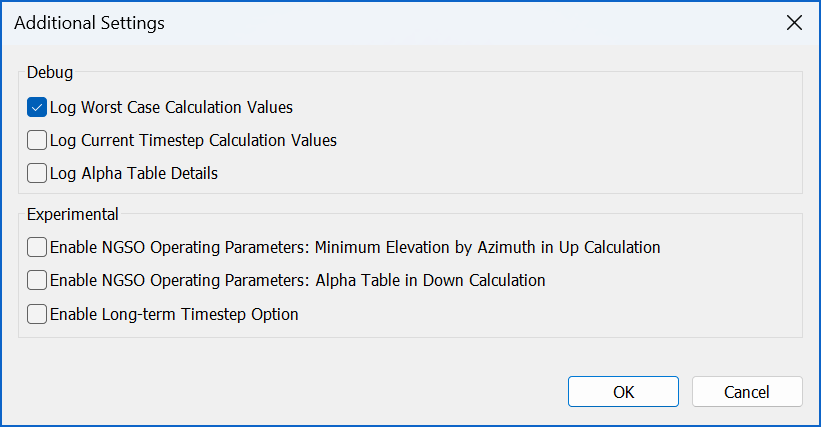
Debug
These Options control what information is logged to the View | Debug Info window. By default, the software will log the Worst Case Calculation Values. Users can also enable Current Timestep Calculation Values but should note there is a performance impact on doing so. In addition, there is an option to log Alpha Table details (see section below).
Experimental
These options allow users to experiment with some additional calculation options.
The first two options allow the use of a Non-GSO Operating Parameters XML file (as defined in B3.3 Non-GSO system operating parameters in S1503-3).
When either the "Enable NGSO Operating Parameters: Minimum Elevation by Azimuth in UP Calculation" or "Enable NGSO Operating Parameters: Alpha Table in DOWN Calculation" option is selected the New Run Definition dialog has a new field (as shown below).
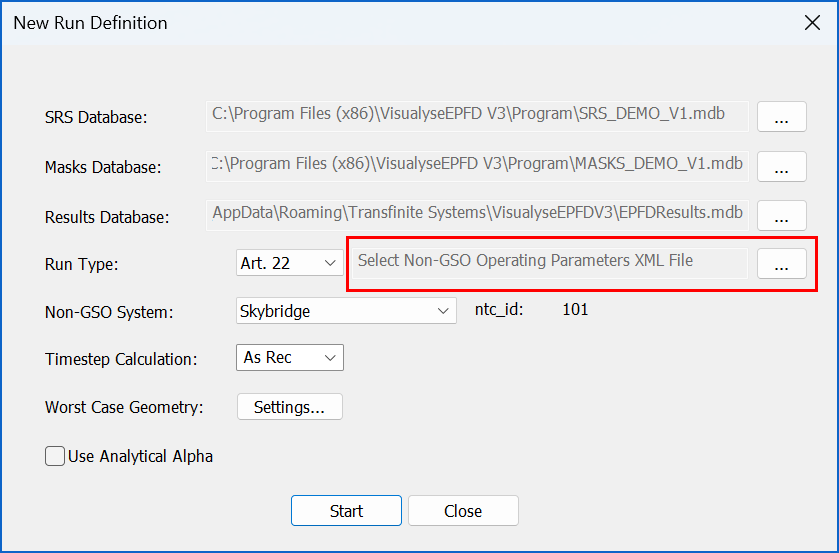
Clicking the “…” button allows the user to select a Non-GSO Operating Parameters XML file using a standard file selection dialog. Note: the file will be validated on selection and will only be shown in the field if it is considered to adhere to a valid XML format.
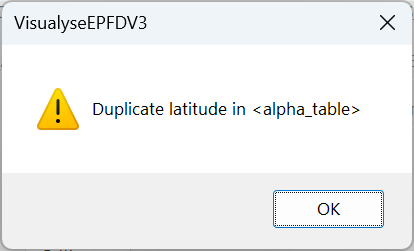
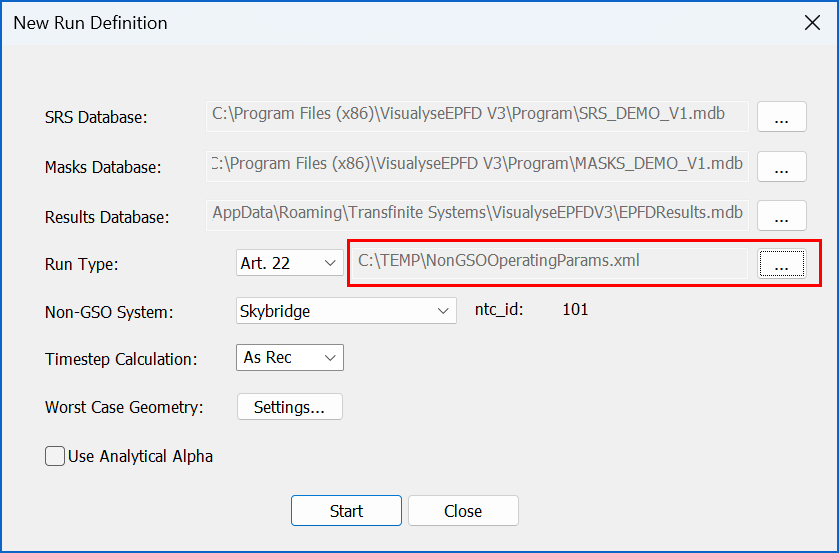
The “Enable NGSO Operating Parameters: Minimum Elevation by Azimuth in UP Calculation” options allows the user to specify data in the <min_elev> section of the XML file that will be taken into account in UP calculations. This is further described in S1503-3.
The "Enable NGSO Operating Parameters: Alpha Table in DOWN Calculation" option allows user to specify data in the <alpha_table> section of the XML file that will be taken into account in the DOWN calculation. This is further described in document 4A/653-E. Note: if this checkbox is enabled the user can then select “Log Alpha Table Details” in the Debug section of the Additional Settings dialog.
The ”Enable Long-term Timestep Option” if enabled adds another Timestep Calculation option for the user to select: “TS L”.
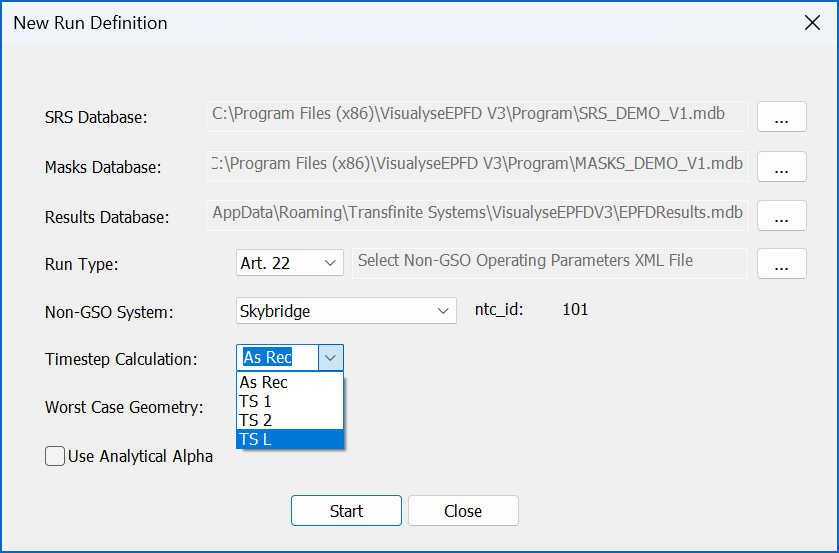
If selected and the total number of time steps is greater than 1e7, then the time step size is increased by a factor of 100 while the run duration is kept unchanged, so the number of time steps is reduced by a factor of 100. This should provide good statistical accuracy of the long-term statistics, potentially for EPFD values occurring for more than 0.1% of the time.
Optimisations
These fields can be used to specify the number of CPU cores used by the program and select to run in “Fast” mode (where more compute threads are used by each EPFD run).
Display
These fields allow the user to specify the number of decimal places to use as well as how many non-GSO Earth Stations show Link Status information in Up runs. Note: the latter setting may be used to prevent memory issues in complex Up runs when there are large number of Earth Stations.
Check for Software Updates
This option controls if the software checks for new versions on start-up. Note: if the user choses not to have this option selected they can manually check for new versions by clicking the URL on the Help | About VisualyseEPFD V3 dialog.
FAQ
This section contains answers to some of the frequently asked questions (FAQs).
7.2 What are the two Exclusion Zone Angles?
7.3 How to vary the exclusion zone size between Ku band and Ka?
7.4 How is the Worst Case Geometry Calculated?
7.5 How to Set Density and Distance?
7.6 How are Spot Beam Systems Modelled?
7.7 Can there be Longitude Variation in the PFD mask?
7.8 Can the PFD Mask vary by Ascending / Descending Planes?
What is the Alpha Angle?
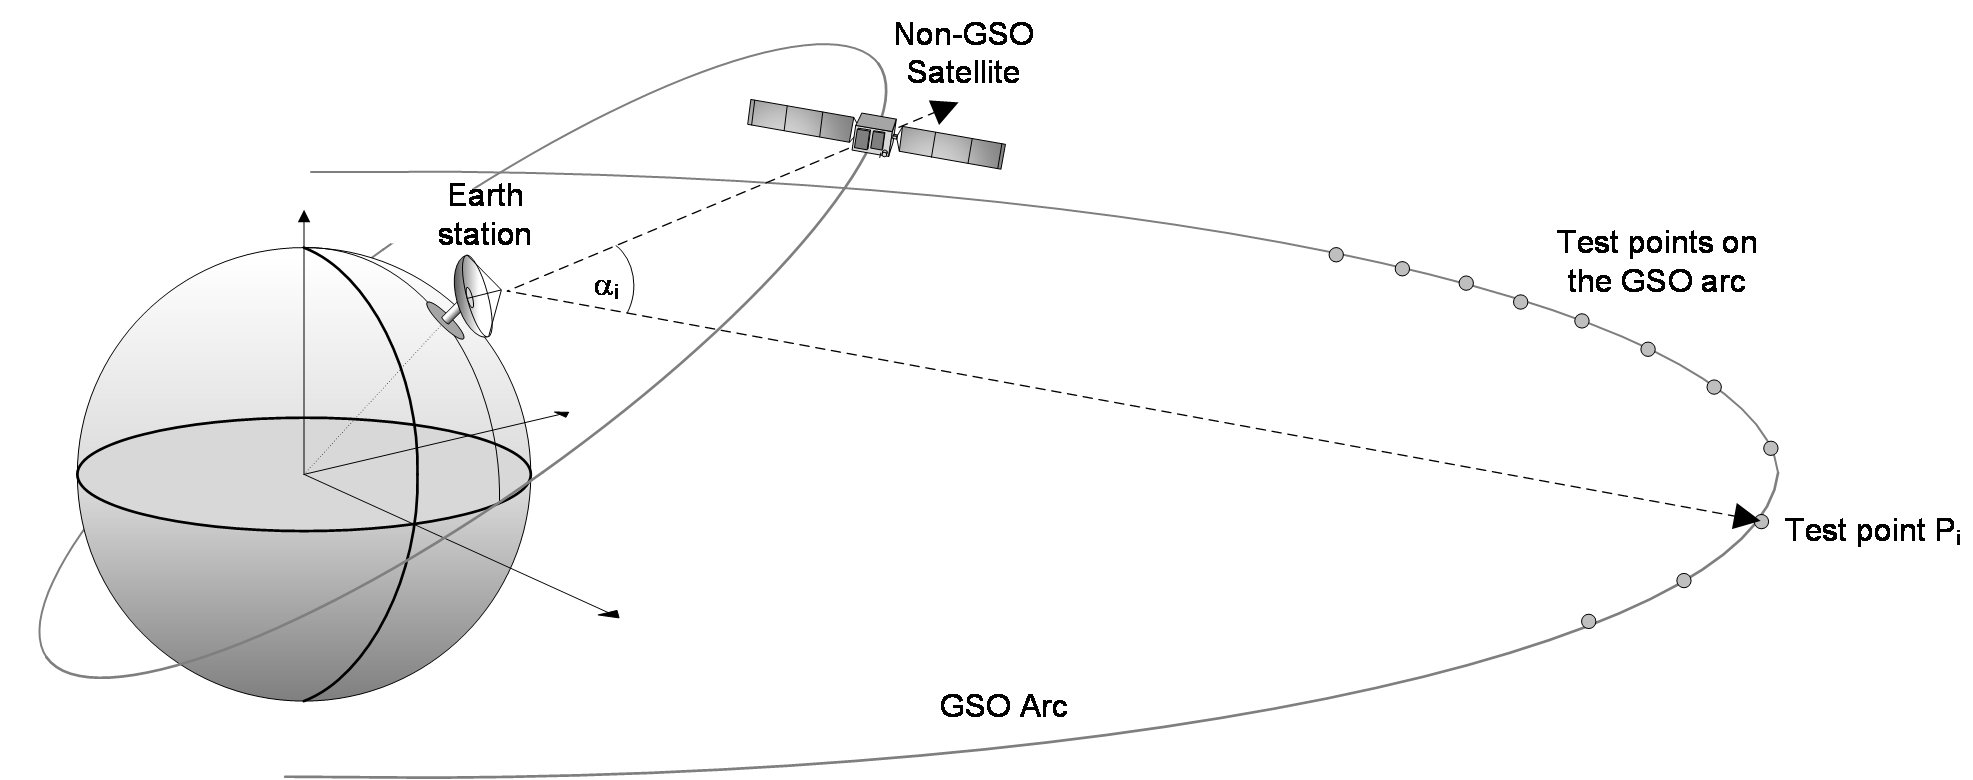
Key to understanding the algorithm in S.1503-2 is the alpha or angle. This is an angle calculated at the surface of the Earth, for example at an ES. Consider this point on the Earth’s surface and a set of test points Pi on the GSO arc: there will be lines:
Line a) from this point towards a non-GSO satellite
Line b) from this point towards one of the test points Pi on the GSO arc
There will then be an angle at the Earth’s surface between these two lines, described as one of the test alpha values, namely i.
The alpha angle is the minimum of these i over all test points, hence:
α = min{αi}
This is shown in the figure below:
At the Earth station the non-GSO satellite will appear to be either above (to the north of) or below (to the south of) the GSO arc. This will determine the sign, as in:
α > 0 if the non-GSO satellite is on the southern side of the GSO arc as seen by the ES

α < 0 if the non-GSO satellite is on the northern side of the GSO arc as seen by the ES

α = 0 if the non-GSO satellite is exactly in-line with some point on the GSO arc
The minimum at which the non-GSO satellite can transmit is defined as 0. This is an absolute value so the exclusion zone is defined as being when:
α0 < α < +α0What are the two Exclusion Zone Angles?
Note that two exclusion zones are defined in Recommendation ITU-R S.1503-2, namely:
| Parameter | Description |
|---|---|
| MIN_EXCLUDE | Exclusion zone angle (degrees), the minimum angle to the GSO arc at the non-GSO ES at which it will operate, defined either at the ES ( angle) or at the satellite (X angle) |
| ES_MIN_GSO | Minimum angle to GSO arc (degrees) at which the ES will transmit defined at the ES ( angle) |
These should be consistent which suggests it is better to use the α angle. MIN_EXCLUDE is specified in the EPFD(down) algorithm while ES_MIN_GSO for the EPFD(up) calculation, but they should be the same.
Note these are derived from the two Appendix 4 parameters:
A.4.b.7.d.2 if the zone is based on a topocentric angle or a satellite-based angle, the width of the zone, in degrees
A.14.b.5 the minimum separation angle between the geostationary-satellite orbit arc and the associated earth station main beam-axis at which the associated earth station can transmit towards a non-geostationary satellite
How to vary the exclusion zone size between Ku band and Ka?
The database format permits a single value of fields such as the exclusion zone size but for an operational system this could be different between Ku band and Ka band.
The recommended approach is to create two separate databases, one for Ku band and another for Ka band and run them separately. They should have all other fields identical (e.g. the satellite constellation’s orbit and phase tables).
How is the Worst Case Geometry Calculated?
The worst case geometry (WCG) uses the inputs to calculate the positions of the GSO satellite and ES that would cause the highest single entry EPFD level. If there are multiple geometries that give the same single entry EPFD level, then an assessment is done of which would occur most often by considering what is the angular momentum of the non-GSO satellite as it moves through the in-line geometry point. In cases where that is not available, the lowest elevation angle is used as that is likely to give a similar result.
The algorithm varies on direction (down, up or intersatellite) and can also vary depending upon whether the orbit repeats or is non-repeating and the type of orbit (equatorial or inclined).
For the EPFD(down) case the algorithm iterates over the PFD masks, the latitude of the non-GSO satellite and the (θ, Φ) angles as described in Section 6.3.
How to Set Density and Distance?
Two of the critical parameters for the EPFD(up) analysis are the non-GSO system’s density and distance fields. These are defined in Appendix 4 as:
A.4.b.7.b: the average number of associated earth stations with overlapping frequencies per square kilometre within a cell
A.4.b.7.c: the average distance, in kilometres, between co-frequency cells
These are used to create a deployment of non-GSO ES to use in the EPFD analysis.
The average distance is that between the centres of two co-frequency cells or beams, taking into account the frequency re-use between beams. If a system is using CDMA, so that all beams could be on the same frequency, then it is the average distance between adjacent beam centres. However if FDMA or TDMA/FDMA is used then there are likely to be beams between two co-frequency beams.
The access method should also be used to set the density taking into account the average distance between co-frequency cells. In particular, these two fields are used to calculate the number of co-frequency co-located non-GSO ES that can transmit simultaneously using:
NUM_ES = ES_DISTANCE * ES_DISTANCE * ES_DENSITY
If a non-GSO system is using TDMA or FDMA then only one of its ES will be transmitting at the same location and hence the density can be derived from the distance using:
ES_DENSITY = 1 / (ES_DISTANCE * ES_DISTANCE)
However if CDMA is being used so that there could be NCDMA non-GSO ES active co-frequency co-located at the same time then the density is:
ES_DENSITY = NCDMA / (ES_DISTANCE * ES_DISTANCE)
The NUM_ES is then used to adjust the non-GSO system ES EIRP mask to take account of there being potentially being multiple simultaneously active ES as in:
REP_e.i.r.p. = ES_e.i.r.p. + 10log10(NUM_ES)
Note that the density field is typically much less than 1 and SpaceCap V7 is required to enter this field (earlier versions required an integer).
How are Spot Beam Systems Modelled?
The algorithm in Recommendation ITU-R S.1503-2 was designed to handle a wide variety of non-GSO FSS system designs, including both those with fixed beam pointing and also those with steerable spot beams. This section gives more information about the modelling of steerable spot beam systems for the EPFD(down) direction
The PFD mask is the envelope of the maximum PFD in any direction, defined either by (azimuth, elevation) or (α, Δlong). This PFD will be greatest for locations where there is a traffic hot spot, as this will require the maximum possible number of spot beams to be pointed in that direction.
However this hot spot, and hence maximum PFD, could occur at in any direction and hence the mask could contain the maximum PFD in all pointing directions simultaneously. This is not physically feasible but is acceptable – indeed likely – for masks provided as input to the algorithm in Rec. S1503-2.
The reason this is acceptable is how the mask is used within S.1503-2. In particular, it is noted that there is a single reference GSO system, comprising a satellite and ES, located at positions fixed for the duration of the run. These locations are will have been calculated using the worst case geometry (WCG) algorithm.
Therefore, only one part of the PFD mask is used at each time step for each satellite. There is no over-representation of the actual emissions of the satellite as the other parts of the PFD mask are not used.
In addition, the non-GSO FSS system will have constraints that limit its ability to provide service from more than a specified number of satellites simultaneously due to intra-system interference constraints. This is modelling using the following field:
A.4.b.7.a the maximum number of non-geostationary satellites receiving simultaneously with overlapping frequencies from the associated earth stations within a given cell
This Nco[Latitude] field is used to ensure that only a set number of non-GSO satellites are considered active so that the aggregate EPFD is not the sum of all visible satellites. Rather it is a sum of:
- Of those satellites outside the exclusion zone and above the minimum elevation angle, the Nco[Latitude] satellites which have the largest single entry EPFD values
- Those satellites inside the exclusion zone
Can there be Longitude Variation in the PFD mask?
It is likely that the PFD generated by a satellite will vary as it moves geographically. For example, there is likely to be higher PFD values when the satellite is over traffic hot-spots and lower when over low traffic areas such as the major oceans.
Note, however, that there is no identification any part of the algorithm in S.1503-2 or the PFD mask as to actual geographic regions, whether specified by longitudes, country borders or ITU-R Regions.
The PFD mask should be calculated and provided for the traffic hot-spot as this is the case that determines whether the EPFD thresholds are met or not. As noted in the section above on modelling spot beam systems, the analysis is undertaken for the highest traffic location taking into account re-use constraints within the non-GSO system.
The PFD mask can vary by latitude, and the mask should give the highest PFD for each angle (such as azimuth and elevation) for that latitude over all longitudes over the constellation’s lifetime.
Can the PFD Mask vary by Ascending / Descending Planes?
For polar orbiting non-GSO FSS systems, there can be a difference in orientation in the satellites between when the satellite is ascending or descending. This orientation could have an implication on the resulting PFD mask.
However the coordinate system in Rec. ITU-R S.1503-2 is north-orientated and there is no option to specify a different mask for ascending / descending directions.
The mask filed should be an envelope and hence the largest value over both ascending and descending directions should be used.
Note that S.1503-2 defines the angles as follows:
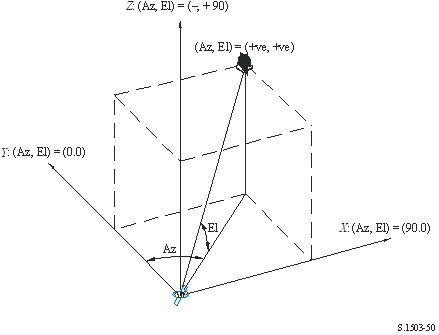
It should be noted that direction of the cartesian X, Y, Z vectors in this diagram are:
X: +ve in the East direction from the non-GSO satellite
Y: towards the centre of the Earth from the non-GSO satellite
Z: +ve towards the North direction from the non-GSO satellite.
Acronyms and Abbreviations
| Name | Description |
|---|---|
| BR | Radiocommunications Bureau |
| BSS | Broadcast Satellite Service |
| CDF | Cumulative Distribution Function |
| CPU | Central Processing Unit |
| DB | Database |
| DLL | Dynamic Link Library |
| EIRP | Equivalent Isotropic Radiated Power |
| EPFD | Equivalent Power Flux Density |
| FAQ | Frequently Asked Questions |
| FSS | Fixed Satellite Service |
| GIBC | Graphical Interface for Batch Calculations |
| GSO | Geostationary Orbit |
| GUI | Graphical User Interface |
| IS | Inter-satellite |
| ITU | International Telecommunications Union |
| LES | Large Earth Station |
| PFD | Power Flux Density |
| RR | Radio Regulations |
| RTF | Rich Text Format |
| SRS | Space Radiocommunication Stations |
| WCG | Worst Case Geometry |
| WP | Working Party |
Visualyse EPFD V3 Maintenance History
This document describes the changes that have been made to Visualyse EPFD V3 for each maintenance release.
Release 3.9.2.2 (October 2025)
The following changes have been made to the software:
- Fix possible issue in Resolution 770 uplink.
Release 3.9.2.1 (September 2025)
The following changes have been made to the software:
- Fix redraw issues with the Run Schedule header after creating a new run.
- Fix Tree Ctrl issues expanding/collapsing the tree nodes.
Release 3.9.2.0 (August 2025)
The following changes have been made to the software:
- Add new licencing options.
- Add menu option Show Calculations for Contributing Satellites for DOWN runs.
- Reduce flicker on TreeCtrl when updating.
- Fix run-state issue when all runs have completed.
- Visualyse EPFD no longer runs on Windows 7
Release 3.9.1.0 (December 2024)
The following changes have been made to the software:
- Warn that SRS v10 databases aren’t (currently) supported.
- Add notification when running in Demo Mode to inform user that demo / example masks are used.
- Fix possible issue when running on constrained hardware.
Release 3.9.0.0 (April 2024)
The following changes have been made to the software:
- Revise Resolution 770 implementation following WRC-23 and approval of Recommendation ITU-R S.2157.
- Add entry in Help menu for new online User Guide
Release 3.8.7.0 (March 2024)
The following changes have been made to the software:
- Fix possible issue calculating IS WCG.
Release 3.8.6.0 (February 2024)
The following changes have been made to the software:
- Fix possible issue with losing connection to DK2 Network Server when PC goes to sleep.
- Handle DK2 HID devices.
- Fix registry/Application ID issue.
Release 3.8.5.0 (July 2023)
The following changes have been made to the software:
- Fix possible dialog display issue on low DPI displays.
- Update installed DK2 DLL.
It is recommended all users install the latest DK2 device drivers (V8.22.26) from https://www.transfinite.com/content/dongledriverinstall_V8_22_26
Release 3.8.4.0 (April 2023)
The following changes have been made to the software:
- Fix possible Alpha Table: Continue to Track issue.
Release 3.8.3.0 (March 2023)
The following changes have been made to the software:
- Fix memory issue with certain setups (large application memory usage / .EPFD files being larger than expected).
- Fix possible Toolbar icon redraw issue on low DPI displays.
Release 3.8.2.0 (March 2023)
The following changes have been made to the software:
- Add new Setting: "Show Update Dialog at Startup" so user can be informed of new version via Notifications only.
- Add Notification for possible screen resolution issues.
- Fix possible issues refreshing Notification List.
Release 3.8.1.0 (November 2022)
The following changes have been made to the software:
-
Add an initial implementation of a time step option to derive long-term statistics. This is enabled in the Additional Settings dialog.
-
Fix issue with --timeStepCalculation and --analyticalAlpha command line options not being passed correctly to the application.
-
Fix issue with Res 770 Report Dialog output.
-
Don’t render map objects when running in non-interactive mode.
It is recommended all users install the latest DK2 device drivers (V8.20.21) from https://www.transfinite.com/content/dongledriverinstall
Release 3.8.0.0 (November 2022)
The following changes have been made to the software:
- Add initial implementation of Alpha Table as per document 4A/653-E. Note: this is enabled in the new Additional Settings dialog as described in Section 6.3.5 of the User Guide.
Release 3.7.2.0 (July 2022)
The following changes have been made to the software:
- Fix possible issue with minimum value used on Graph Y-Axis.
Release 3.7.1.0 (July 2022)
The following changes have been made to the software:
- Add a search bar to the Application Title bar. This allows users to search the menu options.
- Add a notification icon to the Application Title Bar. This displays a badge with the number of notifications. Clicking displays the Notifications View. At present this is used to display general application information (new software updates, DK2 driver updates etc).
- Implemented Windows 11 Snap Layout. When the program is running on Windows 11 and the maximize/restore caption button is hovered, the layout popup menu will appear near this button.
- Update installed DK2 DLL.
Release 3.7.0.0 (July 2022)
The following changes have been made to the software:
-
Add ability to start the software from command line (note: currently in this mode there is no U.I just a simple interface like the S1503 software)
Allowed options:--help produce help message
--resultsDB arg location of results database
--srsDB arg location of SRS database
--masksDB arg location of masks database
--ntc_id arg ntc_id
--limitedRuns arg only examine specified runs
--timeStepCalculation arg (=0) Normal (0), TS1 (1), TS2 (2)
--analyticalAlpha arg (=0) use analytical alpha calculation
--fixedWCGUp arg fix UP WCG (ES Lat, ES Lon, GSO Lon)
--fixedWCGDown arg fix DOWN WCG (ES Lat, ES Lon, GSO Lon)
--fixedWCGIS arg fix IS WCG (ES Lat, ES Lon, GSO Lon)
--numHardwareThreads arg number of hardware threads
Release 3.6.3.0 (April 2022)
The following changes have been made to the software:
- Improve error message when no satellite EIRP mask found.
Release 3.6.2.0 (March 2022)
The following changes have been made to the software:
- Fix issue when calculating Worst Case Geometry in IS case for some systems.
- Make sure alpha angle is visible on Map View even if PFD mask is not using alpha format.
Release 3.6.1.0 (January 2022)
The following changes have been made to the software:
- Improve scaling of UI components for Windows 10/11 scale factors of 125%, 175%, 225%.
Release 3.6.0.4 (October 2021)
The following changes have been made to the software:
- Add initial beta RES 770 implementation as per https://www.itu.int/md/R19-WP4A-C-0509/en
Release 3.5.3 (August 2021)
The following changes have been made to the software:
-
Install latest DK2 DLL.
-
Display DK2 driver version on About dialog.
It is recommended all users install the latest DK2 device drivers (V8.19.7) from https://www.transfinite.com/content/dongledriverinstall
Release 3.5.2 (May 2021)
The following changes have been made to the software:
- Fix possible issue with Application Settings dialog not saving results/limits DB location correctly.
- Resolve font issue on Debug dialog.
Release 3.5.1 (April 2021)
The following changes have been made to the software:
- Install newer DK2 DLL.
Release 3.5.0 (March 2021)
The following changes have been made to the software:
- Improve UI for creating new runs (see User Guide for more details).
- Output more parameters to the Report.
- Save more information to the .EPFD file.
- Ensure DB call is made on document close.
- Fix possible issue when UI thread processes an update message when UP run selected.
Release 3.4.0 (January 2021)
The following changes have been made to the software:
- Initial work for a x64 ## Release.
Release 3.3.2 (July 2020)
The following changes have been made to the software:
- Resolve font size issue with Report Dialog.
- Fixed problem with squashed header on Run Schedule in high DPI.
- Ensure all dialogs use the same system font.
- Scale graph lines/markers better when using high DPI.
- Add Application Settings Dialog option for “Maximum number of non-GSO Earth Stations for Link Status display”
Release 3.3.1 (May 2020)
The following changes have been made to the software:
- Fix issue toggling Run Schedule from Menu.
- Add registry setting to handle case where memory usage is too high when creating UP runs with lots of Earth Stations.
Release 3.3.0 (January 2020)
The following changes have been made to the software:
- Improve display of dialogs when using Windows 7.
Release 3.2.8 (November 2019)
The following changes have been made to the software:
- Improve cursors when using high DPI displays.
- Add “Check for Updates” to the “About VisualyseEPFD” dialog.
- Add setting to control checking for updates at start-up.
- Improve installer icons for high DPI displays.
Release 3.2.7 (August 2019)
The following changes have been made to the software:
- Improve X-Axis auto scaling on the CDF Graph View.
Release 3.2.6 (May 2019)
The following changes have been made to the software:
- Resolve Status Bar display issues on high DPI displays.
- Add a “Close” button to the toolbar.
- Performance improvements.
Release 3.2.5 (February 2019)
The following changes have been made to the software:
- Allow the user to select the Masks database to use on the New Run Definition dialog.
Release 3.2.4 (February 2019)
The following changes have been made to the software:
- Fix potential issue with Art 9.7B database query.
Release 3.2.3 (January 2019)
The following changes have been made to the software:
- Improve UI performance when all EPFD runs have completed.
- Allow Edit | Copy to be performed on the Map View.
- Add extra error handling when performing an Art 9.7B database query.
Release 3.2.2 (January 2019)
The following changes have been made to the software:
- Performance improvements.
- Ensure ‘sw_version’ and ‘name’ are always written to ‘result_def’ table.
- Make application Large Address Aware to better handle case where UP run generates a large number of Earth Stations.
Release 3.2.1 (September 2018)
The following changes have been made to the software:
- Improve handling of case where EPFD Limit has two percentages for the same EPFD value.
Release 3.2.0 (June 2018)
The following changes have been made to the software:
- New User Interface to improve display on high DPI screens.
- Add “Analytical Alpha” calculation setting
- Performance improvements
Release 3.1.9.6 (March 2018)
The following changes have been made to the software:
- Handle inclinations greater than 90 degrees in WCG calculation.
- Ensure precession read as Degrees/Day not Degrees/Sec and revise test database.
Release 3.1.9.5 (January 2018)
The following changes have been made to the software:
- Fix issues running Visualyse EPFD V3 in certain locales.
Release 3.1.9.4 (November 2017)
The following changes have been made to the software:
- Fix handling of APERR_019V01 (RR22_5C_12) gain pattern.
- Improve logging for refbw_khz.
- Handle error conditions for numEarthStationsInCell for SpecificES better.
- Improve display of relative gain on Map View,
- Limit number of DPs considered in CheckCase in WCG calculation to enable easier comparison with other implementations.
Release 3.1.9.3 (November 2017)
The following changes have been made to the software:
- Add a “PDF” table to the results database.
- Improve handling of error conditions.
Release 3.1.9.2 (October 2017)
The following changes have been made to the software:
- Handle scenario where user running software is not the user that installed the software.
- Ensure alpha/X calculation uses correct resolution in WCG edge cases.
- Improve WCG calculation performance
- Handle DK2 dongle issues.
Release 3.1.9.1 (August 2017)
The following changes have been made to the software:
- Performance improvements
- Fix map scrolling issue.
- Fix issue with WCG Down calculation for certain input parameters.
Release 3.1.9.0 (July 2017)
The following changes have been made to the software:
- Performance improvements
- In some rare scenarios, the UP run creation can fail to create all the required earth stations.
Release 3.1.8.1 (January 2017)
The following changes have been made to the software:
- If you enter user entered WCG then there should be a check for visibility as per the revised WCG.
- Don't display time left to complete runs when none running.
- Only count active runs for time left.
- Rename fast up/down setting.
- Use transparent icons for Time Settings dialog.
Release 3.1.8.0 (November 2016)
The following changes have been made to the software:
- Fix issue in UP run calculation following Rec. clarification.
- Change alpha calculation so it is easier to compare with other implementation of S.1503.
- Fix dialog display issues when using a timed dongle.
- Apply changes to WCG Down calculation following Rec. fixes.
- Add Fast Up/Down setting to utilise more threads per run.
- Fix error in calculation of “Estimated time to finish all runs”.
- Add menu option to access “Error Log”.
- Trap misuse of Specific ES.
Release 3.1.7.2 (November 2016)
The following changes have been made to the software:
- Output better error messages when PFD masks are missing.
- Better handle scenarios where no Down runs are created/required.
Release 3.1.7.1 (July 2016)
The following changes have been made to the software:
- Improve error handling when incorrect Masks database is selected.
Release 3.1.7.0 (June 2016)
The following changes have been made to the software:
- New optimisation settings (which are detailed in section 6.4 of the User Guide).
- Improved Graph View.
Release 3.1.6.8 (June 2016)
The following changes have been made to the software:
- Archive error log file if it gets too big.
- Fix typos in error strings.
- Use correct names for Article 22, 9.7A, 9.7B in New Run Definition dialog.
- Select first system (if present) in New Run Definition dialog.
Release 3.1.6.7 (June 2016)
The following changes have been made to the software:
- Improve 9.7A/B error handling.
Release 3.1.6.6 (May 2016)
The following changes have been made to the software:
- Use ellipsis when text is too long for progress dialog.
- Handle 9.7A errors better.
- Show WCG progress on run creation.
Release 3.1.6.5 (April 2016)
The following changes have been made to the software:
- Correct issue in WCG UP calculation for Specific Earth Station (Repeating).
- Performance improvement for Down/IS runs.
- Don’t inform user of new ## Release of software if no dongle present.
- Improve error handling for 9.7A/B checks.
- Use correct document title for 9.7A/B checks.
- Handle errors better when creating run / improve error logging.
- Fix issue when changing WCG locations for UP runs that have already been run and rewound.
Release 3.1.6.4 (April 2016)
The following changes have been made to the software:
- Correct issue in WCG DOWN calculation for some Networks.
- Revise WCG UP calculation so it handles multiple masks consistently.
- Improve error logging.
Release 3.1.6.3 (April 2016)
The following changes have been made to the software:
- Fix Map View issues that can cause the software to crash.
- Add “Name” to display parameters. Remove unused “Log to File”.
- Graph Data not showing failing values correctly.
- Read ref_bw_khz from masks (default to 40 kHz) and apply bandwidth correction as applicable.
- Fix divide by zero error when interpolating EPFD limits for graph data.
- Revise WCG calculation so it handles scenario when network has multiple orbit parameters.
- If can’t calculate IS WCG then log error and default to 0,0,0.
- Correct issue in WCG calculation for Specific ES Repeating orbit.
- Catch exception and log when issue extracting mask data from DB.
- Ensure phase table data is read in correct order.
Release 3.1.6.2 (March 2016)
The following changes have been made to the software:
- Don’t force update after “OK” on GSO System Settings dialog when the run has started.
- Improve estimation of time to finish all runs.
- Fix crash on map zoom.
- Use worst not current timestep on the Debug Dialog.
- Add ability to turn on/off map UI elements (L-Button double click on Map View to invoke dialog).
- Fix issue with drag/drop opening files.
- Add mouse wheel support to map and report/debug dialogs.
- Documentation links on Help menu don’t work correctly.
Release 3.1.6.1 (March 2016)
The following changes have been made to the software:
- Improve UP run performance.
- Check for all lats using same mask in WCG UP calculation.
- Catch masks being empty when creating UP runs.
- Ensure lat_fr < lat_to in sat_oper data.
- Don’t store LinkStatus data when large number of links.
Release 3.1.6.0 (March 2016)
The following changes have been made to the software:
- Ensure f_x_zone, f_precess,f_stn_keep strings are converted to UPPER CASE before checking value.
- Order runs by frequency/antenna size.
- Stop using as many CPU cycles when not running any runs.
- Add handling for special case (earthStationSeparation == 0 && earthStationDensity == 1)
- MinElevationAngle should only consider valid (non-NULL) values.
- Handle floating point rounding when checking satellite is above the minimum.
- Handle case where worst bin is < -9999.
- If freqToUse is not in valid range for filing then don't create run.
- Wire up restart manager/Fixed double check on .EPFD file not working.
- Fix issue with ITU-R S.1428-1.
- Resolve WCG calculation issues with Specific ES UP runs for non-repeating orbits.
Release 3.1.5.2 (January 2016)
The following changes have been made to the software:
- Warn if EIRP/PFD masks have duplicate entries.
Release 3.1.5.1 (January 2016)
The following changes have been made to the software:
- Fix issue with WCG UP calculation.
- Crash when attempting to transition to PAUSE from NON-INTERACTIVE.
Release 3.1.5 (January 2016)
The following changes have been made to the software:
- Add “Debug” dialog.
- Allow user to set fixed latitude step value for WCG Down calculation.
Release 3.1.4.1 (November 2015)
The following changes have been made to the software:
- Use local round() function to improve performance.
- Prevent divide by 0 when updating progress.
- Update CDF in database as run progresses.
- Improve WCG dialog feedback.
Release 3.1.4 (November 2015)
The following changes have been made to the software:
- Revise WCG calculation for multiple masks.
- By default calculation alpha/x with sign.
- Improve statistics performance.
Release 3.1.3 (November 2015)
The following changes have been made to the software:
- If no data in “freq” table then use old calculation method.
- Only use latitude dependent limits if 22-1A (FSS) or 22-1D (BSS).
- Don’t crash if can’t find recent file in MRU list.
- Improve dialog feedback.
Release 3.1.2 (October 2015)
The following changes have been made to the software:
- Improve WCG performance.
- Query freq table for data.
- Don’t expect a minimum of three masks.
Release 3.1.1 (October 2015)
The following changes have been made to the software:
- Ensure code matches APL not Rec.
- Handle very large number of timesteps.
- Use data in sat_oper table when calculating WCG Down.
- Improve error messages.
- Don’t use APL (performance issues).
Release 3.1.0 (October 2015)
The following changes have been made to the software:
- PFD / EIRP mask can vary between satellites.
- Satellite / ES EIRP masks vary by latitude.
- Use new algorithm for deployment of ES by density.
- Handle equatorial non-GSO orbits.
- Change to the time step / run duration calculations.
- New WCG algorithms.
Release 3.0.5 (July 2015)
The following changes have been made to the software:
- Handle multiple EIRP/PFD masks.
Release 3.0.4 (July 2015)
The following changes have been made to the software:
- Handle latitude dependant EIRP masks.
Release 3.0.3 (Jan 2015)
The following changes have been made to the software:
- Ensure WCG calculation handles masks correctly when only one latitude.
- Ensure when WCG fails that default is setup correctly.
Release 3.0.2 (Jan 2015)
The following changes have been made to the software:
- Ensure X-Angle calculation is as per Recommendation.
Release 3.0.1 (Dec 2014)
The following changes have been made to the software:
- The application can crash after changing the GSO System Settings.
- Ensure the map view updates correctly following any changes to the GSO location.
- Handle errors when user specifies database that doesn’t exist or can’t be opened.
Release 3.0.0 (Nov 2014)
The following changes have been made to the software:
- Improve calculation performance.
- Integrate new orbit code that been rewritten to be based (as closely as possible) on the equations and approach used in the Rec
- Change the location of the Earth Stations for the UP scenario so that they align on a grid to the GSO ES
- Fix issue where the rounding for the statistics bins was incorrect.
- Ensure application doesn’t crash when running without a valid dongle.
- Remove Windows XP support.
- Allow use of multiple hardware threads.
Release 2.9.0 (Oct 2014)
The following changes have been made to the software:
- Ensure application doesn’t crash when running without a valid dongle.
- Improve performance.
Release 2.8.0 (Oct 2013)
The following changes have been made to the software:
- Further performance improvements.
Release 2.7.0 (March 2013)
The following changes have been made to the software:
- Further performance improvements.
Release 2.6.0 (May 2012)
The following changes have been made to the software:
- Performance improvements.
Release 2.5.0 (May 2012)
The following changes have been made to the software:
- Add an Applications Settings dialog to allow fixing of the worst case geometry.
- Add a Reset All Runs button to the toolbar.
Release 2.4.0 (May 2012)
The following changes have been made to the software:
- If no limits are found for a frequency pair then carry on and don’t display any error dialog.
- Ensure that runs that have completed and reset don’t run slower than expected.
Release 2.3.0 (May 2012)
The following changes have been made to the software:
- Ensure the correct dongle checks are run.
Release 2.2.0 (May 2012)
The following changes have been made to the software:
- Ensure database locations are saved to the registry.
- Correctly handle changes to GSO position for Article 22 UP runs.
Release 2.1.0 (April 2012)
The following changes have been made to the software:
- Saved files can fail to load correctly.
- Correct Article 9.7A/B runs generation.
Release 2.0.0 (February 2012)
This was the first release of the software. Previous releases were for internal testing only.